
School shade rules and outdoor living keep shelter demand up
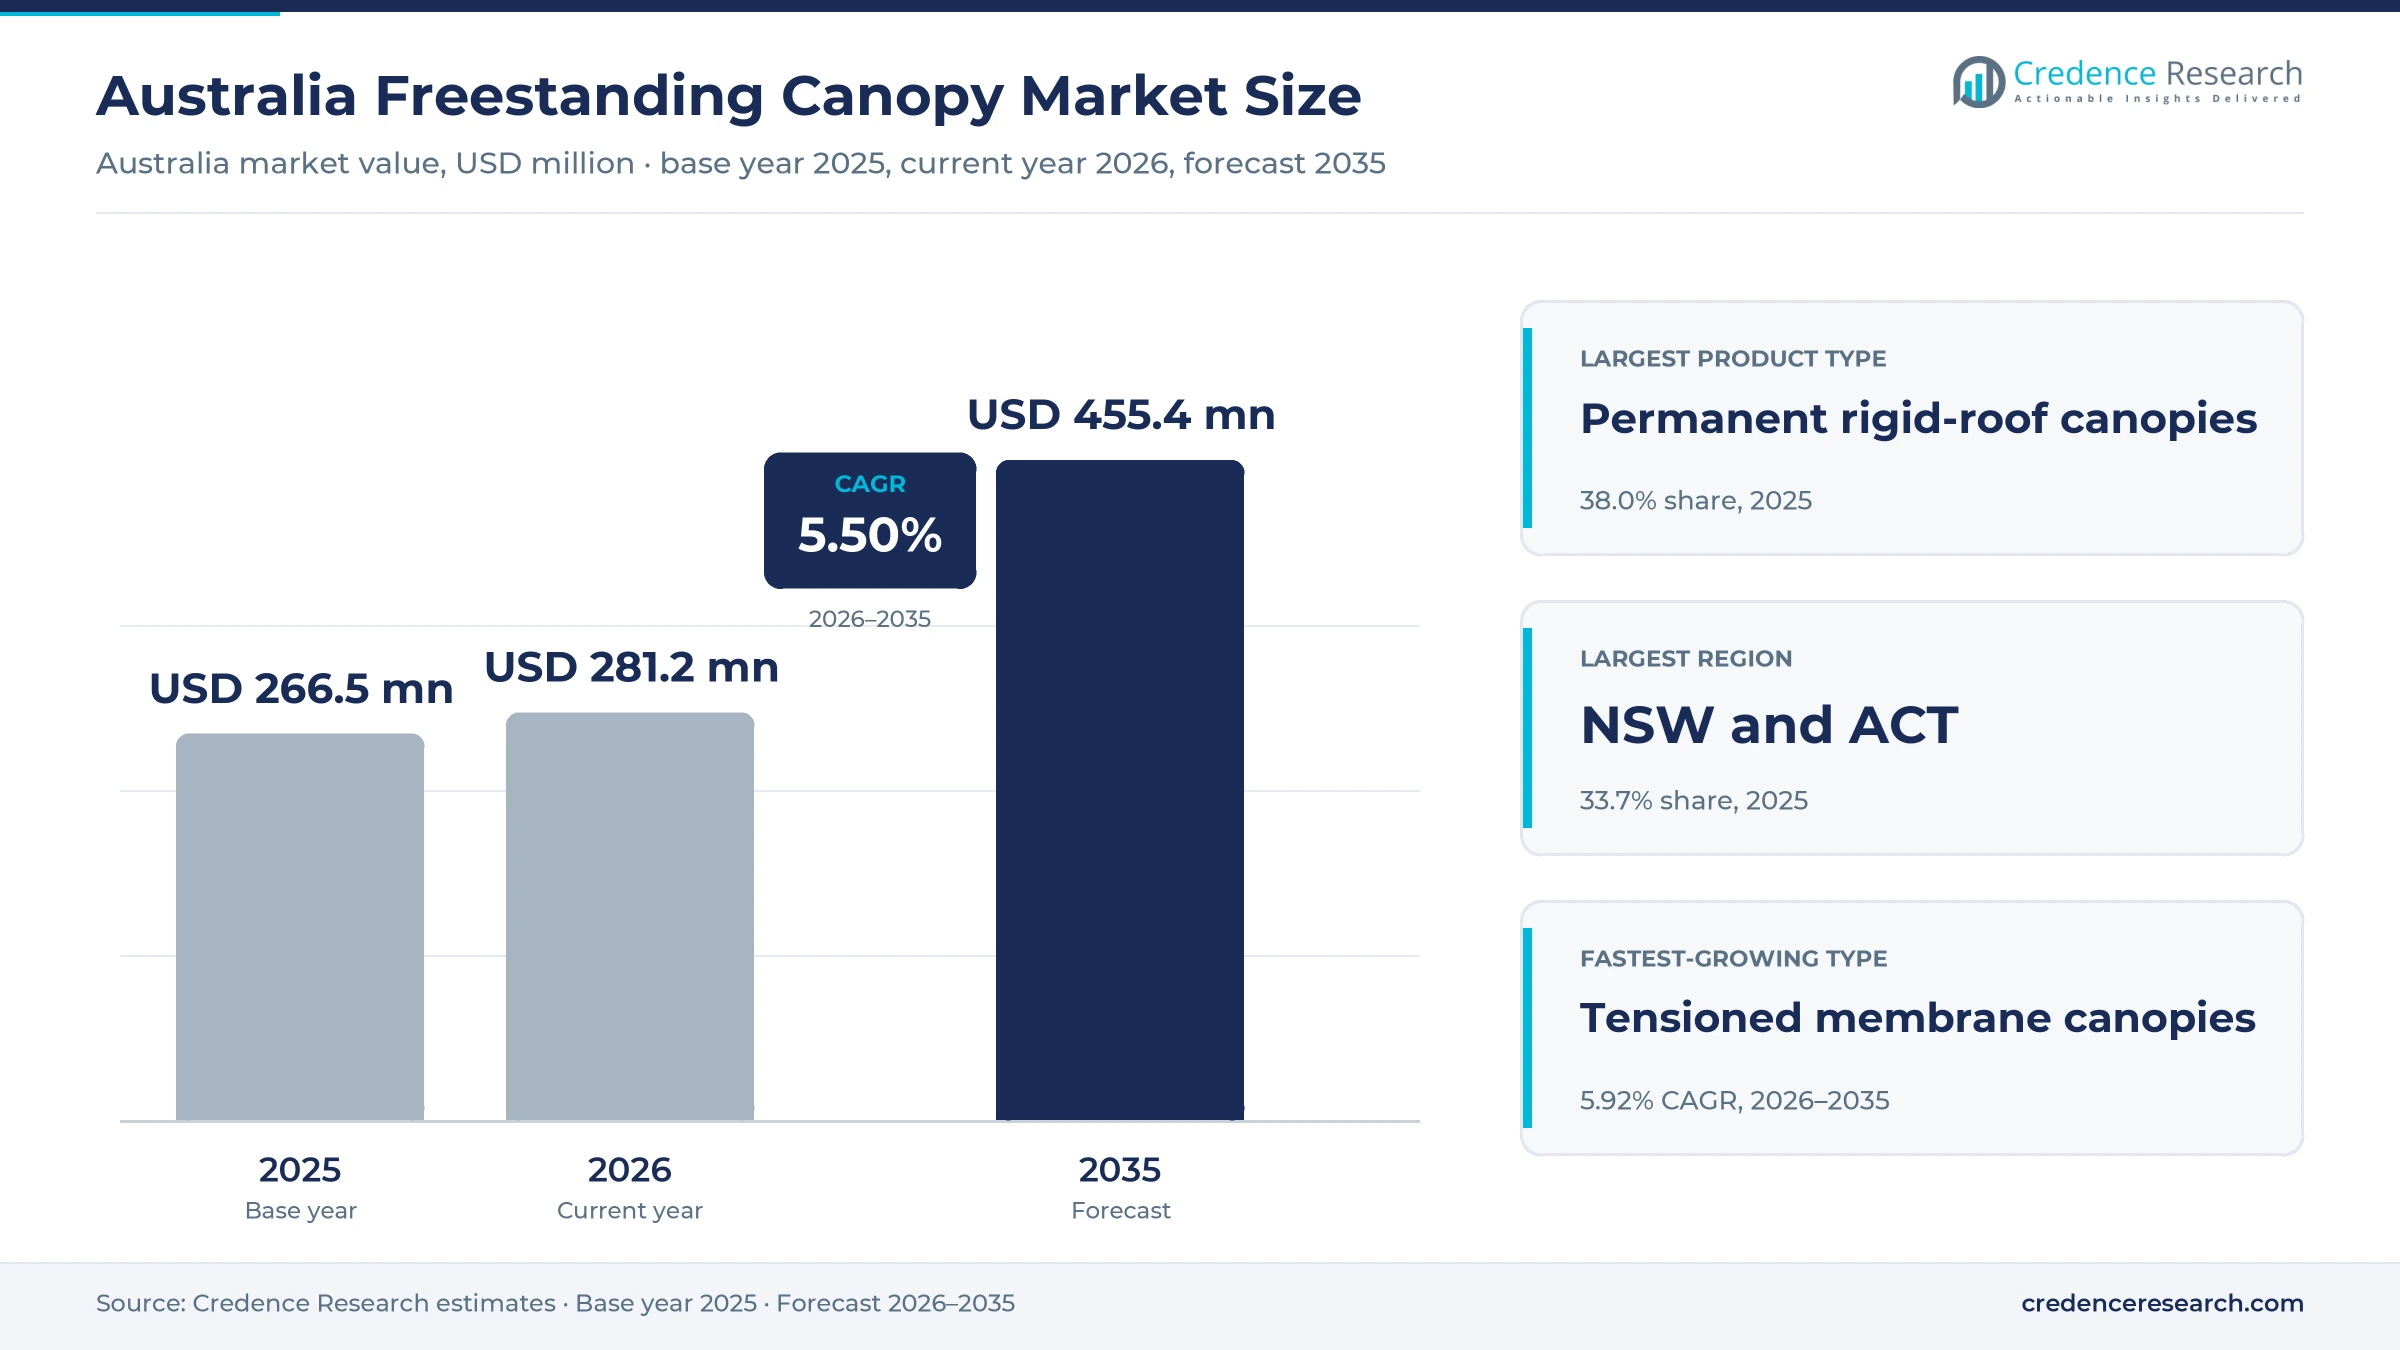
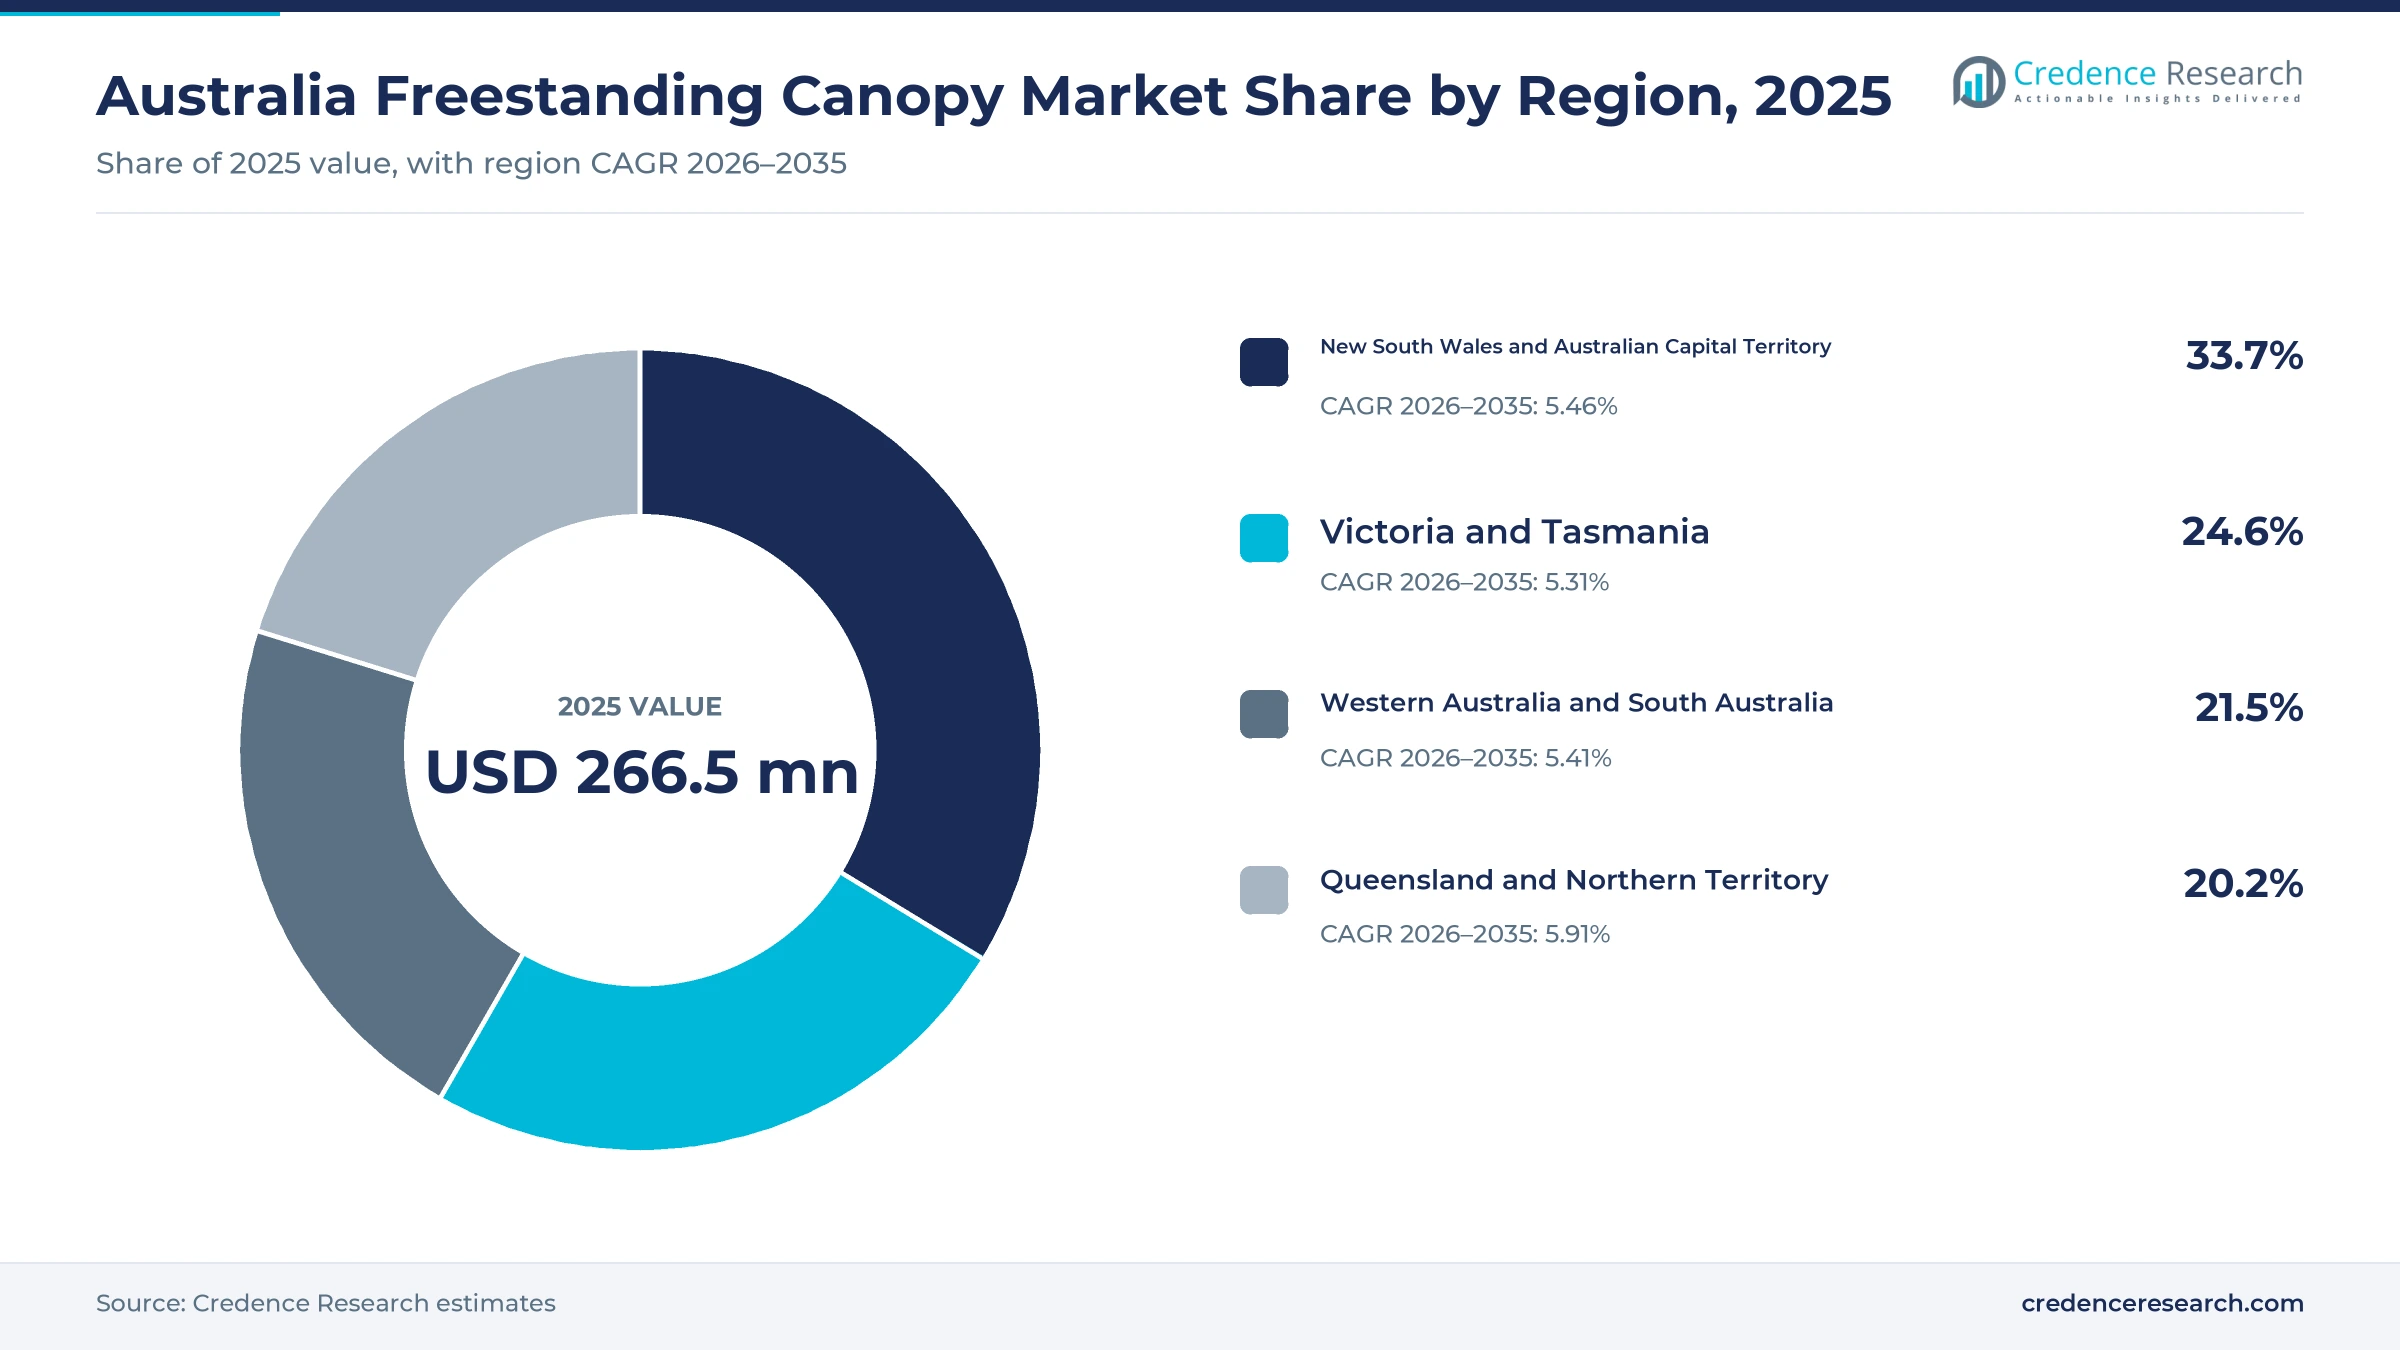
The Australia freestanding canopy market was valued at USD 266.5 million in 2025 and is projected to increase from USD 281.2 million in 2026 to USD 455.4 million by 2035, registering a CAGR of 5.50% during 2026–2035. Demand comes from households that extend outdoor living areas, schools that shade play and learning spaces, councils that cover playgrounds and parks, and businesses that shelter customers and stock. New South Wales and the Australian Capital Territory held the largest regional share, 33.7% in 2025, because the zone has the largest population and school estate. Queensland and the Northern Territory form the fastest-growing region at 5.91% a year, as councils add playground shade in hot, high-UV climates. In turn, buyers are moving toward engineered membrane structures with longer spans, certified footings and fabrics that block most ultraviolet radiation.
Which outdoor shelters count as freestanding canopies?
The estimate measures spending in Australia on permanent rigid-roof canopies, tensioned membrane canopies, freestanding commercial umbrellas and portable framed canopies that stand on their own posts or bases. It covers static, manually adjustable, motorised and solar-ready systems bought by households, schools, councils and businesses through suppliers, installers, retail stores and online sellers. Values are stated in USD million at current prices and exclude goods and services tax.
The estimate excludes awnings fixed to building walls, pergolas built as part of a house, carport roofs attached to dwellings and repair labor sold separately. The value chain runs from fabric, steel and aluminum suppliers through local fabricators, engineers and installers to homeowners, schools, councils and venue owners.
Australia Freestanding Canopy Market Insights
- The Australia freestanding canopy market was valued at USD 266.5 million in 2025 and is projected to reach USD 455.4 million by 2035, at a 5.50% CAGR during 2026–2035.
- New South Wales and the Australian Capital Territory held 33.7% of 2025 value, because the zone has the largest population and school estate.
- Permanent rigid-roof canopies led product types with 38.0% of 2025 value, as schools and homes favor all-weather cover.
- The Victorian School Shade Sails Fund reached 1,259 completed projects by January 2025, with grants of up to AUD 25,000 per campus.
- Tensioned membrane canopies grow fastest at 5.92% a year during 2026–2035, as councils and venues need wide spans over play and spectator areas.
Rigid roofs lead while membrane structures grow fastest
Why do rigid-roof shelters lead product demand?
Based on product type, the market is categorized into permanent rigid-roof canopies, tensioned membrane canopies, freestanding commercial umbrellas and portable framed canopies. Permanent rigid-roof canopies led with 38.0% of 2025 value, because schools and homes want cover from both sun and rain. Tensioned membrane canopies grow fastest at 5.92% a year, as councils and venues need wide spans over playgrounds and courts.
Which uses account for most shelter spending?
Based on application, the market is categorized into outdoor living protection, outdoor activity protection, vehicle and asset protection, and trading and gathering protection. Outdoor living protection led with 36.0% of 2025 value, because households extend usable living space into backyards. Outdoor activity protection grows fastest at 5.89% a year, as schools and councils shade play and sport.
Which buyers account for most purchases?
Based on end user, the market is categorized into household owners, institutional facility owners, councils and public land managers, and business and community operators. Household owners led with 38.0% of 2025 value, because many homes add shelters over patios, pools and parking. Institutional facility owners grow fastest at 5.86% a year, as school shade funds and policies drive new projects.
How do Australian buyers source shelters?
Based on distribution channel, the market is categorized into direct supplier sales, installer and dealer sales, physical retail sales and third-party online sales. Installer and dealer sales led with 36.0% of 2025 value, because most fixed shelters need site measurement and footings. Third-party online sales grow fastest at 6.48% a year, as households compare umbrellas and portable frames online.
| Segment Group | Leading Sub-segment | Share, 2025 | Fastest-growing Sub-segment | CAGR, 2026–2035 |
|---|---|---|---|---|
| By Product Type | Permanent rigid-roof canopies | 38.0% | Tensioned membrane canopies | 5.92% |
| By Application | Outdoor living protection | 36.0% | Outdoor activity protection | 5.89% |
| By End User | Household owners | 38.0% | Institutional facility owners | 5.86% |
| By Distribution Channel | Installer and dealer sales | 36.0% | Third-party online sales | 6.48% |
Request a Free Sample
Fill in your details and we'll send you a free sample report.
- Sample data tables & charts
- Research methodology
School shade, backyard spending and council works lift sales
How does school shade compliance lift procurement?
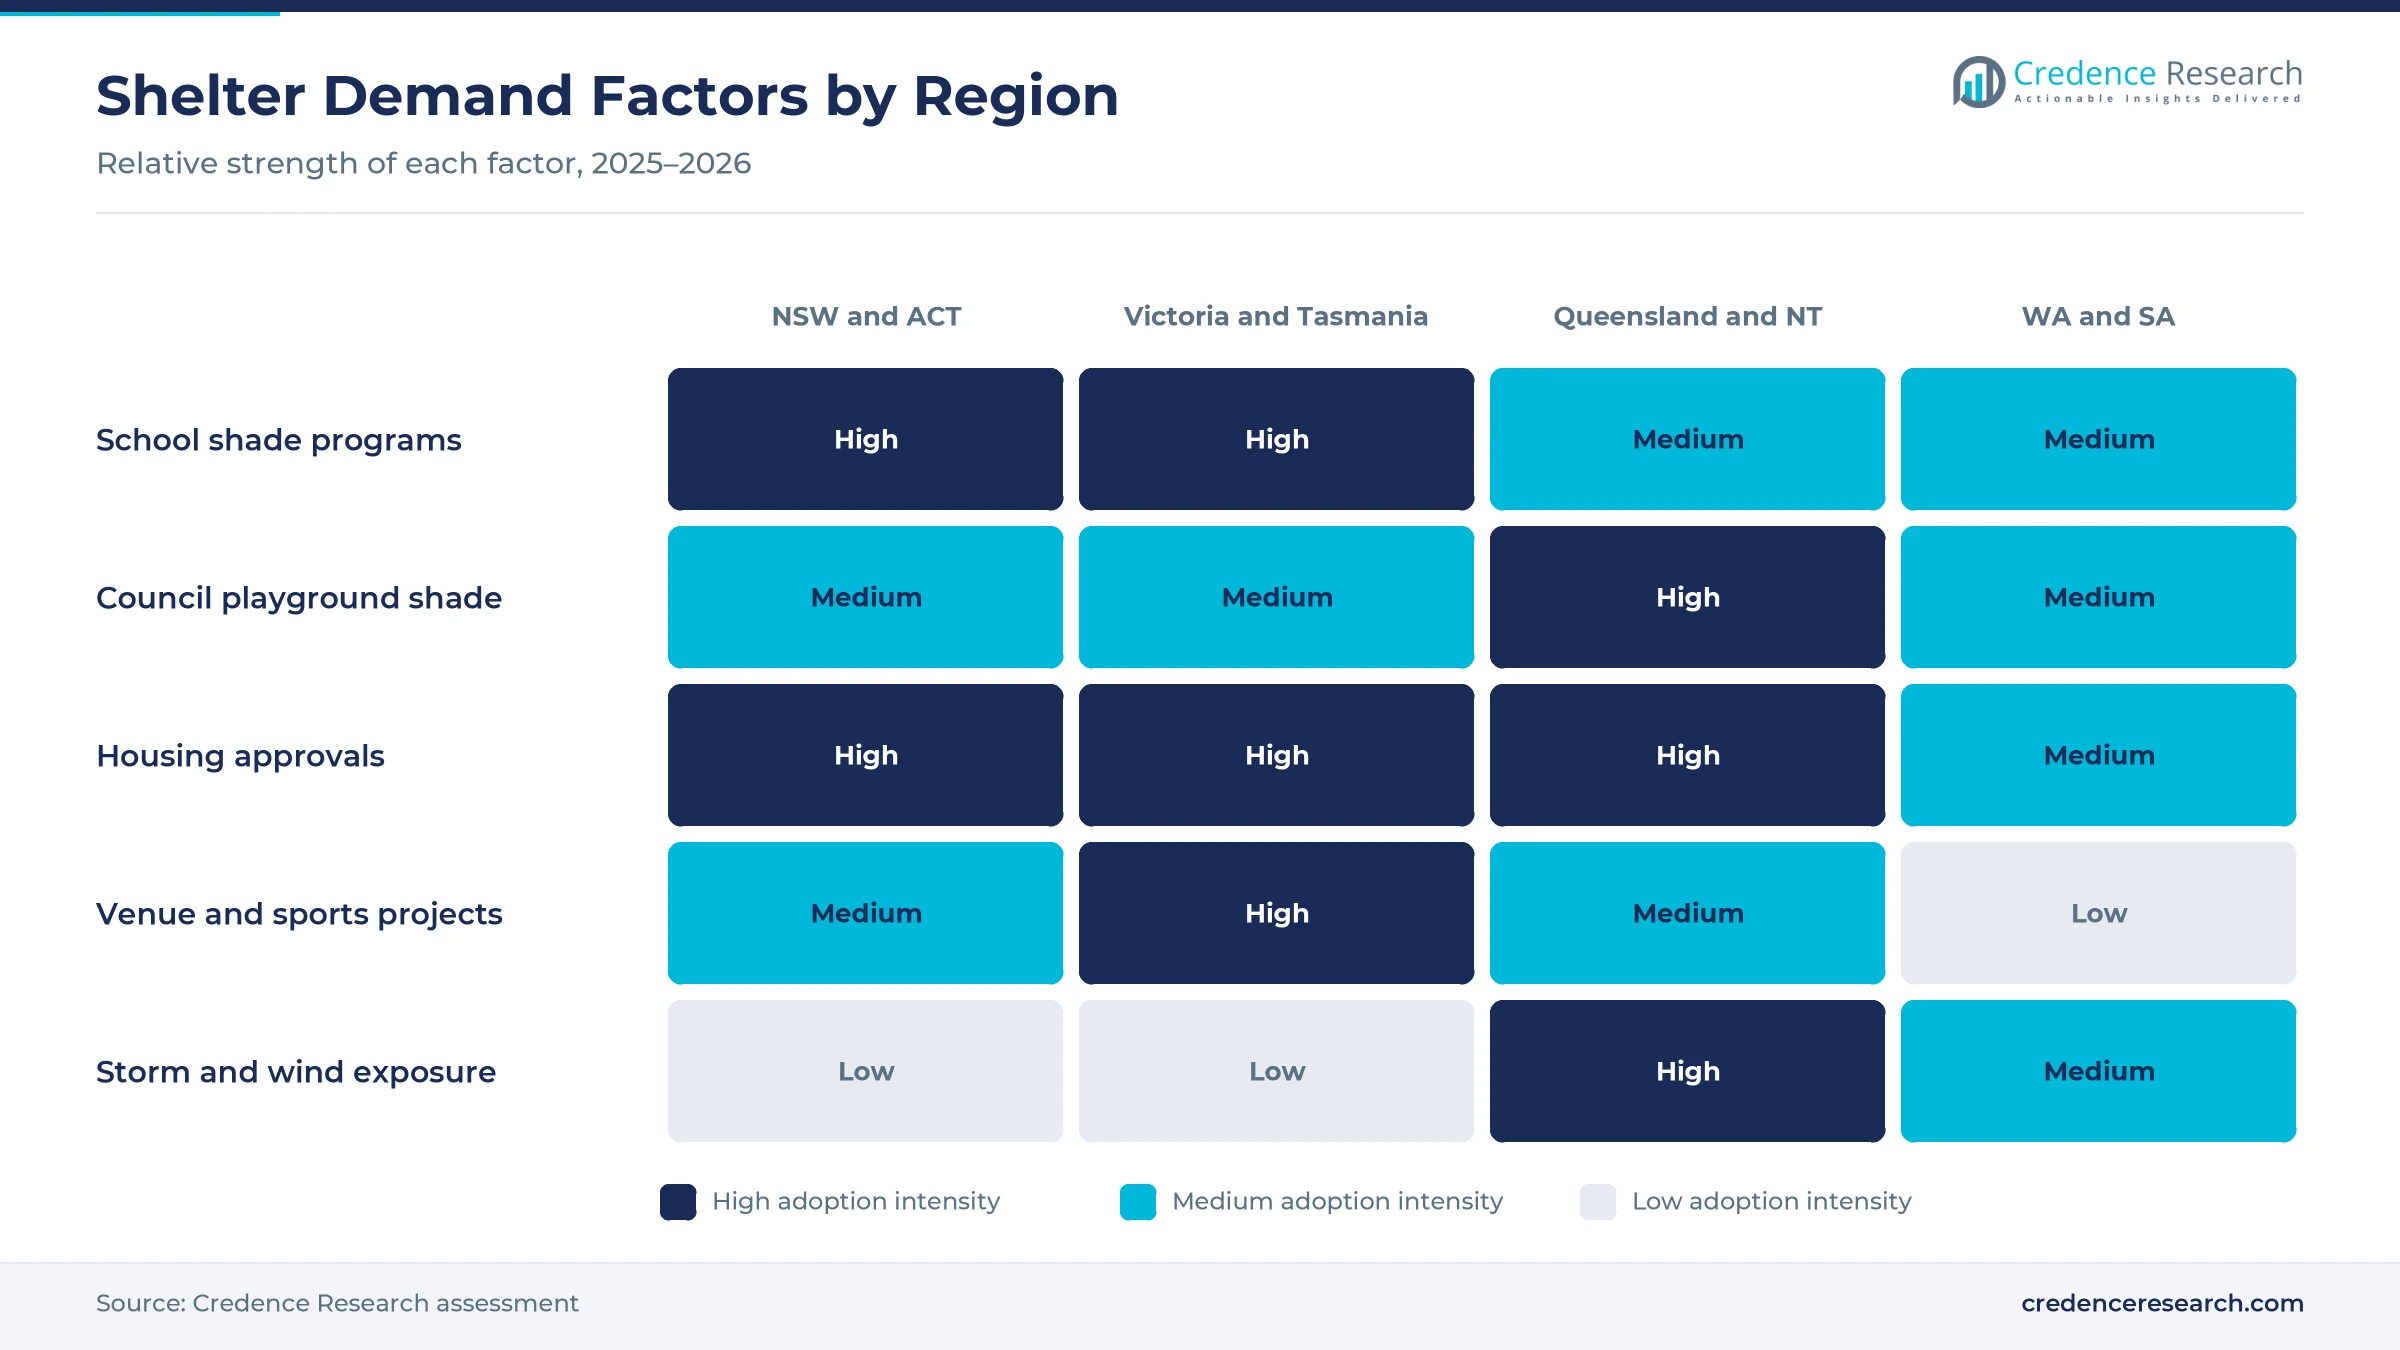
School shade compliance lifts procurement, because education departments require shaded outdoor areas and fund them through dedicated grants. The Victorian School Shade Sails Fund reached 1,259 completed projects by Jan. 3, 2025, with grants of up to AUD 25,000 per campus, according to the Victorian government. The program has reached more than 457,000 students since it began in 2021. In New South Wales, a AUD 2 million upgrade at Dapto High School, announced on Dec. 3, 2025, added a covered outdoor learning area. As a result, institutional facility owners grow fastest among end users at 5.86% a year, which keeps tender demand steady for engineered shade across government and low-fee school campuses.
Why does residential outdoor-space investment sustain sales?
Residential outdoor-space investment sustains sales, because homeowners use shelters to extend living areas over patios, pools and parking. Australia approved 18,328 dwellings in June 2026, up 7.2%, including 10,631 private houses, according to the Australian Bureau of Statistics. The same release valued residential alterations and additions at AUD 1.32 billion for the month. About 87.7% of residents lived in urban areas in 2025, according to the World Bank, which keeps backyards small and shade valuable. Households often pair shelters with outdoor garden furniture purchases from the same garden centers and online stores. Consequently, household owners lead end users in the Australia freestanding canopy market, as backyard projects outnumber public ones.
How do municipal amenity and venue upgrades add orders?
Municipal amenity and venue upgrades add orders, because councils shade playgrounds, parks and spectator areas in multi-year programs. Brisbane City Council installed shade sails at 116 playgrounds by January 2025 under its Sun Safe Suburban Playgrounds program, with the final 34 due by the end of June 2025. Uralla Shire Council in New South Wales announced a AUD 28,000 grant in April 2025 for a shade sail over outdoor gym equipment. Tennis Australia also kept two 250-square-meter membrane structures at Melbourne Park as permanent features after December 2024. As a result, councils and public land managers remain a core buyer group, and tensioned membrane canopies gain share as spans widen over courts and play areas.
Why does skin cancer prevention keep shade on budgets?
Skin cancer prevention keeps shade on public budgets, because health agencies treat built shade as a core part of sun protection. Australia expects 17,443 new melanoma cases in 2025, according to Cancer Australia, which makes melanoma the third most commonly diagnosed cancer. The same estimate puts melanoma deaths at 1,455 in 2025. Victoria has also awarded more than 1,000 community and school shade grants since its shade programs began, which shows how long public shade budgets have run. In turn, schools, clubs and councils keep shade in capital plans, which supports outdoor activity protection as the fastest-growing application at 5.89% a year through 2035.
Larger spans, sun safety and wind ratings shape buying
How is the shift toward wide-span membranes changing projects?
The shift toward wide-span membranes is changing public projects, because councils and venues want large shaded areas without many posts. MakMax Australia built two twin-column conical structures over spectator decks at Melbourne Park, covering 500 square meters in total, and the venue opened them for the 2025 Australian Open. The structures use a PVC membrane and integrated rainwater downpipes, and they won a commendation at the 2025 industry awards. Designers increasingly specify architectural membrane fabrics for these long spans over courts, decks and playgrounds. As a result, tensioned membrane canopies grow fastest among product types at 5.92% a year, while rigid roofs keep the larger share.
Why are certified engineering and inspections rising?
Certified engineering and inspections are rising, because public owners must prove that shade structures stay safe over time. Victorian government schools must obtain certified structural computations from an engineer before building shade sails, according to the state education department. Schools must also check sails, posts and hardware at least 4 times a year, once every term. A registered structural engineer must inspect each structure at least once every three years, which adds a fixed service cycle. Bundaberg Regional Council also upgraded sail hardware with safety chains in March 2025 after cyclone preparations. Consequently, direct supplier sales hold a large share, because engineered projects need design, certification and installation from one accountable supplier.
Can covered outdoor learning areas open new demand?
Covered outdoor learning areas open a clear opportunity, because schools now use shaded space for teaching as well as play. Ryde Secondary College in New South Wales added a 45-by-22-meter roof over its basketball court and two 16-by-15-meter covered areas in January 2024. The Victorian fund also paid for shade sails over outdoor learning areas, food gardens and reading spaces. In New South Wales, the 2025-26 Budget includes AUD 2.1 billion for new and upgraded schools in regional areas. As a result, schools remain the most active institutional buyers of the freestanding canopy category, while commercial building construction firms win larger shelter packages.
Is there room to grow in online umbrella and frame sales?
Online sales of umbrellas and portable frames offer a growth opening, because households and small traders buy lighter shelters without a site visit. Australia had about 27.6 million residents in 2025, up from 27.2 million in 2024, according to World Bank data, which widens the base of buyers with small yards and balconies. Shade'N'Sails in Wendouree, Victoria, sells waterproof Flexshade outdoor umbrellas alongside its custom sails and cantilever structures. Supreme Shades has supplied councils, shopping centers, mining businesses and builders in Western Australia since 1995. Gardeners who buy shade nets online also compare portable frames in the same stores. Consequently, third-party online sales grow fastest among channels at 6.48% a year, although fixed freestanding canopy structures still need local installers.
Wind loads, upkeep and approvals add cost for buyers
How do wind loads and storms raise costs?
Wind loads and storms are a clear challenge, because shelters in cyclone-prone areas need stronger posts, footings and fixings. Bundaberg Regional Council removed coastal playground sails before Tropical Cyclone Alfred in 2025 and later reinstated them with safety chains. As a result, Queensland projects cost more to engineer, maintain and insure than similar projects in the south. Suppliers respond with removable fabric, higher-rated hardware and designs certified for local wind regions, which limits the risk of damage.
Why does upkeep weigh on public owners?
Upkeep is a lasting cost barrier for public owners, because fabric, tension and footings need regular checks to stay safe. Victorian schools must inspect shade sails every quarter and use a structural engineer every three years. Consequently, small schools and clubs face ongoing costs long after the initial grant is spent. Suppliers answer with service contracts, longer-life fabrics and replacement sails that fit existing frames, which spreads the cost over the full life of each structure.
How do approvals and site work slow projects?
Approvals and site work restrain project timing, because many fixed shelters need engineering, footings and council or heritage checks before installation. Victorian schools on heritage sites are advised to consult their council first, even though shade sails need no planning permit. In turn, timelines stretch across school terms and budget years, which delays spending. Suppliers reduce these delays with standard designs, pre-certified structures and bundled approvals that shorten the path from quote to installation.
Will material prices squeeze household demand?
Material prices put pressure on household demand, because steel, aluminum and coated fabric make up much of a shelter's cost. Residential alterations and additions fell 4.0% in June 2026 to AUD 1.32 billion, which shows how quickly home projects respond to cost and confidence. As a result, many homeowners may delay large rigid-roof projects until prices ease. Suppliers respond with modular kits, portable frames and staged installation that spread the cost across seasons.
New South Wales leads as Queensland grows fastest
| Region | Value, 2025 (USD million) | Share, 2025 | CAGR, 2026–2035 |
|---|---|---|---|
| New South Wales and Australian Capital Territory | 89.8 | 33.7% | 5.46% |
| Victoria and Tasmania | 65.6 | 24.6% | 5.31% |
| Western Australia and South Australia | 57.3 | 21.5% | 5.41% |
| Queensland and Northern Territory | 53.8 | 20.2% | 5.91% |
Why do New South Wales and the ACT lead demand?
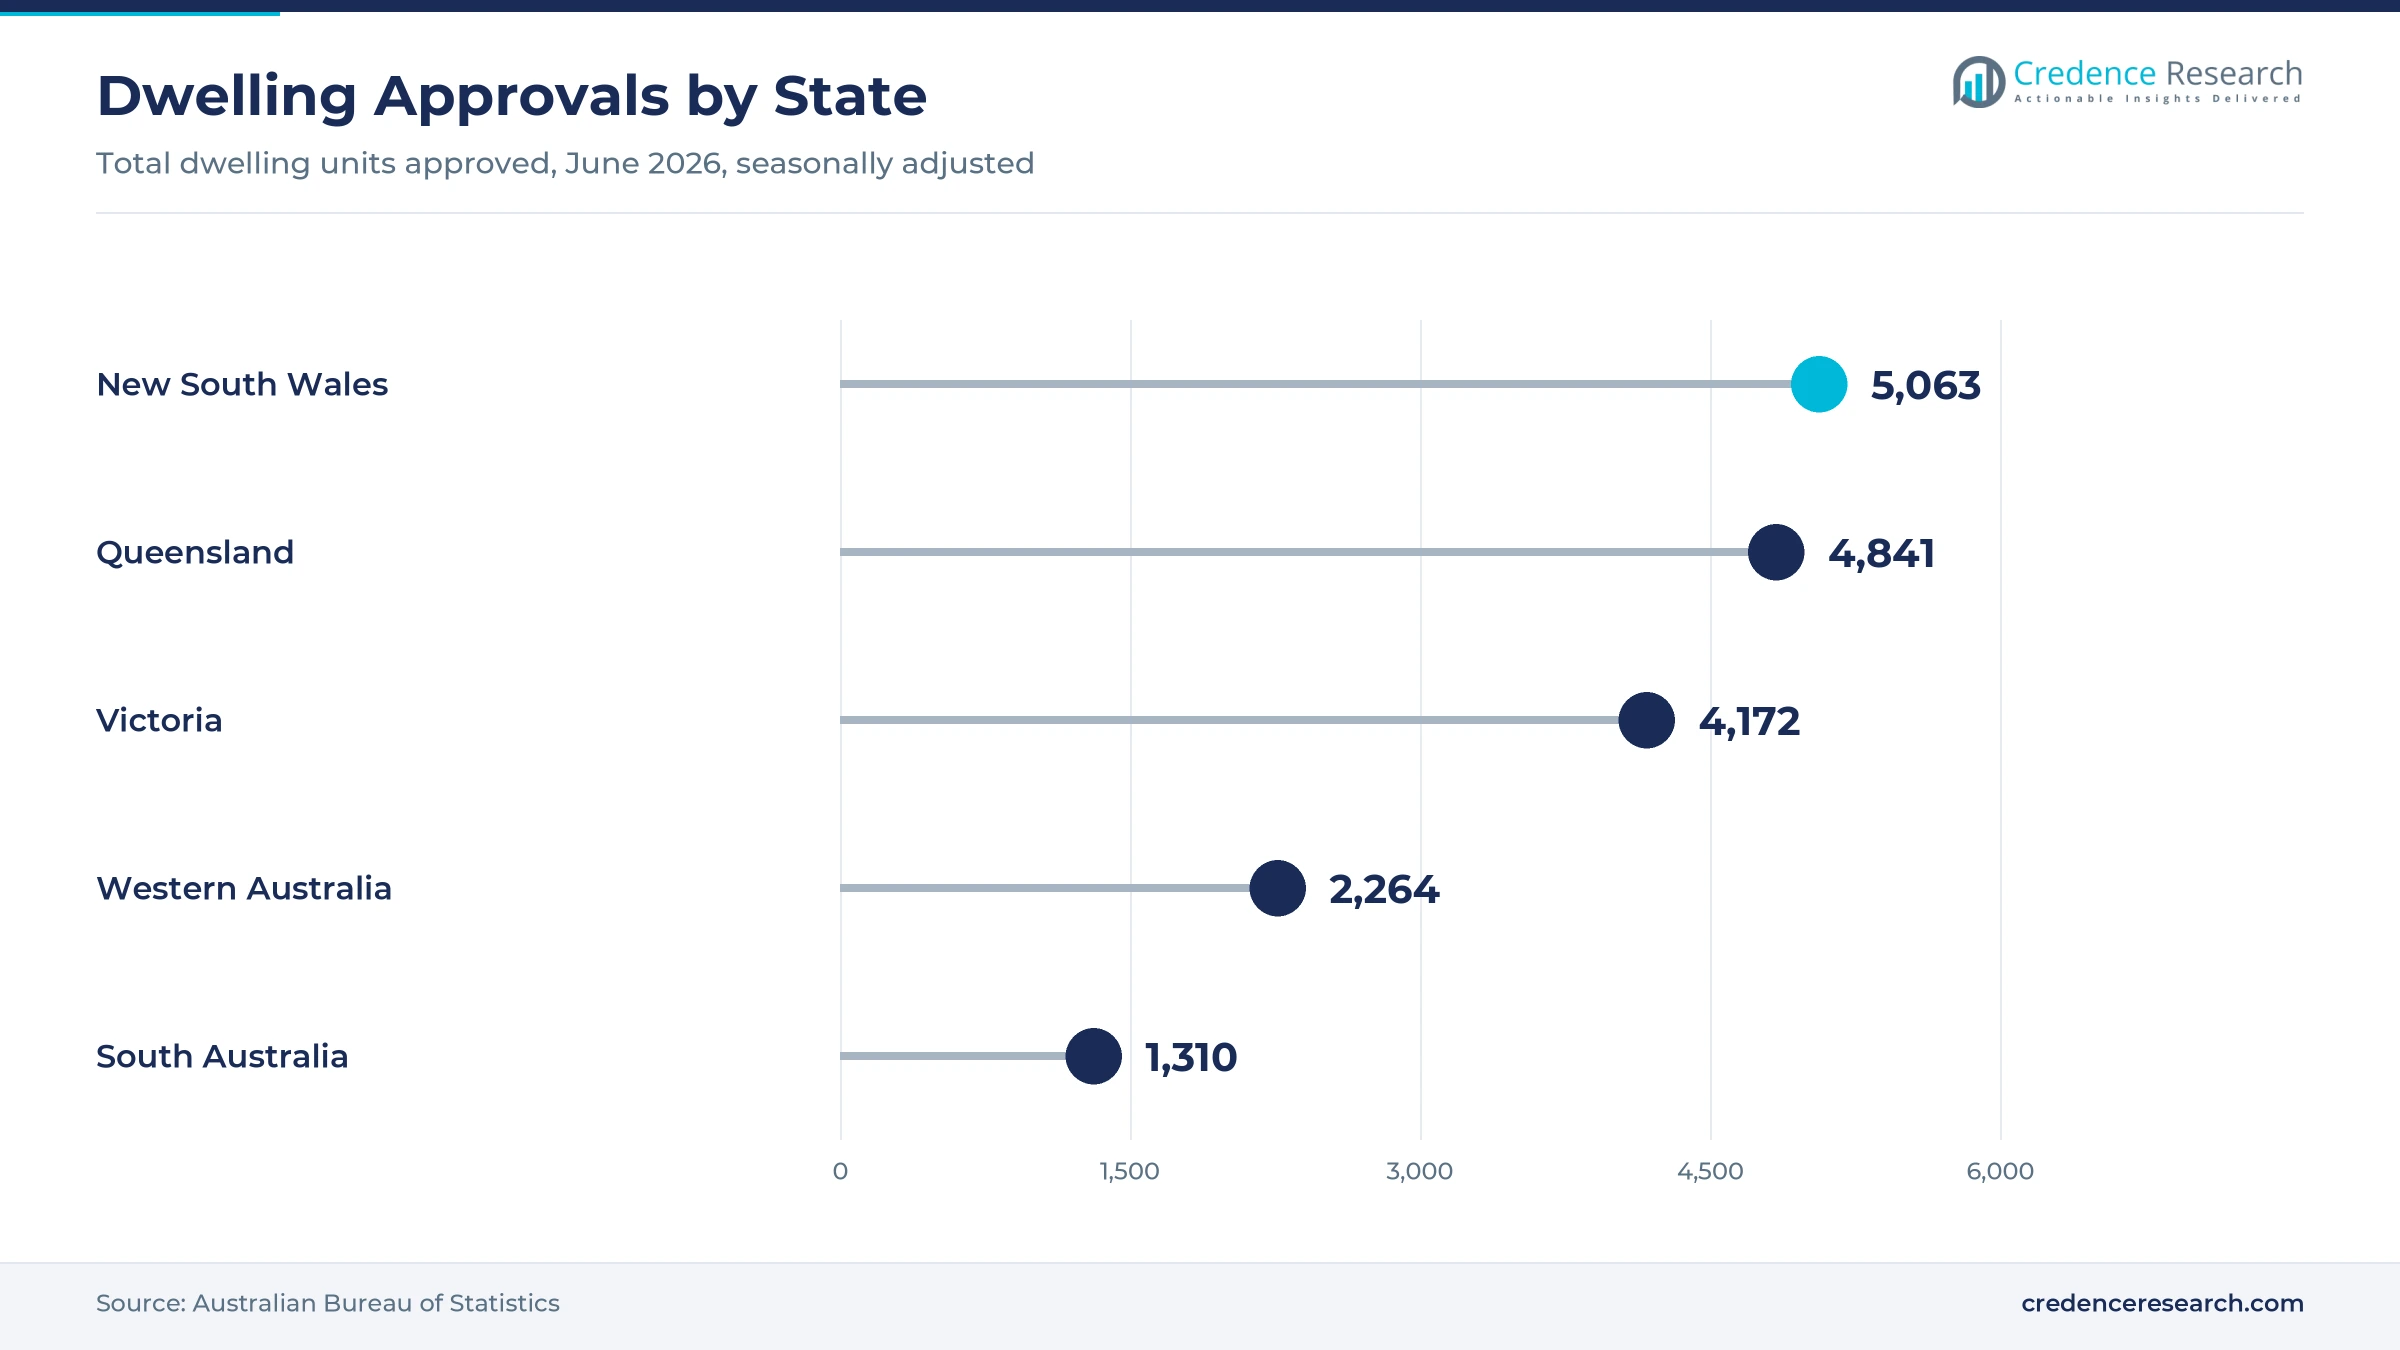
New South Wales and the Australian Capital Territory held 33.7% of 2025 value and grow at 5.46% a year. New South Wales approved 5,063 dwellings in June 2026, the most of any state, which supports backyard shelter projects. School upgrades such as the Dapto High School covered learning area add institutional demand. As a result, the zone keeps the largest share of shelter spending through 2035.
How do Victoria and Tasmania add school-led demand?
Victoria and Tasmania held 24.6% of 2025 value and grow at 5.31% a year, because Victorian school grants have funded 1,259 shade projects since 2021. Victoria also approved 3,042 private houses in June 2026, the most of any state. MakMax Australia completed permanent membrane shade at Melbourne Park in December 2024. Consequently, demand here comes from schools, sports venues and new housing estates.
Why are Queensland and the NT the fastest-growing zone?
Queensland and the Northern Territory held 20.2% of 2025 value and grow fastest at 5.91% a year, because hot, high-UV climates make shade a public priority. Brisbane City Council shaded 116 playgrounds by January 2025, and Bundaberg added sails through the Works for Queensland program. Queensland also approved 4,841 dwellings in June 2026, the second-highest total. In turn, councils and builders keep adding shelters in parks and new suburbs.
What role do Western Australia and South Australia play?
Western Australia and South Australia held 21.5% of 2025 value and grow at 5.41% a year. Supreme Shades has supplied councils, shopping centers and mining businesses in Western Australia since 1995. The two states approved 3,574 dwellings in June 2026, which supports household demand. As a result, spending here comes from councils, mine sites and new homes.
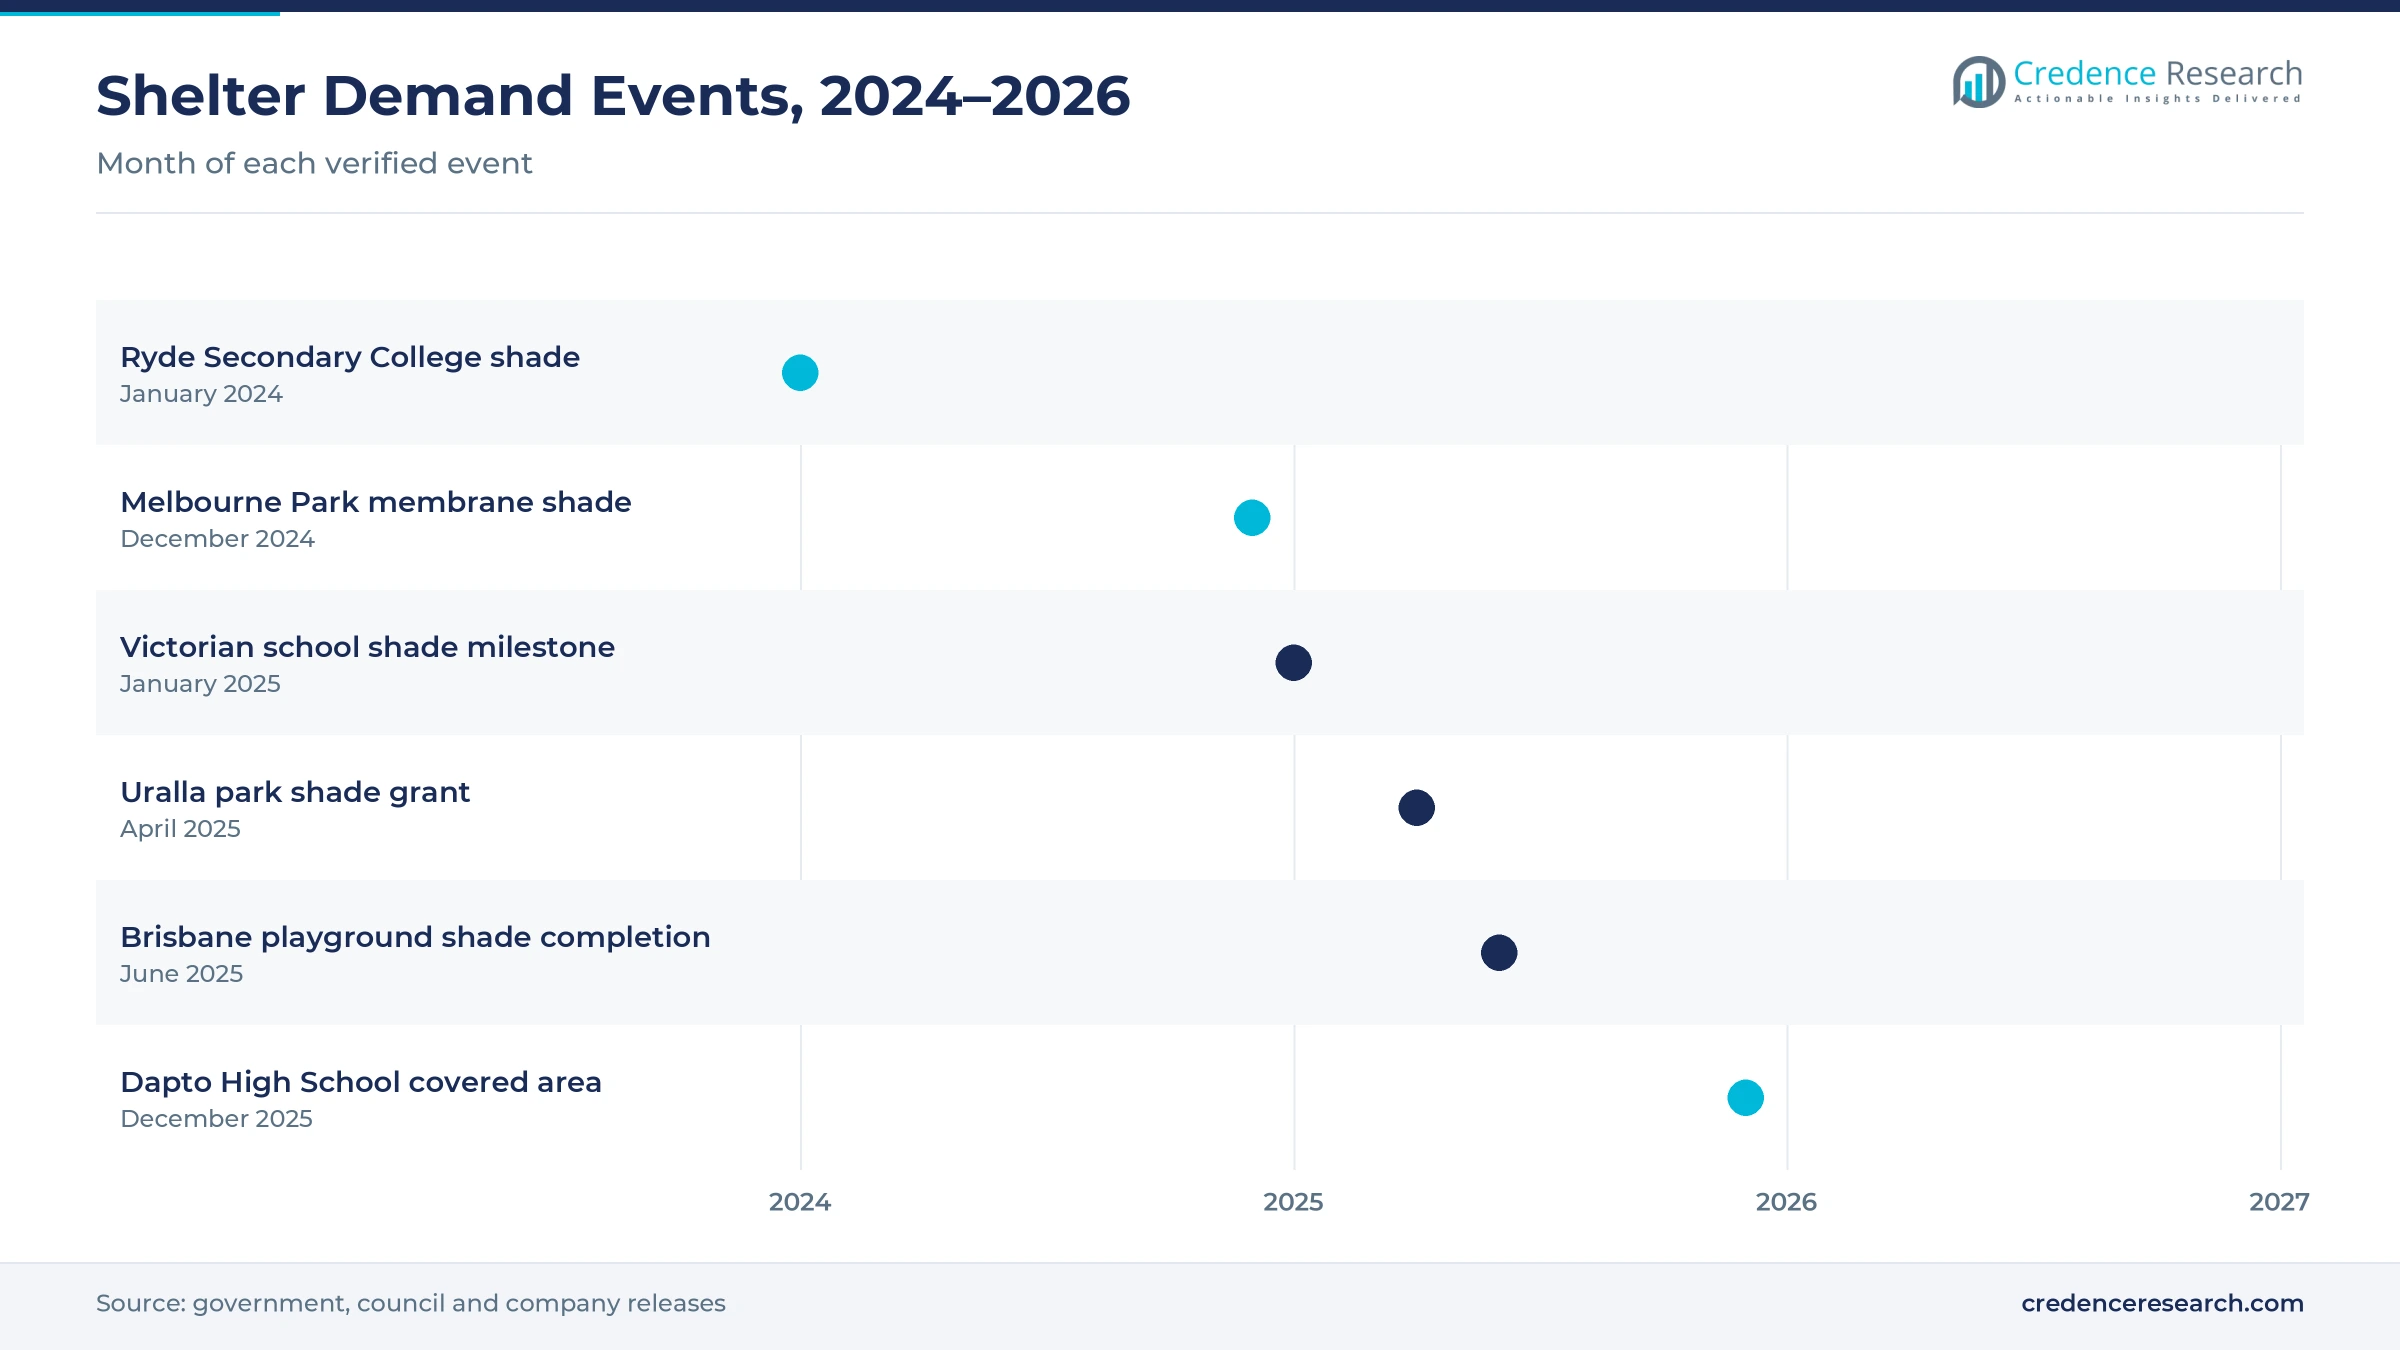
School funds, playground programs and venue shade, 2024–2026
| Development | Status and market relevance |
|---|---|
| In January 2024, Ryde Secondary College in New South Wales completed three shade structures, including a 45-by-22-meter roof over its basketball court. | Shows larger school shelter projects |
| In December 2024, MakMax Australia completed two permanent membrane shade structures over spectator decks at Melbourne Park. | Supports venue membrane demand |
| In January 2025, the Victorian government reported 1,259 completed School Shade Sails Fund projects since 2021. | Confirms school procurement pipeline |
| In April 2025, Uralla Shire Council secured AUD 28,000 for a shade sail over park gym equipment. | Adds council playground demand |
| In December 2025, the New South Wales government announced a new covered outdoor learning area at Dapto High School. | Supports covered learning space demand |
Fabrics, frames and motors reshape outdoor shelter
- High-density coated fabrics block most ultraviolet radiation while letting air pass, which keeps shaded areas cooler in summer.
- Galvanized steel and aluminum frames resist corrosion near the coast, which extends service life and cuts maintenance.
- Motorised adjustable systems let owners open or close roofs and umbrellas as weather changes, which suits cafes and homes.
- Solar-ready frames carry panels or lighting on the shelter itself, which adds power for outdoor areas and car parks.
Need a Custom Version of This Report?
Tailor the scope, geography, or segments to your exact requirements.
- Custom geography or segment scope
- Direct access to our analyst team
Local fabricators compete on design, engineering and service
Competition is led by local fabricators and engineers that design, make and install shelters for schools, councils and homes. MakMax Australia, based in Northgate, Queensland, builds tensioned membrane structures for venues such as Melbourne Park. Supreme Shades describes itself as a leading shade structure provider in Western Australia and serves councils, shopping centers and mining businesses. Shade'N'Sails in Wendouree, Victoria, supplies custom sails, cantilever structures, framed canopies and outdoor umbrellas, while Abacus Shade Structures in Emu Plains, New South Wales, designs and installs sails and membrane structures. The wider field covered in this report also includes Shade Australia. Companies compete on engineering certification, fabric quality, wind ratings, installation speed and service contracts.
Companies profiled and their roles in this market
| Company | Type | Role in the market |
|---|---|---|
| MakMax Australia | Membrane structure specialist | Permanent membrane shade at Melbourne Park, completed December 2024 |
| Supreme Shades | Shade structure fabricator | Serves Western Australian councils and mining businesses since 1995 |
| Shade'N'Sails | Shade fabricator and supplier | Custom sails, cantilever structures and Flexshade umbrellas, Wendouree |
| Abacus Shade Structures | Shade structure fabricator | Designs and installs sails and membrane structures, Emu Plains |
Credence Research sees public shade budgets setting pace
Credence Research's view is that Australian demand for freestanding outdoor shelters will grow steadily through 2035, as schools, councils and households keep investing in shade. Rigid-roof shelters should keep the largest product share, while membrane structures gain most from council and venue projects. New South Wales and the ACT will remain the largest zone, although Queensland and the Northern Territory add demand fastest. However, wind loads, upkeep and material costs will reward suppliers that offer certified designs and service contracts.
Shade projects and home approvals anchor the shelter model
The report uses 2025 as the base year, with values in USD million at current prices. Market values come from the Credence Research model, which combines dwelling approvals, school and council shade programs, project sizes and price tiers. Regional shares follow the client data set, while regional growth and segment splits by product type, application, end user and distribution channel are Credence Research estimates. Sources used are official statistics, government releases, council news, company project pages and trade directories, and no interviews or surveys were used.
Public shade programs shape shelter demand to 2035
The market is expected to reach USD 455.4 million by 2035, a 5.50% CAGR during 2026–2035, as school, council and household spending keeps shade projects moving. Growth should be strongest in membrane structures, outdoor activity protection and Queensland and the Northern Territory, while New South Wales and the ACT keep the largest share. Online sales of umbrellas and portable frames will widen the buyer base. In contrast, storms, upkeep costs or weaker home renovation could slow some projects.
Frequently Asked Questions
How big is the Australia freestanding canopy market?
Which region leads shelter demand?
Which region grows fastest?
Which product type holds the largest share?
Why do schools buy so much shade?
Which product type grows fastest?
Who are the leading companies in this market?
What are the main risks to growth?
Table of Content
Chapter 1 Market Segmentation
- 1.1 Segmentation Framework
- 1.1.1 Product and Service Classification
- 1.1.2 Application and End-Use Classification
- 1.1.3 Technology and Solution Classification
- 1.1.4 Customer and Distribution Channel Classification
- 1.1.5 Geographic Segmentation
- 1.1.6 Market Segment Definitions and Boundaries
- 1.2 By Product Type
- 1.2.1 Permanent rigid-roof canopies
- 1.2.2 Tensioned membrane canopies
- 1.2.3 Freestanding commercial umbrellas
- 1.2.4 Portable framed canopies
- 1.3 By Application
- 1.3.1 Outdoor living protection
- 1.3.2 Outdoor activity protection
- 1.3.3 Vehicle and asset protection
- 1.3.4 Trading and gathering protection
- 1.4 By End User
- 1.4.1 Household owners
- 1.4.2 Institutional facility owners
- 1.4.3 Councils and public land managers
- 1.4.4 Business and community operators
Chapter 2 Introduction
- 2.1 Report Objectives and Scope
- 2.2 Product Definition and Industry Terminology
- 2.3 Market Inclusions and Exclusions
- 2.4 Research Process
- 2.4.1 Primary Research and Expert Interviews
- 2.4.2 Secondary Research and Source Review
- 2.4.3 Top-Down and Bottom-Up Estimation
- 2.4.4 Data Triangulation and Verification
- 2.5 Market Size Measurement Basis
- 2.5.1 2025: USD 266.5 million → 2035: USD 455.4 million
- 2.6 Historical and Forecast Reference Periods
- 2.6.1 Historical Period: 2018-2025
- 2.6.2 Base Year: 2025
- 2.6.3 Forecast Period: 2025-2035
- 2.7 Research Assumptions and Limitations
Chapter 3 Executive Summary
- 3.1 Market Snapshot and Key Findings
- 3.2 Base-Year Market Size, 2025
- 3.3 Forecast Market Size, 2035
- 3.4 Revenue and Volume Growth Outlook
- 3.5 Key Demand and Supply Indicators
- 3.6 Leading Market Segments
- 3.7 Fastest-Growing Market Opportunities
- 3.8 Regional Performance Highlights
- 3.9 Technology and Industry Transformation
- 3.10 Competitive Landscape Summary
- 3.11 Analyst View and Strategic Implications
Chapter 4 Australia Freestanding Canopy Market Trends and Developments
- 4.1 Historical Industry Development, 2018-2025
- 4.2 Recent Market Trends and Developments
- 4.3 Demand and Customer Behavior Trends
- 4.4 Technology and Product Innovation
- 4.5 Artificial Intelligence, Automation and Digitalization
- 4.6 Local Manufacturing and Supply Chain Realignment
- 4.7 Industry Partnerships, Mergers and Acquisitions
- 4.8 Sustainability and Circular Economy Developments
- 4.9 Government and Private Sector Investment Trends
- 4.10 Emerging Business Models and Commercialization
- 4.11 Industry Developments and Announcements
Chapter 5 Australia Freestanding Canopy Market Production, Supply and Demand Analysis
- 5.1 Demand Trend and Consumption Analysis, 2018-2025
- 5.2 Demand Forecast, 2025-2035
- 5.3 Production and Output Trend, 2018-2025
- 5.4 Production and Output Forecast, 2025-2035
- 5.5 Installed Capacity and Capacity Utilization
- 5.6 Company-Wise Production Plants and Statistics
- 5.6.1 Installed Production Capacity
- 5.6.2 Actual Production
- 5.6.3 Planned Capacity and Expansion Targets
- 5.7 Supply Chain Structure and Procurement Trends
- 5.8 Supply-Demand Gap and Bottlenecks
- 5.9 Import Dependence and Sourcing Structure
- 5.10 Contract Manufacturing and Outsourcing
- 5.11 Regional Supply and Demand Concentration
Chapter 6 Australia Freestanding Canopy Market Pricing Analysis
- 6.1 Pricing Structure and Measurement
- 6.2 Historical Pricing Trends, 2018-2025
- 6.3 Pricing Outlook, 2025-2035
- 6.4 Average Selling Price and Unit Economics
- 6.5 Pricing by Product and Market Segment
- 6.6 Geographic Pricing Differences
- 6.7 Key Input, Energy, Labor and Logistics Costs
- 6.8 Contract Pricing and Purchasing Models
- 6.9 Pricing Sensitivity and Competitive Positioning
- 6.10 Price, Margin and Profitability Implications
Chapter 7 Australia Freestanding Canopy Market Dynamics
- 7.1 Market Growth Drivers
- 7.1.1 Demand-Side Drivers
- 7.1.2 Technology and Innovation Drivers
- 7.1.3 Infrastructure and Investment Drivers
- 7.1.4 Regulatory and Policy Drivers
- 7.2 Market Restraints
- 7.2.1 Cost and Affordability Constraints
- 7.2.2 Technology and Adoption Barriers
- 7.2.3 Supply Chain and Operational Constraints
- 7.3 Market Challenges
- 7.3.1 Competitive Pressure and Margin Erosion
- 7.3.2 Skills, Infrastructure and Implementation Gaps
- 7.4 Emerging Market Opportunities
- 7.5 Market Dynamics Impact and Time-Horizon Assessment
Chapter 8 Australia Freestanding Canopy Value Chain Analysis
- 8.1 Industry Value Chain Overview
- 8.2 Upstream Suppliers and Critical Inputs
- 8.3 Technology and Component Providers
- 8.4 Manufacturing or Service Delivery
- 8.5 Distribution, Channel Partners and Integrators
- 8.6 Downstream Applications and End Users
- 8.7 Value Addition and Profit Pools
- 8.8 Vertical Integration and Outsourcing
- 8.9 Supplier Concentration and Risk
- 8.10 Supply Chain Localization and Resilience
Chapter 9 Australia Freestanding Canopy Market Regulations and Policies
- 9.1 Relevant Laws, Standards and Compliance Frameworks
- 9.2 Product, Service, Safety and Quality Requirements
- 9.3 Government Policies, Incentives and Subsidies
- 9.4 Imports, Exports and Trade Barriers
- 9.5 Public Procurement and Local Content Requirements
- 9.6 Environmental and Sustainability Compliance
- 9.7 Upcoming Policy Changes and Market Implications
Chapter 10 Australia Freestanding Canopy Market Hotspots and Opportunities
- 10.1 Market Opportunity Mapping and Growth Hotspots
- 10.2 High-Growth Applications and Customer Groups
- 10.3 Underserved Markets and White-Space Opportunities
- 10.4 Emerging Technology and Product Opportunities
- 10.5 New Capacity and Investment Hotspots
- 10.6 Market Entry and Expansion Opportunities
- 10.7 Distribution and Partnership Opportunities
- 10.8 Near-Term and Long-Term Commercial Potential
- 10.9 Opportunity Attractiveness and Execution Risks
Chapter 11 Australia Freestanding Canopy Market Outlook, 2025-2035
- 11.1 Market Size and Analysis
- 11.1.1 Revenue (Market Measurement: 2025: USD 266.5 million → 2035: USD 455.4 million)
- 11.1.2 Market Volume and Quantity Sold
- 11.1.3 Historical Market Size, 2018-2025
- 11.1.4 Base-Year Market Size, 2025
- 11.2 Market Forecast, 2025-2035
- 11.2.1 Revenue Forecast to 2035
- 11.2.2 Volume Forecast to 2035
- 11.2.3 CAGR and Year-on-Year Growth
- 11.2.4 Incremental Revenue Opportunity
- 11.3 Forecast Assumptions and Scenario Analysis
- 11.3.1 Base-Case Forecast
- 11.3.2 Optimistic and Conservative Scenarios
- 11.3.3 Technology, Pricing and Policy Sensitivities
- 11.4 Market Attractiveness and Growth Outlook
Chapter 12 Australia Freestanding Canopy Market Segmentation and Outlook
- 12.1 Segmentation Summary and Market Shares, 2025
- 12.2 Largest and Fastest-Growing Segments
- 12.3 By Product Type - Market Size and Forecast, 2025-2035
- 12.3.1 Segment Definition and Scope
- 12.3.2 Historical Market Size, 2018-2025
- 12.3.3 Revenue Forecast, 2025-2035
- 12.3.4 Volume Forecast, 2025-2035
- 12.3.5 Base-Year Market Share, 2025
- 12.3.6 Segment CAGR and Growth Drivers
- 12.3.7 Subsegment Market Size and Forecast
- 12.3.7.1 Permanent rigid-roof canopies
- 12.3.7.2 Tensioned membrane canopies
- 12.3.7.3 Freestanding commercial umbrellas
- 12.3.7.4 Portable framed canopies
- 12.3.8 Subsegment Pricing and Adoption Trends
- 12.3.9 Leading Suppliers and Competition
- 12.3.10 Regional Demand and Opportunities
- 12.4 By Application - Market Size and Forecast, 2025-2035
- 12.4.1 Segment Definition and Scope
- 12.4.2 Historical Market Size, 2018-2025
- 12.4.3 Revenue Forecast, 2025-2035
- 12.4.4 Volume Forecast, 2025-2035
- 12.4.5 Base-Year Market Share, 2025
- 12.4.6 Segment CAGR and Growth Drivers
- 12.4.7 Subsegment Market Size and Forecast
- 12.4.7.1 Outdoor living protection
- 12.4.7.2 Outdoor activity protection
- 12.4.7.3 Vehicle and asset protection
- 12.4.7.4 Trading and gathering protection
- 12.4.8 Subsegment Pricing and Adoption Trends
- 12.4.9 Leading Suppliers and Competition
- 12.4.10 Regional Demand and Opportunities
- 12.5 By End User - Market Size and Forecast, 2025-2035
- 12.5.1 Segment Definition and Scope
- 12.5.2 Historical Market Size, 2018-2025
- 12.5.3 Revenue Forecast, 2025-2035
- 12.5.4 Volume Forecast, 2025-2035
- 12.5.5 Base-Year Market Share, 2025
- 12.5.6 Segment CAGR and Growth Drivers
- 12.5.7 Subsegment Market Size and Forecast
- 12.5.7.1 Household owners
- 12.5.7.2 Institutional facility owners
- 12.5.7.3 Councils and public land managers
- 12.5.7.4 Business and community operators
- 12.5.8 Subsegment Pricing and Adoption Trends
- 12.5.9 Leading Suppliers and Competition
- 12.5.10 Regional Demand and Opportunities
- 12.6 Segment Growth Comparison
- 12.7 Segment Attractiveness and Priority Matrix
Chapter 13 Australia Freestanding Canopy End-Use and Application Market Outlook
- 13.1 End-Use Industry and Customer Demand Structure
- 13.2 Leading Applications and Customer Groups
- 13.3 End-Use Market Size, Share and Forecast
- 13.4 Major End-Use Industry Deep Dives
- 13.4.1 Customer Requirements and Use Cases
- 13.4.2 Demand and Replacement Cycles
- 13.4.3 Technical and Regulatory Considerations
- 13.4.4 Purchasing and Procurement Models
- 13.4.5 Leading Vendors and Distribution Channels
- 13.4.6 Forecast and Commercial Opportunities
- 13.5 Emerging Applications and Cross-Segment Demand
- 13.6 End-Use Industry Investment Priorities
Chapter 14 Australia Freestanding Canopy Geographic Market Outlook, 2025-2035
- 14.1 Domestic Market Distribution and Demand Clusters
- 14.2 State- or Province-Wise Market Size and Forecast, 2025-2035
- 14.3 City and Metropolitan Market Outlook
- 14.4 Industrial, Manufacturing and Commercial Clusters
- 14.5 Geographic Concentration of Key End Users
- 14.6 Local Pricing and Purchasing Differences
- 14.7 Domestic Production Facilities and Capacity Map
- 14.8 Local Infrastructure and Project Pipeline
- 14.9 State-Level Policy and Incentive Differences
- 14.10 Subnational Investment Hotspots and Opportunities
- 14.11 Distribution and Logistics Networks
- 14.12 Domestic Competitive Footprint
Chapter 15 Australia Freestanding Canopy Technology, Innovation and Sustainability Outlook
- 15.1 Technology Landscape and Maturity
- 15.2 Product, Process and Service Innovation
- 15.3 AI, Automation and Digital Tools in the Industry
- 15.4 Technology Adoption and Performance Benchmarking
- 15.5 Innovation Pipeline and R&D Investment
- 15.6 Patent and Intellectual Property Trends
- 15.7 Energy Efficiency and Resource Management
- 15.8 Sustainability, Recycling and Circularity
- 15.9 Technology Roadmap, 2025-2035
- 15.10 Risks of Obsolescence and Technology Substitution
Chapter 16 Australia Freestanding Canopy Market Key Strategic Imperatives
- 16.1 Growth and Market Entry Priorities
- 16.2 High-Return Products and Segments
- 16.3 Pricing, Profitability and Cost Optimization
- 16.4 Technology Investment and Product Differentiation
- 16.5 Supply Chain Localization and Resilience
- 16.6 Distribution and Customer Acquisition
- 16.7 Partnership, Acquisition and Capacity Strategy
- 16.8 Regional Expansion Priorities
- 16.9 Short-, Medium- and Long-Term Actions
Chapter 17 Competition Outlook
- 17.1 Industry Competition Characteristics
- 17.2 Market Structure and Concentration
- 17.3 Market Share and Competitive Positioning, 2025
- 17.4 Company-Wise Revenue and Product Benchmarking
- 17.5 Production and Service Capacity Benchmarking
- 17.6 Technology, Pricing and Differentiation
- 17.7 Regional Footprint and Distribution Strength
- 17.8 Mergers, Acquisitions and Strategic Alliances
- 17.9 New Entrants and Competitive Threats
- 17.10 Porter's Five Forces and Industry Attractiveness
- 17.11 Competitive Outlook, 2025-2035
Chapter 18 Company Profiles
- 18.1 Company Coverage and Selection Criteria
- 18.2 MakMax Australia
- 18.2.1 Business Description
- 18.2.2 Company Ownership and Geographic Presence
- 18.2.3 Product and Service Portfolio
- 18.2.4 Manufacturing and Operating Footprint
- 18.2.5 Production Capacity and Expansion Plans
- 18.2.6 Financial Performance and Investment
- 18.2.7 Market Share and Competitive Position
- 18.2.8 Technology and Innovation Capabilities
- 18.2.9 Strategic Alliances or Partnerships
- 18.2.10 Recent Developments
- 18.2.11 Growth Strategy and Outlook
- 18.3 Abacus Shade Structures
- 18.4 Supreme Shades
- 18.5 Shade'N'Sails
- 18.6 Shade Australia
- 18.7 Other Relevant Market Participants
Note: Every listed company is profiled on the structure shown under the first company. The company list is preliminary and may change based on research findings, market developments, data availability and client requirements.
Chapter 19 Disclaimer
- 19.1 Research and Forecast Disclaimer
- 19.2 Data Source and Estimation Limitations
Note: The depth of individual sections depends on data availability for this market. Volume, capacity, trade and other unit-based metrics are included where applicable.

