
Housing, assembly and plant upkeep shape bonding demand
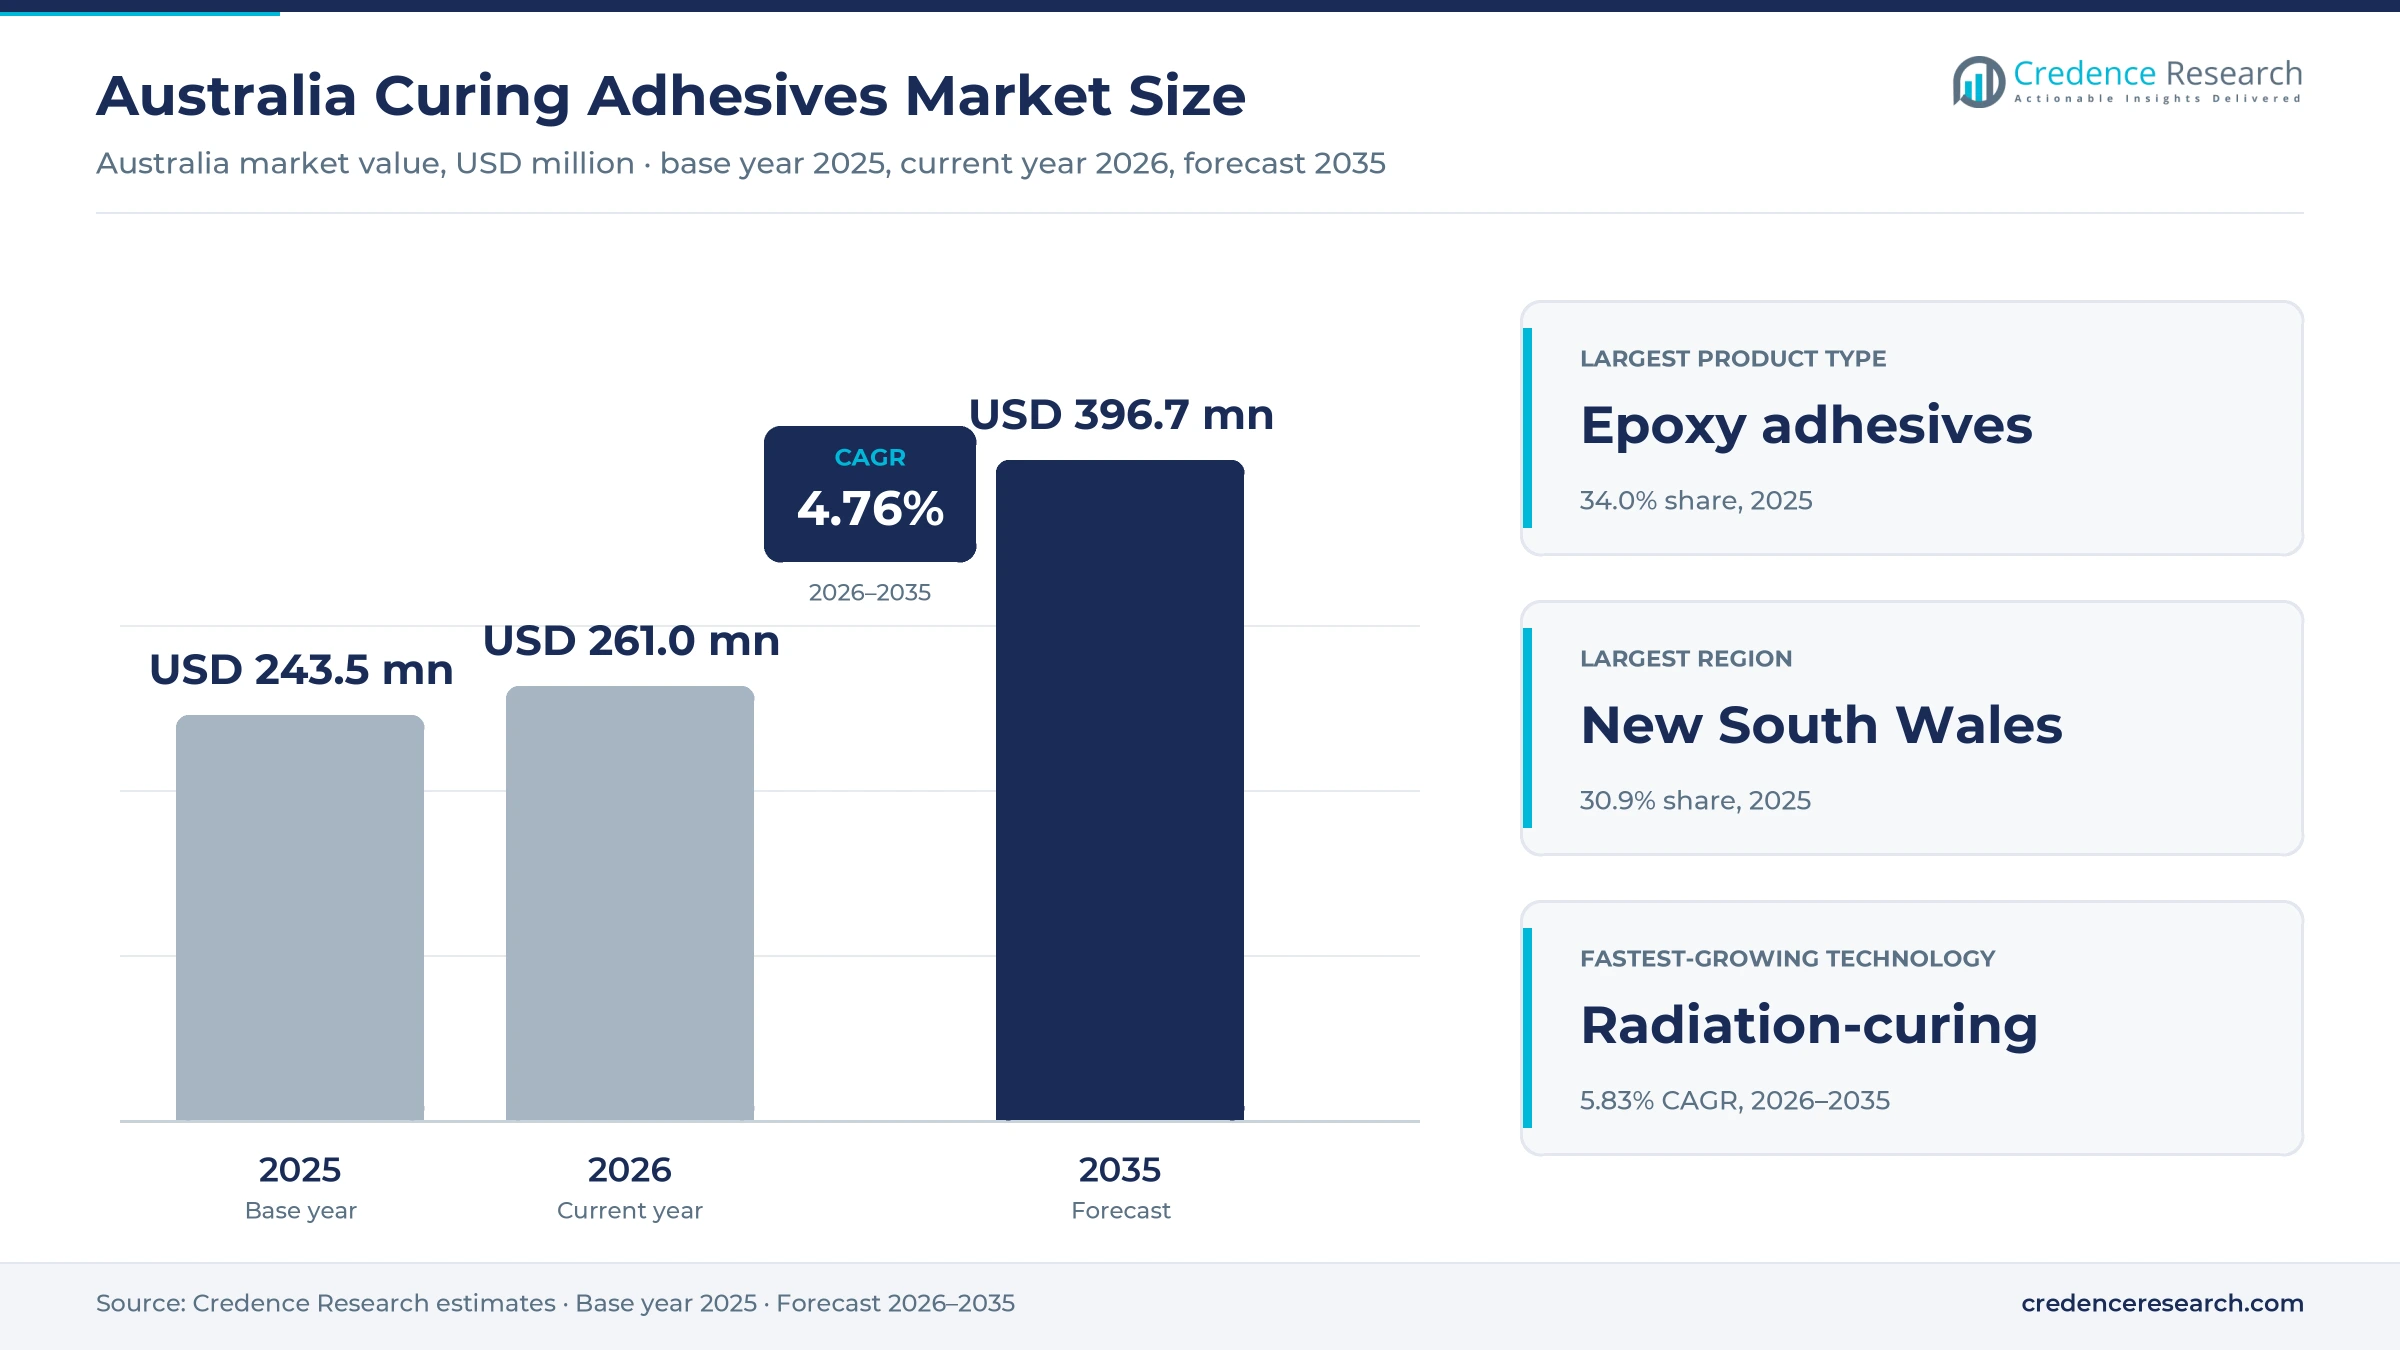
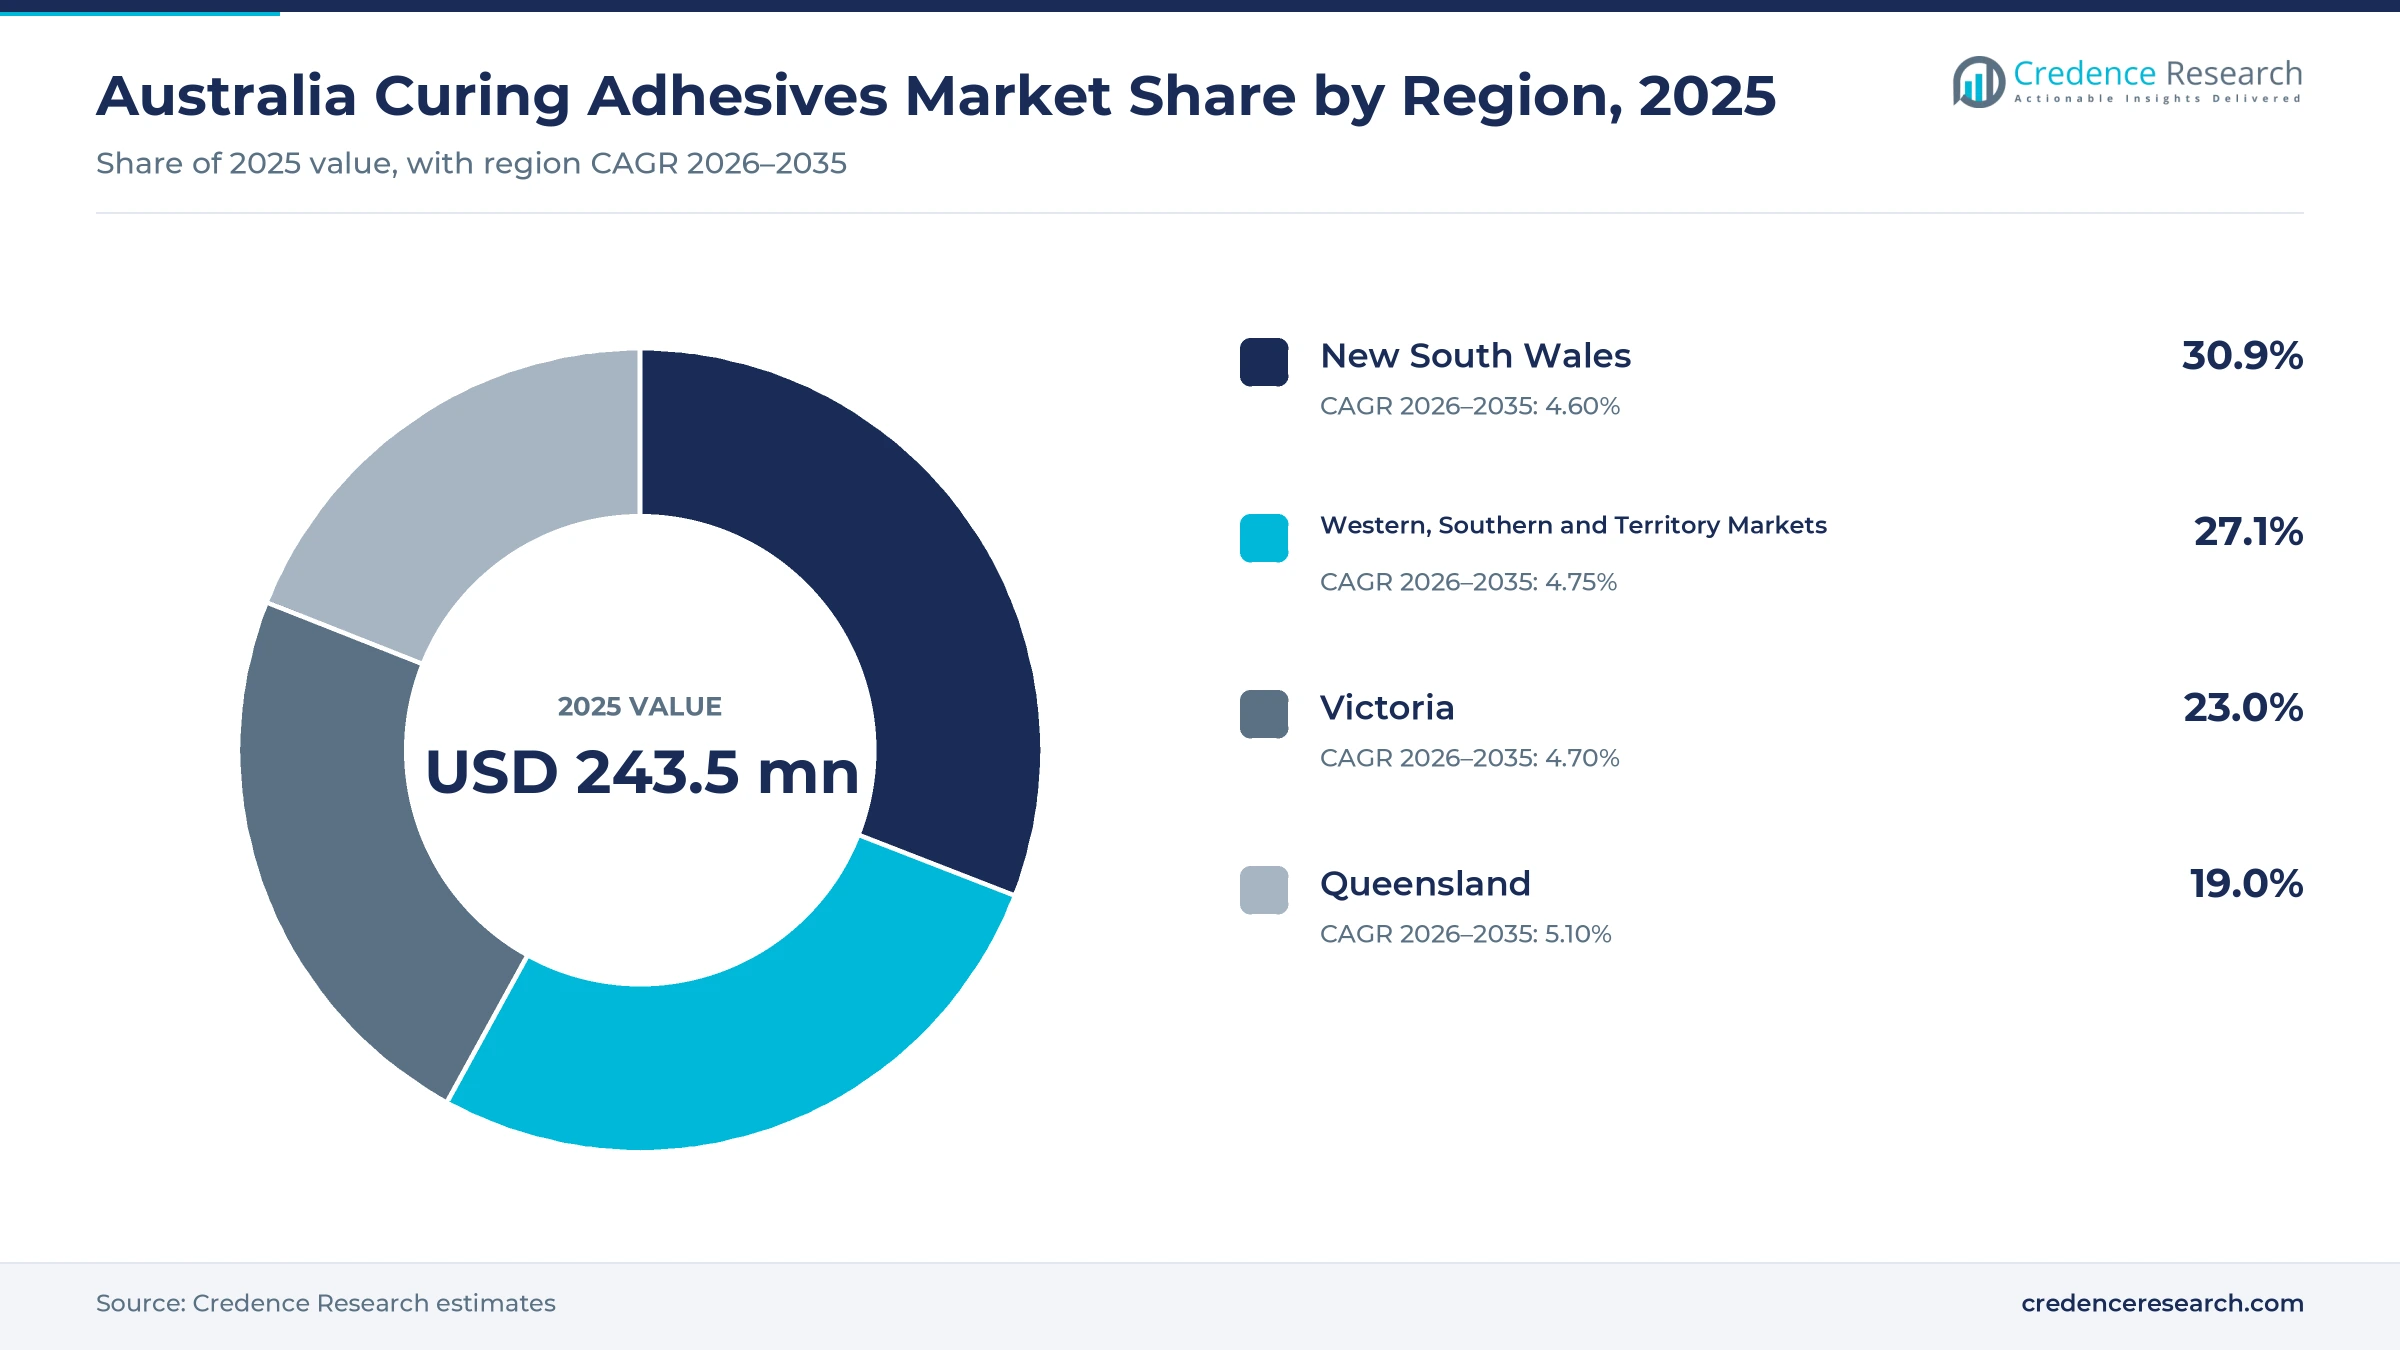
The Australia curing adhesives market was valued at USD 243.5 million in 2025 and is projected to increase from USD 261.0 million in 2026 to USD 396.7 million by 2035, registering a CAGR of 4.76% during 2026–2035. Demand comes from builders, flooring contractors, manufacturers, vehicle and equipment assemblers, and maintenance crews that use reactive epoxy, polyurethane, acrylic and silicone products to bond, seal and repair. New South Wales held the largest regional share, 30.9% in 2025, because it has the largest population and building stock in the country. Queensland is the fastest-growing region at 5.10% a year, as housing, mining and energy projects expand across the state. At the same time, dwelling commencements rose 14.4% year on year in the June 2026 quarter, which is lifting near-term demand for construction bonding and sealing products.
Which reactive bonding products and buyers does the estimate cover?
The estimate measures the value of epoxy, polyurethane, acrylic and silicone and specialty resin adhesives sold in Australia that cure by chemical reaction, moisture, radiation, heat or the absence of air. It counts products bought by manufacturers, construction contractors, maintenance service providers and trade and consumer buyers for assembly, bonding, sealing and repair work.
The estimate excludes solvent-borne contact adhesives, water-based glues that dry without reaction, pressure-sensitive tapes and application labor. The value chain runs from global and local formulators through direct technical sales teams, specialist chemical distributors, industrial and construction merchants, and retail channels to the final users.
Australia Curing Adhesives Market Insights
- The Australia curing adhesives market was valued at USD 243.5 million in 2025 and is projected to reach USD 396.7 million by 2035, registering a CAGR of 4.76% during 2026–2035.
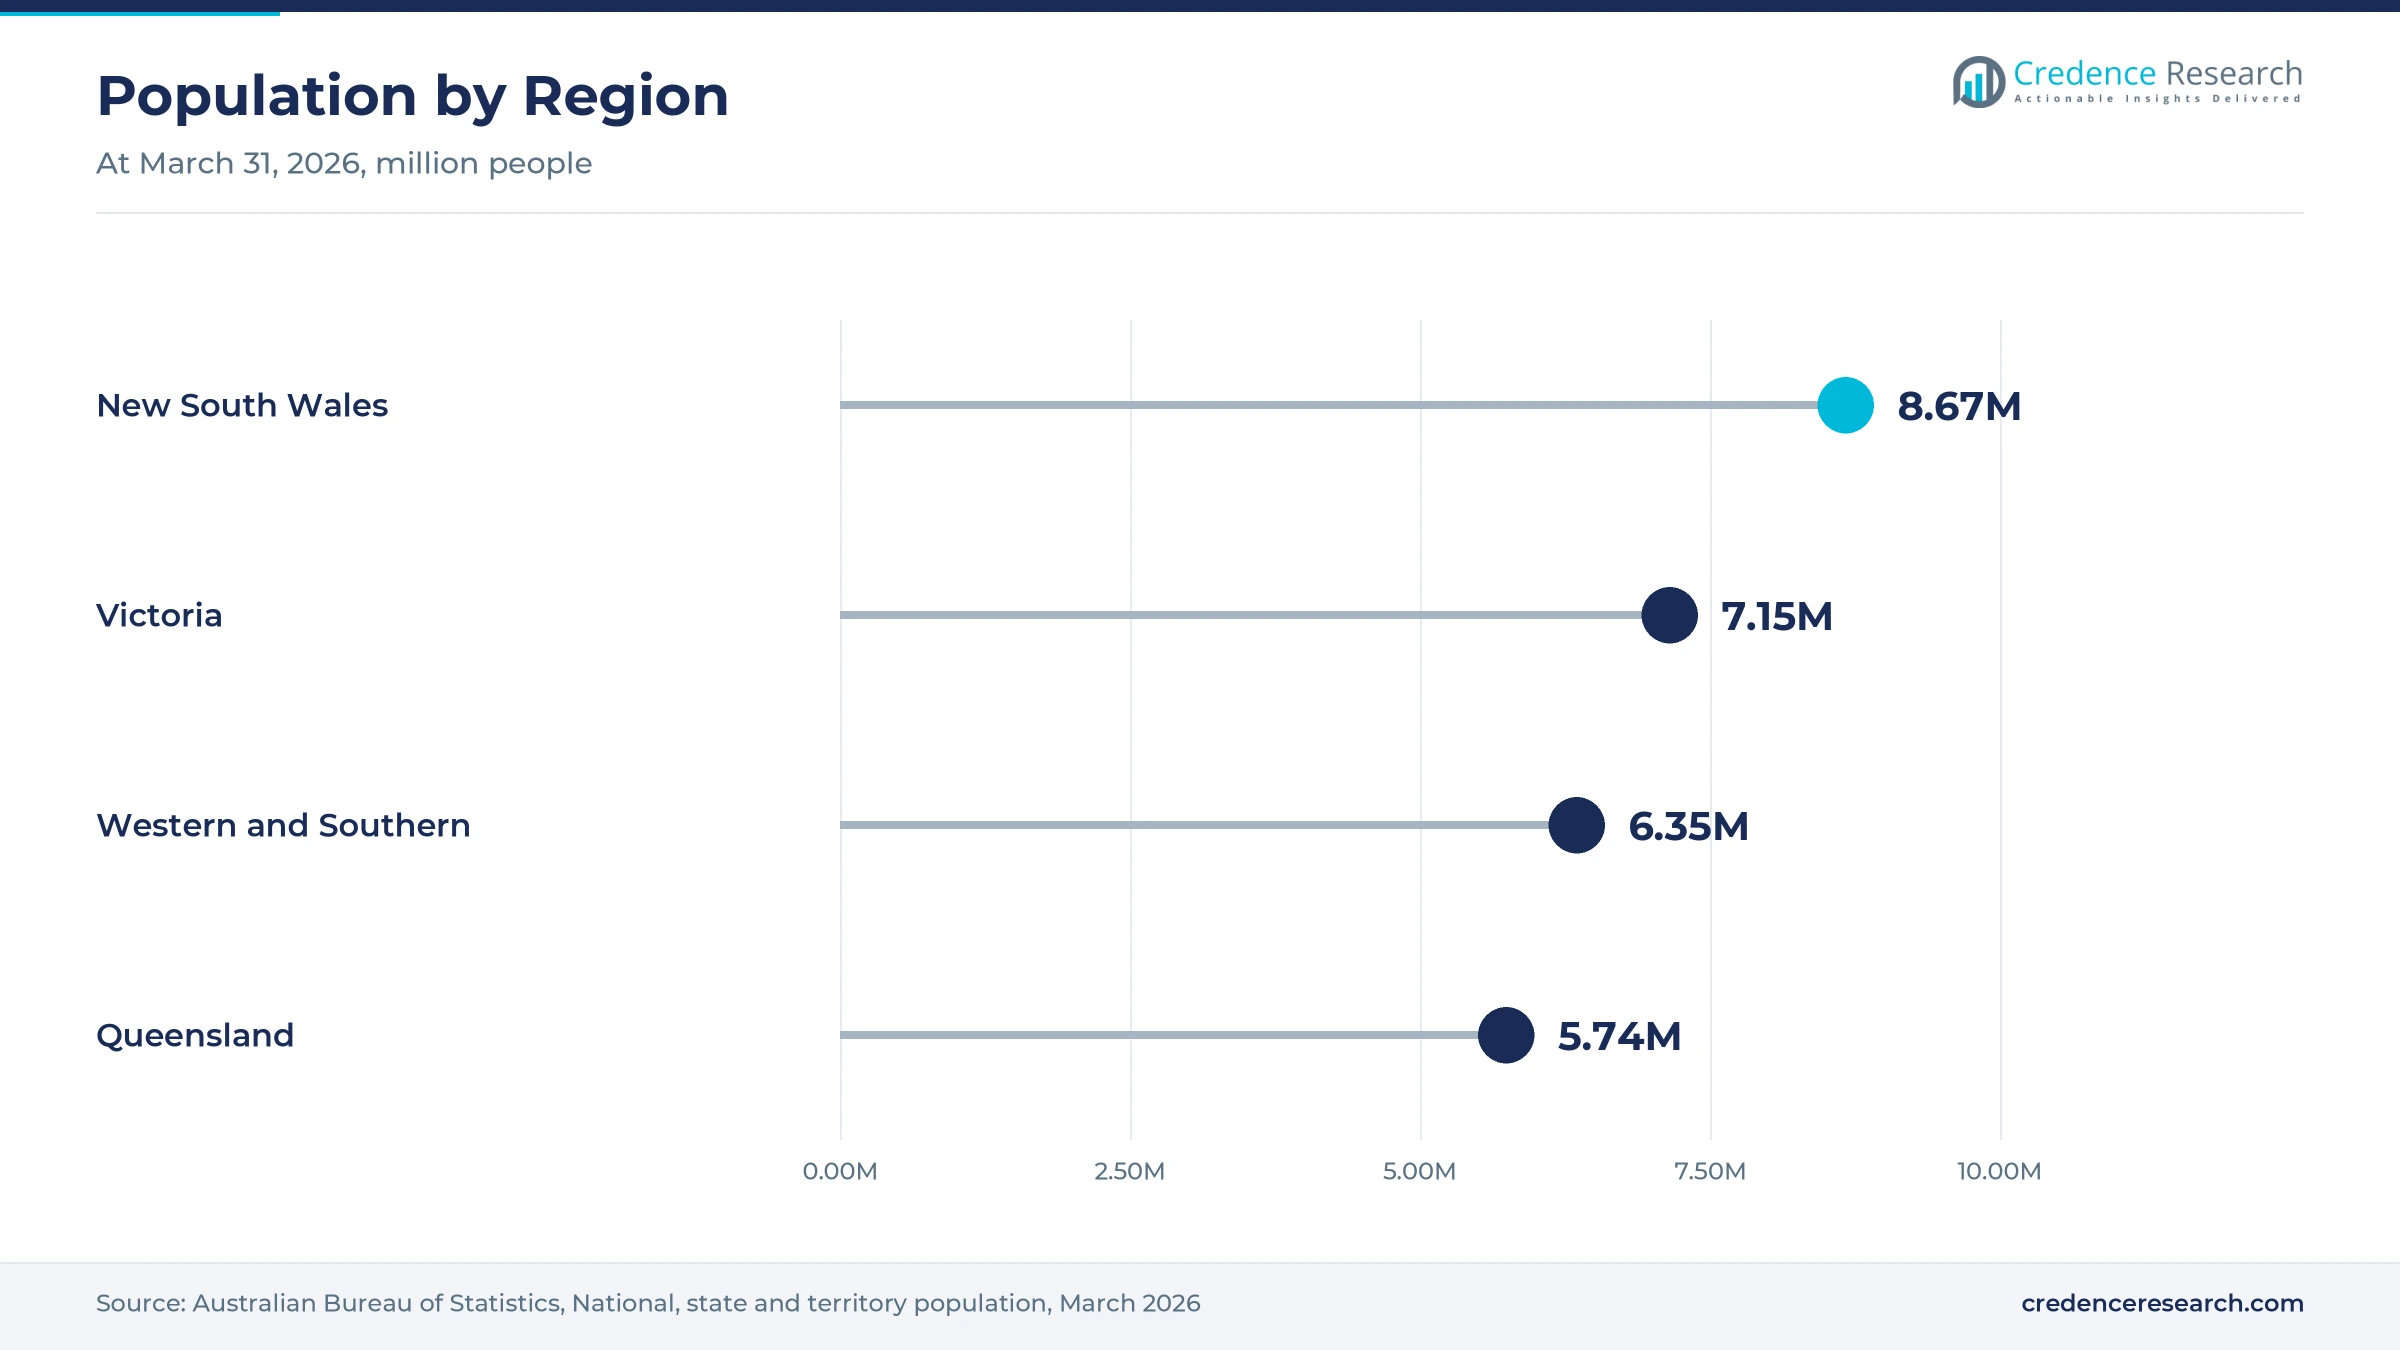
- New South Wales held a 30.9% share of 2025 value, because the state had 8.67 million residents at March 31, 2026, the most of any state.
- Construction and building led end uses with a 38.0% share of 2025 value, because flooring, glazing, framing and sealing work rely on reactive products.
- Henkel began making the Loctite PC 9313 epoxy wearing compound at Kilsyth in Victoria in July 2026 for mining, quarrying and power customers.
- Radiation-curing systems grow fastest at 5.83% a year during 2026–2035, as electronics and medical device makers seek seconds-long cure cycles.
Epoxy and construction lead while electronics grows fastest
Why do epoxy adhesives hold the largest value?
Based on product type, the market is categorized into epoxy adhesives, polyurethane adhesives, acrylic adhesives and silicone and specialty resin adhesives. Epoxy Adhesives led with a 34.0% share of 2025 value, because structural bonding, wear protection and anchoring in construction, mining and power plants depend on them. Acrylic Adhesives grow fastest at 5.23% a year, as vehicle, electronics and signage makers bond mixed materials quickly.
How does construction anchor end-use value?
Based on end-use industry, the market is categorized into construction and building, packaging and industrial manufacturing, automotive and transportation, electronics and medical and specialty manufacturing. Construction and Building led with a 38.0% share of 2025 value, because flooring, glazing, framing and joint sealing use large volumes. Electronics grows fastest at 5.60% a year, as battery, solar and device assembly work expands.
Why does structural assembly lead application value?
Based on application, the market is categorized into structural assembly, flexible bonding, precision component bonding and maintenance and repair bonding. Structural Assembly led with a 36.0% share of 2025 value, because load-bearing joints in buildings, timber and equipment need high-strength products. Precision Component Bonding grows fastest at 5.61% a year, as small parts in electronics and medical devices need exact bead control.
Why does two-component reactive technology lead?
Based on technology, the market is categorized into moisture-curing, two-component reactive, radiation-curing and thermal and anaerobic curing. Two-Component Reactive led with a 37.0% share of 2025 value, because epoxy, acrylic and polyurethane structural products cure fully at room temperature. Radiation-Curing grows fastest at 5.83% a year, as manufacturers want cure on demand with ultraviolet or visible light.
| Segment Group | Leading Sub-segment | Share, 2025 | Fastest-growing Sub-segment | CAGR, 2026–2035 |
|---|---|---|---|---|
| By Product Type | Epoxy Adhesives | 34.0% | Acrylic Adhesives | 5.23% |
| By End-Use Industry | Construction and Building | 38.0% | Electronics | 5.60% |
| By Application | Structural Assembly | 36.0% | Precision Component Bonding | 5.61% |
| By Technology | Two-Component Reactive | 37.0% | Radiation-Curing | 5.83% |
Request a Free Sample
Fill in your details and we'll send you a free sample report.
- Sample data tables & charts
- Research methodology
Home building, precise assembly and energy work lift use
How does housing delivery lift construction bonding demand?
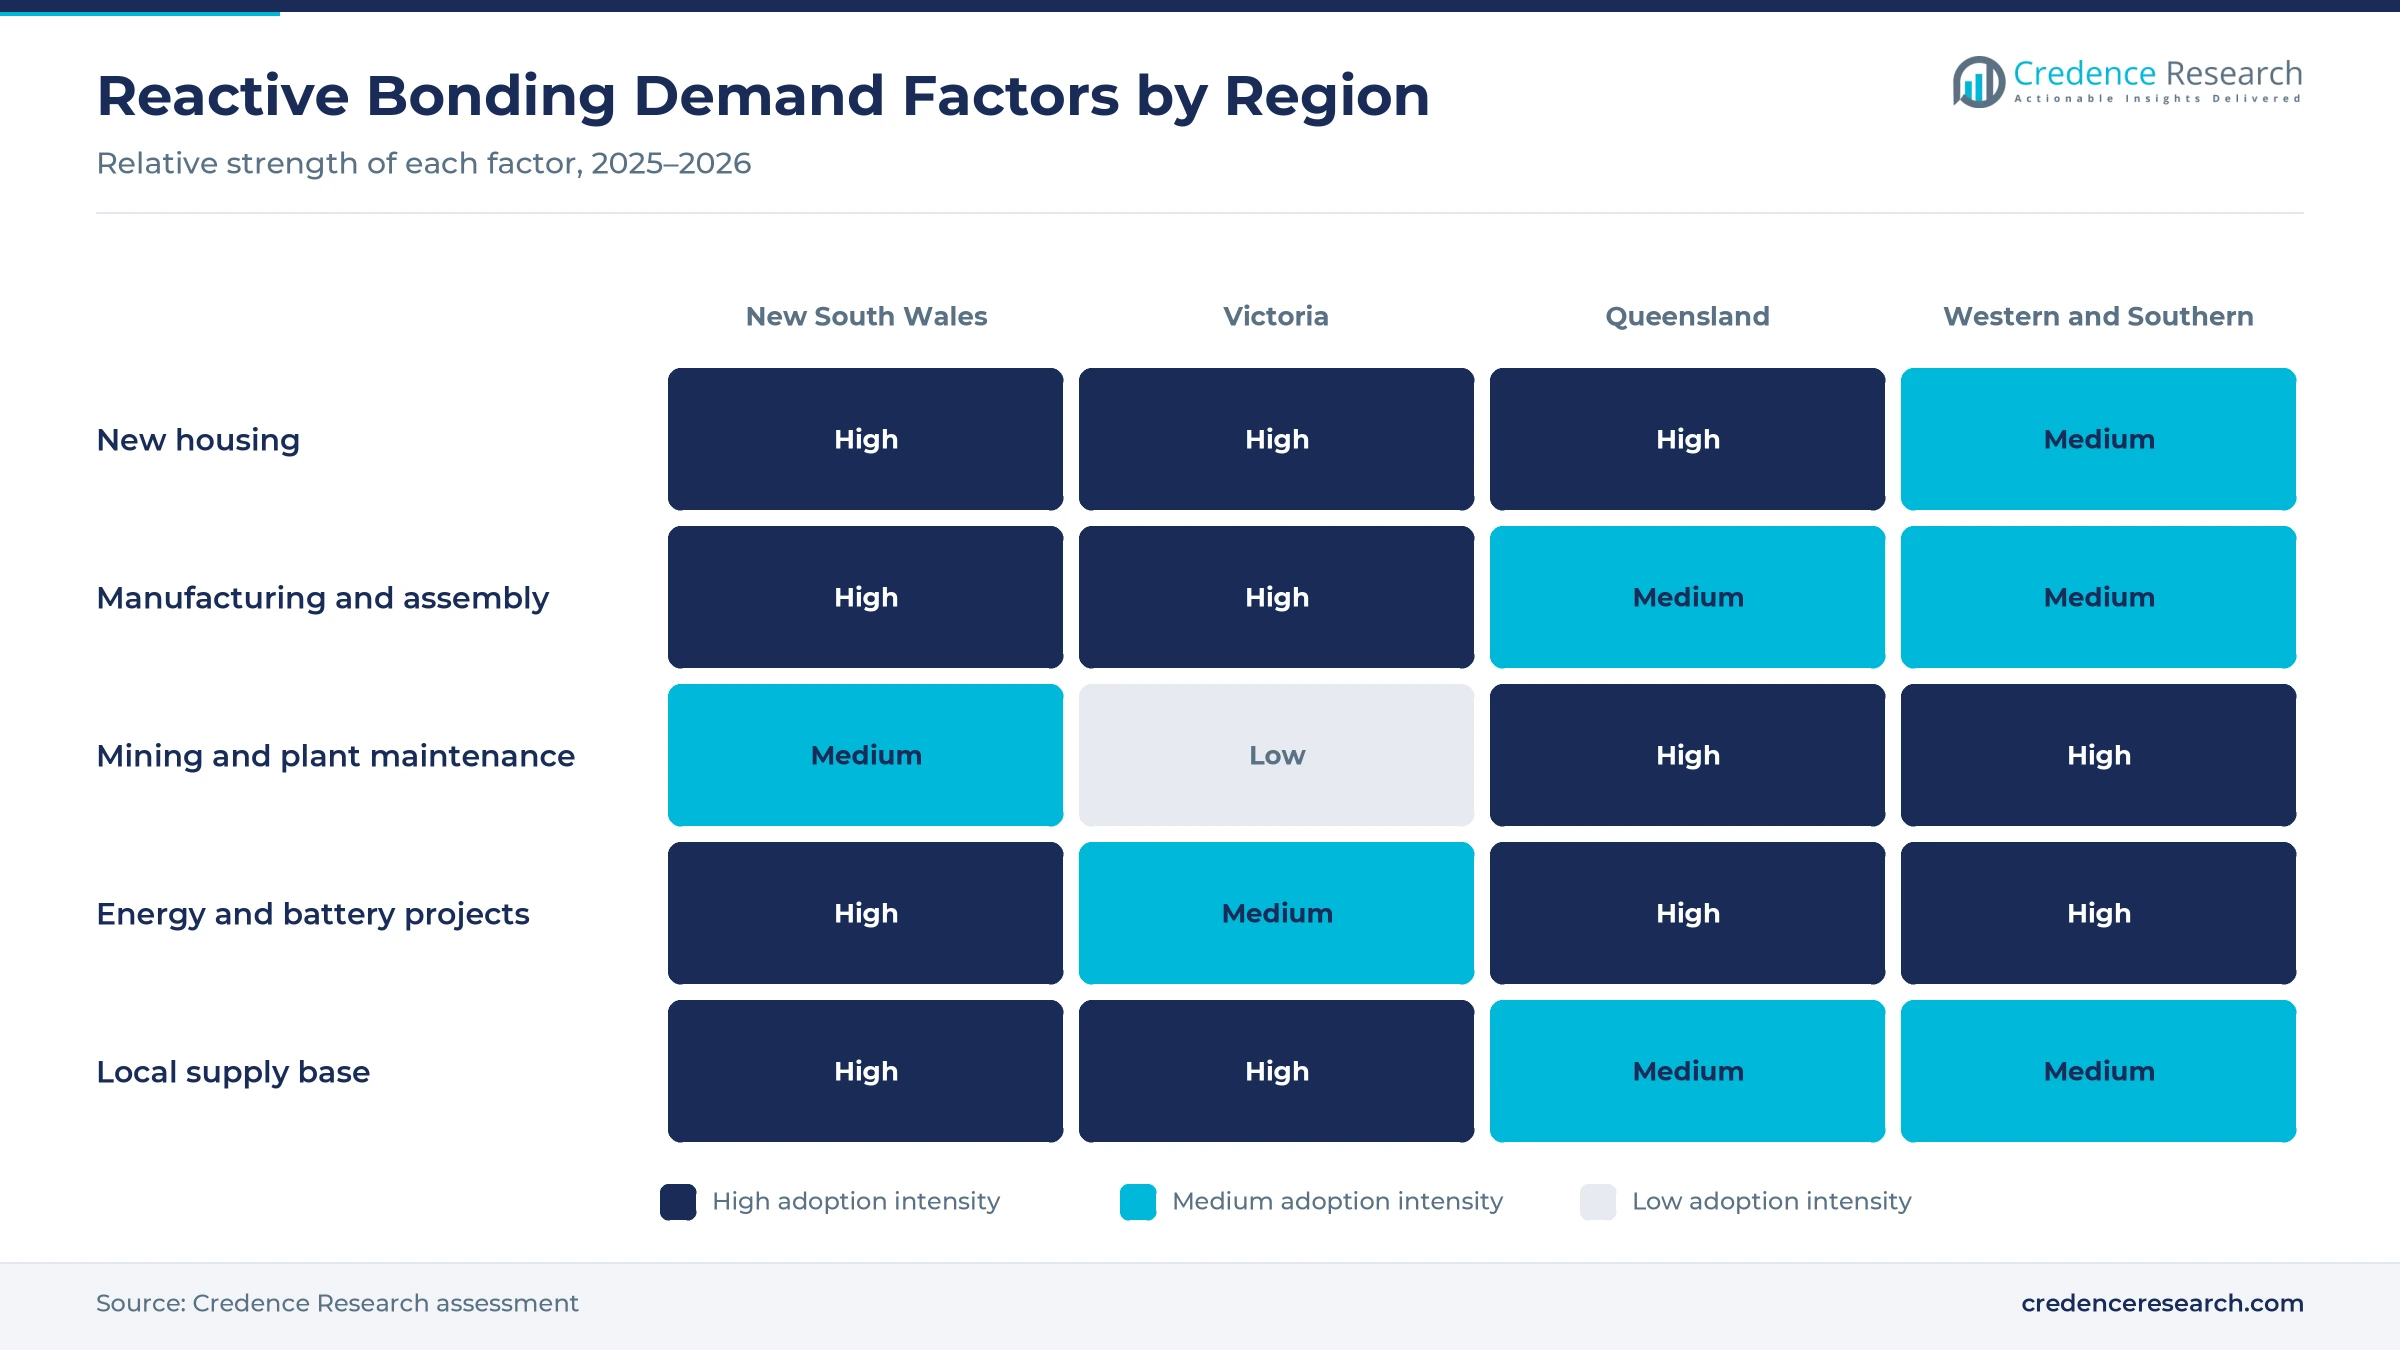
Dwelling commencements rose 7.0% to 52,201 in the June 2026 quarter and were 14.4% higher than a year earlier, according to the federal Treasury. Every new dwelling uses reactive products for flooring, wet areas, framing, glazing and joint sealing, so this pickup feeds straight into construction bonding demand. Completions reached 47,168 in the same quarter, up 15.9% on a year earlier. The national target of 1.2 million new homes over five years from July 1, 2024, keeps this pipeline in place for several years. As a result, construction and building holds 38.0% of 2025 value, because building construction sites buy flooring, glazing and sealing products in large volumes.
Why do precision assembly and productivity goals raise use?
Electric vehicles reached 13.1% of new car sales in 2025, with more than 157,000 sold, according to the Electric Vehicle Council. That shift raises the number of bonded battery, sensor and trim parts that dealers and repairers must service each year. Manufacturers also replace screws, rivets and welds with fast-curing products that cut weight and cycle time on small production lines. Manufacturing added about USD 95.6 billion of value in 2025, or 5.3% of national output, which keeps a steady base of assembly buyers in place. Dymax light-curing products have been sold in Australia through Ellsworth Adhesives since 2012. In turn, precision component bonding grows fastest at 5.61% a year during 2026–2035.
How do energy equipment and maintenance needs add demand?
Renewables generated 42.7% of Australian electricity in 2025, and 1.4 GW of onshore wind was commissioned, according to the Clean Energy Council. Power plants, wind farms and mines use epoxy compounds, potting resins and sealants to protect and repair equipment, so this build adds steady demand. About 2 GW of large-scale battery capacity was also commissioned in 2025, more than triple the 2024 volume. Henkel already makes the PC 7218 epoxy wearing compound locally for mining, power, steel and cement plants. As a result, crews that maintain underground mining equipment keep buying epoxy compounds to rebuild worn chutes, hoppers and elbows.
Why does local formulation and supply security support demand?
Henkel started making the Loctite PC 9313 epoxy wearing compound at Kilsyth in Victoria in July 2026, according to Henkel. The company said local production improves delivery times, supply resilience and product availability across Australia and New Zealand. Bostik makes the Fireban One polyurethane fire sealant at Thomastown, where it has produced Blu Tack since 1970. Sika Australia runs sites in New South Wales, Queensland, South Australia, Victoria and Western Australia. In turn, buyers can order reactive products faster and in smaller lots, which helps two-component reactive technology keep 37.0% of 2025 value across trade and industrial buyers in every state.
Low-emission sealants and engineered timber gain ground
How is the shift to low-emission sealants changing products?
Sika Australia markets Sikaflex PRO-3 Purform as a moisture-curing, elastic polyurethane sealant with ultra-low emissions for floors, walls and civil structures. The product reflects a wider shift toward low-emission grades, because rating tools and site safety rules reward lower solvent and isocyanate exposure. Selleys also publishes volatile organic compound test certificates for interior sealants and wet area silicone. With 47,168 dwellings completed in the June 2026 quarter, up 15.9% on a year earlier, the volume of interior sealing work keeps this shift in front of formulators. As a result, suppliers reformulate older grades to meet project specifications for homes and apartments, a year after commencements were falling 28.9% on an annual basis.
Why is the rise of engineered timber notable for bonding?
Henkel planned local production of Loctite polyurethane adhesives for engineered wood, mass timber and load-bearing construction at Kilsyth from the first half of 2023. These adhesives can bond timber components without industrial solvents or formaldehyde, and Henkel supports users through innovation and application labs in Sydney and Auckland. Cross-laminated and glued laminated timber depend on structural adhesives that cure reliably in the factory, so each mass timber project adds load-bearing bonded joints. Victoria, home to the Kilsyth plant, holds 23.0% of 2025 value and grows at 4.70% a year. In turn, structural assembly holds 36.0% of 2025 value, because timber, steel and concrete elements need load-bearing joints that pass engineering approval.
Can battery and electric vehicle assembly open new demand?
More than 268,000 home batteries were installed in 2025, a 260% rise on 2024, according to Clean Energy Council data. Battery packs, chargers and inverters use potting, gap filling and thermally conductive bonding, so this growth opens new demand for reactive products. The Clean Energy Regulator also recorded 791 MW of small-scale solar across 77,000 systems in the first quarter of 2026. Electric vehicles took a record 16.7% of new car sales in December 2025, which widens the base of bonded parts in service. As a result, electronics grows fastest at 5.60% a year, as energy storage systems need protected boards.
Is there room to grow in light-cured medical and device work?
Ellsworth Adhesives became an authorized Dymax distributor in Australia in January 2012, supplying light-curable adhesives and curing equipment. Ultraviolet and visible light products cure in seconds and suit needles, catheters, sensors and optical parts, which gives device makers room to grow output. Dymax products in that range also include epoxy resins, cyanoacrylates and dispensing systems. Manufacturing held 5.3% of national output in 2025, according to the World Bank, so specialist device makers form a small but high-value niche. In turn, radiation-curing grows fastest at 5.83% a year during 2026–2035, because these makers pay more for speed, clarity and repeatable cure.
Labor, import costs and cure control limit growth
How do labor shortages slow construction bonding work?
Tilers, flooring installers and glaziers are needed across housing, commercial and infrastructure jobs at the same time, which leaves many sites short of skilled trades. As a result, projects can wait weeks for workers, which delays purchases of sealants and flooring products. Suppliers respond with faster-curing grades, cartridge formats and site training that save time on each job. This constraint remains strongest in fast-growing suburbs and regional areas.
Why do imported raw materials raise costs?
Most resins, isocyanates and silicone polymers used in local formulation come from overseas suppliers, which exposes formulators to global price swings. In turn, freight rates and exchange rate moves feed directly into product prices for merchants and manufacturers. Formulators respond with local blending, larger stock holdings and price reviews, which protect supply but tie up working capital. This pressure favors suppliers with global purchasing scale and long contracts.
How does cure control limit adoption in some plants?
Reactive products need correct mixing, surface preparation, temperature and humidity to reach full strength, which makes process control essential on every line. As a result, poor practice can cause bond failures, warranty claims and lost trust in adhesive joints. Suppliers respond with technical service, metered dispensing and training for production staff. This barrier is greatest for small manufacturers that do not employ dedicated process engineers.
Why do safety rules on isocyanates add compliance work?
Workers handling reactive polyurethane products need training, ventilation and protective equipment, which adds cost and paperwork for smaller contractors. In turn, some contractors may choose other materials when compliance feels costly or complex. Suppliers respond with low-monomer grades, clearer safety data and hybrid polymer alternatives. This shift changes the product mix more than it reduces overall demand for reactive bonding across construction and manufacturing.
New South Wales leads while Queensland grows fastest
| Region | Value, 2025 (USD million) | Share, 2025 | CAGR, 2026–2035 |
|---|---|---|---|
| New South Wales | 75.2 | 30.9% | 4.60% |
| Western, Southern and Territory Markets | 66.0 | 27.1% | 4.75% |
| Victoria | 56.0 | 23.0% | 4.70% |
| Queensland | 46.3 | 19.0% | 5.10% |
Why does New South Wales hold the top share?
New South Wales held a 30.9% share of 2025 value and grows at 4.60% a year, because the state had 8.67 million residents at March 31, 2026, the most of any state. Sika Australia operates a site at Wetherill Park in western Sydney, while Soudal has run its wholly owned Australian affiliate from Sydney since 2018. As a result, this zone buys the largest volume of construction and packaging products.
How does Victoria support local production and demand?
Victoria held a 23.0% share of 2025 value and grows at 4.70% a year, because the state added 109,500 residents in the year to March 2026. Henkel makes epoxy wearing compounds at Kilsyth, and Bostik produces sealants at Thomastown. Sika Australia also lists sites at Dandenong South and Keysborough in Melbourne. In turn, this zone combines strong housing demand with the largest local manufacturing base for reactive bonding products.
Why is Queensland growing fastest?
Queensland held a 19.0% share of 2025 value and grows fastest at 5.10% a year, because its population rose 1.6% to 5.74 million in the year to March 2026. Mining, power generation and renewable projects across the state use epoxy repair compounds and sealants. Sika Australia lists sites at Brendale and Pinkenba near Brisbane. As a result, this zone adds construction and maintenance demand faster than the others.
What supports demand in the western and southern markets?
The Western, Southern and Territory Markets held a 27.1% share of 2025 value and grow at 4.75% a year, because Western Australia grew fastest at 2.1% in the year to March 2026. Sika runs a plant at Bibra Lake near Perth and sites at Gepps Cross and Para Hills in Adelaide. In turn, mining maintenance and housing support demand across this zone.
Local production, housing data and energy milestones
| Development | Status and market relevance |
|---|---|
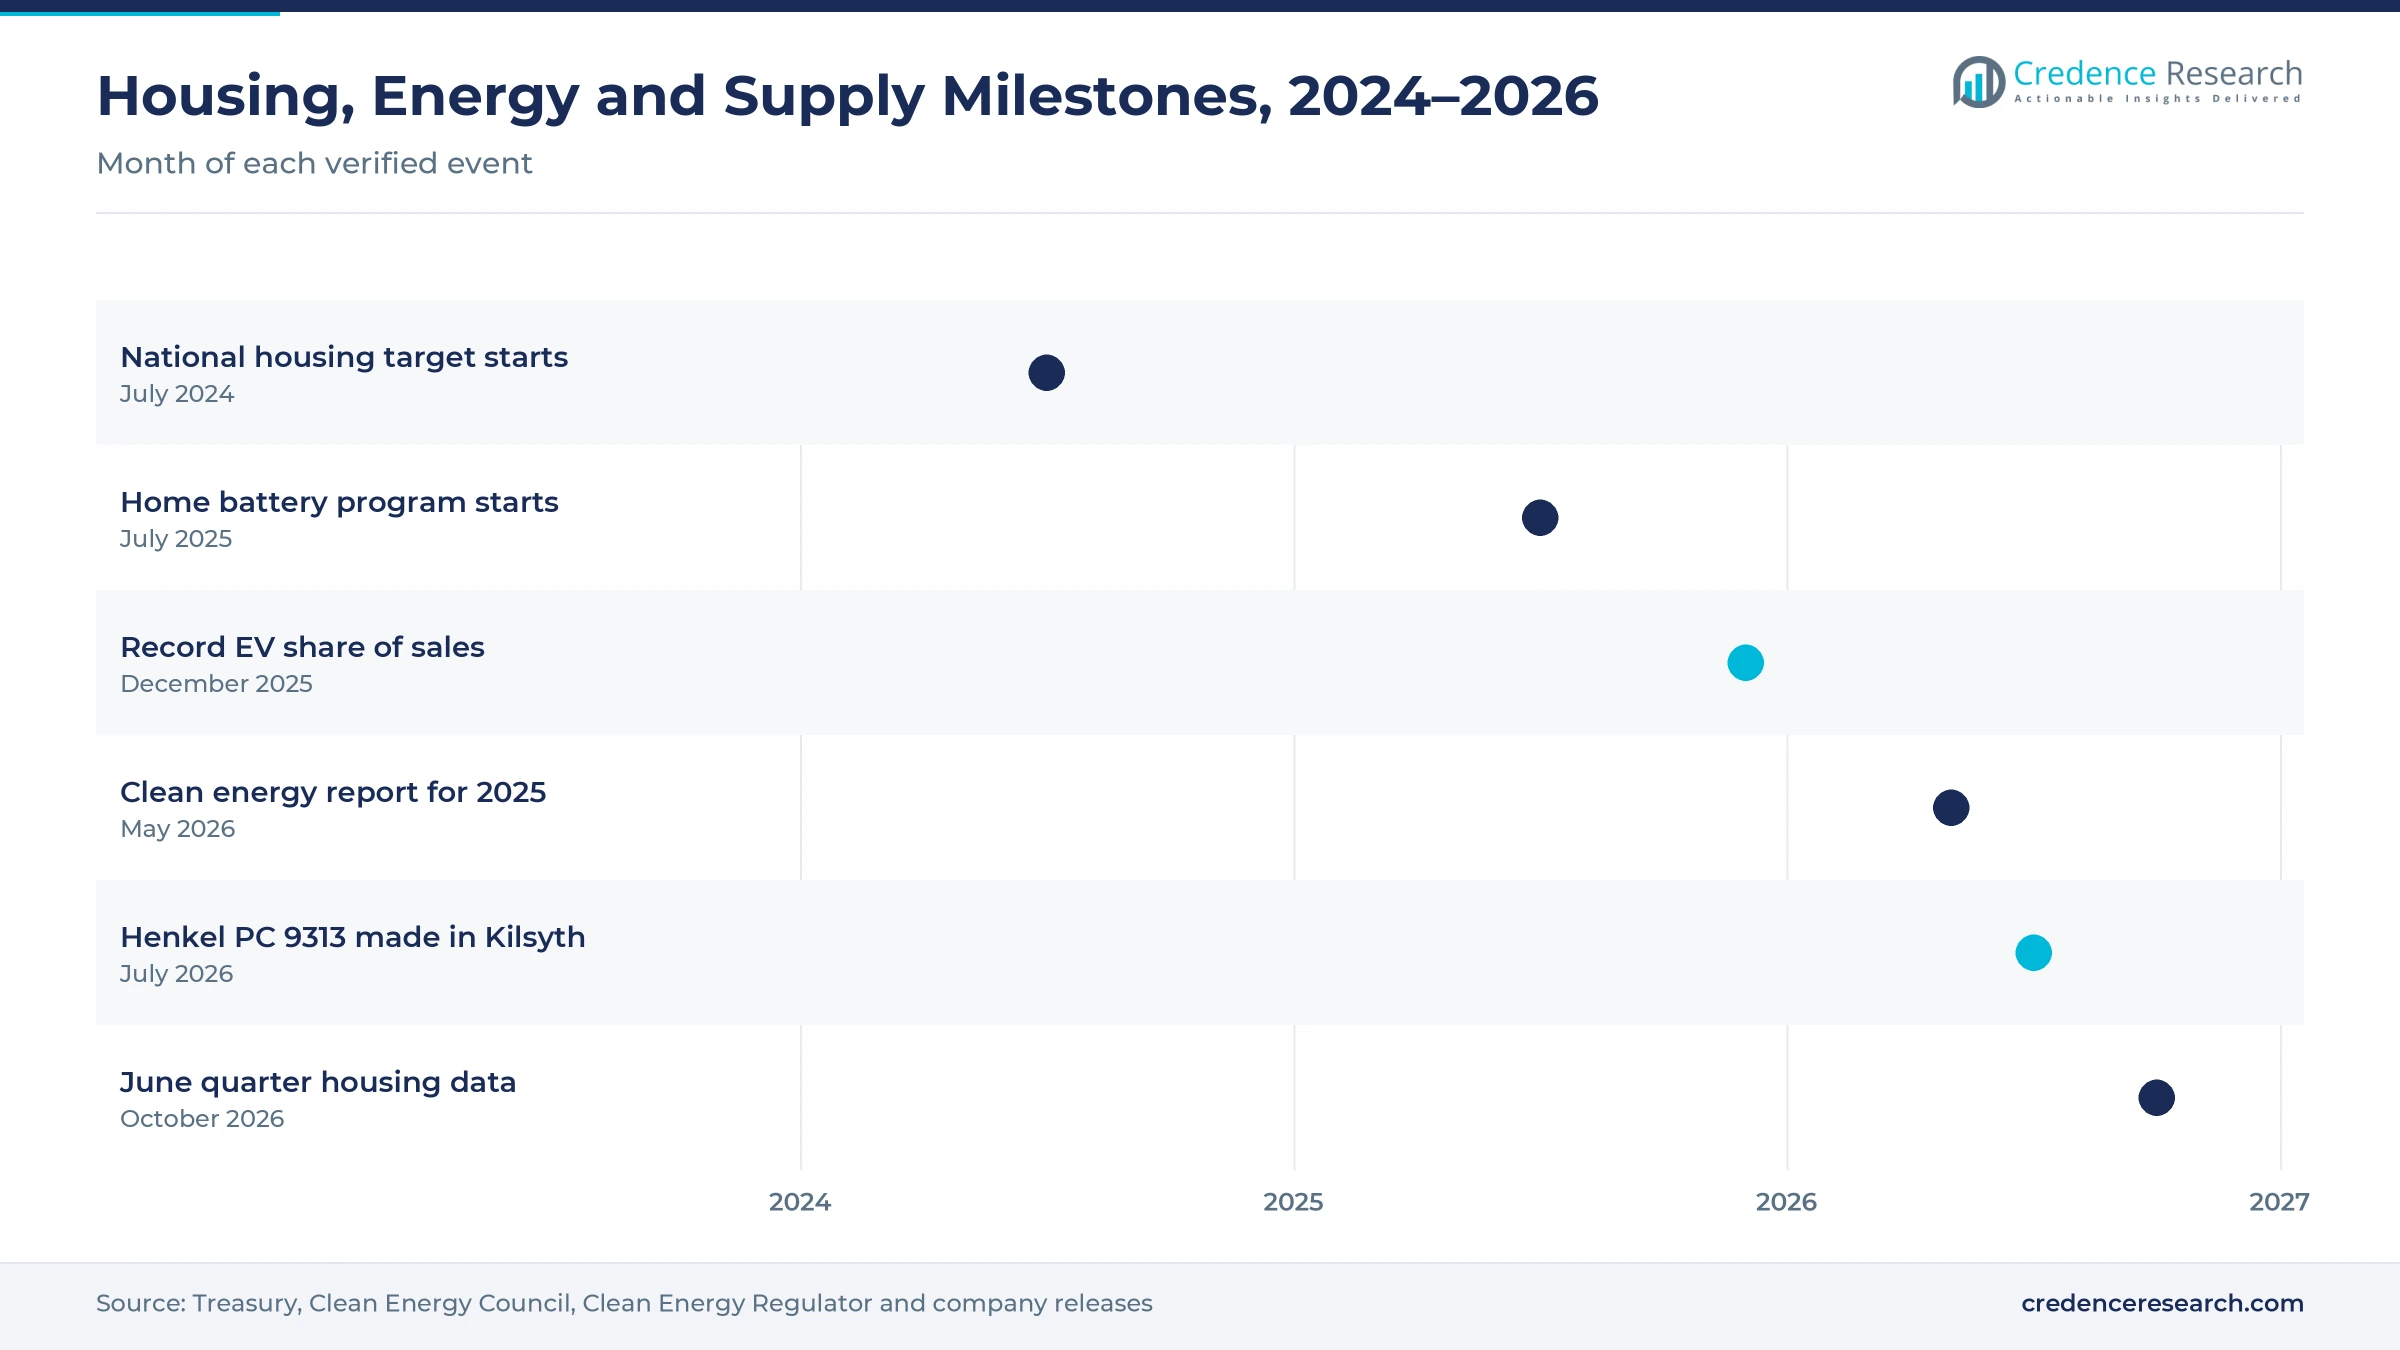
| In July 2024, the national target of 1.2 million new homes over five years began. | Sets a long housing pipeline for construction bonding |
| In July 2025, the federal home battery program began, and more than 268,000 home batteries were installed that year. | Raises demand for potting and sealing in energy systems |
| In May 2026, the Clean Energy Council reported that renewables supplied 42.7% of electricity in 2025. | Confirms growth in energy equipment that needs protection |
| In July 2026, Henkel launched the Australian-made Loctite PC 9313 epoxy wearing compound at Kilsyth. | Adds local supply for mining and power maintenance |
| In October 2026, federal data showed dwelling commencements up 14.4% year on year in the June quarter. | Signals stronger near-term construction demand |
Moisture, two-part and light cure systems set the pace
- Moisture-curing products react with humidity in the air, which suits polyurethane and hybrid sealants used in flooring, glazing and joints.
- Two-component reactive systems mix a resin and hardener at the point of use, which gives epoxy and acrylic products high structural strength.
- Radiation-curing products harden under ultraviolet or visible light within seconds, which suits electronics, optics and medical device assembly.
- Thermal and anaerobic curing use heat or the absence of air to cure, which suits threadlocking, retaining and bonded metal parts in pumps, gearboxes and other machinery.
Need a Custom Version of This Report?
Tailor the scope, geography, or segments to your exact requirements.
- Custom geography or segment scope
- Direct access to our analyst team
Global formulators and local brands share the field
Competition combines global formulators with long-standing Australian brands that hold strong positions in trade and retail channels. Henkel makes Loctite epoxy wearing compounds at Kilsyth in Victoria and launched the Australian-made PC 9313 in July 2026 for mining, quarrying and power customers. Sika Australia runs sites in five states and markets moisture-curing polyurethane sealants such as Sikaflex PRO-3 Purform. Bostik makes polyurethane fire sealants at Thomastown, while Selleys sells Liquid Nails, No More Gaps and Spakfilla to trade professionals and do-it-yourself buyers. Soudal took full ownership of its Sydney distributor in 2018, and H.B. Fuller added Advanced Adhesives in Sydney and Auckland in 2016. 3M Australia sells Scotch-Weld two-part epoxy and acrylic structural adhesives, and Dymax light-curing products reach local makers through Ellsworth Adhesives. Suppliers compete on cure speed, technical service, compliance and local stock.
Which formulators and brands serve Australian buyers?
| Company | Type | Role in the market |
|---|---|---|
| Henkel Australia | Manufacturer | Makes Loctite epoxy compounds at Kilsyth |
| Sika Australia | Manufacturer | Runs sites in five states |
| Bostik Australia | Manufacturer | Makes polyurethane fire sealants at Thomastown |
| Selleys | Brand owner | Sells Liquid Nails and No More Gaps to trade and retail |
| Soudal Australia | Supplier | Serves the market from Sydney |
| H.B. Fuller Australia | Manufacturer | Serves packaging, woodworking and assembly |
| 3M Australia | Supplier | Sells Scotch-Weld two-part epoxy and acrylic structural adhesives |
| Dymax | Manufacturer | Sells light-curing products through Ellsworth Adhesives |
Credence Research view on reactive bonding demand
Credence Research's view is that Australian demand for reactive bonding products will grow steadily because housing delivery, energy equipment and plant maintenance keep adding bonded and sealed joints. Epoxy products and construction uses remain the largest segments, while acrylic adhesives, electronics and radiation-curing systems grow fastest. Suppliers that combine local production, technical service and low-emission grades should gain the most share by 2035, while Queensland offers the strongest regional growth among the four zones. Buyers that standardize cure processes and qualify local suppliers early should also face fewer delays as housing and energy projects peak.
How the national reactive bonding estimate was built
The report uses 2025 as the base year on a calendar basis, and market values come from the Credence Research model. That model combines official population and building statistics, World Bank manufacturing data, electric vehicle and clean energy data, and company releases. Segment splits and zone growth rates are Credence Research estimates, while zone shares follow the client's regional split. Sources used are official statistics, regulator and industry body releases, and company releases, and no interviews or surveys were used.
Housing and energy build carry growth to 2035
The Australia curing adhesives market is expected to reach USD 396.7 million by 2035, a 4.76% CAGR during 2026–2035, as housing, manufacturing, energy equipment and maintenance keep adding bonded joints. Growth should be strongest in acrylic adhesives, electronics, precision component bonding, radiation-curing systems and Queensland, because these areas gain most from new assembly lines and projects. Labor shortages, raw material costs and cure control could slow some buyers, while local production and low-emission grades keep supply firm.
Frequently Asked Questions
How big is the Australia curing adhesives market?
Which product type leads reactive bonding value?
Which region leads the market?
How does home building affect demand?
Which technology grows fastest?
What does Henkel make in Australia?
Who are the leading companies in the Australian curing adhesives market?
What are the main challenges for reactive bonding suppliers?
Table of Content
Chapter 1 Market Segmentation
- 1.1 Segmentation Framework
- 1.1.1 Product and Service Classification
- 1.1.2 Application and End-Use Classification
- 1.1.3 Technology and Solution Classification
- 1.1.4 Customer and Distribution Channel Classification
- 1.1.5 Geographic Segmentation
- 1.1.6 Market Segment Definitions and Boundaries
- 1.2 By Product Type
- 1.2.1 Epoxy Adhesives
- 1.2.2 Polyurethane Adhesives
- 1.2.3 Acrylic Adhesives
- 1.2.4 Silicone and Specialty Resin Adhesives
- 1.3 By End-Use Industry
- 1.3.1 Construction and Building
- 1.3.2 Packaging and Industrial Manufacturing
- 1.3.3 Automotive and Transportation
- 1.3.4 Electronics
- 1.3.5 Medical and Specialty Manufacturing
- 1.4 By Application
- 1.4.1 Structural Assembly
- 1.4.2 Flexible Bonding
- 1.4.3 Precision Component Bonding
- 1.4.4 Maintenance and Repair Bonding
- 1.5 By Technology
- 1.5.1 Moisture-Curing
- 1.5.2 Two-Component Reactive
- 1.5.3 Radiation-Curing
- 1.5.4 Thermal and Anaerobic Curing
Chapter 2 Introduction
- 2.1 Report Objectives and Scope
- 2.2 Product Definition and Industry Terminology
- 2.3 Market Inclusions and Exclusions
- 2.4 Research Process
- 2.4.1 Primary Research and Expert Interviews
- 2.4.2 Secondary Research and Source Review
- 2.4.3 Top-Down and Bottom-Up Estimation
- 2.4.4 Data Triangulation and Verification
- 2.5 Market Size Measurement Basis
- 2.5.1 2025: USD 243.5 million → 2035: USD 396.7 million
- 2.6 Historical and Forecast Reference Periods
- 2.6.1 Historical Period: 2018-2025
- 2.6.2 Base Year: 2025
- 2.6.3 Forecast Period: 2025-2035
- 2.7 Research Assumptions and Limitations
Chapter 3 Executive Summary
- 3.1 Market Snapshot and Key Findings
- 3.2 Base-Year Market Size, 2025
- 3.3 Forecast Market Size, 2035
- 3.4 Revenue and Volume Growth Outlook
- 3.5 Key Demand and Supply Indicators
- 3.6 Leading Market Segments
- 3.7 Fastest-Growing Market Opportunities
- 3.8 Regional Performance Highlights
- 3.9 Technology and Industry Transformation
- 3.10 Competitive Landscape Summary
- 3.11 Analyst View and Strategic Implications
Chapter 4 Australia Curing Adhesives Market Trends and Developments
- 4.1 Historical Industry Development, 2018-2025
- 4.2 Recent Market Trends and Developments
- 4.3 Demand and Customer Behavior Trends
- 4.4 Technology and Product Innovation
- 4.5 Artificial Intelligence, Automation and Digitalization
- 4.6 Local Manufacturing and Supply Chain Realignment
- 4.7 Industry Partnerships, Mergers and Acquisitions
- 4.8 Sustainability and Circular Economy Developments
- 4.9 Government and Private Sector Investment Trends
- 4.10 Emerging Business Models and Commercialization
- 4.11 Industry Developments and Announcements
Chapter 5 Australia Curing Adhesives Market Production, Supply and Demand Analysis
- 5.1 Demand Trend and Consumption Analysis, 2018-2025
- 5.2 Demand Forecast, 2025-2035
- 5.3 Production and Output Trend, 2018-2025
- 5.4 Production and Output Forecast, 2025-2035
- 5.5 Installed Capacity and Capacity Utilization
- 5.6 Company-Wise Production Plants and Statistics
- 5.6.1 Installed Production Capacity
- 5.6.2 Actual Production
- 5.6.3 Planned Capacity and Expansion Targets
- 5.7 Supply Chain Structure and Procurement Trends
- 5.8 Supply-Demand Gap and Bottlenecks
- 5.9 Import Dependence and Sourcing Structure
- 5.10 Contract Manufacturing and Outsourcing
- 5.11 Regional Supply and Demand Concentration
Chapter 6 Australia Curing Adhesives Market Pricing Analysis
- 6.1 Pricing Structure and Measurement
- 6.2 Historical Pricing Trends, 2018-2025
- 6.3 Pricing Outlook, 2025-2035
- 6.4 Average Selling Price and Unit Economics
- 6.5 Pricing by Product and Market Segment
- 6.6 Geographic Pricing Differences
- 6.7 Key Input, Energy, Labor and Logistics Costs
- 6.8 Contract Pricing and Purchasing Models
- 6.9 Pricing Sensitivity and Competitive Positioning
- 6.10 Price, Margin and Profitability Implications
Chapter 7 Australia Curing Adhesives Market Dynamics
- 7.1 Market Growth Drivers
- 7.1.1 Demand-Side Drivers
- 7.1.2 Technology and Innovation Drivers
- 7.1.3 Infrastructure and Investment Drivers
- 7.1.4 Regulatory and Policy Drivers
- 7.2 Market Restraints
- 7.2.1 Cost and Affordability Constraints
- 7.2.2 Technology and Adoption Barriers
- 7.2.3 Supply Chain and Operational Constraints
- 7.3 Market Challenges
- 7.3.1 Competitive Pressure and Margin Erosion
- 7.3.2 Skills, Infrastructure and Implementation Gaps
- 7.4 Emerging Market Opportunities
- 7.5 Market Dynamics Impact and Time-Horizon Assessment
Chapter 8 Australia Curing Adhesives Value Chain Analysis
- 8.1 Industry Value Chain Overview
- 8.2 Upstream Suppliers and Critical Inputs
- 8.3 Technology and Component Providers
- 8.4 Manufacturing or Service Delivery
- 8.5 Distribution, Channel Partners and Integrators
- 8.6 Downstream Applications and End Users
- 8.7 Value Addition and Profit Pools
- 8.8 Vertical Integration and Outsourcing
- 8.9 Supplier Concentration and Risk
- 8.10 Supply Chain Localization and Resilience
Chapter 9 Australia Curing Adhesives Market Regulations and Policies
- 9.1 Relevant Laws, Standards and Compliance Frameworks
- 9.2 Product, Service, Safety and Quality Requirements
- 9.3 Government Policies, Incentives and Subsidies
- 9.4 Imports, Exports and Trade Barriers
- 9.5 Public Procurement and Local Content Requirements
- 9.6 Environmental and Sustainability Compliance
- 9.7 Upcoming Policy Changes and Market Implications
Chapter 10 Australia Curing Adhesives Market Hotspots and Opportunities
- 10.1 Market Opportunity Mapping and Growth Hotspots
- 10.2 High-Growth Applications and Customer Groups
- 10.3 Underserved Markets and White-Space Opportunities
- 10.4 Emerging Technology and Product Opportunities
- 10.5 New Capacity and Investment Hotspots
- 10.6 Market Entry and Expansion Opportunities
- 10.7 Distribution and Partnership Opportunities
- 10.8 Near-Term and Long-Term Commercial Potential
- 10.9 Opportunity Attractiveness and Execution Risks
Chapter 11 Australia Curing Adhesives Market Outlook, 2025-2035
- 11.1 Market Size and Analysis
- 11.1.1 Revenue (Market Measurement: 2025: USD 243.5 million → 2035: USD 396.7 million)
- 11.1.2 Market Volume and Quantity Sold
- 11.1.3 Historical Market Size, 2018-2025
- 11.1.4 Base-Year Market Size, 2025
- 11.2 Market Forecast, 2025-2035
- 11.2.1 Revenue Forecast to 2035
- 11.2.2 Volume Forecast to 2035
- 11.2.3 CAGR and Year-on-Year Growth
- 11.2.4 Incremental Revenue Opportunity
- 11.3 Forecast Assumptions and Scenario Analysis
- 11.3.1 Base-Case Forecast
- 11.3.2 Optimistic and Conservative Scenarios
- 11.3.3 Technology, Pricing and Policy Sensitivities
- 11.4 Market Attractiveness and Growth Outlook
Chapter 12 Australia Curing Adhesives Market Segmentation and Outlook
- 12.1 Segmentation Summary and Market Shares, 2025
- 12.2 Largest and Fastest-Growing Segments
- 12.3 By Product Type - Market Size and Forecast, 2025-2035
- 12.3.1 Segment Definition and Scope
- 12.3.2 Historical Market Size, 2018-2025
- 12.3.3 Revenue Forecast, 2025-2035
- 12.3.4 Volume Forecast, 2025-2035
- 12.3.5 Base-Year Market Share, 2025
- 12.3.6 Segment CAGR and Growth Drivers
- 12.3.7 Subsegment Market Size and Forecast
- 12.3.7.1 Epoxy Adhesives
- 12.3.7.2 Polyurethane Adhesives
- 12.3.7.3 Acrylic Adhesives
- 12.3.7.4 Silicone and Specialty Resin Adhesives
- 12.3.8 Subsegment Pricing and Adoption Trends
- 12.3.9 Leading Suppliers and Competition
- 12.3.10 Regional Demand and Opportunities
- 12.4 By End-Use Industry - Market Size and Forecast, 2025-2035
- 12.4.1 Segment Definition and Scope
- 12.4.2 Historical Market Size, 2018-2025
- 12.4.3 Revenue Forecast, 2025-2035
- 12.4.4 Volume Forecast, 2025-2035
- 12.4.5 Base-Year Market Share, 2025
- 12.4.6 Segment CAGR and Growth Drivers
- 12.4.7 Subsegment Market Size and Forecast
- 12.4.7.1 Construction and Building
- 12.4.7.2 Packaging and Industrial Manufacturing
- 12.4.7.3 Automotive and Transportation
- 12.4.7.4 Electronics
- 12.4.7.5 Medical and Specialty Manufacturing
- 12.4.8 Subsegment Pricing and Adoption Trends
- 12.4.9 Leading Suppliers and Competition
- 12.4.10 Regional Demand and Opportunities
- 12.5 By Application - Market Size and Forecast, 2025-2035
- 12.5.1 Segment Definition and Scope
- 12.5.2 Historical Market Size, 2018-2025
- 12.5.3 Revenue Forecast, 2025-2035
- 12.5.4 Volume Forecast, 2025-2035
- 12.5.5 Base-Year Market Share, 2025
- 12.5.6 Segment CAGR and Growth Drivers
- 12.5.7 Subsegment Market Size and Forecast
- 12.5.7.1 Structural Assembly
- 12.5.7.2 Flexible Bonding
- 12.5.7.3 Precision Component Bonding
- 12.5.7.4 Maintenance and Repair Bonding
- 12.5.8 Subsegment Pricing and Adoption Trends
- 12.5.9 Leading Suppliers and Competition
- 12.5.10 Regional Demand and Opportunities
- 12.6 By Technology - Market Size and Forecast, 2025-2035
- 12.6.1 Segment Definition and Scope
- 12.6.2 Historical Market Size, 2018-2025
- 12.6.3 Revenue Forecast, 2025-2035
- 12.6.4 Volume Forecast, 2025-2035
- 12.6.5 Base-Year Market Share, 2025
- 12.6.6 Segment CAGR and Growth Drivers
- 12.6.7 Subsegment Market Size and Forecast
- 12.6.7.1 Moisture-Curing
- 12.6.7.2 Two-Component Reactive
- 12.6.7.3 Radiation-Curing
- 12.6.7.4 Thermal and Anaerobic Curing
- 12.6.8 Subsegment Pricing and Adoption Trends
- 12.6.9 Leading Suppliers and Competition
- 12.6.10 Regional Demand and Opportunities
- 12.7 Segment Growth Comparison
- 12.8 Segment Attractiveness and Priority Matrix
Chapter 13 Australia Curing Adhesives End-Use and Application Market Outlook
- 13.1 End-Use Industry and Customer Demand Structure
- 13.2 Leading Applications and Customer Groups
- 13.3 End-Use Market Size, Share and Forecast
- 13.4 Major End-Use Industry Deep Dives
- 13.4.1 Customer Requirements and Use Cases
- 13.4.2 Demand and Replacement Cycles
- 13.4.3 Technical and Regulatory Considerations
- 13.4.4 Purchasing and Procurement Models
- 13.4.5 Leading Vendors and Distribution Channels
- 13.4.6 Forecast and Commercial Opportunities
- 13.5 Emerging Applications and Cross-Segment Demand
- 13.6 End-Use Industry Investment Priorities
Chapter 14 Australia Curing Adhesives Geographic Market Outlook, 2025-2035
- 14.1 Domestic Market Distribution and Demand Clusters
- 14.2 State- or Province-Wise Market Size and Forecast, 2025-2035
- 14.3 City and Metropolitan Market Outlook
- 14.4 Industrial, Manufacturing and Commercial Clusters
- 14.5 Geographic Concentration of Key End Users
- 14.6 Local Pricing and Purchasing Differences
- 14.7 Domestic Production Facilities and Capacity Map
- 14.8 Local Infrastructure and Project Pipeline
- 14.9 State-Level Policy and Incentive Differences
- 14.10 Subnational Investment Hotspots and Opportunities
- 14.11 Distribution and Logistics Networks
- 14.12 Domestic Competitive Footprint
Chapter 15 Australia Curing Adhesives Technology, Innovation and Sustainability Outlook
- 15.1 Technology Landscape and Maturity
- 15.2 Product, Process and Service Innovation
- 15.3 AI, Automation and Digital Tools in the Industry
- 15.4 Technology Adoption and Performance Benchmarking
- 15.5 Innovation Pipeline and R&D Investment
- 15.6 Patent and Intellectual Property Trends
- 15.7 Energy Efficiency and Resource Management
- 15.8 Sustainability, Recycling and Circularity
- 15.9 Technology Roadmap, 2025-2035
- 15.10 Risks of Obsolescence and Technology Substitution
Chapter 16 Australia Curing Adhesives Market Key Strategic Imperatives
- 16.1 Growth and Market Entry Priorities
- 16.2 High-Return Products and Segments
- 16.3 Pricing, Profitability and Cost Optimization
- 16.4 Technology Investment and Product Differentiation
- 16.5 Supply Chain Localization and Resilience
- 16.6 Distribution and Customer Acquisition
- 16.7 Partnership, Acquisition and Capacity Strategy
- 16.8 Regional Expansion Priorities
- 16.9 Short-, Medium- and Long-Term Actions
Chapter 17 Competition Outlook
- 17.1 Industry Competition Characteristics
- 17.2 Market Structure and Concentration
- 17.3 Market Share and Competitive Positioning, 2025
- 17.4 Company-Wise Revenue and Product Benchmarking
- 17.5 Production and Service Capacity Benchmarking
- 17.6 Technology, Pricing and Differentiation
- 17.7 Regional Footprint and Distribution Strength
- 17.8 Mergers, Acquisitions and Strategic Alliances
- 17.9 New Entrants and Competitive Threats
- 17.10 Porter's Five Forces and Industry Attractiveness
- 17.11 Competitive Outlook, 2025-2035
Chapter 18 Company Profiles
- 18.1 Company Coverage and Selection Criteria
- 18.2 Henkel Australia
- 18.2.1 Business Description
- 18.2.2 Company Ownership and Geographic Presence
- 18.2.3 Product and Service Portfolio
- 18.2.4 Manufacturing and Operating Footprint
- 18.2.5 Production Capacity and Expansion Plans
- 18.2.6 Financial Performance and Investment
- 18.2.7 Market Share and Competitive Position
- 18.2.8 Technology and Innovation Capabilities
- 18.2.9 Strategic Alliances or Partnerships
- 18.2.10 Recent Developments
- 18.2.11 Growth Strategy and Outlook
- 18.3 Sika Australia
- 18.4 Huntsman Advanced Materials
- 18.5 H.B. Fuller Australia
- 18.6 Bostik Australia
- 18.7 Dow Australia
- 18.8 3M Australia
- 18.9 Soudal Australia
- 18.10 Selleys
- 18.11 Dymax
- 18.12 Other Relevant Market Participants
Note: Every listed company is profiled on the structure shown under the first company. The company list is preliminary and may change based on research findings, market developments, data availability and client requirements.
Chapter 19 Disclaimer
- 19.1 Research and Forecast Disclaimer
- 19.2 Data Source and Estimation Limitations
Note: The depth of individual sections depends on data availability for this market. Volume, capacity, trade and other unit-based metrics are included where applicable.

