
Beverage and food buyers anchor national CO2 demand
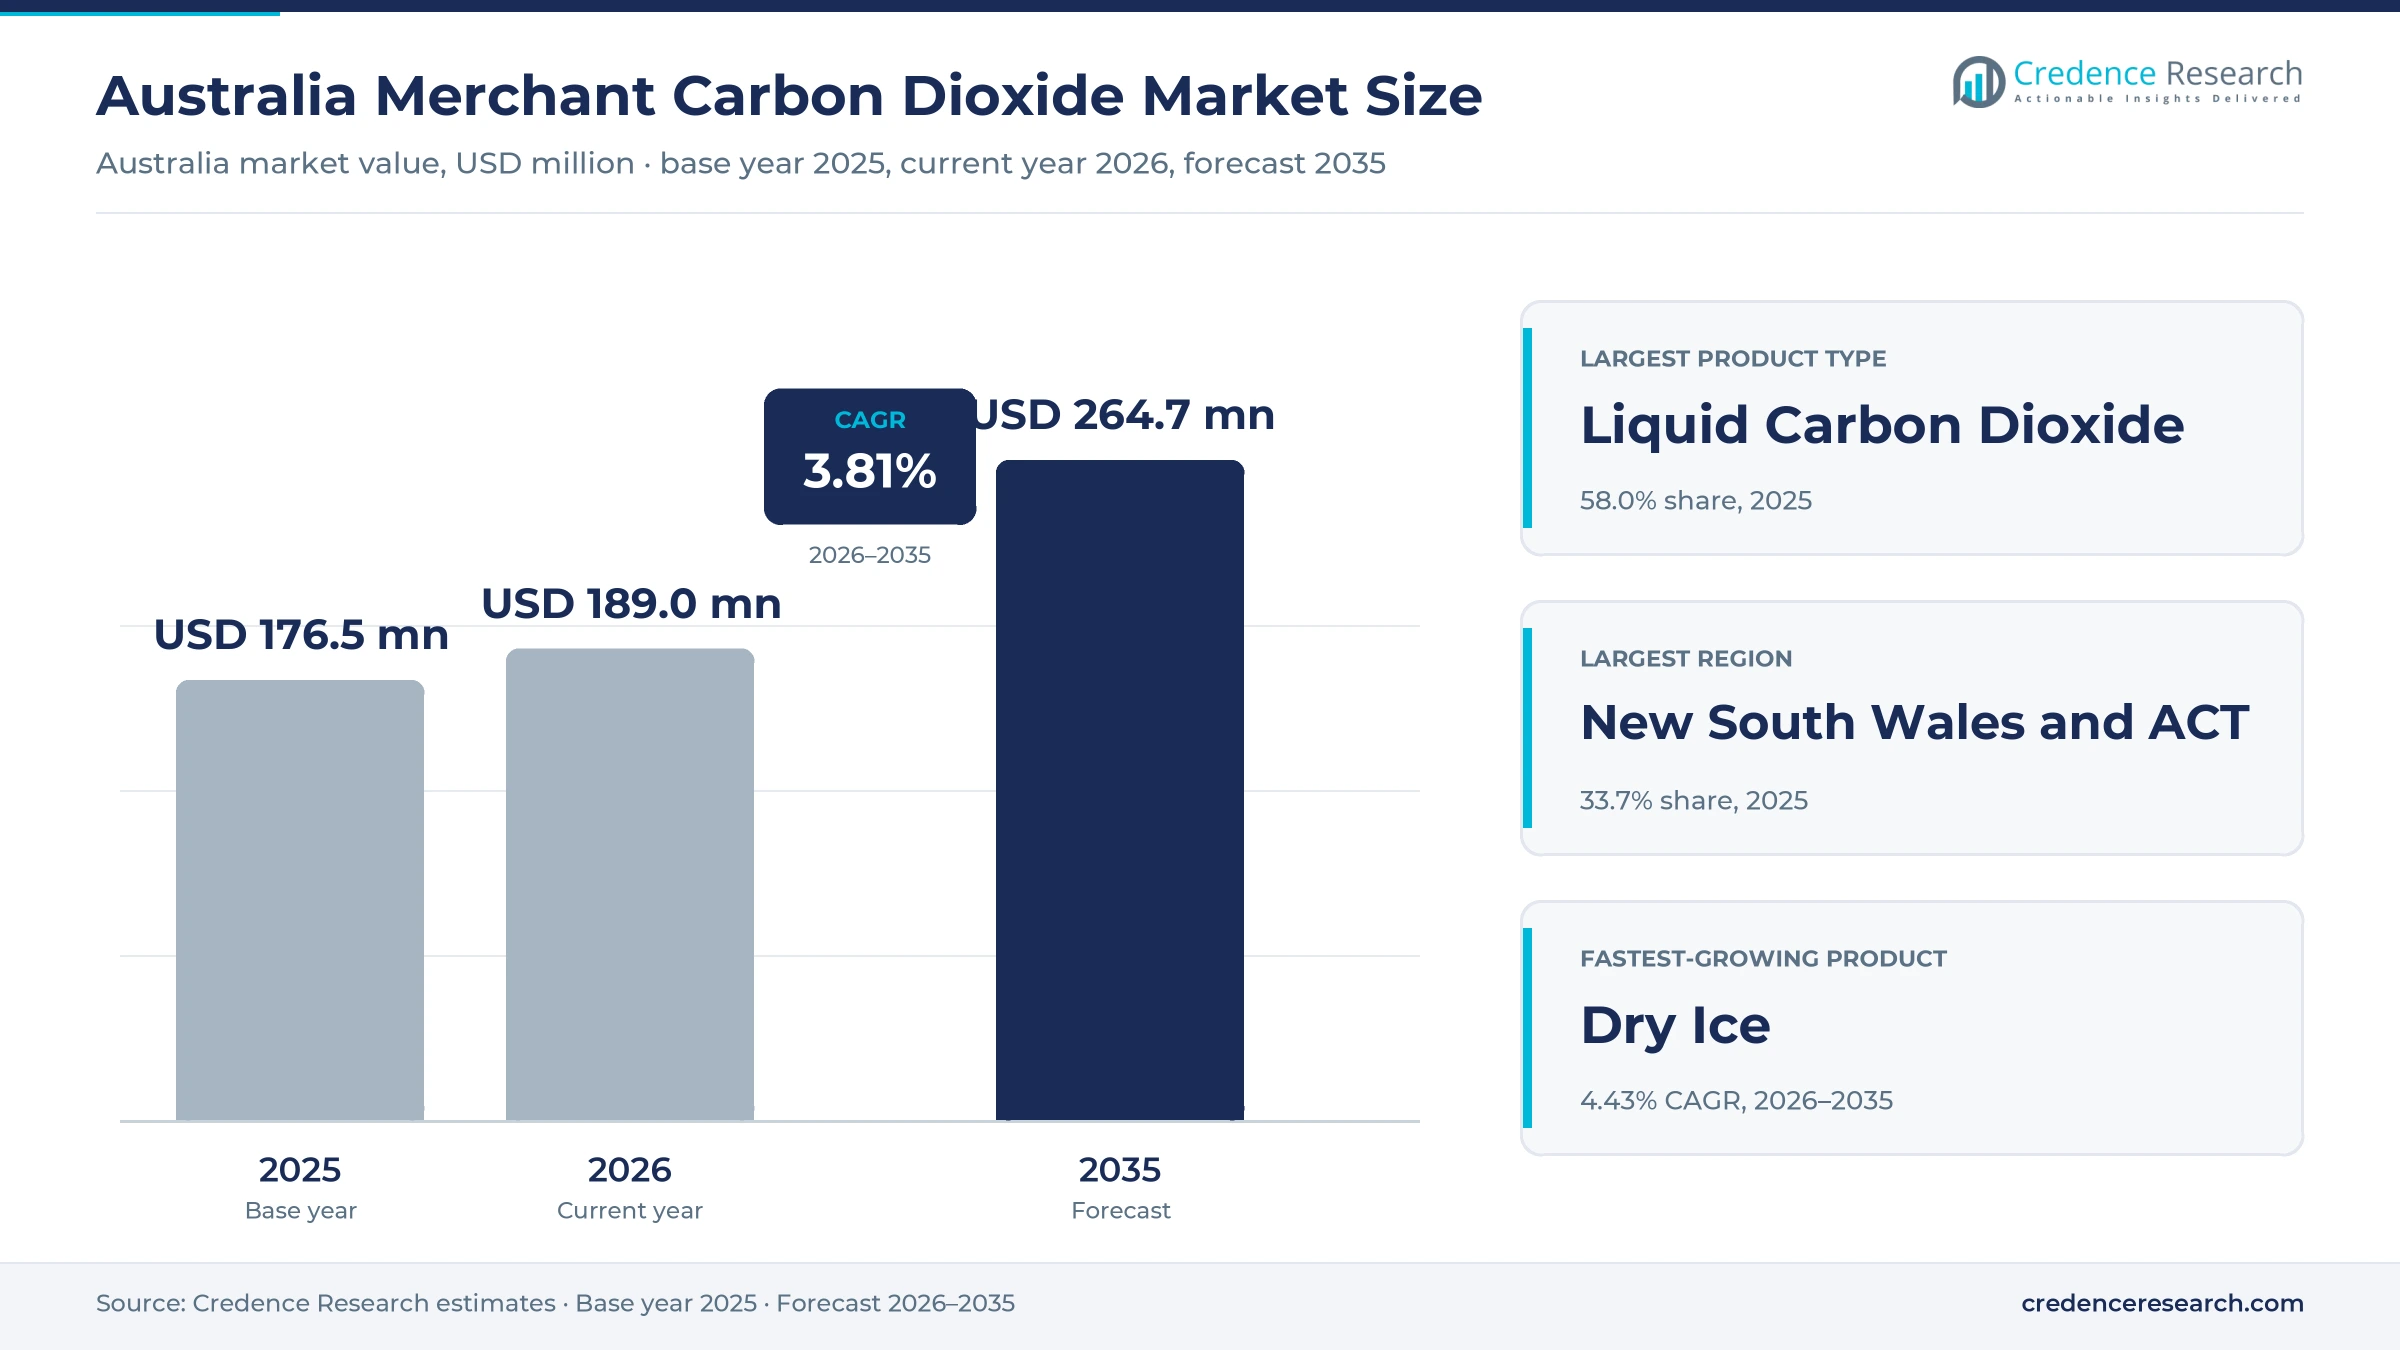
The Australia merchant carbon dioxide market was valued at USD 176.5 million in 2025 and is projected to increase from USD 189.0 million in 2026 to USD 264.7 million by 2035, registering a CAGR of 3.81% during 2026–2035. Demand comes from brewers, soft drink makers, meat and food processors, hospitals, laboratories, water utilities and manufacturers that buy purified gas in bulk tanks, cylinders and dry ice form. New South Wales and ACT held the largest regional share, 33.7% in 2025, because Sydney has the largest population and beverage base. Queensland is the fastest-growing region at 4.08% a year, as population growth lifts food, beverage and hospitality demand. However, suppliers are moving toward captured and biogenic sources, after a 2024 supply squeeze left soft drink shelves empty at major supermarkets.
Which product forms, buyers and supply routes does the estimate cover?
The estimate measures the value of purified carbon dioxide sold to outside buyers in Australia as liquid carbon dioxide, compressed carbon dioxide and dry ice. It counts gas used for carbonation and dispensing, cooling and cold chain, meat stunning and packaging, medical and laboratory use, water treatment and manufacturing.
The estimate excludes carbon dioxide used inside the plant that produces it, gas injected for oil recovery or storage, and the value of tanks, dispensers and blasting machines. The value chain runs from raw gas sources such as gas processing and fermentation plants through purification and liquefaction to bulk delivery, cylinder filling and dry ice production.
Australia Merchant Carbon Dioxide Market Insights
- The Australia merchant carbon dioxide market was valued at USD 176.5 million in 2025 and is projected to reach USD 264.7 million by 2035, registering a CAGR of 3.81% during 2026–2035.
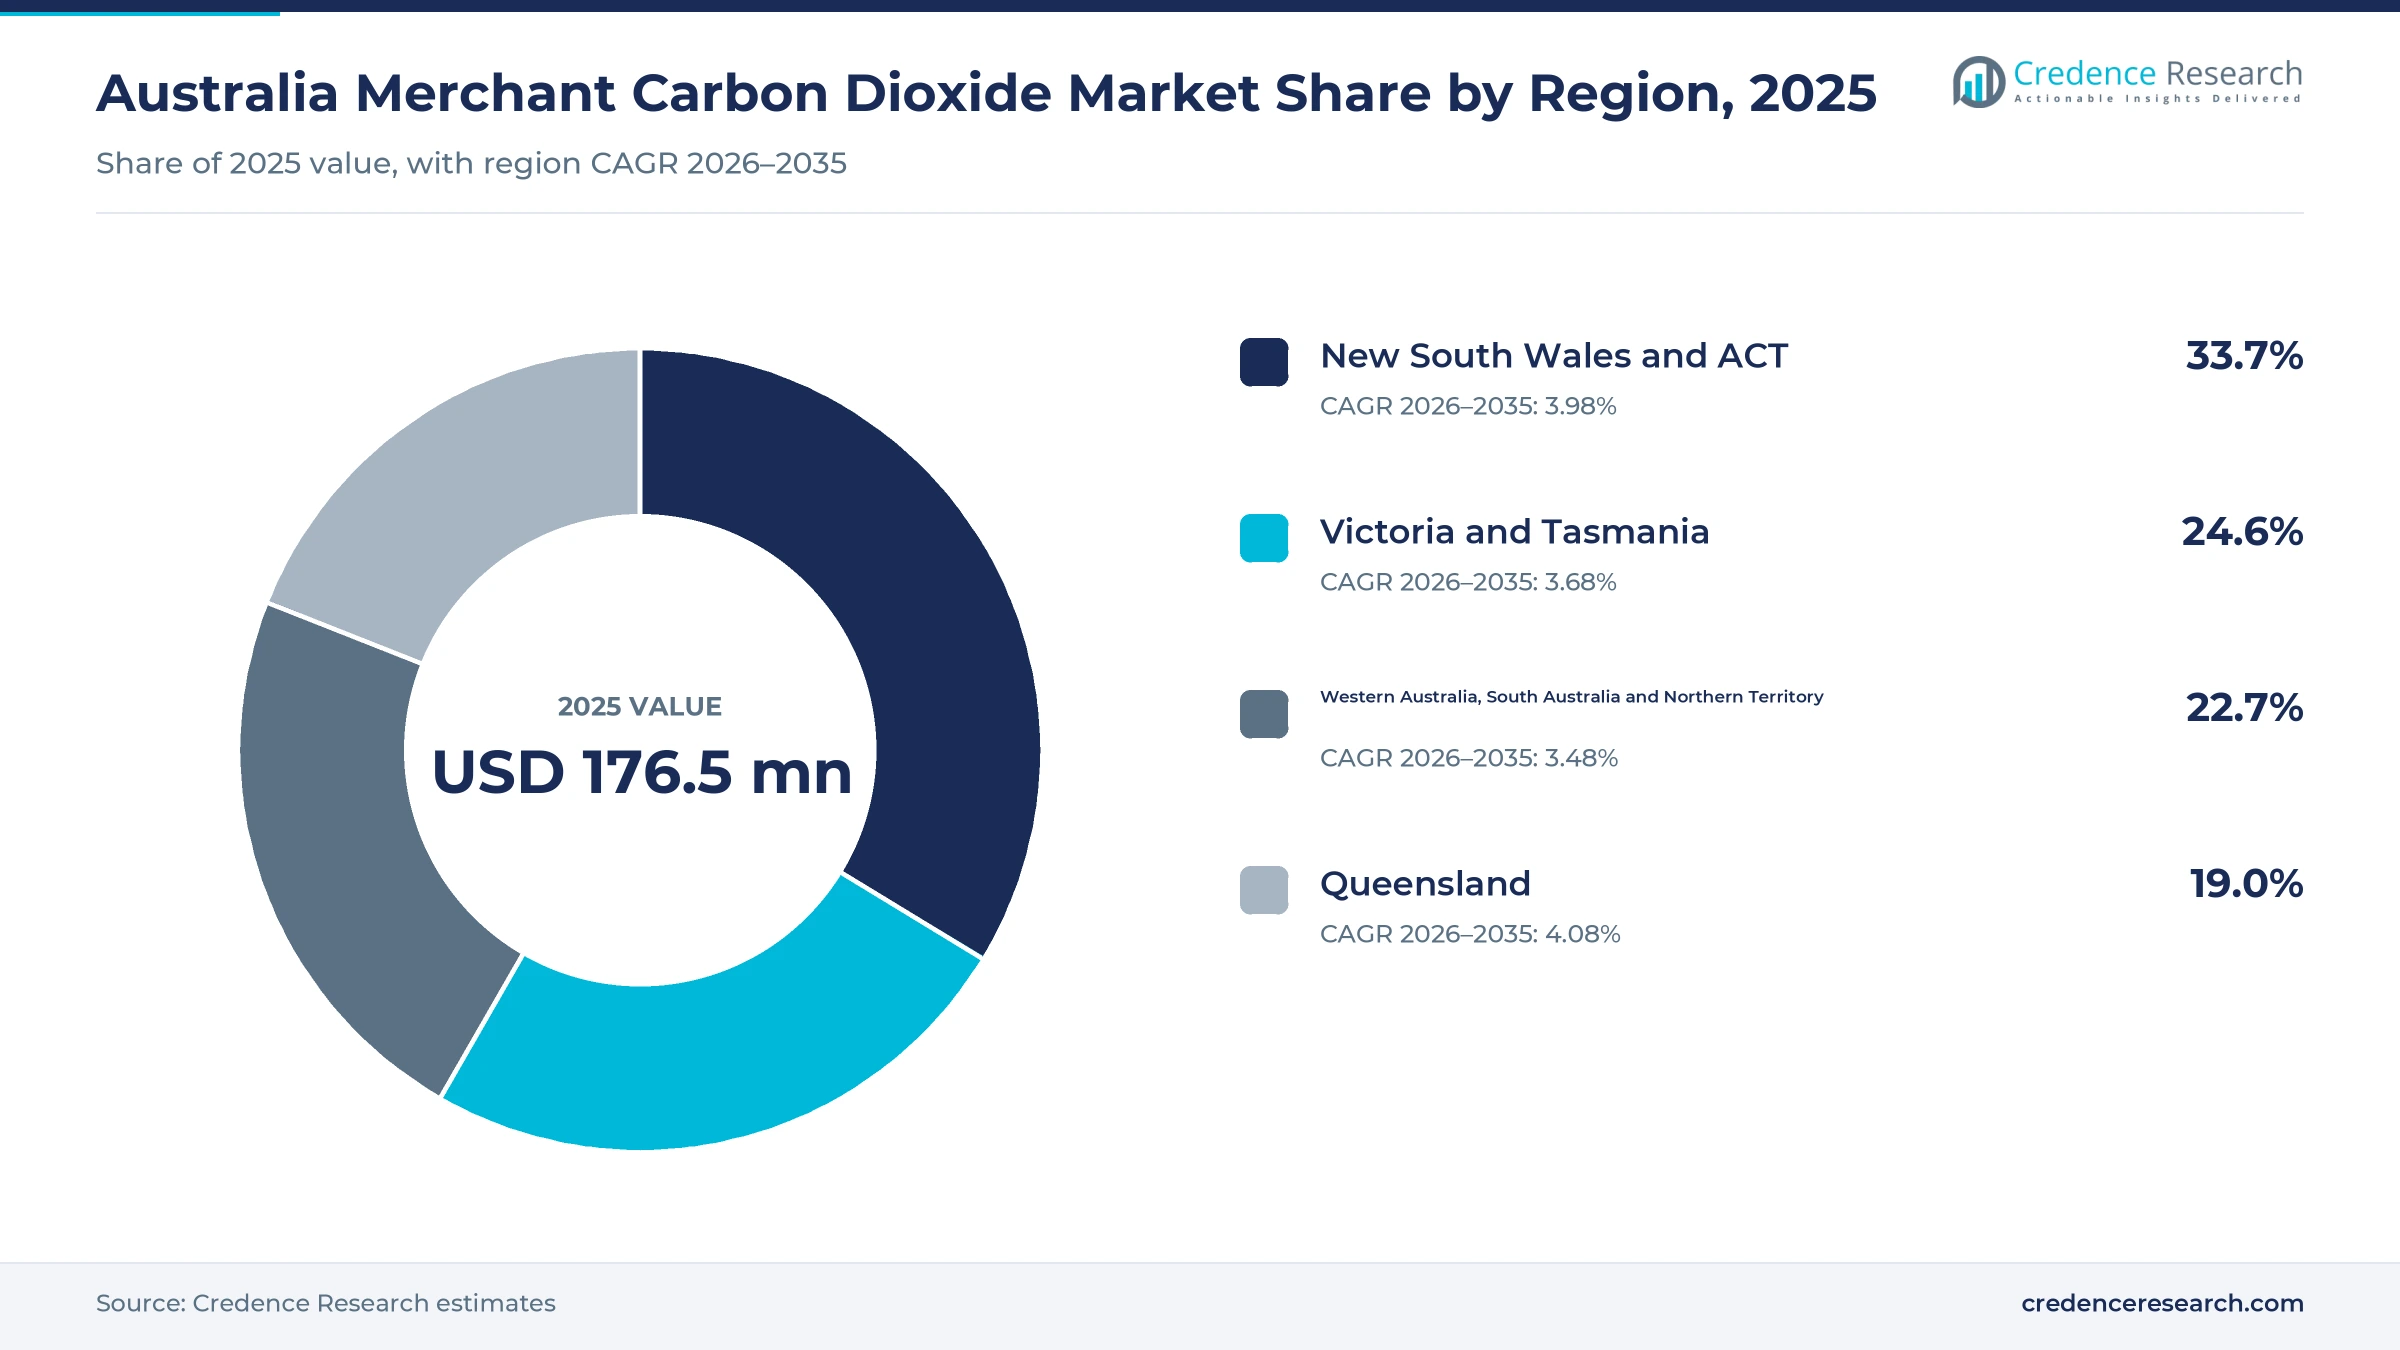
- New South Wales and ACT held a 33.7% share of 2025 value, because the region combines the largest population with major beverage and food plants.
- Liquid carbon dioxide led with a 58.0% share of 2025 value, because breweries, soft drink plants and food processors take most volume by bulk tanker.
- BOC began supplying from its Longford plant in Victoria in March 2025, with capacity for more than 60,000 metric tons of beverage-grade liquid gas a year.
- Dry ice grows fastest at 4.43% a year during 2026–2035, as medical, food and online grocery shippers need reliable cold chain cooling.
Liquid supply leads while dry ice grows fastest
Why does liquid carbon dioxide hold the largest value?
Based on product type, the market is categorized into liquid carbon dioxide, compressed carbon dioxide and dry ice. Liquid Carbon Dioxide led with a 58.0% share of 2025 value, because brewers, soft drink makers and food plants take bulk deliveries into onsite tanks. Dry Ice grows fastest at 4.43% a year, as medical, food and grocery shippers need dependable cold chain cooling.
How does food and beverage use anchor demand?
Based on end-use industry, the market is categorized into food and beverage, healthcare and life sciences, and manufacturing and environmental services. Food and Beverage led with a 62.0% share of 2025 value, because carbonation, meat stunning and packaging use the most gas. Healthcare and Life Sciences grows fastest at 4.60% a year, as hospitals, laboratories and clinical trial shippers use more gas and dry ice.
Which sales channels move the most gas?
Based on sales channel, the market is categorized into direct contract sales, distributor sales and branch and digital sales. Direct Contract Sales led with a 55.0% share of 2025 value, because large brewers and food plants sign multi-year bulk supply contracts. Branch and Digital Sales grow fastest at 4.29% a year, as small venues and workshops order cylinders and dry ice through branches and online portals.
| Segment Group | Leading Sub-segment | Share, 2025 | Fastest-growing Sub-segment | CAGR, 2026–2035 |
|---|---|---|---|---|
| By Product Type | Liquid Carbon Dioxide | 58.0% | Dry Ice | 4.43% |
| By End-Use Industry | Food and Beverage | 62.0% | Healthcare and Life Sciences | 4.60% |
| By Sales Channel | Direct Contract Sales | 55.0% | Branch and Digital Sales | 4.29% |
Request a Free Sample
Fill in your details and we'll send you a free sample report.
- Sample data tables & charts
- Research methodology
Biogenic plants, branch reach and cold chain lift sales
How does biogenic supply expansion lift capacity?
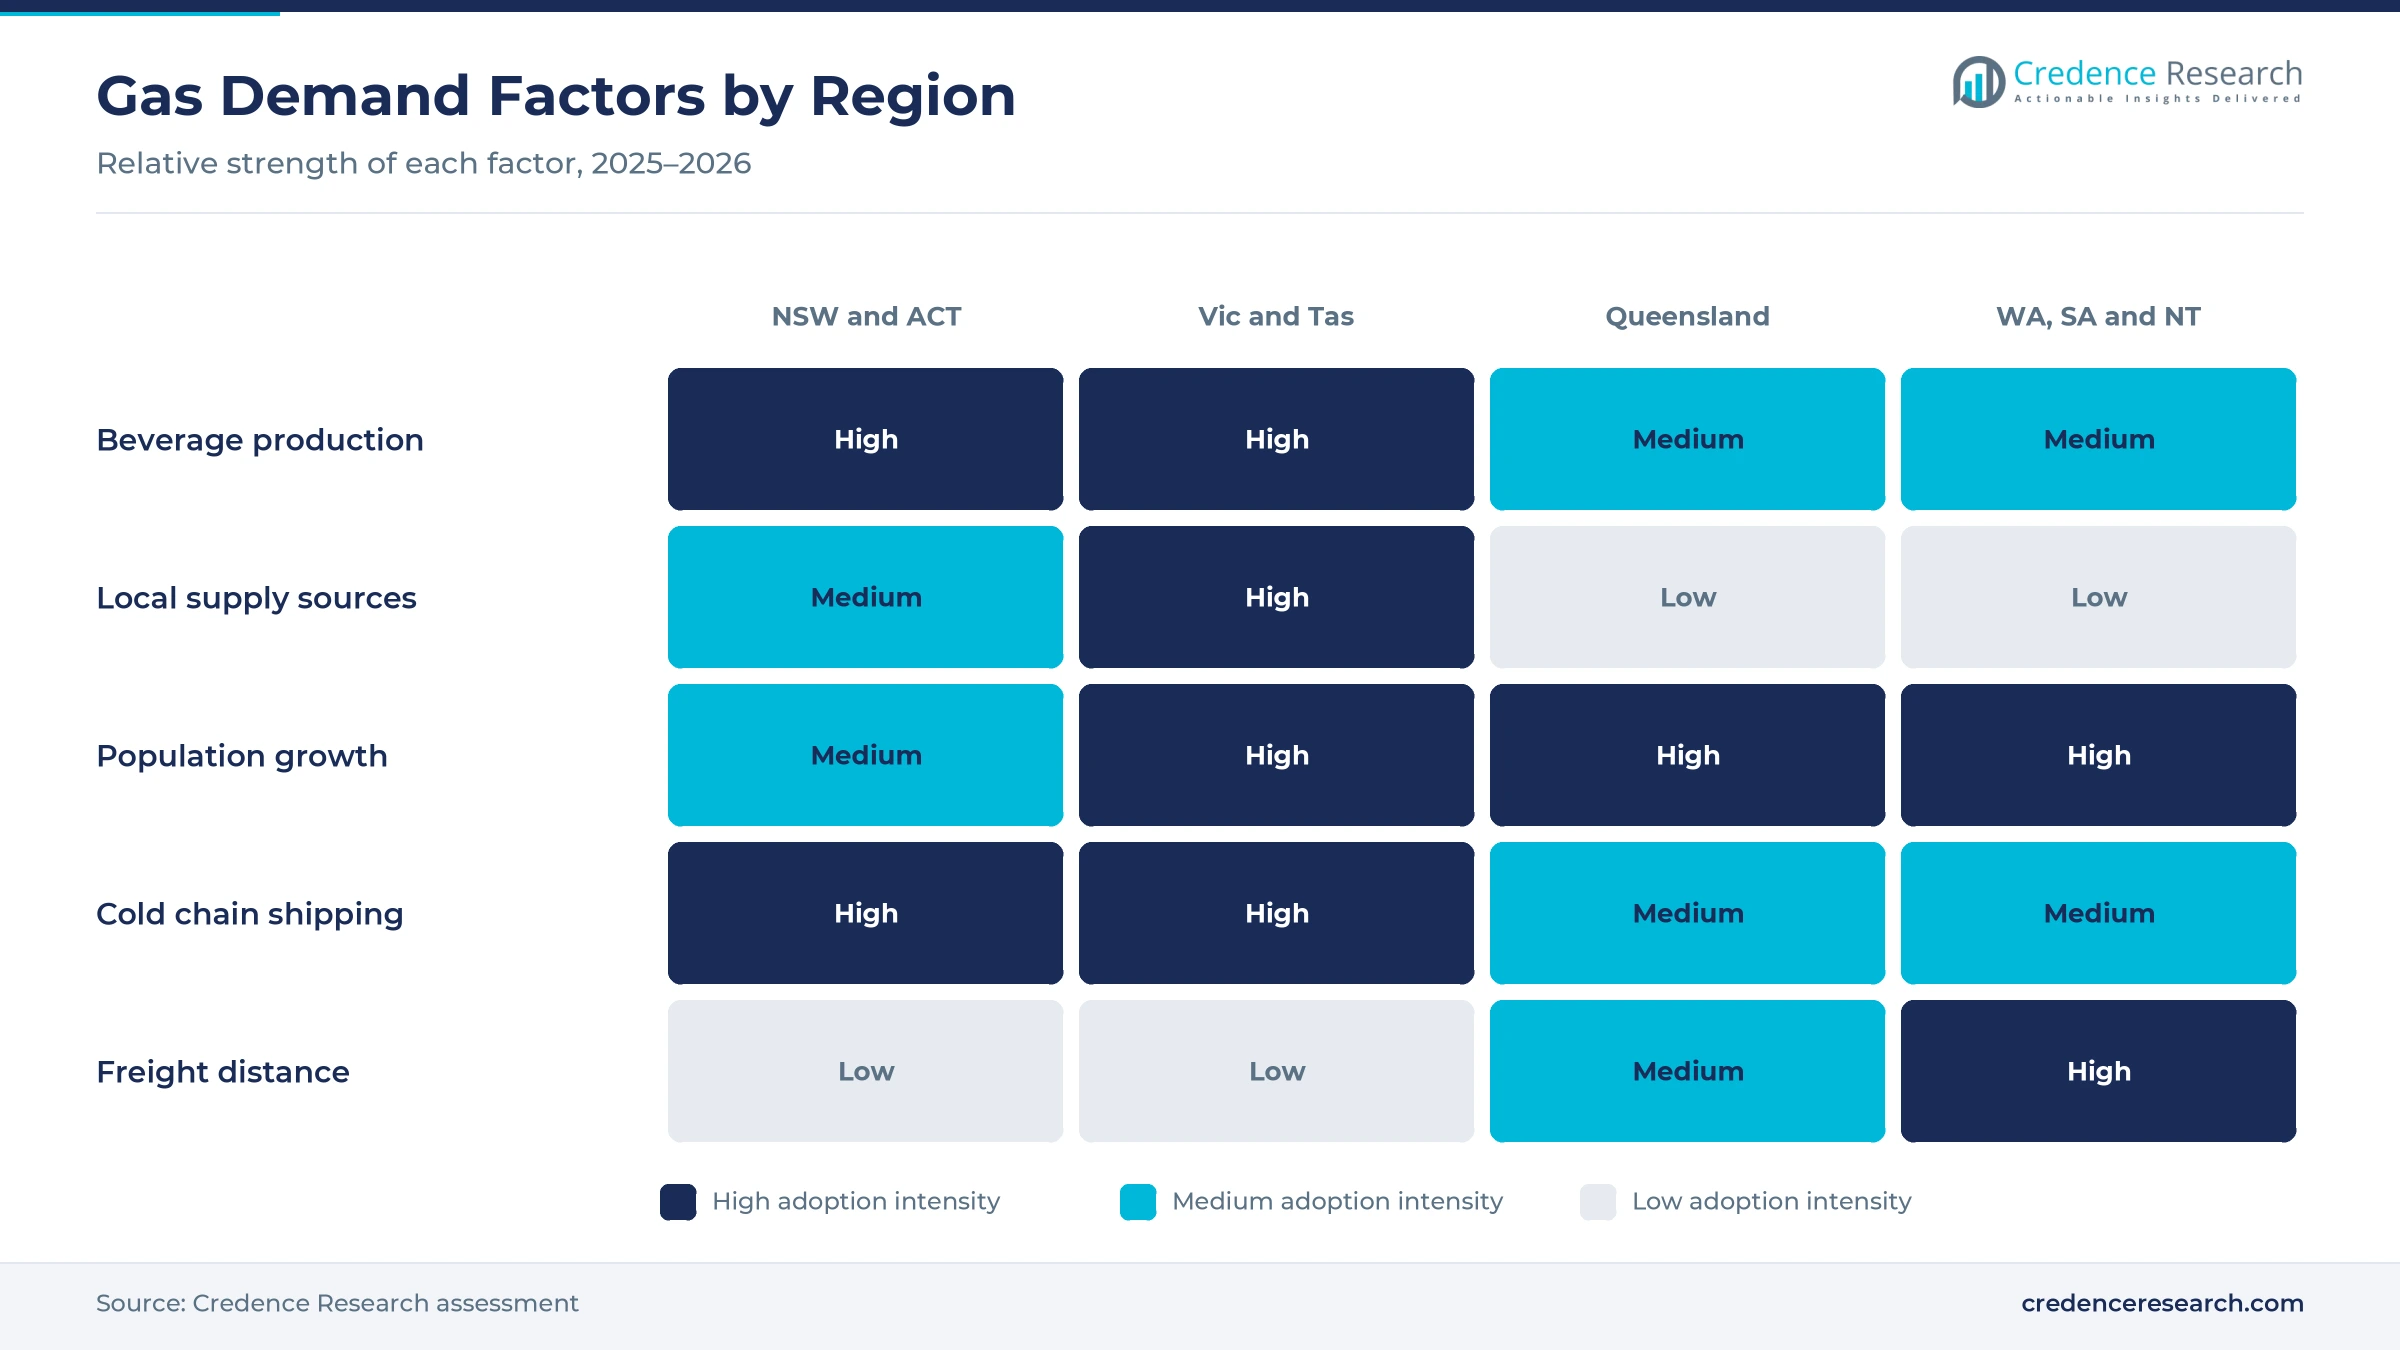
Biogenic supply expansion lifts capacity, because fermentation plants offer steady and lower-emission gas sources close to east coast buyers. Air Liquide announced a plant with Manildra Group at Bomaderry in New South Wales on May 21, 2025, according to Air Liquide Australia. The plant will capture more than 90,000 metric tons a year of food and beverage grade gas from wheat fermentation, which the company calls the largest such plant in the country. Construction was planned for the second half of 2025, with operations expected in 2027. As a result, New South Wales and ACT grows at 3.98% a year, because local supply cuts freight for Sydney buyers.
Why does packaged gas distribution reach matter?
Packaged gas distribution reach matters, because cafes, pubs, small brewers and workshops buy gas in cylinders through local branches rather than bulk tanks. Nippon Sanso completed its purchase of Coregas on July 1, 2025, which added 32 branches across Australia and New Zealand and more than 620 channel partners. The competition regulator did not oppose the deal on June 24, 2025, noting that both firms sell carbon dioxide in cylinders. Supagas, the sister company under Nippon Sanso, also runs gas filling facilities and branches across most states. In turn, branch and digital sales grow at 4.29% a year, the fastest sales channel during 2026–2035.
How does specialist cold chain demand support dry ice sales?
Specialist cold chain demand supports dry ice sales, because medicines, samples, seafood and meals need deep cooling during transport without power. The March 2024 supply squeeze also hit dry ice used to move medical supplies, according to Farm Online, which showed how exposed cold chain users are. BOC built dry ice hubs in Mackay, Canberra, Dandenong, Mount Gambier and Karratha after a $4 million network investment in 2013. Australia also has a national population of about 27.9 million in March 2026, which keeps food delivery volumes rising. As a result, dry ice grows at 4.43% a year, the fastest product type during 2026–2035, as shippers use more refrigerated freight services.
Why does beverage and food processing keep demand high?
Beverage and food processing keeps demand high, because carbonation, meat stunning and modified atmosphere packaging all depend on food-grade gas. The 2024 supply squeeze left soft drink shelves empty at Coles and Woolworths and also hit red meat, pork, poultry, baked goods and bagged salads. BOC said its Longford plant, which started supply in March 2025, would improve reliability for east coast customers, according to Process Online. The plant can also back up supply to New Zealand when local plants stop. In turn, food and beverage holds 62.0% of 2025 value, because these processors buy the largest share of bulk liquid gas.
Source shifts and gas company consolidation reshape supply
How is the shift away from fossil-linked sources changing supply?
The shift away from fossil-linked sources is changing supply, because many existing raw gas streams come from gas processing and fertilizer plants that are shrinking. The Longford gas plants in Victoria face planned closures that cut maximum daily supply first to 700 terajoules and then to 420 terajoules, with Gas Plant 1 set to close in July 2024. BOC now takes captured gas from the Longford Gas Conditioning Plant under a long-term agreement with the Gippsland Basin Joint Venture. Air Liquide also chose wheat fermentation for its 90,000 metric ton Bomaderry plant. As a result, suppliers are adding biogenic and captured sources to protect long-term food-grade supply during 2026–2035.
Why is the rise of gas company consolidation notable?
The rise of gas company consolidation is notable, because fewer and larger groups now control most production, cylinders and delivery routes. Nippon Sanso already owned Supagas when it completed the Coregas purchase on July 1, 2025. The regulator found that BOC would remain the largest supplier in Australia after the deal, with Air Liquide also providing an effective constraint. Coregas has operated in Australia since 1974, while Supagas started in 1968, which gives the combined group long customer relationships. In turn, direct contract sales keep 55.0% of 2025 value, because the large industrial gas suppliers sign multi-year deals with major beverage plants.
Can healthcare and life science use open new demand?
Healthcare and life science use can open new demand, because hospitals, laboratories and clinical shippers need high-purity gas for laboratory incubators and reliable cooling. Air Liquide lists medical and water treatment uses among the markets for its Bomaderry output from 2027. BOC also names medical users among the buyers of its Longford supply, which reached more than 60,000 metric tons a year of capacity in 2025. Dry ice for medical supplies was among the uses hit by the March 2024 squeeze, which pushed buyers to secure contracts. As a result, healthcare and life sciences grows at 4.60% a year, the fastest end-use industry during 2026–2035.
Is there room to grow in manufacturing and environmental services?
Manufacturing and environmental services offer room to grow, because welding, water treatment, desalination and cleaning all use carbon dioxide in steady volumes. Manufacturing value added was about 5.3% of Australian GDP in 2025, according to the World Bank, which supports demand for shielding gas and process cooling. Air Liquide also names desalination and water treatment among the uses for its new biogenic supply. The Coregas air separation unit at Darra in Brisbane, a $16 million project, also widens the local packaged gas network. In turn, dry ice blasting and water pH control give suppliers new accounts beyond beverages.
Source outages, freight and price swings test buyers
How do source outages disrupt supply?
Source outages disrupt supply, because a few gas processing, fertilizer and fermentation plants provide most raw gas in Australia. As a result, a single maintenance shutdown can leave beverage makers, meat processors and hospitals short within days. Suppliers respond by adding new sources, holding more storage and moving product between states, which raises resilience but adds cost. This risk stays high until new biogenic plants start in 2027.
Why do freight distances raise delivered costs?
Freight distances raise delivered costs, because liquid gas and dry ice must travel long routes by insulated tanker and truck. In turn, buyers in Western Australia, South Australia and the Northern Territory pay more and face longer lead times than east coast buyers. Suppliers respond with regional filling stations and dry ice hubs, which shorten delivery routes. Dry ice also loses mass during transit, which pushes production closer to users.
How do price swings affect small buyers?
Price swings affect small buyers, because shortages lift spot prices and trigger allocation for customers without long-term contracts. As a result, independent pubs, cafes and craft brewers can face sudden cost rises during supply squeezes. Suppliers respond with fixed-price cylinder plans and longer contracts, which give buyers more certainty. These plans tend to favor buyers that commit to one supplier for several years.
Why does quality assurance add cost for suppliers?
Quality assurance adds cost for suppliers, because food, beverage and medical buyers need tested purity and full traceability for every batch. In turn, new sources such as fermentation and captured gas need purification steps and laboratory checks before sale. Suppliers respond with modern purification units and quality control processes, which protect buyers but raise capital needs. This requirement tends to favor large gas groups with established laboratories and testing staff.
Sydney leads while Queensland adds the fastest growth
| Region | Value, 2025 (USD million) | Share, 2025 | CAGR, 2026–2035 |
|---|---|---|---|
| New South Wales and ACT | 59.5 | 33.7% | 3.98% |
| Victoria and Tasmania | 43.4 | 24.6% | 3.68% |
| Western Australia, South Australia and Northern Territory | 40.1 | 22.7% | 3.48% |
| Queensland | 33.5 | 19.0% | 4.08% |
Why do New South Wales and ACT hold the top share?
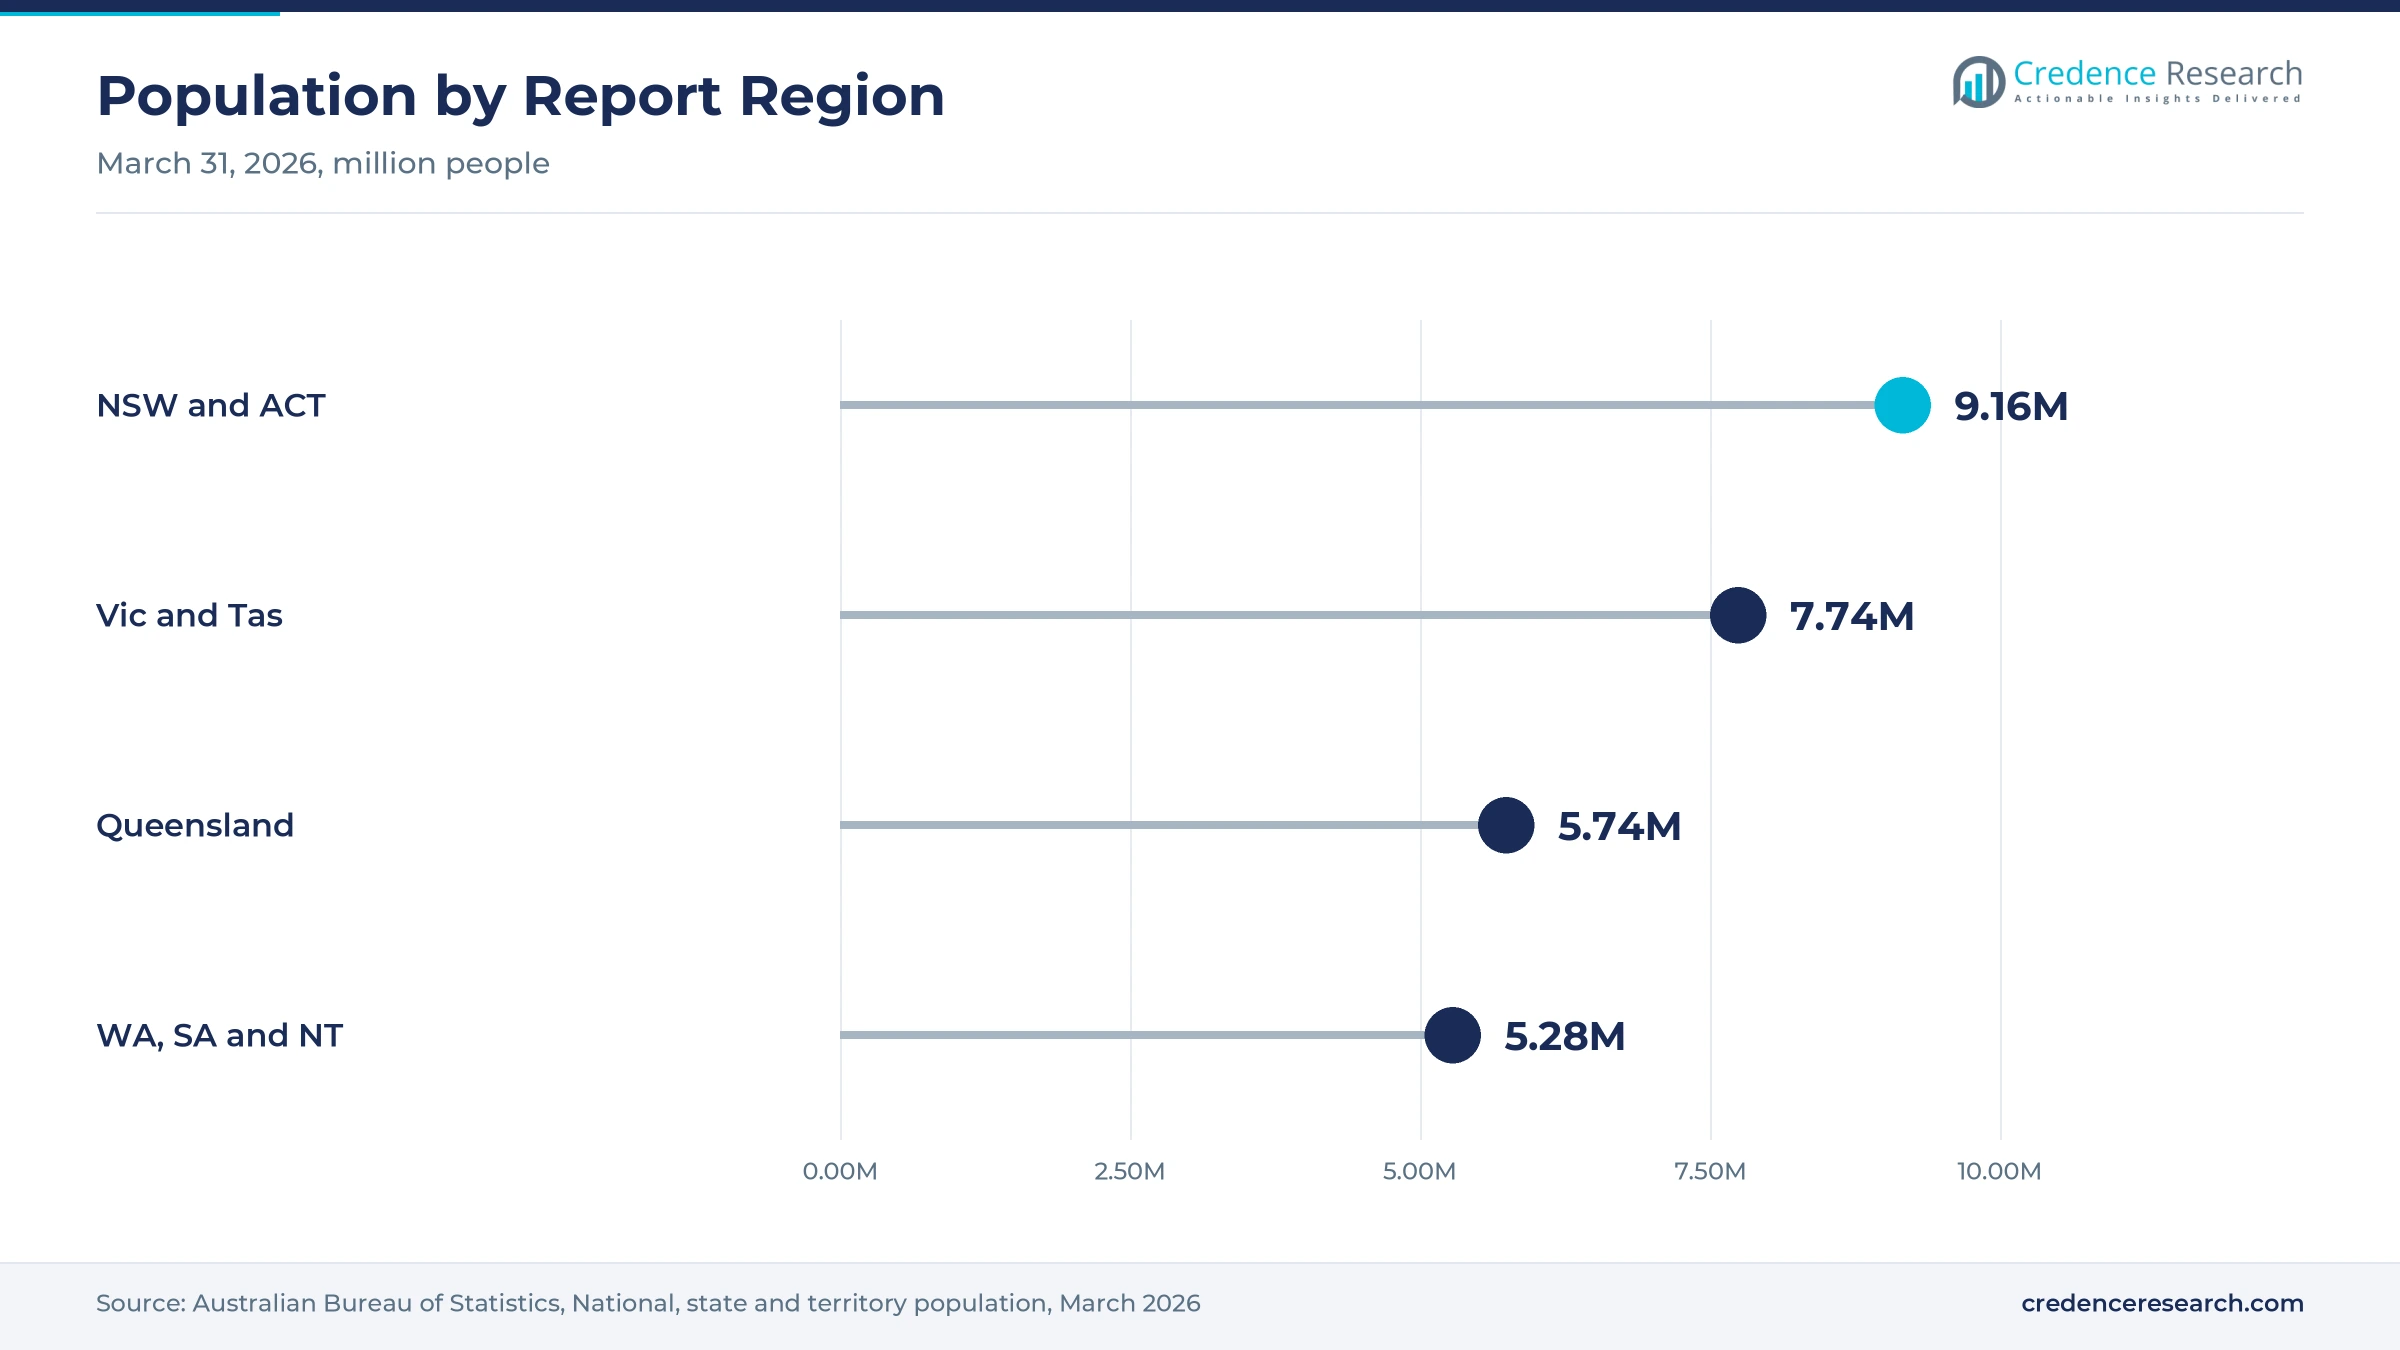
New South Wales and ACT held a 33.7% share of 2025 value and grow at 3.98% a year, because the region has about 9.2 million people and large beverage plants. New South Wales had 8.67 million residents at March 31, 2026. The Bomaderry biogenic plant in the Shoalhaven region is expected to start in 2027. As a result, this region should gain the most new local supply by 2035.
How do Victoria and Tasmania support demand?
Victoria and Tasmania held a 24.6% share of 2025 value and grow at 3.68% a year, because Melbourne hosts large brewing, food and medical sites. Victoria grew its population by 1.6% in the year to March 2026, one of the fastest rates of any state. BOC Longford in Gippsland also supplies more than 60,000 metric tons a year from 2025. In turn, this region acts as a supply hub for the east coast.
Why is Queensland growing fastest?
Queensland held a 19.0% share of 2025 value and grows fastest at 4.08% a year, because population growth of 1.6% in the year to March 2026 lifts food, beverage and tourism demand. The state had about 5.74 million residents at that date. Coregas also planned a $16 million air separation unit at Darra in Brisbane to serve local demand. As a result, Queensland adds the most new cylinder and dry ice accounts in the forecast period.
How do Western Australia, South Australia and the Northern Territory contribute?
Western Australia, South Australia and Northern Territory held a 22.7% share of 2025 value and grow at 3.48% a year, because long freight routes limit growth. Western Australia had the fastest population growth at 2.1% in the year to March 2026. BOC also built dry ice hubs in Karratha and Mount Gambier. In turn, this region relies on regional filling and mining site accounts.
New capture plants, mergers and shortage milestones
| Development | Status and market relevance |
|---|---|
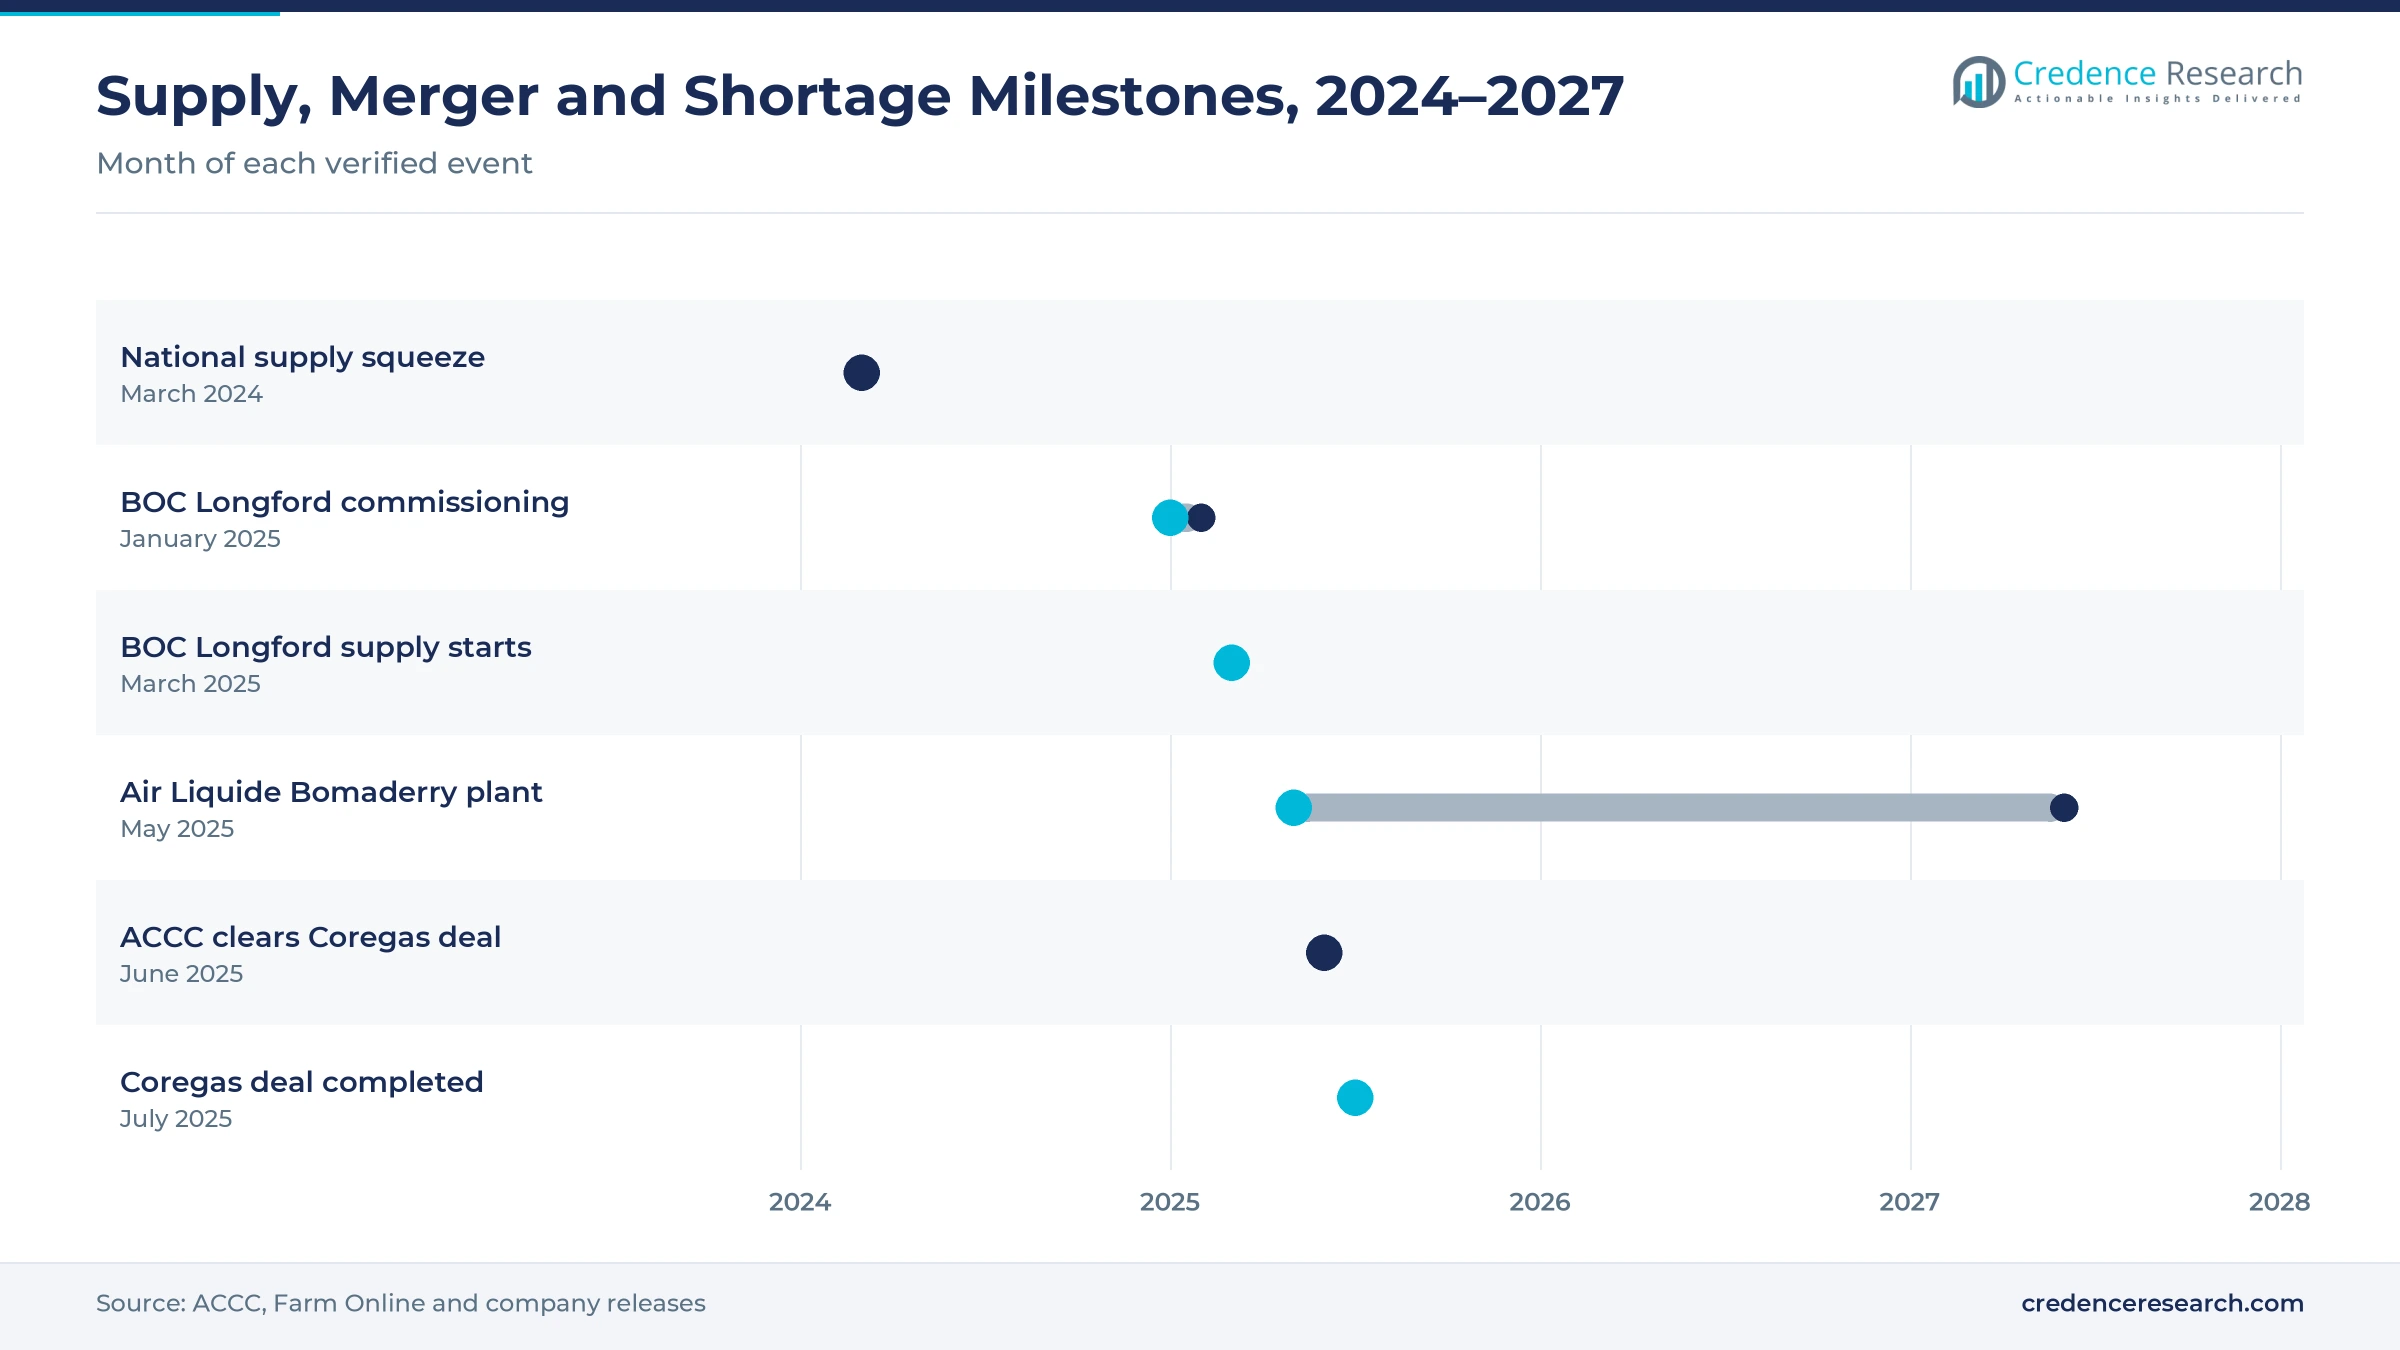
| In March 2024, a planned maintenance shutdown at a gas source and import freight problems caused a national supply squeeze. | Left soft drink shelves empty and hit meat and dry ice users |
| In March 2025, BOC began supplying from its Longford plant in Victoria. | Adds more than 60,000 metric tons a year of beverage-grade capacity |
| In May 2025, Air Liquide announced a biogenic plant with Manildra Group at Bomaderry. | Plans more than 90,000 metric tons a year from 2027 |
| In June 2025, the competition regulator cleared the purchase of Coregas by Nippon Sanso. | Confirms BOC remains the largest supplier |
| In July 2025, Nippon Sanso completed its purchase of Coregas. | Joins Coregas with sister company Supagas in one group |
Capture, purification and pelletizing define supply quality
- Capture and compression collects raw gas from gas processing and fermentation plants, which turns a waste stream into a sellable feedstock.
- Purification and liquefaction removes impurities and cools the gas into liquid, which lets it meet beverage-grade standards and travel by bulk tanker.
- Cylinder filling and testing packs gas into portable cylinders for venues and workshops, which serves small buyers that cannot install bulk tanks.
- Dry ice pelletizing turns liquid gas into pellets and blocks for cooling and blasting, which supports cold chain shipping, food handling and industrial cleaning.
Need a Custom Version of This Report?
Tailor the scope, geography, or segments to your exact requirements.
- Custom geography or segment scope
- Direct access to our analyst team
Three large gas groups and dry ice specialists compete
Competition centers on three large gas groups and a set of dry ice specialists. BOC, part of Linde, runs the Longford plant in Victoria and remains the largest supplier in Australia, according to the competition regulator. Air Liquide Australia is building the largest biogenic plant in the country at Bomaderry with Manildra Group. Coregas and Supagas now sit under Nippon Sanso and sell gas in cylinders through national branch networks. Smaller dry ice firms serve cold chain, events and blasting users in major cities. Suppliers compete on source security, purity, delivery reliability, branch reach and contract terms. Large beverage and food plants usually tender multi-year bulk deals, while small venues choose suppliers by service and cylinder exchange speed. Buyers also weigh global supply trends when they plan contracts.
Which gas groups supply Australian buyers?
| Company | Type | Role in the market |
|---|---|---|
| BOC | Gas producer | Runs the Longford beverage-grade plant in Victoria |
| Air Liquide Australia | Gas producer | Building a biogenic plant at Bomaderry with Manildra Group |
| Coregas | Gas producer and distributor | Sells cylinder gas through 32 branches in Australia and New Zealand |
| Supagas | Gas distributor | Runs gas filling facilities and branches across most states |
Credence Research view on CO2 supply in Australia
Credence Research's view is that Australian merchant gas demand will grow steadily because beverage, food, healthcare and cold chain users need secure, food-grade supply. Liquid gas remains the largest product type, while dry ice grows fastest. New biogenic and captured sources should ease the supply risk exposed in 2024. Suppliers that combine secure sources, national branch reach and reliable dry ice production should gain the most share by 2035, while healthcare users offer a second growth path.
How the national CO2 supply estimate was built
The report uses 2025 as the base year on a calendar basis, and market values come from the Credence Research model. That model combines regulator decisions, company releases, trade media, official population statistics and international economic data. Segment splits and regional growth rates are Credence Research estimates, while regional shares follow the client split. Sources used are regulator registers, company releases, trade media, national statistics and World Bank data, and no interviews or surveys were used.
Biogenic capacity and cold chain carry growth to 2035
The Australia merchant carbon dioxide market is expected to reach USD 264.7 million by 2035, a 3.81% CAGR during 2026–2035, as beverage, food, healthcare and cold chain users keep buying more gas. Growth should be strongest in dry ice, healthcare and life sciences and Queensland, because these areas gain most from population growth and cold chain needs. Source outages, freight costs and price swings could slow some buyers, while new biogenic plants and wider branch networks should improve supply security.
Frequently Asked Questions
How big is the Australia merchant carbon dioxide market?
Which product type leads carbon dioxide value?
Which region leads the market?
What happened during the 2024 supply squeeze?
What new supply is coming to Australia?
How did the Coregas deal change the supplier landscape?
Who are the leading companies in the Australian carbon dioxide market?
What are the main challenges for buyers and suppliers?
Table of Content
Chapter 1 Market Segmentation
- 1.1 Segmentation Framework
- 1.1.1 Product and Service Classification
- 1.1.2 Application and End-Use Classification
- 1.1.3 Technology and Solution Classification
- 1.1.4 Customer and Distribution Channel Classification
- 1.1.5 Geographic Segmentation
- 1.1.6 Market Segment Definitions and Boundaries
- 1.2 By Product Type
- 1.2.1 Liquid Carbon Dioxide
- 1.2.2 Compressed Carbon Dioxide
- 1.2.3 Dry Ice
- 1.3 By End-Use Industry
- 1.3.1 Food and Beverage
- 1.3.2 Healthcare and Life Sciences
- 1.3.3 Manufacturing and Environmental Services
- 1.4 By Sales Channel
- 1.4.1 Direct Contract Sales
- 1.4.2 Distributor Sales
- 1.4.3 Branch and Digital Sales
Chapter 2 Introduction
- 2.1 Report Objectives and Scope
- 2.2 Product Definition and Industry Terminology
- 2.3 Market Inclusions and Exclusions
- 2.4 Research Process
- 2.4.1 Primary Research and Expert Interviews
- 2.4.2 Secondary Research and Source Review
- 2.4.3 Top-Down and Bottom-Up Estimation
- 2.4.4 Data Triangulation and Verification
- 2.5 Market Size Measurement Basis
- 2.5.1 2025: USD 176.5 million → 2035: USD 264.7 million
- 2.6 Historical and Forecast Reference Periods
- 2.6.1 Historical Period: 2018-2025
- 2.6.2 Base Year: 2025
- 2.6.3 Forecast Period: 2025-2035
- 2.7 Research Assumptions and Limitations
Chapter 3 Executive Summary
- 3.1 Market Snapshot and Key Findings
- 3.2 Base-Year Market Size, 2025
- 3.3 Forecast Market Size, 2035
- 3.4 Revenue and Volume Growth Outlook
- 3.5 Key Demand and Supply Indicators
- 3.6 Leading Market Segments
- 3.7 Fastest-Growing Market Opportunities
- 3.8 Regional Performance Highlights
- 3.9 Technology and Industry Transformation
- 3.10 Competitive Landscape Summary
- 3.11 Analyst View and Strategic Implications
Chapter 4 Australia Merchant Carbon Dioxide Market Trends and Developments
- 4.1 Historical Industry Development, 2018-2025
- 4.2 Recent Market Trends and Developments
- 4.3 Demand and Customer Behavior Trends
- 4.4 Technology and Product Innovation
- 4.5 Artificial Intelligence, Automation and Digitalization
- 4.6 Local Manufacturing and Supply Chain Realignment
- 4.7 Industry Partnerships, Mergers and Acquisitions
- 4.8 Sustainability and Circular Economy Developments
- 4.9 Government and Private Sector Investment Trends
- 4.10 Emerging Business Models and Commercialization
- 4.11 Industry Developments and Announcements
Chapter 5 Australia Merchant Carbon Dioxide Market Production, Supply and Demand Analysis
- 5.1 Demand Trend and Consumption Analysis, 2018-2025
- 5.2 Demand Forecast, 2025-2035
- 5.3 Production and Output Trend, 2018-2025
- 5.4 Production and Output Forecast, 2025-2035
- 5.5 Installed Capacity and Capacity Utilization
- 5.6 Company-Wise Production Plants and Statistics
- 5.6.1 Installed Production Capacity
- 5.6.2 Actual Production
- 5.6.3 Planned Capacity and Expansion Targets
- 5.7 Supply Chain Structure and Procurement Trends
- 5.8 Supply-Demand Gap and Bottlenecks
- 5.9 Import Dependence and Sourcing Structure
- 5.10 Contract Manufacturing and Outsourcing
- 5.11 Regional Supply and Demand Concentration
Chapter 6 Australia Merchant Carbon Dioxide Market Pricing Analysis
- 6.1 Pricing Structure and Measurement
- 6.2 Historical Pricing Trends, 2018-2025
- 6.3 Pricing Outlook, 2025-2035
- 6.4 Average Selling Price and Unit Economics
- 6.5 Pricing by Product and Market Segment
- 6.6 Geographic Pricing Differences
- 6.7 Key Input, Energy, Labor and Logistics Costs
- 6.8 Contract Pricing and Purchasing Models
- 6.9 Pricing Sensitivity and Competitive Positioning
- 6.10 Price, Margin and Profitability Implications
Chapter 7 Australia Merchant Carbon Dioxide Market Dynamics
- 7.1 Market Growth Drivers
- 7.1.1 Demand-Side Drivers
- 7.1.2 Technology and Innovation Drivers
- 7.1.3 Infrastructure and Investment Drivers
- 7.1.4 Regulatory and Policy Drivers
- 7.2 Market Restraints
- 7.2.1 Cost and Affordability Constraints
- 7.2.2 Technology and Adoption Barriers
- 7.2.3 Supply Chain and Operational Constraints
- 7.3 Market Challenges
- 7.3.1 Competitive Pressure and Margin Erosion
- 7.3.2 Skills, Infrastructure and Implementation Gaps
- 7.4 Emerging Market Opportunities
- 7.5 Market Dynamics Impact and Time-Horizon Assessment
Chapter 8 Australia Merchant Carbon Dioxide Value Chain Analysis
- 8.1 Industry Value Chain Overview
- 8.2 Upstream Suppliers and Critical Inputs
- 8.3 Technology and Component Providers
- 8.4 Manufacturing or Service Delivery
- 8.5 Distribution, Channel Partners and Integrators
- 8.6 Downstream Applications and End Users
- 8.7 Value Addition and Profit Pools
- 8.8 Vertical Integration and Outsourcing
- 8.9 Supplier Concentration and Risk
- 8.10 Supply Chain Localization and Resilience
Chapter 9 Australia Merchant Carbon Dioxide Market Regulations and Policies
- 9.1 Relevant Laws, Standards and Compliance Frameworks
- 9.2 Product, Service, Safety and Quality Requirements
- 9.3 Government Policies, Incentives and Subsidies
- 9.4 Imports, Exports and Trade Barriers
- 9.5 Public Procurement and Local Content Requirements
- 9.6 Environmental and Sustainability Compliance
- 9.7 Upcoming Policy Changes and Market Implications
Chapter 10 Australia Merchant Carbon Dioxide Market Hotspots and Opportunities
- 10.1 Market Opportunity Mapping and Growth Hotspots
- 10.2 High-Growth Applications and Customer Groups
- 10.3 Underserved Markets and White-Space Opportunities
- 10.4 Emerging Technology and Product Opportunities
- 10.5 New Capacity and Investment Hotspots
- 10.6 Market Entry and Expansion Opportunities
- 10.7 Distribution and Partnership Opportunities
- 10.8 Near-Term and Long-Term Commercial Potential
- 10.9 Opportunity Attractiveness and Execution Risks
Chapter 11 Australia Merchant Carbon Dioxide Market Outlook, 2025-2035
- 11.1 Market Size and Analysis
- 11.1.1 Revenue (Market Measurement: 2025: USD 176.5 million → 2035: USD 264.7 million)
- 11.1.2 Market Volume and Quantity Sold
- 11.1.3 Historical Market Size, 2018-2025
- 11.1.4 Base-Year Market Size, 2025
- 11.2 Market Forecast, 2025-2035
- 11.2.1 Revenue Forecast to 2035
- 11.2.2 Volume Forecast to 2035
- 11.2.3 CAGR and Year-on-Year Growth
- 11.2.4 Incremental Revenue Opportunity
- 11.3 Forecast Assumptions and Scenario Analysis
- 11.3.1 Base-Case Forecast
- 11.3.2 Optimistic and Conservative Scenarios
- 11.3.3 Technology, Pricing and Policy Sensitivities
- 11.4 Market Attractiveness and Growth Outlook
Chapter 12 Australia Merchant Carbon Dioxide Market Segmentation and Outlook
- 12.1 Segmentation Summary and Market Shares, 2025
- 12.2 Largest and Fastest-Growing Segments
- 12.3 By Product Type - Market Size and Forecast, 2025-2035
- 12.3.1 Segment Definition and Scope
- 12.3.2 Historical Market Size, 2018-2025
- 12.3.3 Revenue Forecast, 2025-2035
- 12.3.4 Volume Forecast, 2025-2035
- 12.3.5 Base-Year Market Share, 2025
- 12.3.6 Segment CAGR and Growth Drivers
- 12.3.7 Subsegment Market Size and Forecast
- 12.3.7.1 Liquid Carbon Dioxide
- 12.3.7.2 Compressed Carbon Dioxide
- 12.3.7.3 Dry Ice
- 12.3.8 Subsegment Pricing and Adoption Trends
- 12.3.9 Leading Suppliers and Competition
- 12.3.10 Regional Demand and Opportunities
- 12.4 By End-Use Industry - Market Size and Forecast, 2025-2035
- 12.4.1 Segment Definition and Scope
- 12.4.2 Historical Market Size, 2018-2025
- 12.4.3 Revenue Forecast, 2025-2035
- 12.4.4 Volume Forecast, 2025-2035
- 12.4.5 Base-Year Market Share, 2025
- 12.4.6 Segment CAGR and Growth Drivers
- 12.4.7 Subsegment Market Size and Forecast
- 12.4.7.1 Food and Beverage
- 12.4.7.2 Healthcare and Life Sciences
- 12.4.7.3 Manufacturing and Environmental Services
- 12.4.8 Subsegment Pricing and Adoption Trends
- 12.4.9 Leading Suppliers and Competition
- 12.4.10 Regional Demand and Opportunities
- 12.5 By Sales Channel - Market Size and Forecast, 2025-2035
- 12.5.1 Segment Definition and Scope
- 12.5.2 Historical Market Size, 2018-2025
- 12.5.3 Revenue Forecast, 2025-2035
- 12.5.4 Volume Forecast, 2025-2035
- 12.5.5 Base-Year Market Share, 2025
- 12.5.6 Segment CAGR and Growth Drivers
- 12.5.7 Subsegment Market Size and Forecast
- 12.5.7.1 Direct Contract Sales
- 12.5.7.2 Distributor Sales
- 12.5.7.3 Branch and Digital Sales
- 12.5.8 Subsegment Pricing and Adoption Trends
- 12.5.9 Leading Suppliers and Competition
- 12.5.10 Regional Demand and Opportunities
- 12.6 Segment Growth Comparison
- 12.7 Segment Attractiveness and Priority Matrix
Chapter 13 Australia Merchant Carbon Dioxide End-Use and Application Market Outlook
- 13.1 End-Use Industry and Customer Demand Structure
- 13.2 Leading Applications and Customer Groups
- 13.3 End-Use Market Size, Share and Forecast
- 13.4 Major End-Use Industry Deep Dives
- 13.4.1 Customer Requirements and Use Cases
- 13.4.2 Demand and Replacement Cycles
- 13.4.3 Technical and Regulatory Considerations
- 13.4.4 Purchasing and Procurement Models
- 13.4.5 Leading Vendors and Distribution Channels
- 13.4.6 Forecast and Commercial Opportunities
- 13.5 Emerging Applications and Cross-Segment Demand
- 13.6 End-Use Industry Investment Priorities
Chapter 14 Australia Merchant Carbon Dioxide Geographic Market Outlook, 2025-2035
- 14.1 Domestic Market Distribution and Demand Clusters
- 14.2 State- or Province-Wise Market Size and Forecast, 2025-2035
- 14.3 City and Metropolitan Market Outlook
- 14.4 Industrial, Manufacturing and Commercial Clusters
- 14.5 Geographic Concentration of Key End Users
- 14.6 Local Pricing and Purchasing Differences
- 14.7 Domestic Production Facilities and Capacity Map
- 14.8 Local Infrastructure and Project Pipeline
- 14.9 State-Level Policy and Incentive Differences
- 14.10 Subnational Investment Hotspots and Opportunities
- 14.11 Distribution and Logistics Networks
- 14.12 Domestic Competitive Footprint
Chapter 15 Australia Merchant Carbon Dioxide Technology, Innovation and Sustainability Outlook
- 15.1 Technology Landscape and Maturity
- 15.2 Product, Process and Service Innovation
- 15.3 AI, Automation and Digital Tools in the Industry
- 15.4 Technology Adoption and Performance Benchmarking
- 15.5 Innovation Pipeline and R&D Investment
- 15.6 Patent and Intellectual Property Trends
- 15.7 Energy Efficiency and Resource Management
- 15.8 Sustainability, Recycling and Circularity
- 15.9 Technology Roadmap, 2025-2035
- 15.10 Risks of Obsolescence and Technology Substitution
Chapter 16 Australia Merchant Carbon Dioxide Market Key Strategic Imperatives
- 16.1 Growth and Market Entry Priorities
- 16.2 High-Return Products and Segments
- 16.3 Pricing, Profitability and Cost Optimization
- 16.4 Technology Investment and Product Differentiation
- 16.5 Supply Chain Localization and Resilience
- 16.6 Distribution and Customer Acquisition
- 16.7 Partnership, Acquisition and Capacity Strategy
- 16.8 Regional Expansion Priorities
- 16.9 Short-, Medium- and Long-Term Actions
Chapter 17 Competition Outlook
- 17.1 Industry Competition Characteristics
- 17.2 Market Structure and Concentration
- 17.3 Market Share and Competitive Positioning, 2025
- 17.4 Company-Wise Revenue and Product Benchmarking
- 17.5 Production and Service Capacity Benchmarking
- 17.6 Technology, Pricing and Differentiation
- 17.7 Regional Footprint and Distribution Strength
- 17.8 Mergers, Acquisitions and Strategic Alliances
- 17.9 New Entrants and Competitive Threats
- 17.10 Porter's Five Forces and Industry Attractiveness
- 17.11 Competitive Outlook, 2025-2035
Chapter 18 Company Profiles
- 18.1 Company Coverage and Selection Criteria
- 18.2 BOC
- 18.2.1 Business Description
- 18.2.2 Company Ownership and Geographic Presence
- 18.2.3 Product and Service Portfolio
- 18.2.4 Manufacturing and Operating Footprint
- 18.2.5 Production Capacity and Expansion Plans
- 18.2.6 Financial Performance and Investment
- 18.2.7 Market Share and Competitive Position
- 18.2.8 Technology and Innovation Capabilities
- 18.2.9 Strategic Alliances or Partnerships
- 18.2.10 Recent Developments
- 18.2.11 Growth Strategy and Outlook
- 18.3 Air Liquide Australia
- 18.4 Coregas
- 18.5 Supagas
- 18.6 Cold Jet Australia
- 18.7 Dry Icetech Australia
- 18.8 Kryotech
- 18.9 Dry Ice Direct
- 18.10 Polar Dry Ice
- 18.11 Dry Ice Australia
- 18.12 Other Relevant Market Participants
Note: Every listed company is profiled on the structure shown under the first company. The company list is preliminary and may change based on research findings, market developments, data availability and client requirements.
Chapter 19 Disclaimer
- 19.1 Research and Forecast Disclaimer
- 19.2 Data Source and Estimation Limitations
Note: The depth of individual sections depends on data availability for this market. Volume, capacity, trade and other unit-based metrics are included where applicable.

