
Waterborne house paint sets the pace for additive demand
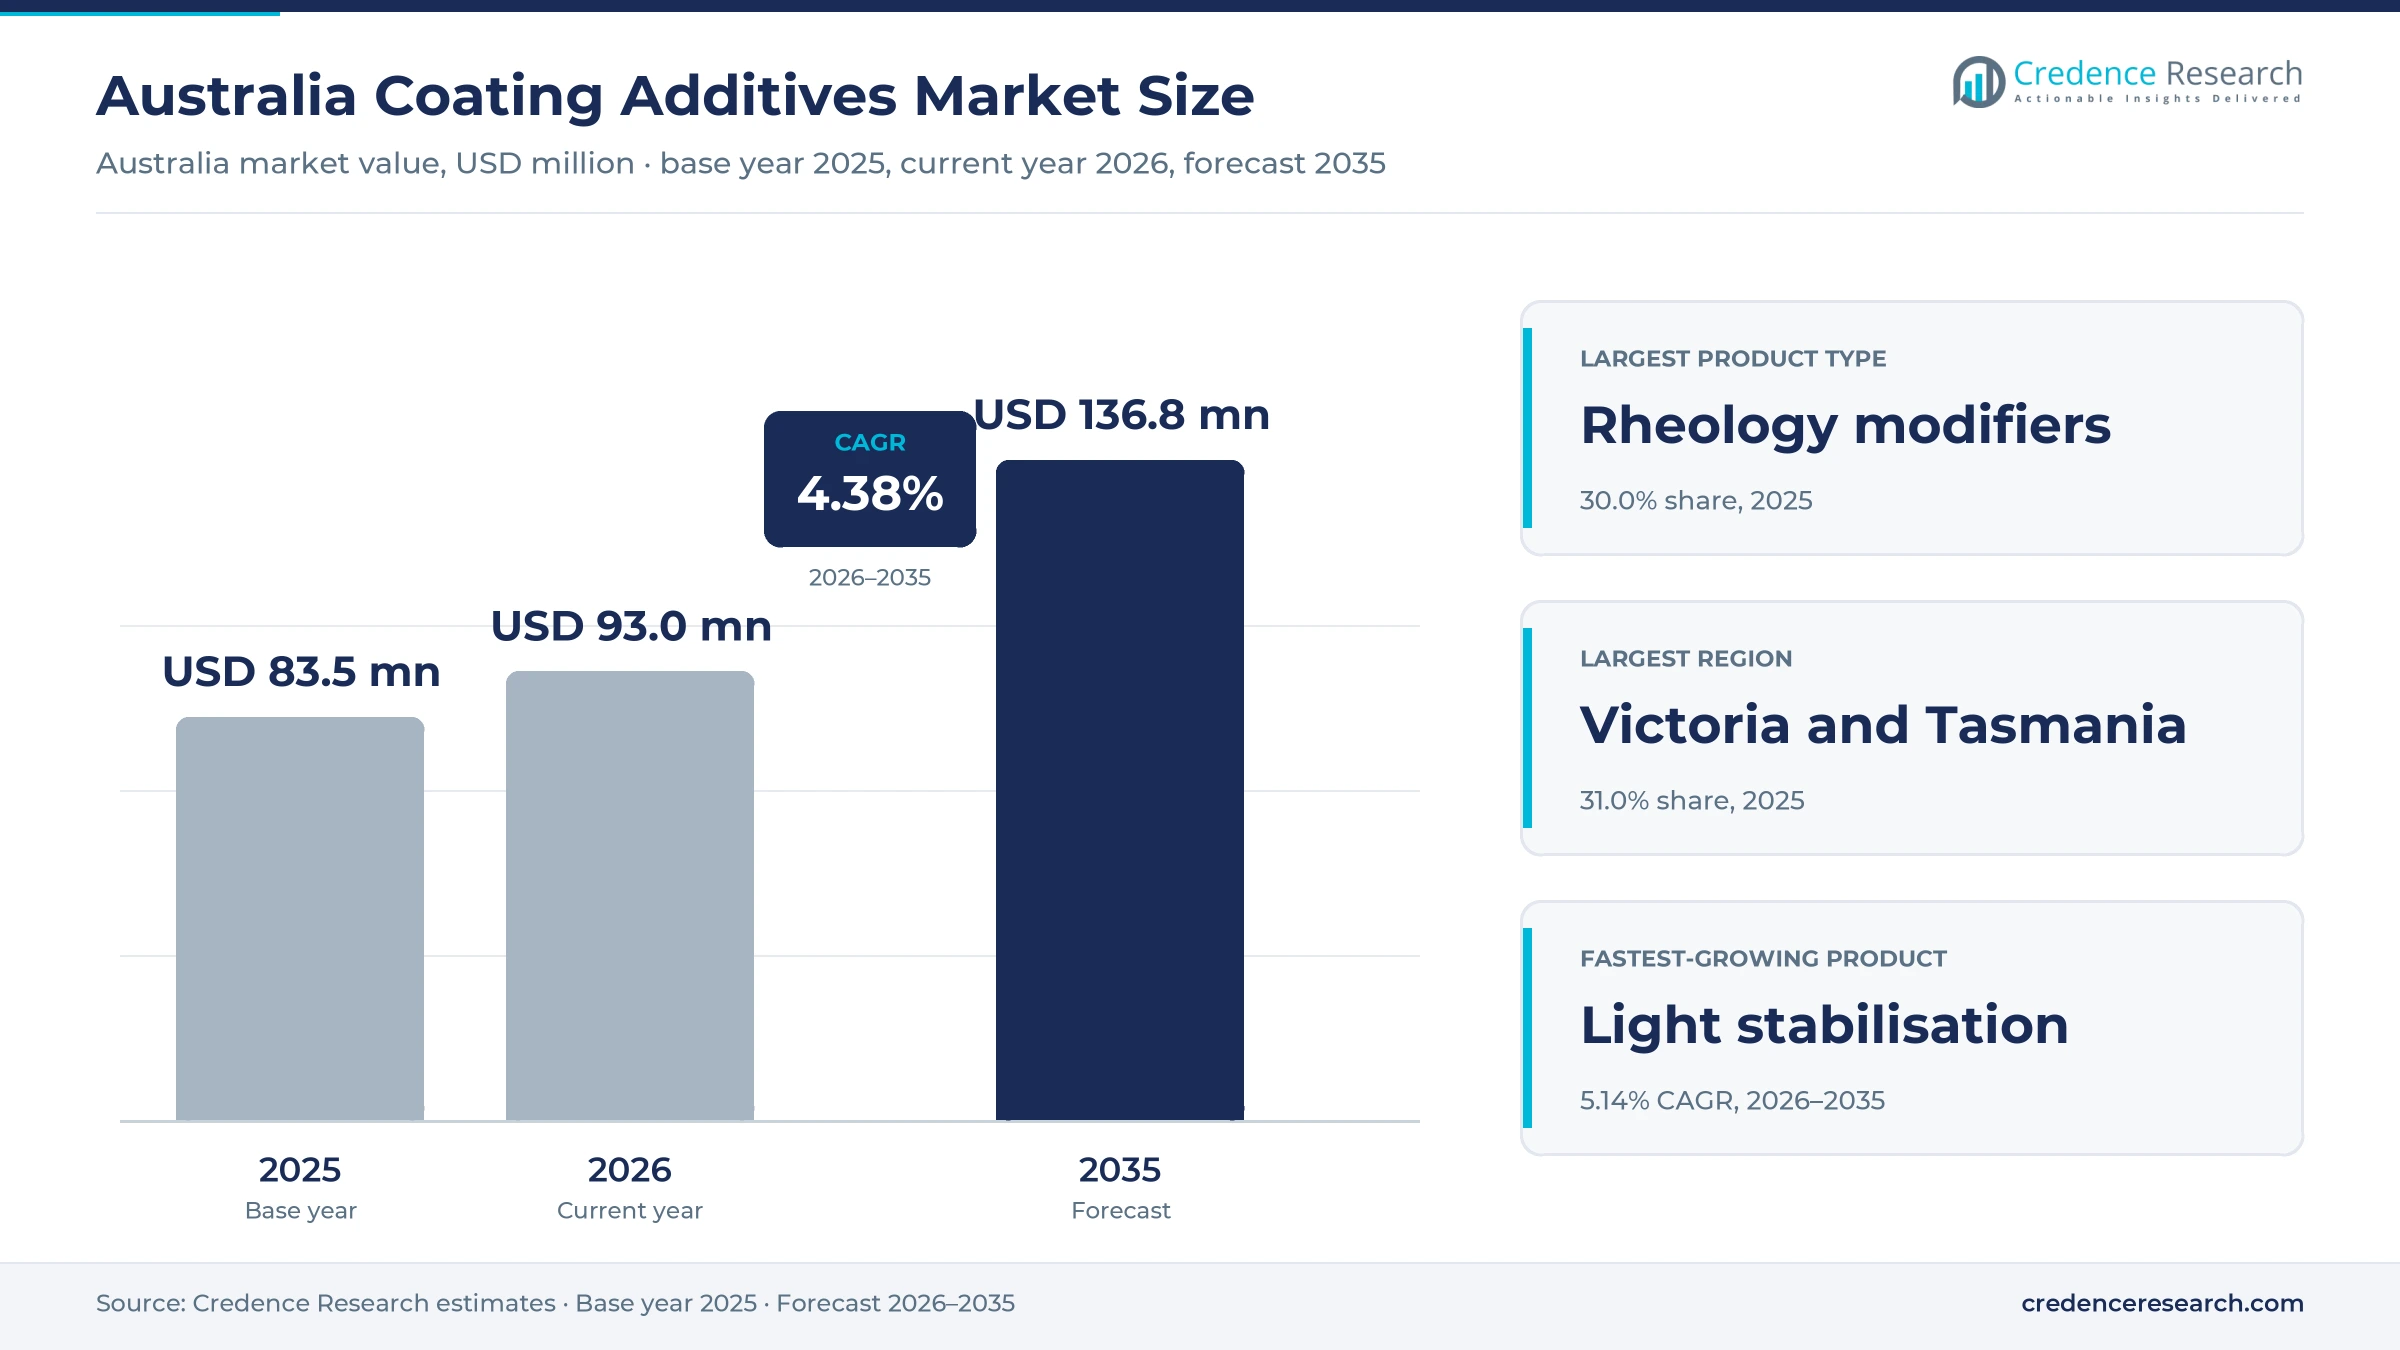
The Australia coating additives market was valued at USD 83.5 million in 2025 and is projected to increase from USD 93.0 million in 2026 to USD 136.8 million by 2035, registering a CAGR of 4.38% during 2026–2035. Demand comes from paint and coating formulators that add small doses of thickeners, dispersants, defoamers, surface agents and stabilizers to house paint, protective coatings, wood finishes and specialty products. Victoria and Tasmania held the largest regional share, 31.0% in 2025, because Victoria completes more new homes than any other state. Queensland is the fastest-growing region at 4.76% a year, as dwelling completions in the state rose through 2026. However, tight low-VOC limits for certified waterborne paint have pushed formulators toward additive packages that deliver flow, stability and durability without solvents.
Which additive types and coating uses does the estimate cover?
The estimate measures the value of performance additives sold to coating formulators in Australia, including rheology modifiers, wetting and dispersing agents, defoamers and deaerators, surface performance additives and preservation and light stabilisation additives. It counts additives used in architectural, industrial and protective, wood, automotive and marine, coil, packaging and specialist coatings.
The estimate excludes binders, resins, pigments, extenders and solvents, as well as finished paint sales and application labor. The value chain runs from global additive producers through local distributors and direct sales teams to paint manufacturers, which then supply retailers, contractors and industrial users.
Australia Coating Additives Market Insights
- The Australia coating additives market was valued at USD 83.5 million in 2025 and is projected to reach USD 136.8 million by 2035, registering a CAGR of 4.38% during 2026–2035.
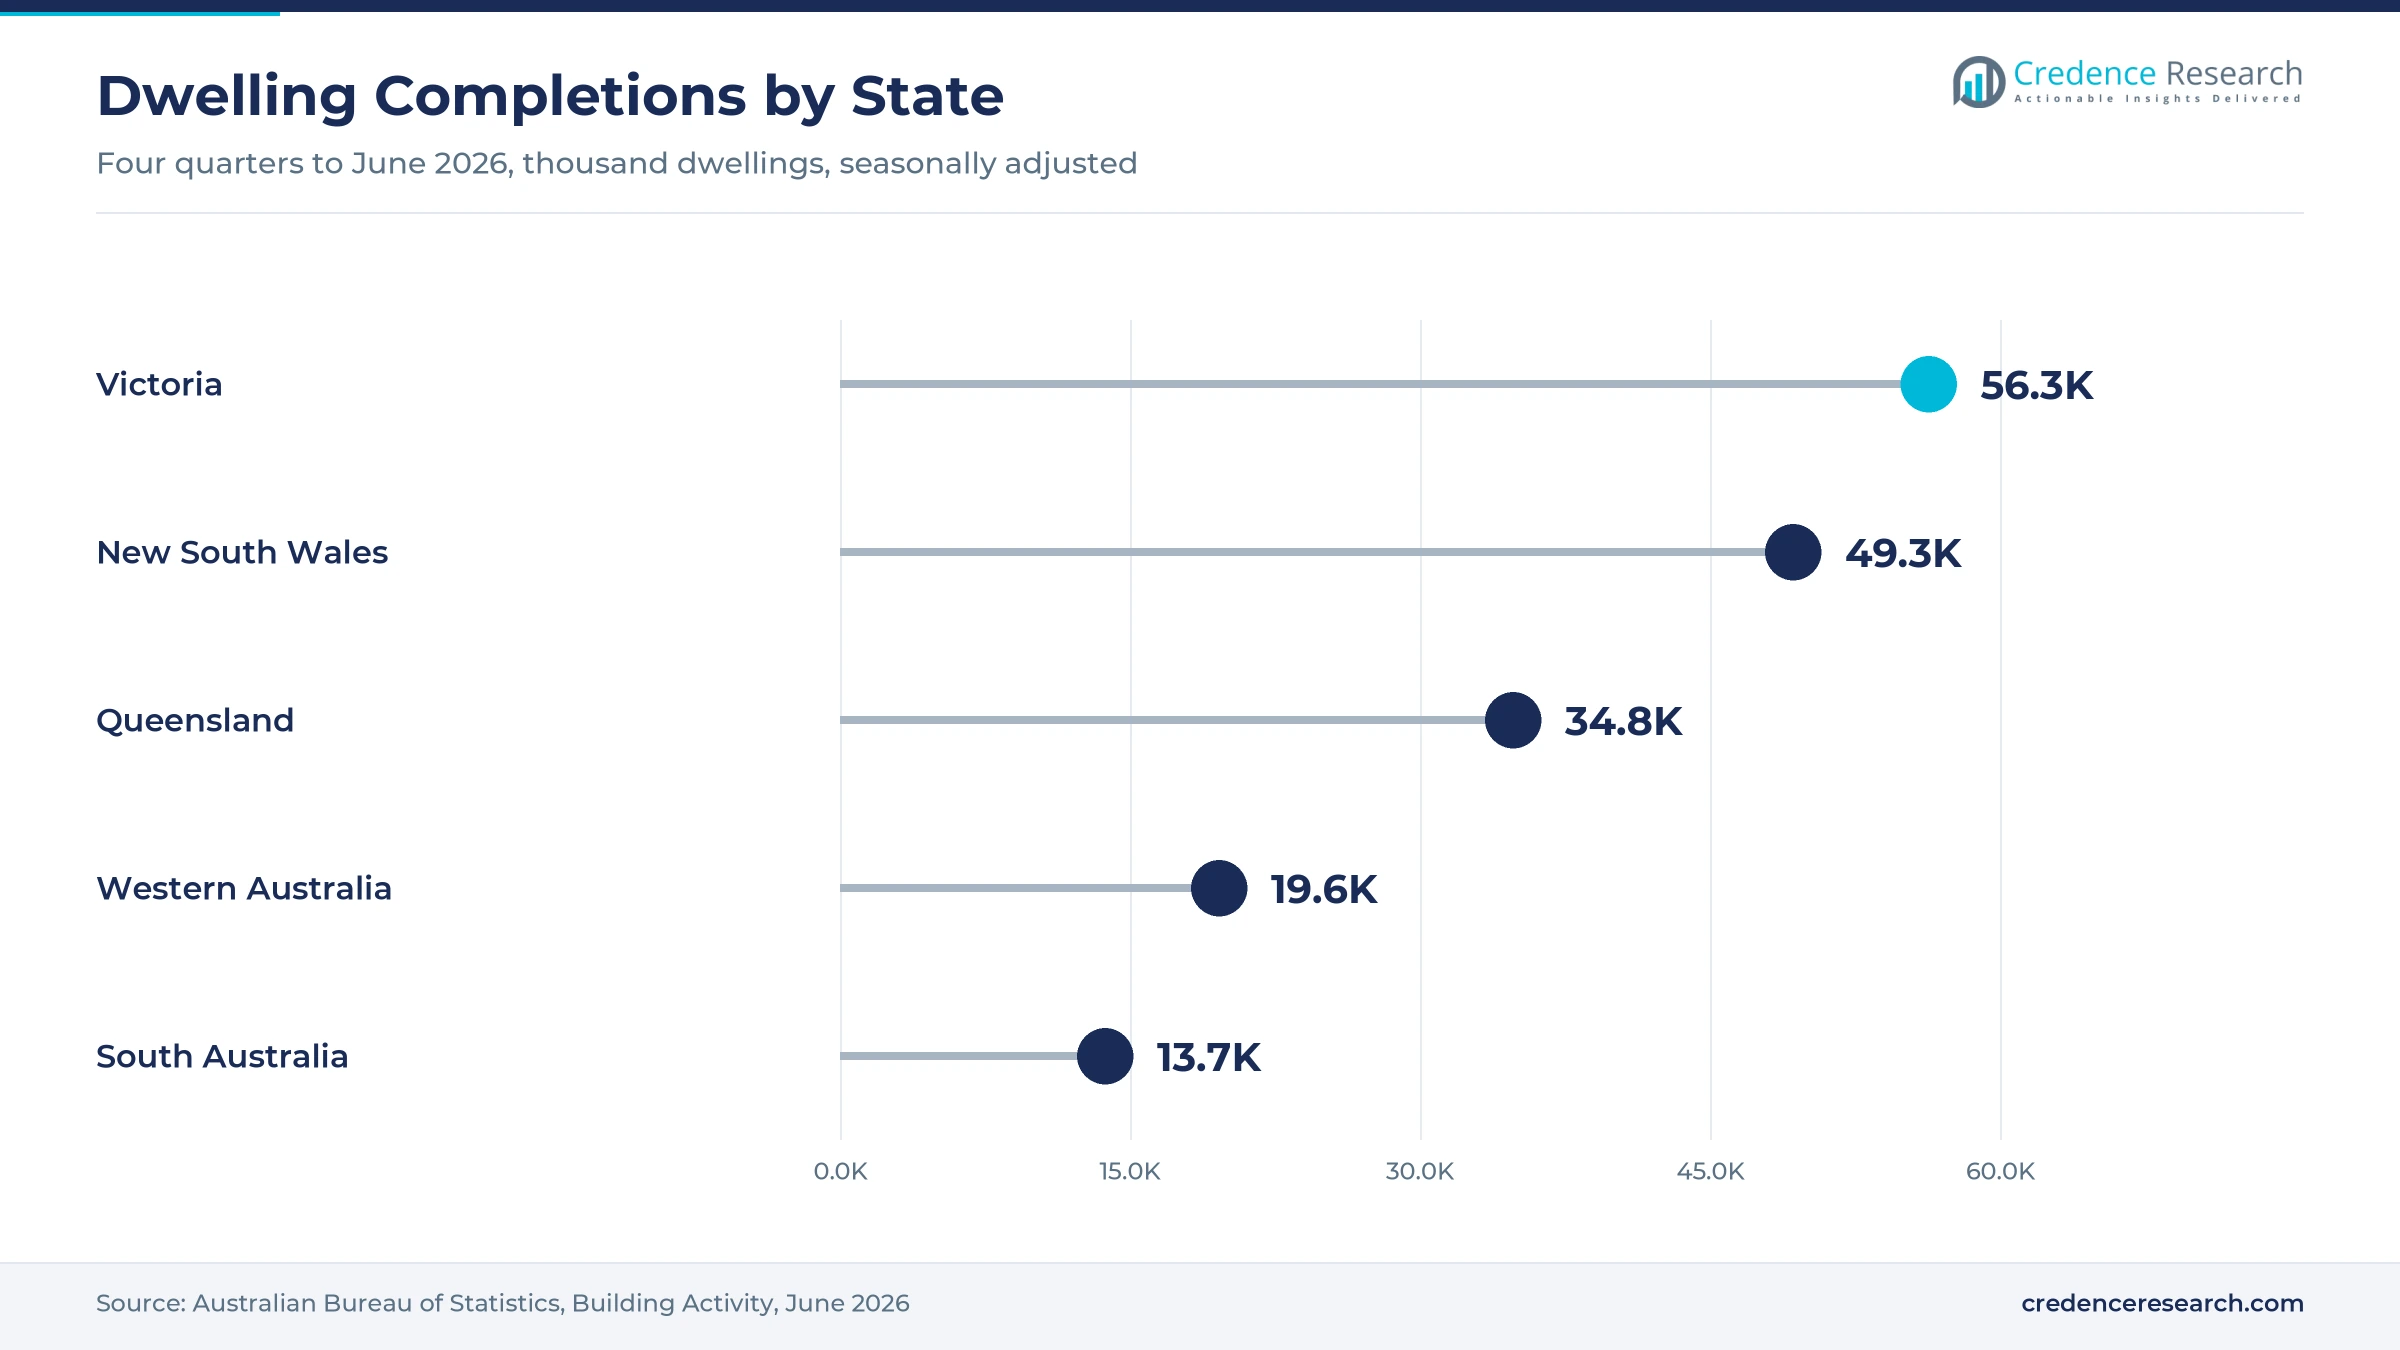
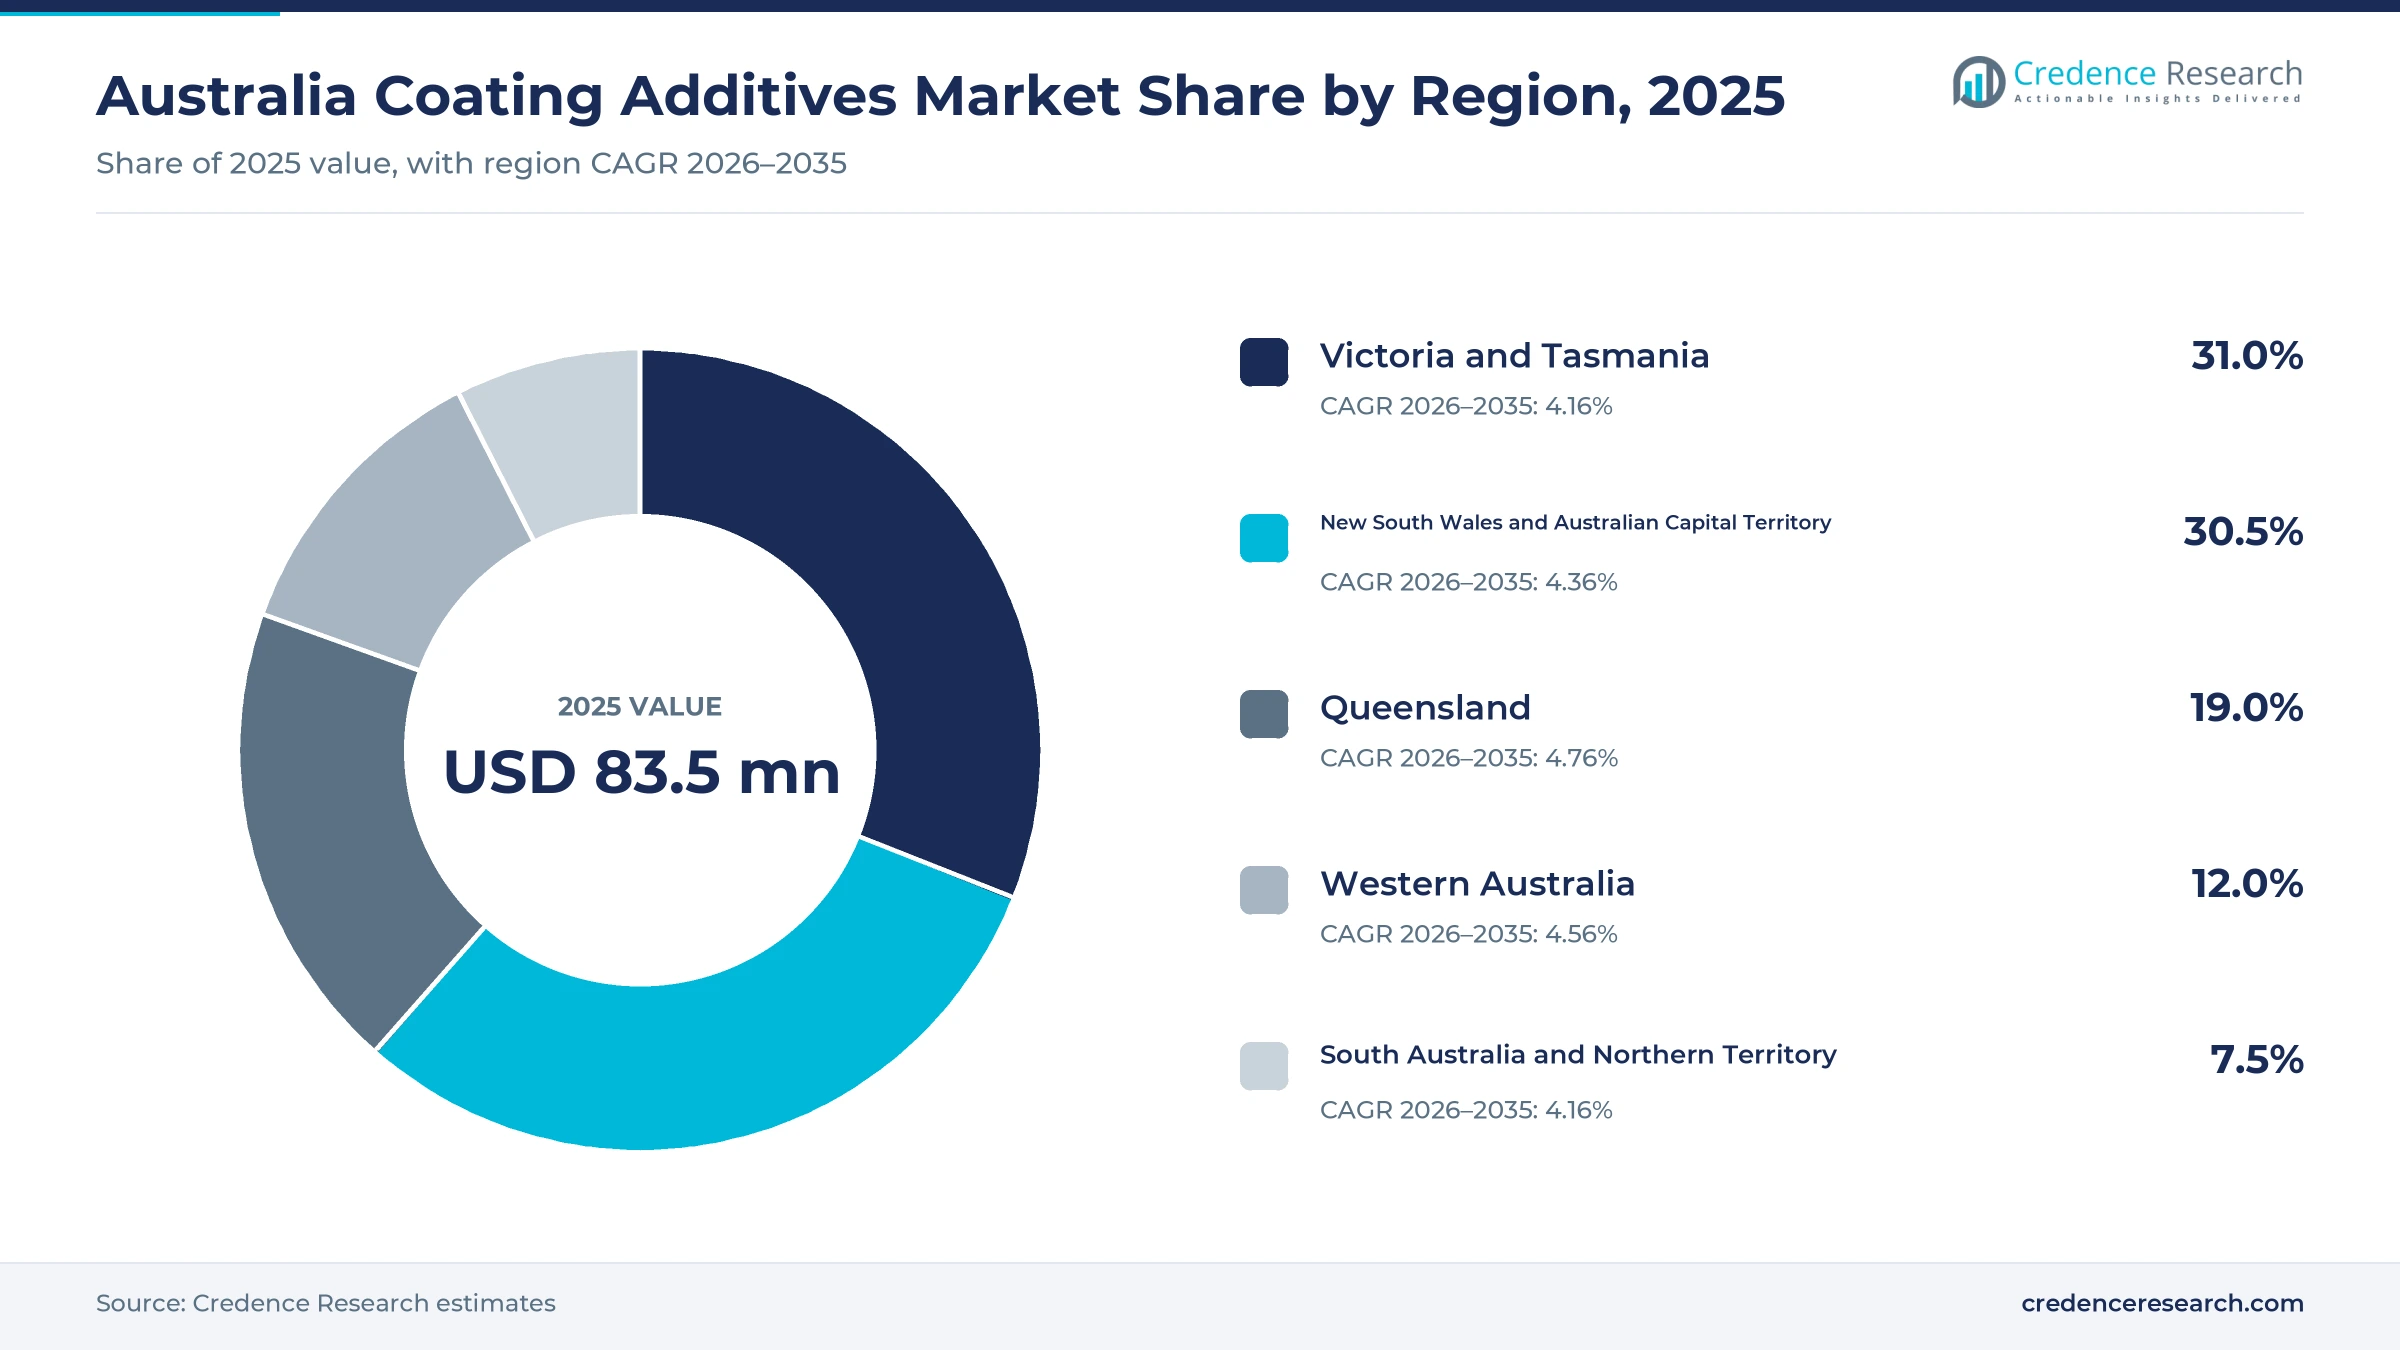
- Victoria and Tasmania held a 31.0% share of 2025 value, because Victoria completed about 56,300 dwellings in the four quarters to June 2026, the most of any state.
- Rheology modifiers led with a 30.0% share of 2025 value, because every waterborne house paint needs thickeners to control flow, sag and brush feel.
- Australia recorded 47,168 dwelling completions in the June 2026 quarter in seasonally adjusted terms, which supports new-build paint and additive demand.
- Preservation and light stabilisation additives grow fastest at 5.14% a year during 2026–2035, as exterior paints face some of the strongest UV exposure in the world.
Rheology modifiers lead while UV protection grows fastest
Why do rheology modifiers hold the largest value?
Based on product type, the market is categorized into rheology modifiers, wetting and dispersing agents, defoamers and deaerators, surface performance additives and preservation and light stabilisation additives. Rheology modifiers led with a 30.0% share of 2025 value, because every waterborne paint needs thickeners for flow and sag control. Preservation and light stabilisation additives grow fastest at 5.14% a year, as exterior paints face intense sunlight.
How does architectural paint dominate additive use?
Based on application, the market is categorized into architectural coatings, industrial and protective coatings, wood and furniture coatings, automotive and marine coatings, and coil, packaging and specialist coatings. Architectural coatings led with a 52.0% share of 2025 value, because house paint is the largest coating volume in the country. Industrial and protective coatings grow fastest at 4.85% a year, as mining and infrastructure assets need corrosion protection.
Which sales channels move the most additives?
Based on sales channel, the market is categorized into direct manufacturer sales, specialty distributor sales and direct overseas procurement. Specialty distributor sales led with a 50.0% share of 2025 value, because most global additive makers serve Australian formulators through local distributors with laboratories. Specialty distributor sales also grow fastest at 4.67% a year, as distributors consolidate principals and technical service.
| Segment Group | Leading Sub-segment | Share, 2025 | Fastest-growing Sub-segment | CAGR, 2026–2035 |
|---|---|---|---|---|
| By Product Type | Rheology modifiers | 30.0% | Preservation and light stabilisation additives | 5.14% |
| By Application | Architectural coatings | 52.0% | Industrial and protective coatings | 4.85% |
| By Sales Channel | Specialty distributor sales | 50.0% | Specialty distributor sales | 4.67% |
Request a Free Sample
Fill in your details and we'll send you a free sample report.
- Sample data tables & charts
- Research methodology
Housing completions, VOC limits and harsh sun lift demand
How do housing completions and repainting lift additive demand?
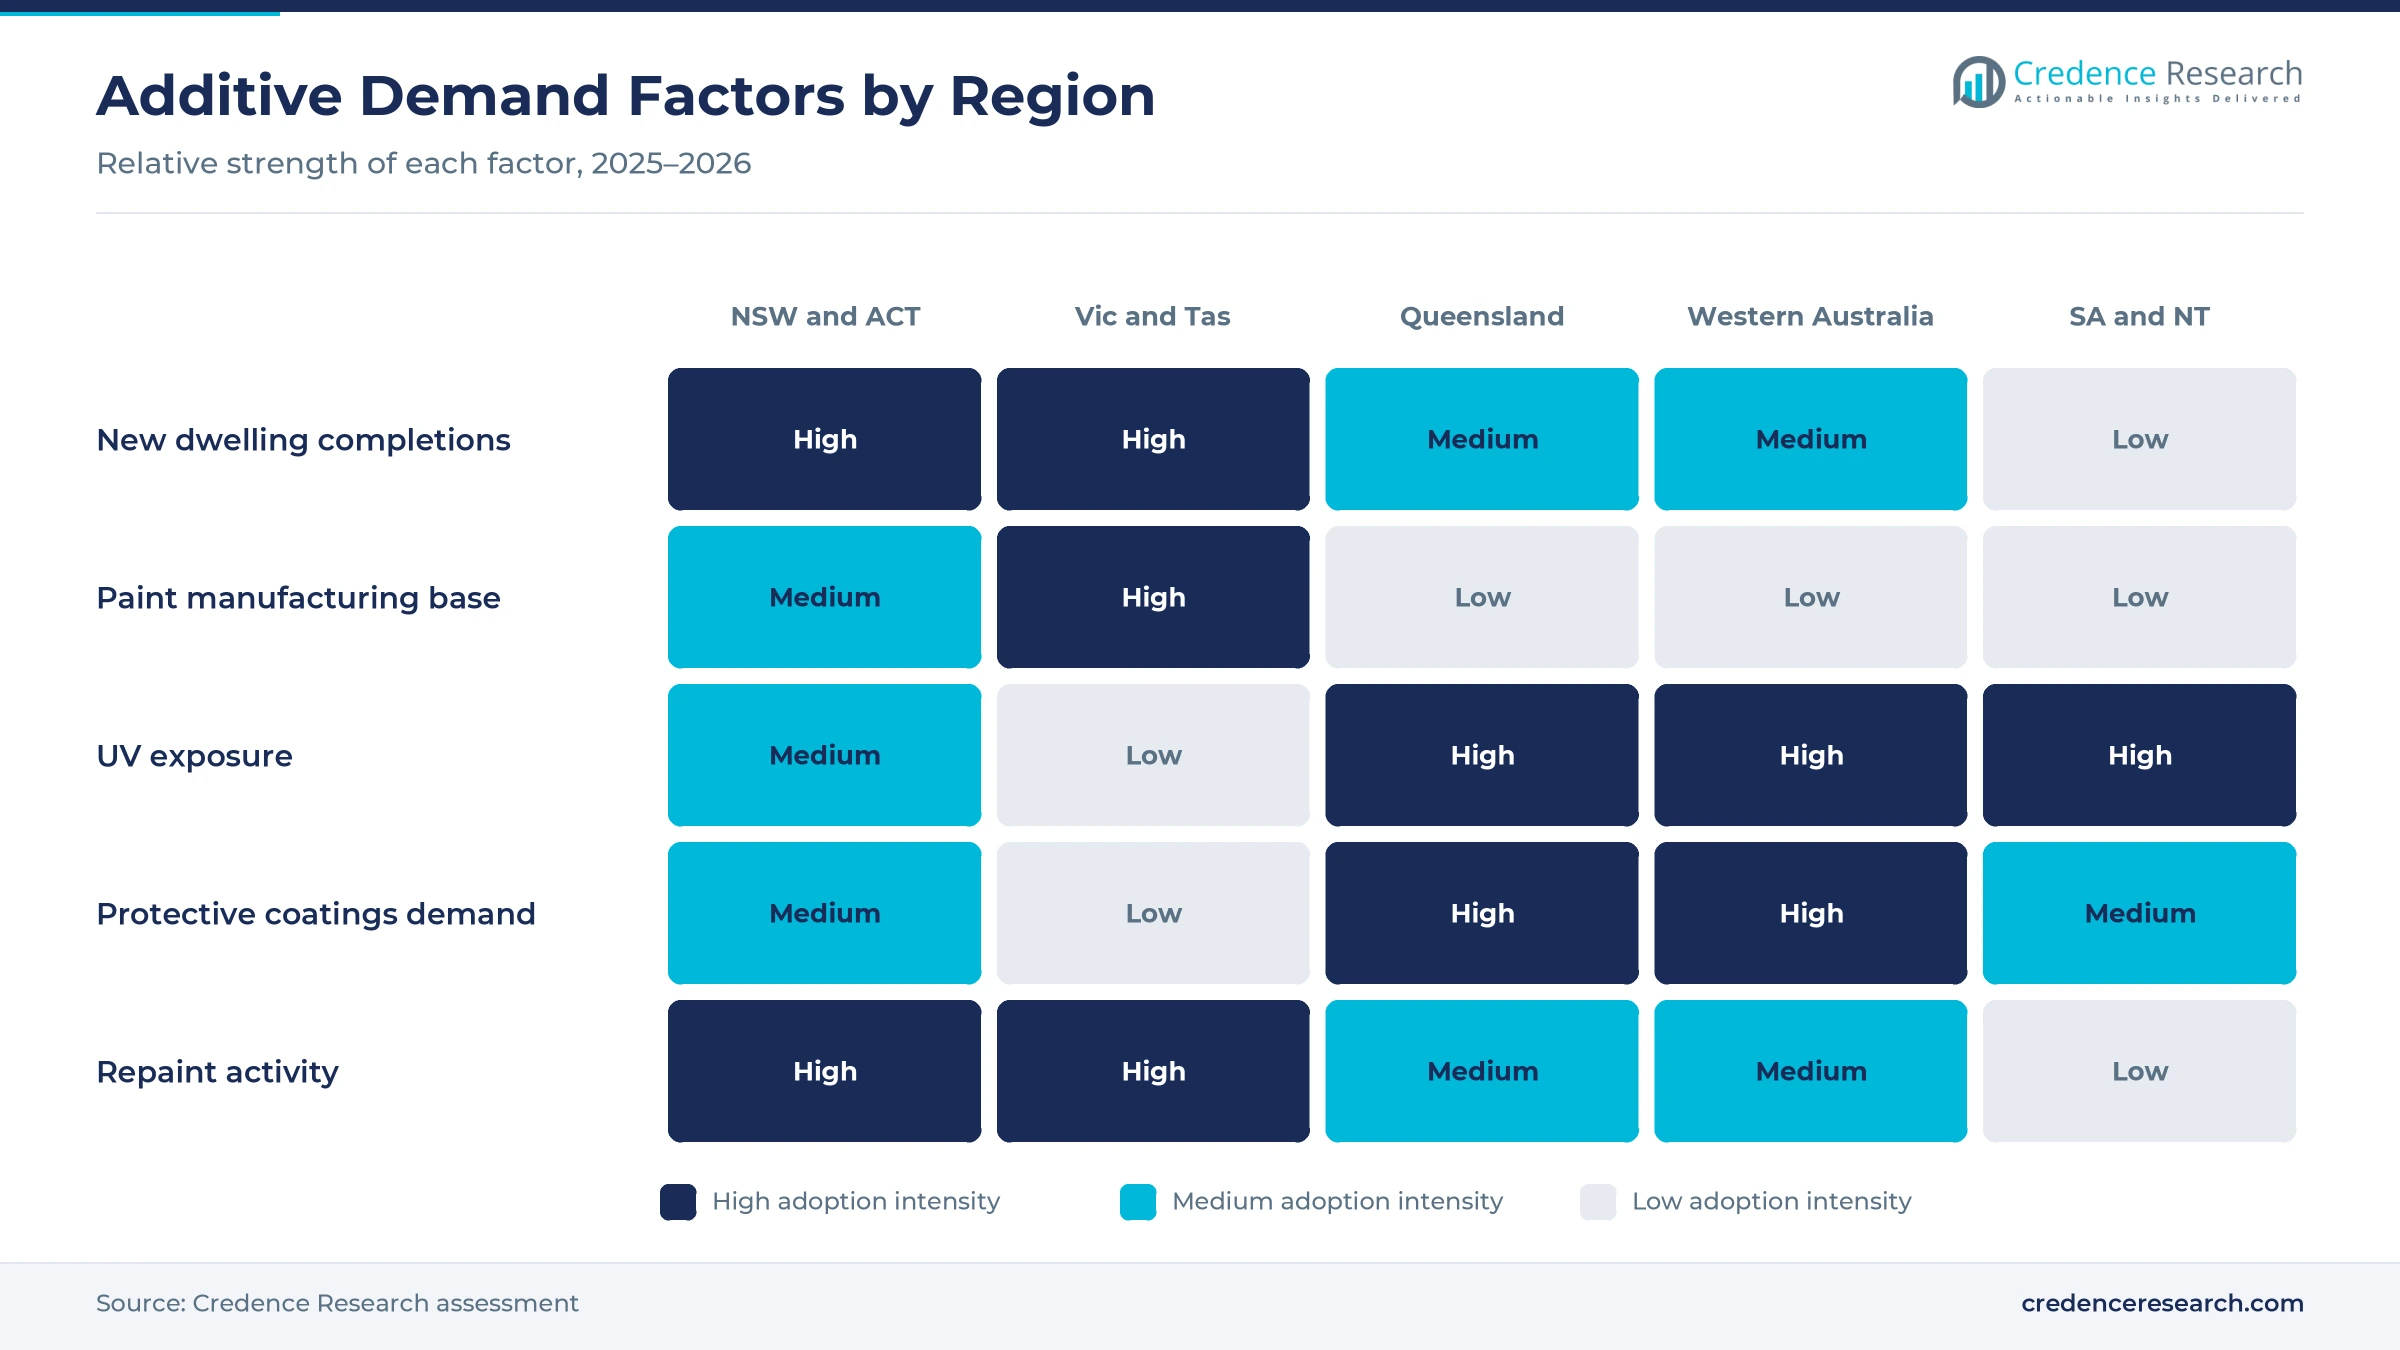
Residential completion and repainting demand lifts additive use, because every new home and every repaint job consumes interior and exterior paint built on additive packages. Australia recorded 47,168 dwelling completions in the June 2026 quarter in seasonally adjusted terms, up 5.8% on the prior quarter, according to the Australian Bureau of Statistics. Other residential completions such as apartments reached 19,018 in that quarter, the highest quarterly level since June 2020. Dwelling commencements also reached 52,201 in the June 2026 quarter, up 14.4% in annual terms. As a result, architectural coatings hold 52.0% of 2025 value, because house paint consumes most associative thickeners sold locally.
Why does low-VOC qualification shape additive choice?
Low-VOC formulation qualification shapes additive choice, because certified paints must meet strict solvent limits while still flowing, leveling and resisting foam. The Australian Paint Approval Scheme VOC limits set interior low-odor latex paints below 5 grams per liter. The same March 2024 document caps interior water-based gloss paint at a 60 gram average and a 70 gram maximum. Exterior water-based gloss paint faces a 55 gram average and a 60 gram maximum under the scheme. In turn, formulators replace solvent-based flow aids with waterborne wetting agents and silicone-free foam control agents, which raises additive value per liter of finished paint.
How does harsh sunlight lift demand for stabilizers?
Exterior durability and stabilization needs lift demand, because Australian sunlight breaks down binders, fades color and chalks paint films faster than in most markets. Australia experiences some of the highest levels of ultraviolet radiation, according to a December 2024 review indexed by the U.S. National Institutes of Health. Peak summer UV index values regularly exceed 12 to 14 and can reach 16 to 17 at northern latitudes. Exterior water-based paints also face tight VOC caps, so formulators cannot rely on solvent-rich systems for durability. As a result, preservation and light stabilisation additives grow at 5.14% a year, the fastest product type during 2026–2035.
Why does local technical service support additive sales?
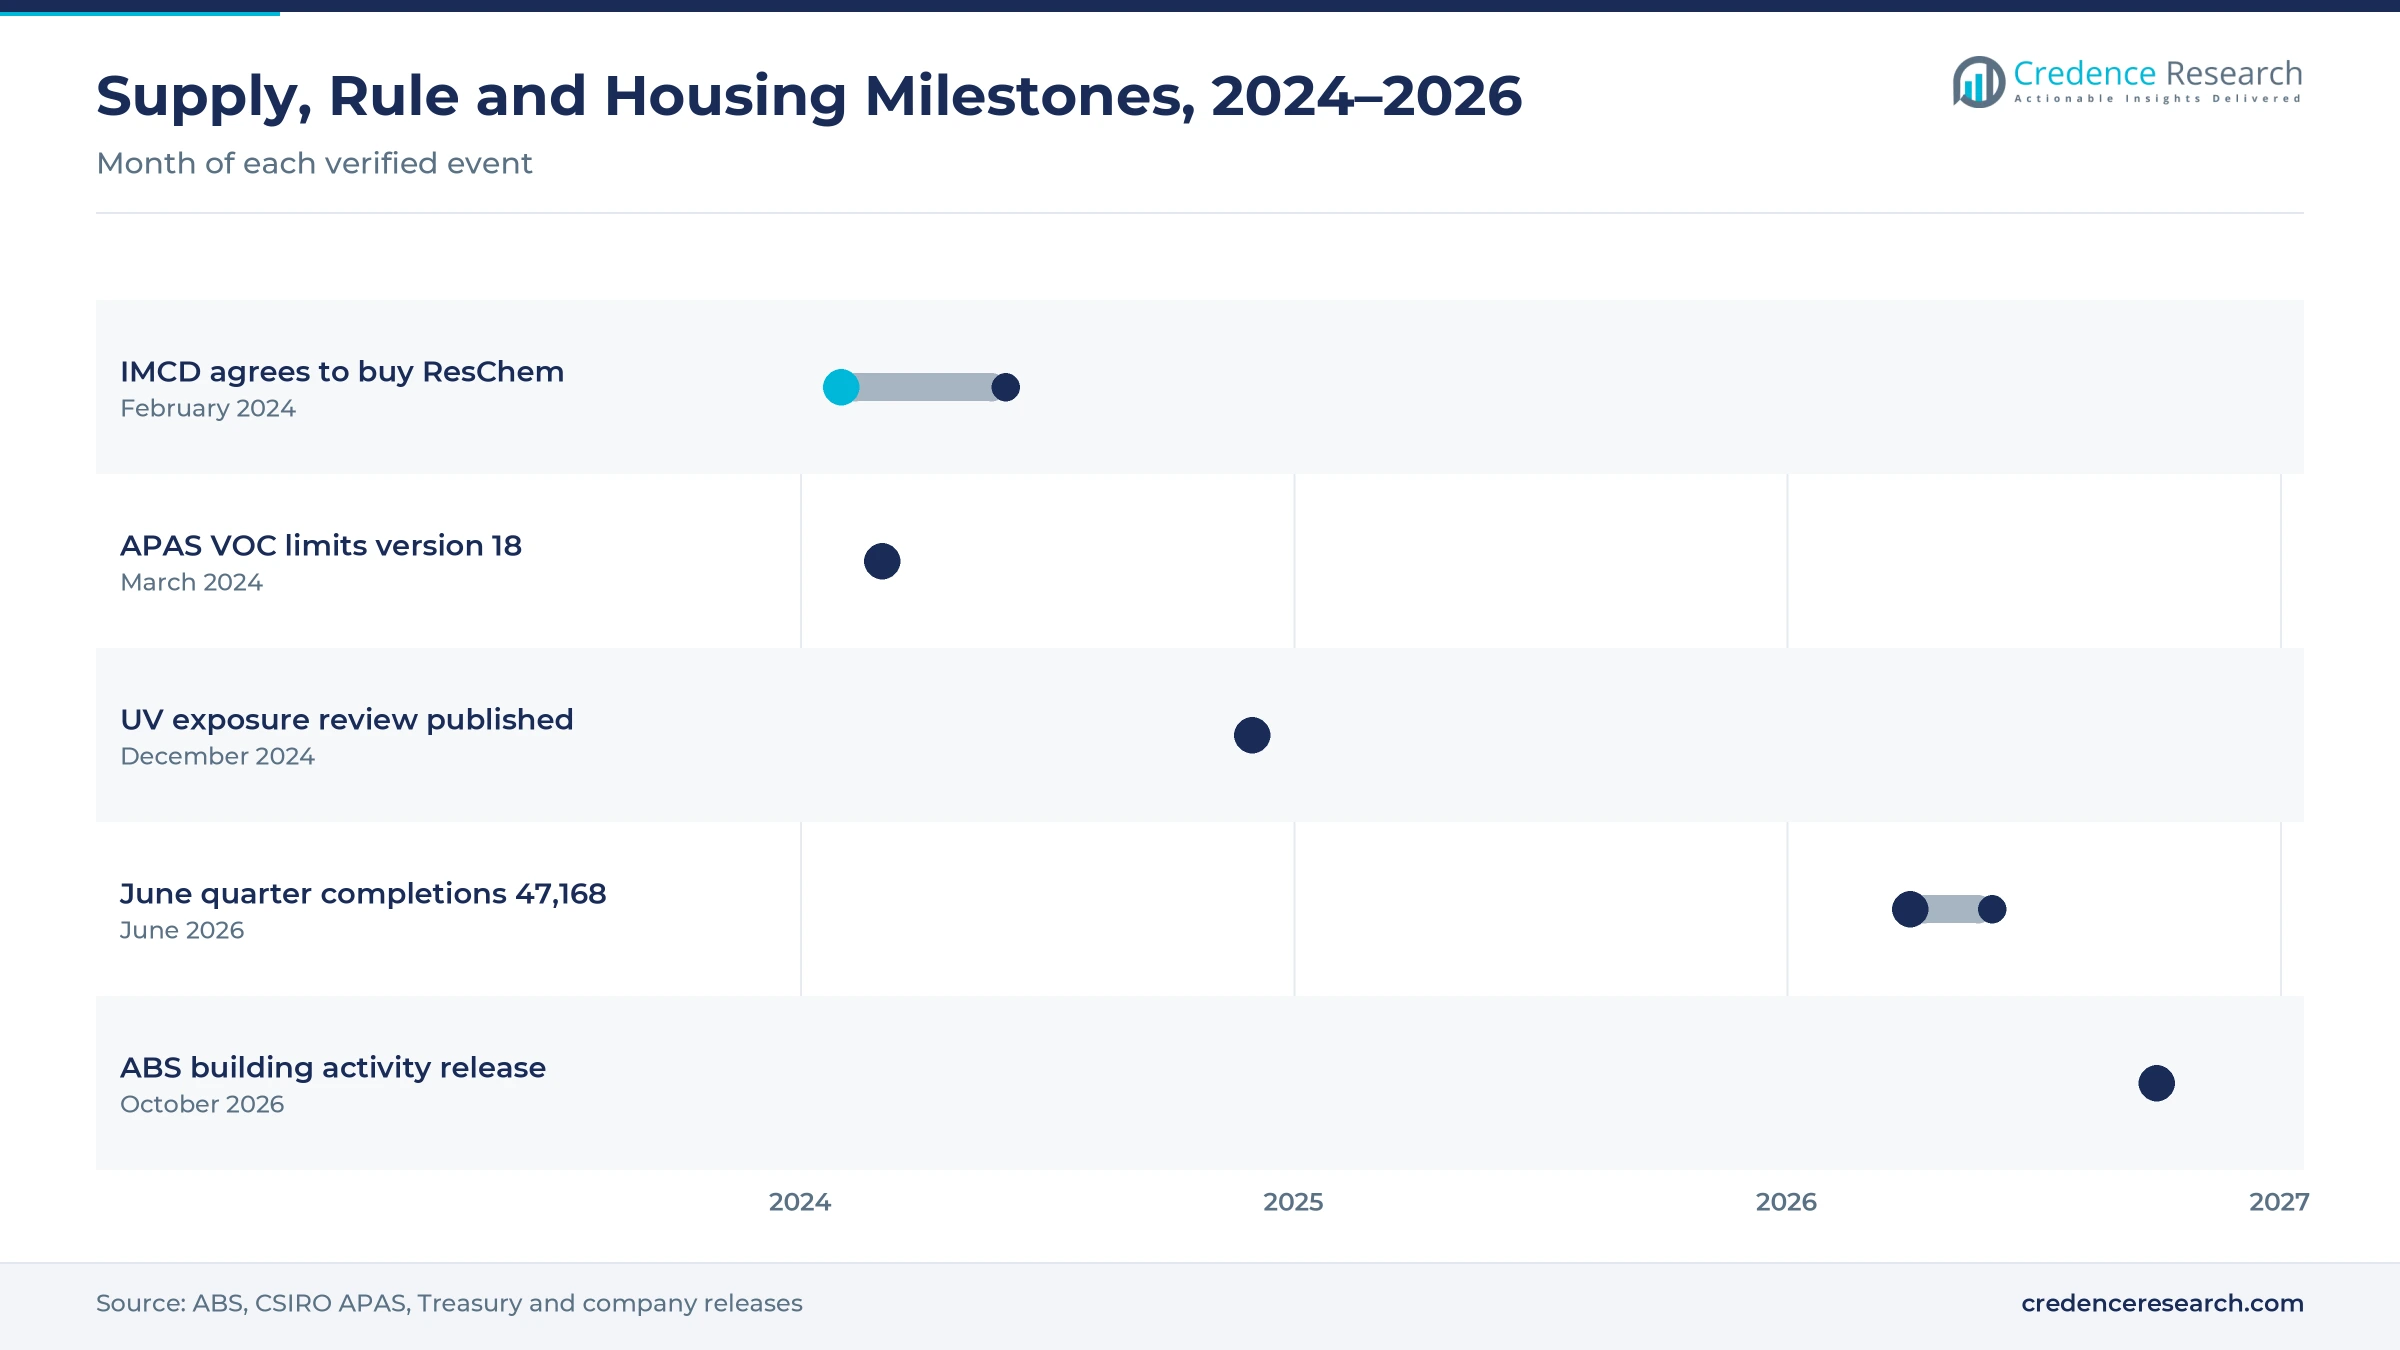
Local technical service supports additive sales, because formulators need laboratory help to adapt global additive grades to Australian raw materials, climate and certification rules. BASF opened a dispersions and resins laboratory at Monash University in Melbourne to support paint makers in Australia and New Zealand, according to BASF Australia. IMCD announced the purchase of Sydney-based ResChem Technologies on Feb. 19, 2024, adding an application laboratory for coatings. ResChem is also listed as the Australian distributor for BYK additives. In turn, specialty distributor sales hold 50.0% of 2025 value, because distributors bundle laboratory support with local stock and fast delivery to plants.
Low-odor paint and distributor consolidation reshape supply
How is the shift to low-odor interior paint changing formulas?
The shift to low-odor interior paint is changing formulas, because homeowners and contractors want rooms that can be used soon after painting. Interior low-odor latex paints must stay below 5 grams of VOC per liter to gain the low-VOC certification, which removes most coalescing solvents. Other residential completions, where indoor air quality matters to buyers, reached their highest quarterly level since 2020 in mid-2026. Interior water-based flat ceiling paint is also capped at a 50 gram VOC maximum under the same scheme. Formulators therefore depend more on dispersants and thickeners that keep paint stable without solvent support. As a result, rheology modifiers keep 30.0% of 2025 value, because every low-odor paint relies on them for brush feel and sag control.
Why is the rise of distributor consolidation notable?
The rise of distributor consolidation is notable, because fewer and larger distributors now control access to many global additive brands. Elementis appointed DKSH as its exclusive distributor for coating additives, resins and talc in Australia and New Zealand, according to an Elementis announcement dated Nov. 2, 2020. IMCD agreed to buy ResChem Technologies in February 2024, with closing expected in the second quarter of that year. ResChem specializes in resins, additives and pigments for inks, coatings, adhesives and construction, and it runs an application laboratory in Sydney. In turn, specialty distributor sales grow at 4.67% a year, the fastest sales channel during 2026–2035.
Can protective coatings for resource assets open new demand?
Protective coatings for resource assets can open new demand, because mines, ports and processing plants need long-life corrosion protection in harsh coastal and inland climates. Western Australia completed about 19,600 dwellings in the four quarters to June 2026, which reflects steady population growth around resource jobs. Commencements across Australia also rose 7.0% in the June 2026 quarter, which signals further building and infrastructure work. High UV levels in northern regions, where peak index values can reach 16 to 17, add extra stress to protective films on steel and concrete. As a result, industrial and protective coatings grow at 4.85% a year, the fastest application during 2026–2035.
Is there room to grow in UV stabilizer packages?
UV stabilizer packages offer room to grow, because paint makers can charge more for exterior products that hold color and gloss longer. Peak UV index readings in Australian summers regularly pass 12, which shortens repaint cycles for weak paint films. Queensland completed about 34,800 dwellings in the four quarters to June 2026, which adds new exterior walls in a hot climate. Exterior water-based gloss paints also need durable performance within a 60 gram VOC maximum. Formulators therefore add hindered amine light stabilizers and UV absorbers to premium exterior ranges. In turn, Queensland and Western Australia offer strong demand for stabilized exterior paint, because both states combine hot climates with new housing.
Import dependence and price pressure squeeze suppliers
How does import dependence expose additive users?
Import dependence exposes additive users, because most specialty additives are made overseas and shipped to Australian formulators in small lots. As a result, freight delays and currency swings can raise costs and interrupt paint production schedules. Formulators respond by holding more safety stock and approving second sources, which protects supply but ties up working capital. This risk stays high while local production of specialty chemistries remains limited.
Why does price pressure from paint makers squeeze margins?
Price pressure from paint makers squeezes margins, because a few large formulators buy most additive volume and negotiate hard on cost. In turn, suppliers face pressure to cut prices on standard thickeners and defoamers each contract round. Additive makers respond with performance grades that reduce dose rates, which lets them hold value while lowering cost per liter for buyers. This pressure favors suppliers that offer strong application support and local stock.
How do reformulation costs slow new additive adoption?
Reformulation costs slow new additive adoption, because every additive change requires stability, color and durability testing before a paint can keep its certification. As a result, formulators often delay switching suppliers even when a new grade performs better. Suppliers respond with laboratory support, trial batches and shared test data, which shorten approval time for new grades. This barrier protects incumbent suppliers yet slows the spread of new chemistry.
Why do housing cycles create uneven demand?
Housing cycles create uneven demand, because new dwelling completions rise and fall with interest rates, labor supply and approvals. In turn, additive orders from architectural paint makers can swing from quarter to quarter, which complicates inventory planning. Suppliers respond by balancing new-build demand with repaint and industrial work, which tends to be steadier over time. This pattern rewards suppliers with diverse customer bases across several coating segments.
Victorian home building and Sydney labs anchor demand
| Region | Value, 2025 (USD million) | Share, 2025 | CAGR, 2026–2035 |
|---|---|---|---|
| Victoria and Tasmania | 25.9 | 31.0% | 4.16% |
| New South Wales and Australian Capital Territory | 25.5 | 30.5% | 4.36% |
| Queensland | 15.9 | 19.0% | 4.76% |
| Western Australia | 10.0 | 12.0% | 4.56% |
| South Australia and Northern Territory | 6.3 | 7.5% | 4.16% |
Why do Victoria and Tasmania hold the top share?
Victoria and Tasmania held a 31.0% share of 2025 value and grow at 4.16% a year, because Victoria builds the most new homes and Melbourne hosts additive laboratories. Victoria completed about 56,300 dwellings in the four quarters to June 2026 in seasonally adjusted terms, the most of any state. BASF also opened a dispersions and resins laboratory at Monash University in Melbourne in 2018. As a result, this zone buys the largest volume of additives for house paint.
How do New South Wales and the ACT support additive demand?
New South Wales and the Australian Capital Territory held a 30.5% share of 2025 value and grow at 4.36% a year, because Sydney has large repaint and apartment markets. New South Wales completed about 49,300 dwellings in the four quarters to June 2026. ResChem Technologies, which IMCD agreed to acquire in 2024, runs a coatings application laboratory in Sydney. In turn, this zone combines strong repaint demand with distributor technical service.
Why is Queensland growing fastest?
Queensland held a 19.0% share of 2025 value and grows fastest at 4.76% a year, because dwelling completions in the state reached 9,549 in the June 2026 quarter, the highest quarterly total since December 2023. Hot and humid weather also raises demand for mold-resistant and UV-stable exterior paint. Northern areas face peak UV index values that can reach 16 to 17. As a result, Queensland buys more stabilizer and preservation additives per liter of paint.
What supports additive demand in Western Australia?
Western Australia held a 12.0% share of 2025 value and grows at 4.56% a year, because mining, ports and processing plants need protective coatings. The state completed about 19,600 dwellings in the four quarters to June 2026, which supports house paint demand in Perth. Strong sunlight across the state also favors durable exterior paint. In turn, Western Australia combines protective coatings demand with steady architectural paint demand.
How do South Australia and the Northern Territory contribute?
South Australia and the Northern Territory held a 7.5% share of 2025 value and grow at 4.16% a year, because they cover smaller populations in Adelaide and Darwin. South Australia completed about 13,700 dwellings in the four quarters to June 2026. Tropical conditions in Darwin add demand for UV and mold protection. As a result, this zone relies on national distributors for most additive supply.
Distribution deals, VOC rules and housing data milestones
| Development | Status and market relevance |
|---|---|
| In February 2024, IMCD announced the acquisition of Sydney-based ResChem Technologies. | Consolidates coatings additive distribution in Australia |
| In March 2024, the Australian Paint Approval Scheme issued version 18 of its VOC limits document. | Sets solvent caps that steer additive selection |
| In June 2025, BASF Coatings appointed S&S Industries as its refinish distributor in Western Australia. | Widens automotive refinish supply in the western zone |
| In October 2025, BASF Coatings added South Australia to its refinish partnership with Wholesale Paint Group. | Extends refinish coverage to South Australian body shops |
| In October 2026, the Australian Bureau of Statistics reported 47,168 dwelling completions for the June 2026 quarter. | Confirms rising new-build paint demand |
Associative thickeners and UV packages define performance
- Associative thickeners build viscosity in waterborne paint without solvents, which gives low-odor paint good brush feel, leveling and sag control.
- Polymeric dispersants wet and stabilize pigments in water, which improves color strength and keeps tinted paint stable in store.
- Silicone-free defoamers break foam during mixing and rolling without causing surface defects, which suits low-VOC paint lines and fast filling speeds in modern plants.
- UV absorber and HALS packages protect binders and pigments from sunlight, which extends color and gloss life on exterior surfaces and delays costly repaint cycles for homeowners and asset owners.
Need a Custom Version of This Report?
Tailor the scope, geography, or segments to your exact requirements.
- Custom geography or segment scope
- Direct access to our analyst team
Global additive makers compete through local distributors
Competition combines global additive producers with local distributors that provide laboratory support and stock. Elementis sells coating additives, resins and talc through DKSH under an exclusive Australian and New Zealand agreement dated November 2020. BYK lists ResChem Technologies in Warriewood, New South Wales, as its Australian distributor. IMCD announced the purchase of ResChem in February 2024, which added a Sydney application laboratory to its coatings and construction business. BASF opened a dispersions and resins laboratory at Monash University in Melbourne in 2018 to support Australian paint makers. These suppliers sell into a domestic paint sector led by large house paint makers. Suppliers compete on technical service, low-VOC performance, dose efficiency, supply reliability and the ability to help formulators keep certification. Smaller formulators often rely on distributors for trial quantities and test data.
Which producers and distributors serve Australian formulators?
| Company | Type | Role in the market |
|---|---|---|
| Elementis plc | Additive producer | Sells coating additives through DKSH in Australia since 2020 |
| BYK (ALTANA) | Additive producer | Serves Australian formulators through ResChem Technologies |
| BASF | Chemical producer | Opened a dispersions and resins laboratory in Melbourne in 2018 |
| IMCD (ResChem Technologies) | Specialty distributor | Supplies resins, additives and pigments from Sydney |
| DKSH | Specialty distributor | Exclusive Australian distributor for Elementis coating additives |
Credence Research view on additive demand in Australia
Credence Research's view is that Australian coating additive demand will grow steadily because new homes, repainting and tighter VOC limits keep raising the additive content of each liter of paint. Rheology modifiers remain the largest product type, while UV stabilization grows fastest. Distributor consolidation gives larger players more control over technical service. Suppliers that combine low-VOC performance, local laboratories and reliable stock should gain the most share by 2035, while protective coatings for resource assets offer a second growth path.
How the national additive estimate was built
The report uses 2025 as the base year on a calendar basis, and market values come from the Credence Research model. That model combines official building activity statistics, paint certification rules, public health research on UV exposure and company releases. Segment splits, zone shares and zone growth rates are Credence Research estimates, because the client provided no state split. Sources used are official statistics, certification documents, research publications and company releases, and no interviews or surveys were used.
Durable exterior paint and new homes carry growth to 2035
The Australia coating additives market is expected to reach USD 136.8 million by 2035, a 4.38% CAGR during 2026–2035, as new homes, repaint work and protective coatings keep additive demand rising. Growth should be strongest in light stabilisation additives, industrial and protective coatings and Queensland, because these areas gain most from harsh climate and new construction. Import dependence, price pressure and housing cycles could slow some suppliers, while low-VOC rules and premium exterior ranges should support value per liter.
Frequently Asked Questions
How big is the Australia coating additives market?
Which product type leads coating additive value?
Which region leads the market?
How do VOC limits affect coating additives?
How many dwellings were completed in mid-2026?
Why does UV exposure matter for coating additives?
Who are the leading companies in the Australian coating additives market?
What are the main challenges for additive suppliers?
Table of Content
Chapter 1 Market Segmentation
- 1.1 Segmentation Framework
- 1.1.1 Product and Service Classification
- 1.1.2 Application and End-Use Classification
- 1.1.3 Technology and Solution Classification
- 1.1.4 Customer and Distribution Channel Classification
- 1.1.5 Geographic Segmentation
- 1.1.6 Market Segment Definitions and Boundaries
- 1.2 By Product Type
- 1.2.1 Rheology modifiers
- 1.2.2 Wetting and dispersing agents
- 1.2.3 Defoamers and deaerators
- 1.2.4 Surface performance additives
- 1.2.5 Preservation and light stabilisation additives
- 1.3 By Application
- 1.3.1 Architectural coatings
- 1.3.2 Industrial and protective coatings
- 1.3.3 Wood and furniture coatings
- 1.3.4 Automotive and marine coatings
- 1.3.5 Coil, packaging and specialist coatings
- 1.4 By Sales Channel
- 1.4.1 Direct manufacturer sales
- 1.4.2 Specialty distributor sales
- 1.4.3 Direct overseas procurement
Chapter 2 Introduction
- 2.1 Report Objectives and Scope
- 2.2 Product Definition and Industry Terminology
- 2.3 Market Inclusions and Exclusions
- 2.4 Research Process
- 2.4.1 Primary Research and Expert Interviews
- 2.4.2 Secondary Research and Source Review
- 2.4.3 Top-Down and Bottom-Up Estimation
- 2.4.4 Data Triangulation and Verification
- 2.5 Market Size Measurement Basis
- 2.5.1 2025: USD 83.5 million → 2035: USD 136.8 million
- 2.6 Historical and Forecast Reference Periods
- 2.6.1 Historical Period: 2018-2025
- 2.6.2 Base Year: 2025
- 2.6.3 Forecast Period: 2025-2035
- 2.7 Research Assumptions and Limitations
Chapter 3 Executive Summary
- 3.1 Market Snapshot and Key Findings
- 3.2 Base-Year Market Size, 2025
- 3.3 Forecast Market Size, 2035
- 3.4 Revenue and Volume Growth Outlook
- 3.5 Key Demand and Supply Indicators
- 3.6 Leading Market Segments
- 3.7 Fastest-Growing Market Opportunities
- 3.8 Regional Performance Highlights
- 3.9 Technology and Industry Transformation
- 3.10 Competitive Landscape Summary
- 3.11 Analyst View and Strategic Implications
Chapter 4 Australia Coating Additives Market Trends and Developments
- 4.1 Historical Industry Development, 2018-2025
- 4.2 Recent Market Trends and Developments
- 4.3 Demand and Customer Behavior Trends
- 4.4 Technology and Product Innovation
- 4.5 Artificial Intelligence, Automation and Digitalization
- 4.6 Local Manufacturing and Supply Chain Realignment
- 4.7 Industry Partnerships, Mergers and Acquisitions
- 4.8 Sustainability and Circular Economy Developments
- 4.9 Government and Private Sector Investment Trends
- 4.10 Emerging Business Models and Commercialization
- 4.11 Industry Developments and Announcements
Chapter 5 Australia Coating Additives Market Production, Supply and Demand Analysis
- 5.1 Demand Trend and Consumption Analysis, 2018-2025
- 5.2 Demand Forecast, 2025-2035
- 5.3 Production and Output Trend, 2018-2025
- 5.4 Production and Output Forecast, 2025-2035
- 5.5 Installed Capacity and Capacity Utilization
- 5.6 Company-Wise Production Plants and Statistics
- 5.6.1 Installed Production Capacity
- 5.6.2 Actual Production
- 5.6.3 Planned Capacity and Expansion Targets
- 5.7 Supply Chain Structure and Procurement Trends
- 5.8 Supply-Demand Gap and Bottlenecks
- 5.9 Import Dependence and Sourcing Structure
- 5.10 Contract Manufacturing and Outsourcing
- 5.11 Regional Supply and Demand Concentration
Chapter 6 Australia Coating Additives Market Pricing Analysis
- 6.1 Pricing Structure and Measurement
- 6.2 Historical Pricing Trends, 2018-2025
- 6.3 Pricing Outlook, 2025-2035
- 6.4 Average Selling Price and Unit Economics
- 6.5 Pricing by Product and Market Segment
- 6.6 Geographic Pricing Differences
- 6.7 Key Input, Energy, Labor and Logistics Costs
- 6.8 Contract Pricing and Purchasing Models
- 6.9 Pricing Sensitivity and Competitive Positioning
- 6.10 Price, Margin and Profitability Implications
Chapter 7 Australia Coating Additives Market Dynamics
- 7.1 Market Growth Drivers
- 7.1.1 Demand-Side Drivers
- 7.1.2 Technology and Innovation Drivers
- 7.1.3 Infrastructure and Investment Drivers
- 7.1.4 Regulatory and Policy Drivers
- 7.2 Market Restraints
- 7.2.1 Cost and Affordability Constraints
- 7.2.2 Technology and Adoption Barriers
- 7.2.3 Supply Chain and Operational Constraints
- 7.3 Market Challenges
- 7.3.1 Competitive Pressure and Margin Erosion
- 7.3.2 Skills, Infrastructure and Implementation Gaps
- 7.4 Emerging Market Opportunities
- 7.5 Market Dynamics Impact and Time-Horizon Assessment
Chapter 8 Australia Coating Additives Value Chain Analysis
- 8.1 Industry Value Chain Overview
- 8.2 Upstream Suppliers and Critical Inputs
- 8.3 Technology and Component Providers
- 8.4 Manufacturing or Service Delivery
- 8.5 Distribution, Channel Partners and Integrators
- 8.6 Downstream Applications and End Users
- 8.7 Value Addition and Profit Pools
- 8.8 Vertical Integration and Outsourcing
- 8.9 Supplier Concentration and Risk
- 8.10 Supply Chain Localization and Resilience
Chapter 9 Australia Coating Additives Market Regulations and Policies
- 9.1 Relevant Laws, Standards and Compliance Frameworks
- 9.2 Product, Service, Safety and Quality Requirements
- 9.3 Government Policies, Incentives and Subsidies
- 9.4 Imports, Exports and Trade Barriers
- 9.5 Public Procurement and Local Content Requirements
- 9.6 Environmental and Sustainability Compliance
- 9.7 Upcoming Policy Changes and Market Implications
Chapter 10 Australia Coating Additives Market Hotspots and Opportunities
- 10.1 Market Opportunity Mapping and Growth Hotspots
- 10.2 High-Growth Applications and Customer Groups
- 10.3 Underserved Markets and White-Space Opportunities
- 10.4 Emerging Technology and Product Opportunities
- 10.5 New Capacity and Investment Hotspots
- 10.6 Market Entry and Expansion Opportunities
- 10.7 Distribution and Partnership Opportunities
- 10.8 Near-Term and Long-Term Commercial Potential
- 10.9 Opportunity Attractiveness and Execution Risks
Chapter 11 Australia Coating Additives Market Outlook, 2025-2035
- 11.1 Market Size and Analysis
- 11.1.1 Revenue (Market Measurement: 2025: USD 83.5 million → 2035: USD 136.8 million)
- 11.1.2 Market Volume and Quantity Sold
- 11.1.3 Historical Market Size, 2018-2025
- 11.1.4 Base-Year Market Size, 2025
- 11.2 Market Forecast, 2025-2035
- 11.2.1 Revenue Forecast to 2035
- 11.2.2 Volume Forecast to 2035
- 11.2.3 CAGR and Year-on-Year Growth
- 11.2.4 Incremental Revenue Opportunity
- 11.3 Forecast Assumptions and Scenario Analysis
- 11.3.1 Base-Case Forecast
- 11.3.2 Optimistic and Conservative Scenarios
- 11.3.3 Technology, Pricing and Policy Sensitivities
- 11.4 Market Attractiveness and Growth Outlook
Chapter 12 Australia Coating Additives Market Segmentation and Outlook
- 12.1 Segmentation Summary and Market Shares, 2025
- 12.2 Largest and Fastest-Growing Segments
- 12.3 By Product Type - Market Size and Forecast, 2025-2035
- 12.3.1 Segment Definition and Scope
- 12.3.2 Historical Market Size, 2018-2025
- 12.3.3 Revenue Forecast, 2025-2035
- 12.3.4 Volume Forecast, 2025-2035
- 12.3.5 Base-Year Market Share, 2025
- 12.3.6 Segment CAGR and Growth Drivers
- 12.3.7 Subsegment Market Size and Forecast
- 12.3.7.1 Rheology modifiers
- 12.3.7.2 Wetting and dispersing agents
- 12.3.7.3 Defoamers and deaerators
- 12.3.7.4 Surface performance additives
- 12.3.7.5 Preservation and light stabilisation additives
- 12.3.8 Subsegment Pricing and Adoption Trends
- 12.3.9 Leading Suppliers and Competition
- 12.3.10 Regional Demand and Opportunities
- 12.4 By Application - Market Size and Forecast, 2025-2035
- 12.4.1 Segment Definition and Scope
- 12.4.2 Historical Market Size, 2018-2025
- 12.4.3 Revenue Forecast, 2025-2035
- 12.4.4 Volume Forecast, 2025-2035
- 12.4.5 Base-Year Market Share, 2025
- 12.4.6 Segment CAGR and Growth Drivers
- 12.4.7 Subsegment Market Size and Forecast
- 12.4.7.1 Architectural coatings
- 12.4.7.2 Industrial and protective coatings
- 12.4.7.3 Wood and furniture coatings
- 12.4.7.4 Automotive and marine coatings
- 12.4.7.5 Coil, packaging and specialist coatings
- 12.4.8 Subsegment Pricing and Adoption Trends
- 12.4.9 Leading Suppliers and Competition
- 12.4.10 Regional Demand and Opportunities
- 12.5 By Sales Channel - Market Size and Forecast, 2025-2035
- 12.5.1 Segment Definition and Scope
- 12.5.2 Historical Market Size, 2018-2025
- 12.5.3 Revenue Forecast, 2025-2035
- 12.5.4 Volume Forecast, 2025-2035
- 12.5.5 Base-Year Market Share, 2025
- 12.5.6 Segment CAGR and Growth Drivers
- 12.5.7 Subsegment Market Size and Forecast
- 12.5.7.1 Direct manufacturer sales
- 12.5.7.2 Specialty distributor sales
- 12.5.7.3 Direct overseas procurement
- 12.5.8 Subsegment Pricing and Adoption Trends
- 12.5.9 Leading Suppliers and Competition
- 12.5.10 Regional Demand and Opportunities
- 12.6 Segment Growth Comparison
- 12.7 Segment Attractiveness and Priority Matrix
Chapter 13 Australia Coating Additives End-Use and Application Market Outlook
- 13.1 End-Use Industry and Customer Demand Structure
- 13.2 Leading Applications and Customer Groups
- 13.3 End-Use Market Size, Share and Forecast
- 13.4 Major End-Use Industry Deep Dives
- 13.4.1 Customer Requirements and Use Cases
- 13.4.2 Demand and Replacement Cycles
- 13.4.3 Technical and Regulatory Considerations
- 13.4.4 Purchasing and Procurement Models
- 13.4.5 Leading Vendors and Distribution Channels
- 13.4.6 Forecast and Commercial Opportunities
- 13.5 Emerging Applications and Cross-Segment Demand
- 13.6 End-Use Industry Investment Priorities
Chapter 14 Australia Coating Additives Geographic Market Outlook, 2025-2035
- 14.1 Domestic Market Distribution and Demand Clusters
- 14.2 State- or Province-Wise Market Size and Forecast, 2025-2035
- 14.3 City and Metropolitan Market Outlook
- 14.4 Industrial, Manufacturing and Commercial Clusters
- 14.5 Geographic Concentration of Key End Users
- 14.6 Local Pricing and Purchasing Differences
- 14.7 Domestic Production Facilities and Capacity Map
- 14.8 Local Infrastructure and Project Pipeline
- 14.9 State-Level Policy and Incentive Differences
- 14.10 Subnational Investment Hotspots and Opportunities
- 14.11 Distribution and Logistics Networks
- 14.12 Domestic Competitive Footprint
Chapter 15 Australia Coating Additives Technology, Innovation and Sustainability Outlook
- 15.1 Technology Landscape and Maturity
- 15.2 Product, Process and Service Innovation
- 15.3 AI, Automation and Digital Tools in the Industry
- 15.4 Technology Adoption and Performance Benchmarking
- 15.5 Innovation Pipeline and R&D Investment
- 15.6 Patent and Intellectual Property Trends
- 15.7 Energy Efficiency and Resource Management
- 15.8 Sustainability, Recycling and Circularity
- 15.9 Technology Roadmap, 2025-2035
- 15.10 Risks of Obsolescence and Technology Substitution
Chapter 16 Australia Coating Additives Market Key Strategic Imperatives
- 16.1 Growth and Market Entry Priorities
- 16.2 High-Return Products and Segments
- 16.3 Pricing, Profitability and Cost Optimization
- 16.4 Technology Investment and Product Differentiation
- 16.5 Supply Chain Localization and Resilience
- 16.6 Distribution and Customer Acquisition
- 16.7 Partnership, Acquisition and Capacity Strategy
- 16.8 Regional Expansion Priorities
- 16.9 Short-, Medium- and Long-Term Actions
Chapter 17 Competition Outlook
- 17.1 Industry Competition Characteristics
- 17.2 Market Structure and Concentration
- 17.3 Market Share and Competitive Positioning, 2025
- 17.4 Company-Wise Revenue and Product Benchmarking
- 17.5 Production and Service Capacity Benchmarking
- 17.6 Technology, Pricing and Differentiation
- 17.7 Regional Footprint and Distribution Strength
- 17.8 Mergers, Acquisitions and Strategic Alliances
- 17.9 New Entrants and Competitive Threats
- 17.10 Porter's Five Forces and Industry Attractiveness
- 17.11 Competitive Outlook, 2025-2035
Chapter 18 Company Profiles
- 18.1 Company Coverage and Selection Criteria
- 18.2 Elementis plc
- 18.2.1 Business Description
- 18.2.2 Company Ownership and Geographic Presence
- 18.2.3 Product and Service Portfolio
- 18.2.4 Manufacturing and Operating Footprint
- 18.2.5 Production Capacity and Expansion Plans
- 18.2.6 Financial Performance and Investment
- 18.2.7 Market Share and Competitive Position
- 18.2.8 Technology and Innovation Capabilities
- 18.2.9 Strategic Alliances or Partnerships
- 18.2.10 Recent Developments
- 18.2.11 Growth Strategy and Outlook
- 18.3 BYK (ALTANA)
- 18.4 BASF
- 18.5 IMCD (ResChem Technologies)
- 18.6 DKSH
- 18.7 Other Relevant Market Participants
Note: Every listed company is profiled on the structure shown under the first company. The company list is preliminary and may change based on research findings, market developments, data availability and client requirements.
Chapter 19 Disclaimer
- 19.1 Research and Forecast Disclaimer
- 19.2 Data Source and Estimation Limitations
Note: The depth of individual sections depends on data availability for this market. Volume, capacity, trade and other unit-based metrics are included where applicable.

