
Engine oils anchor demand as vehicle fleets keep servicing
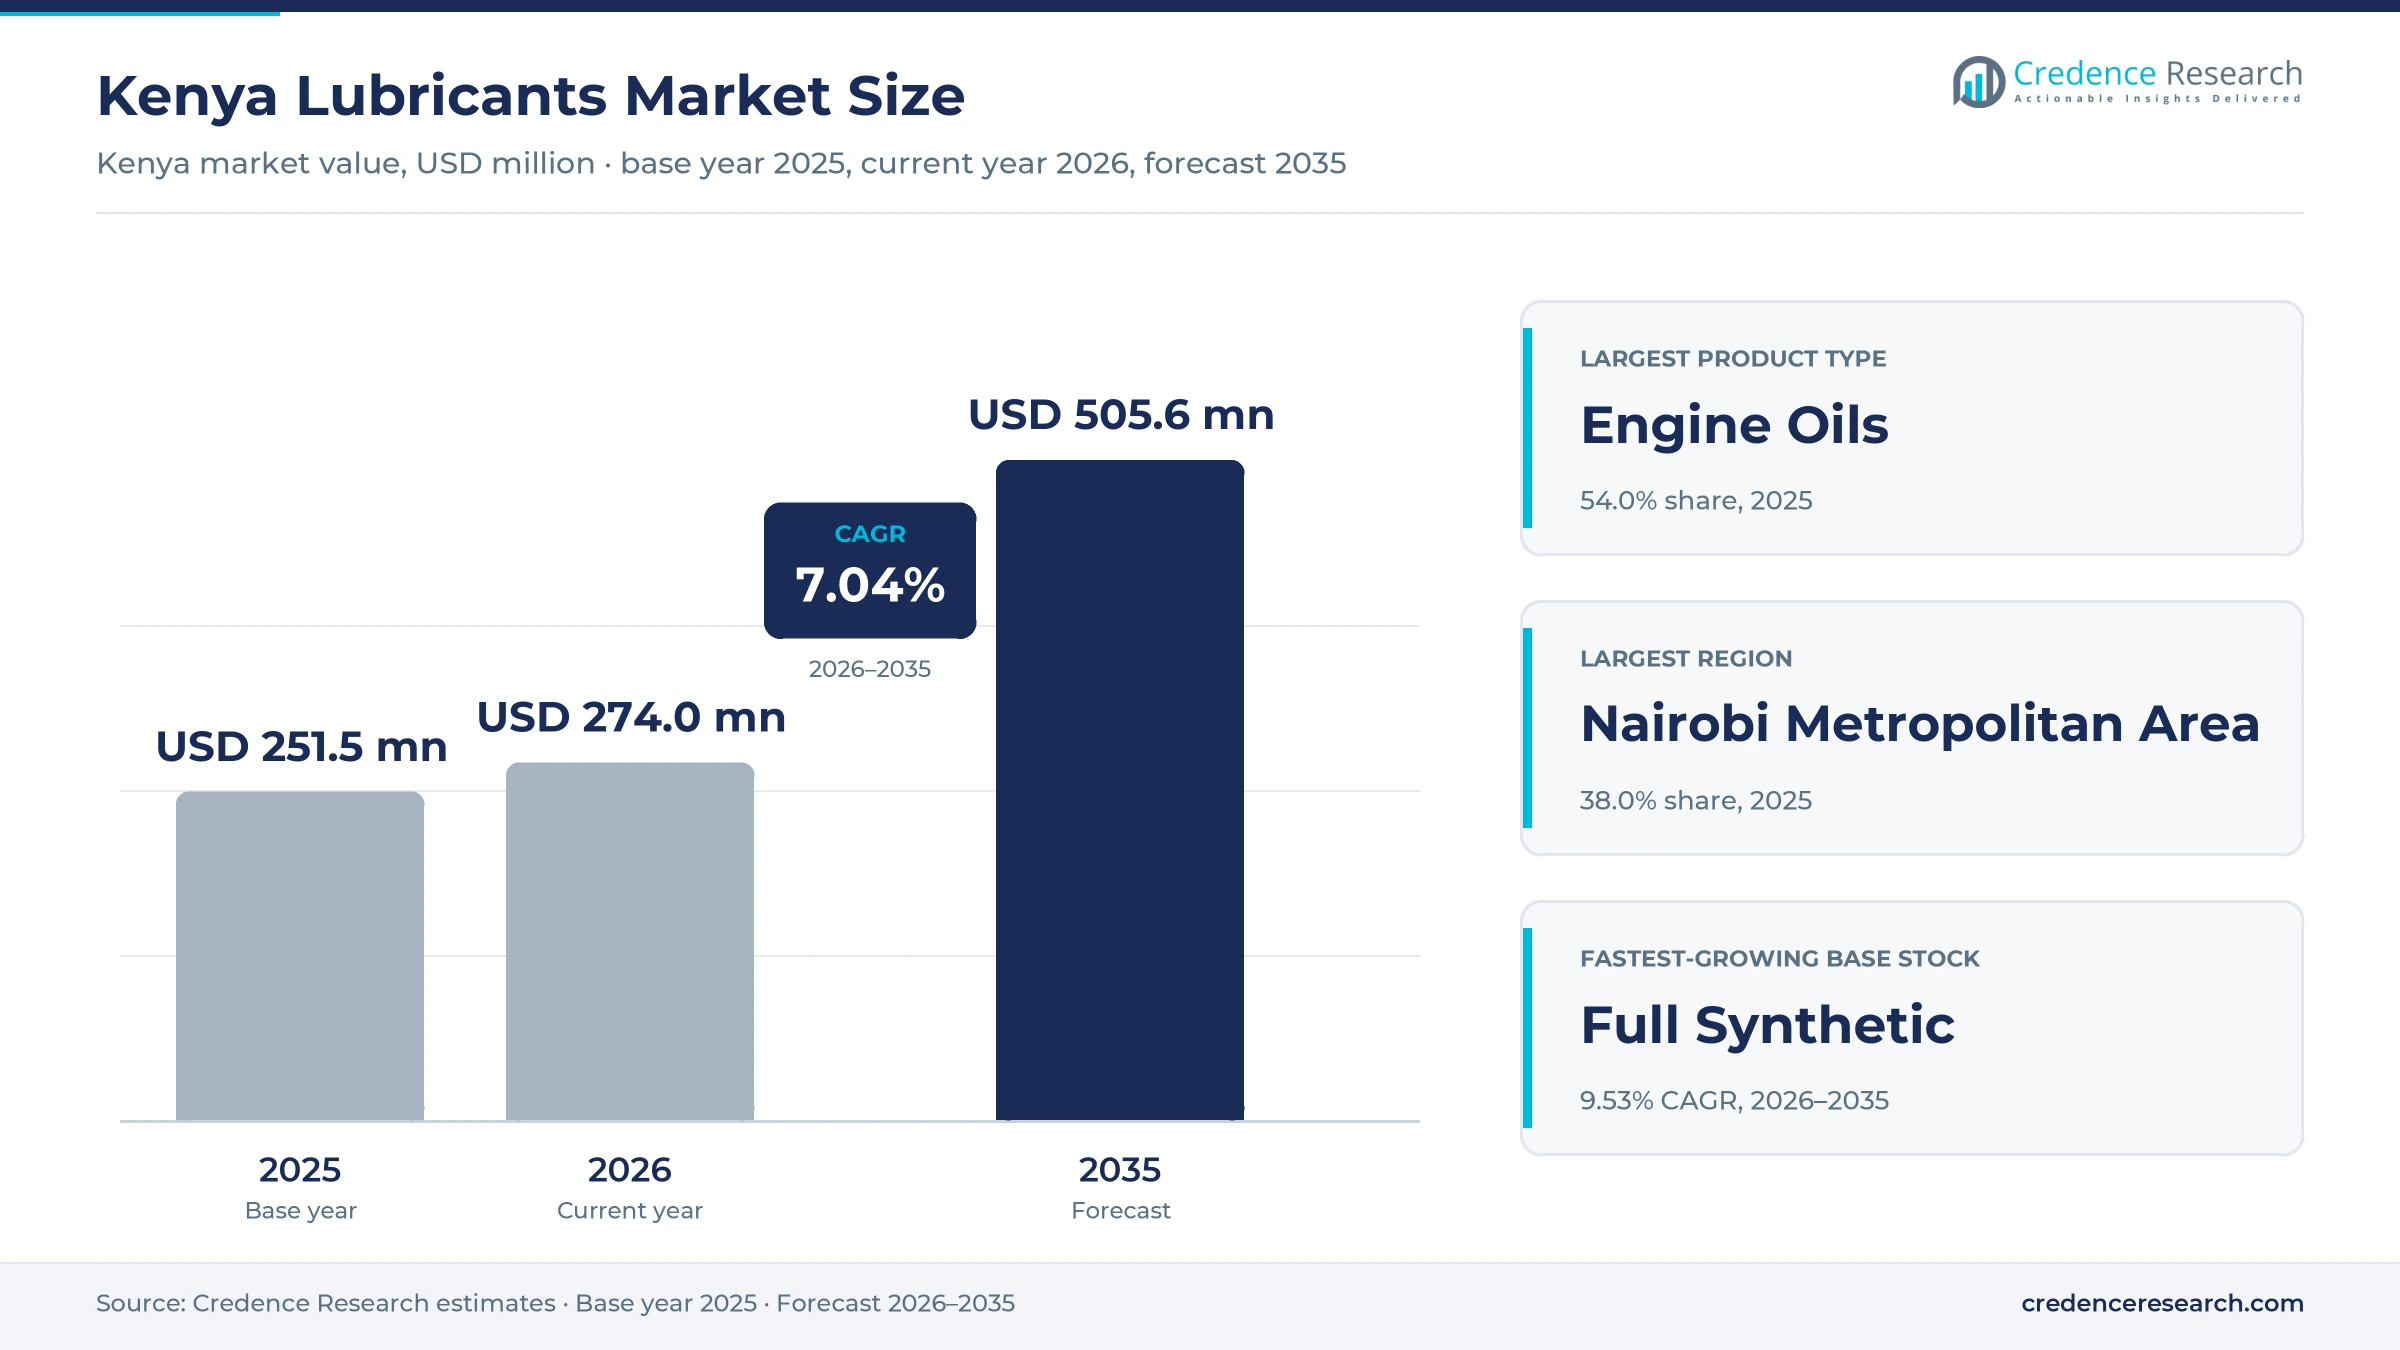
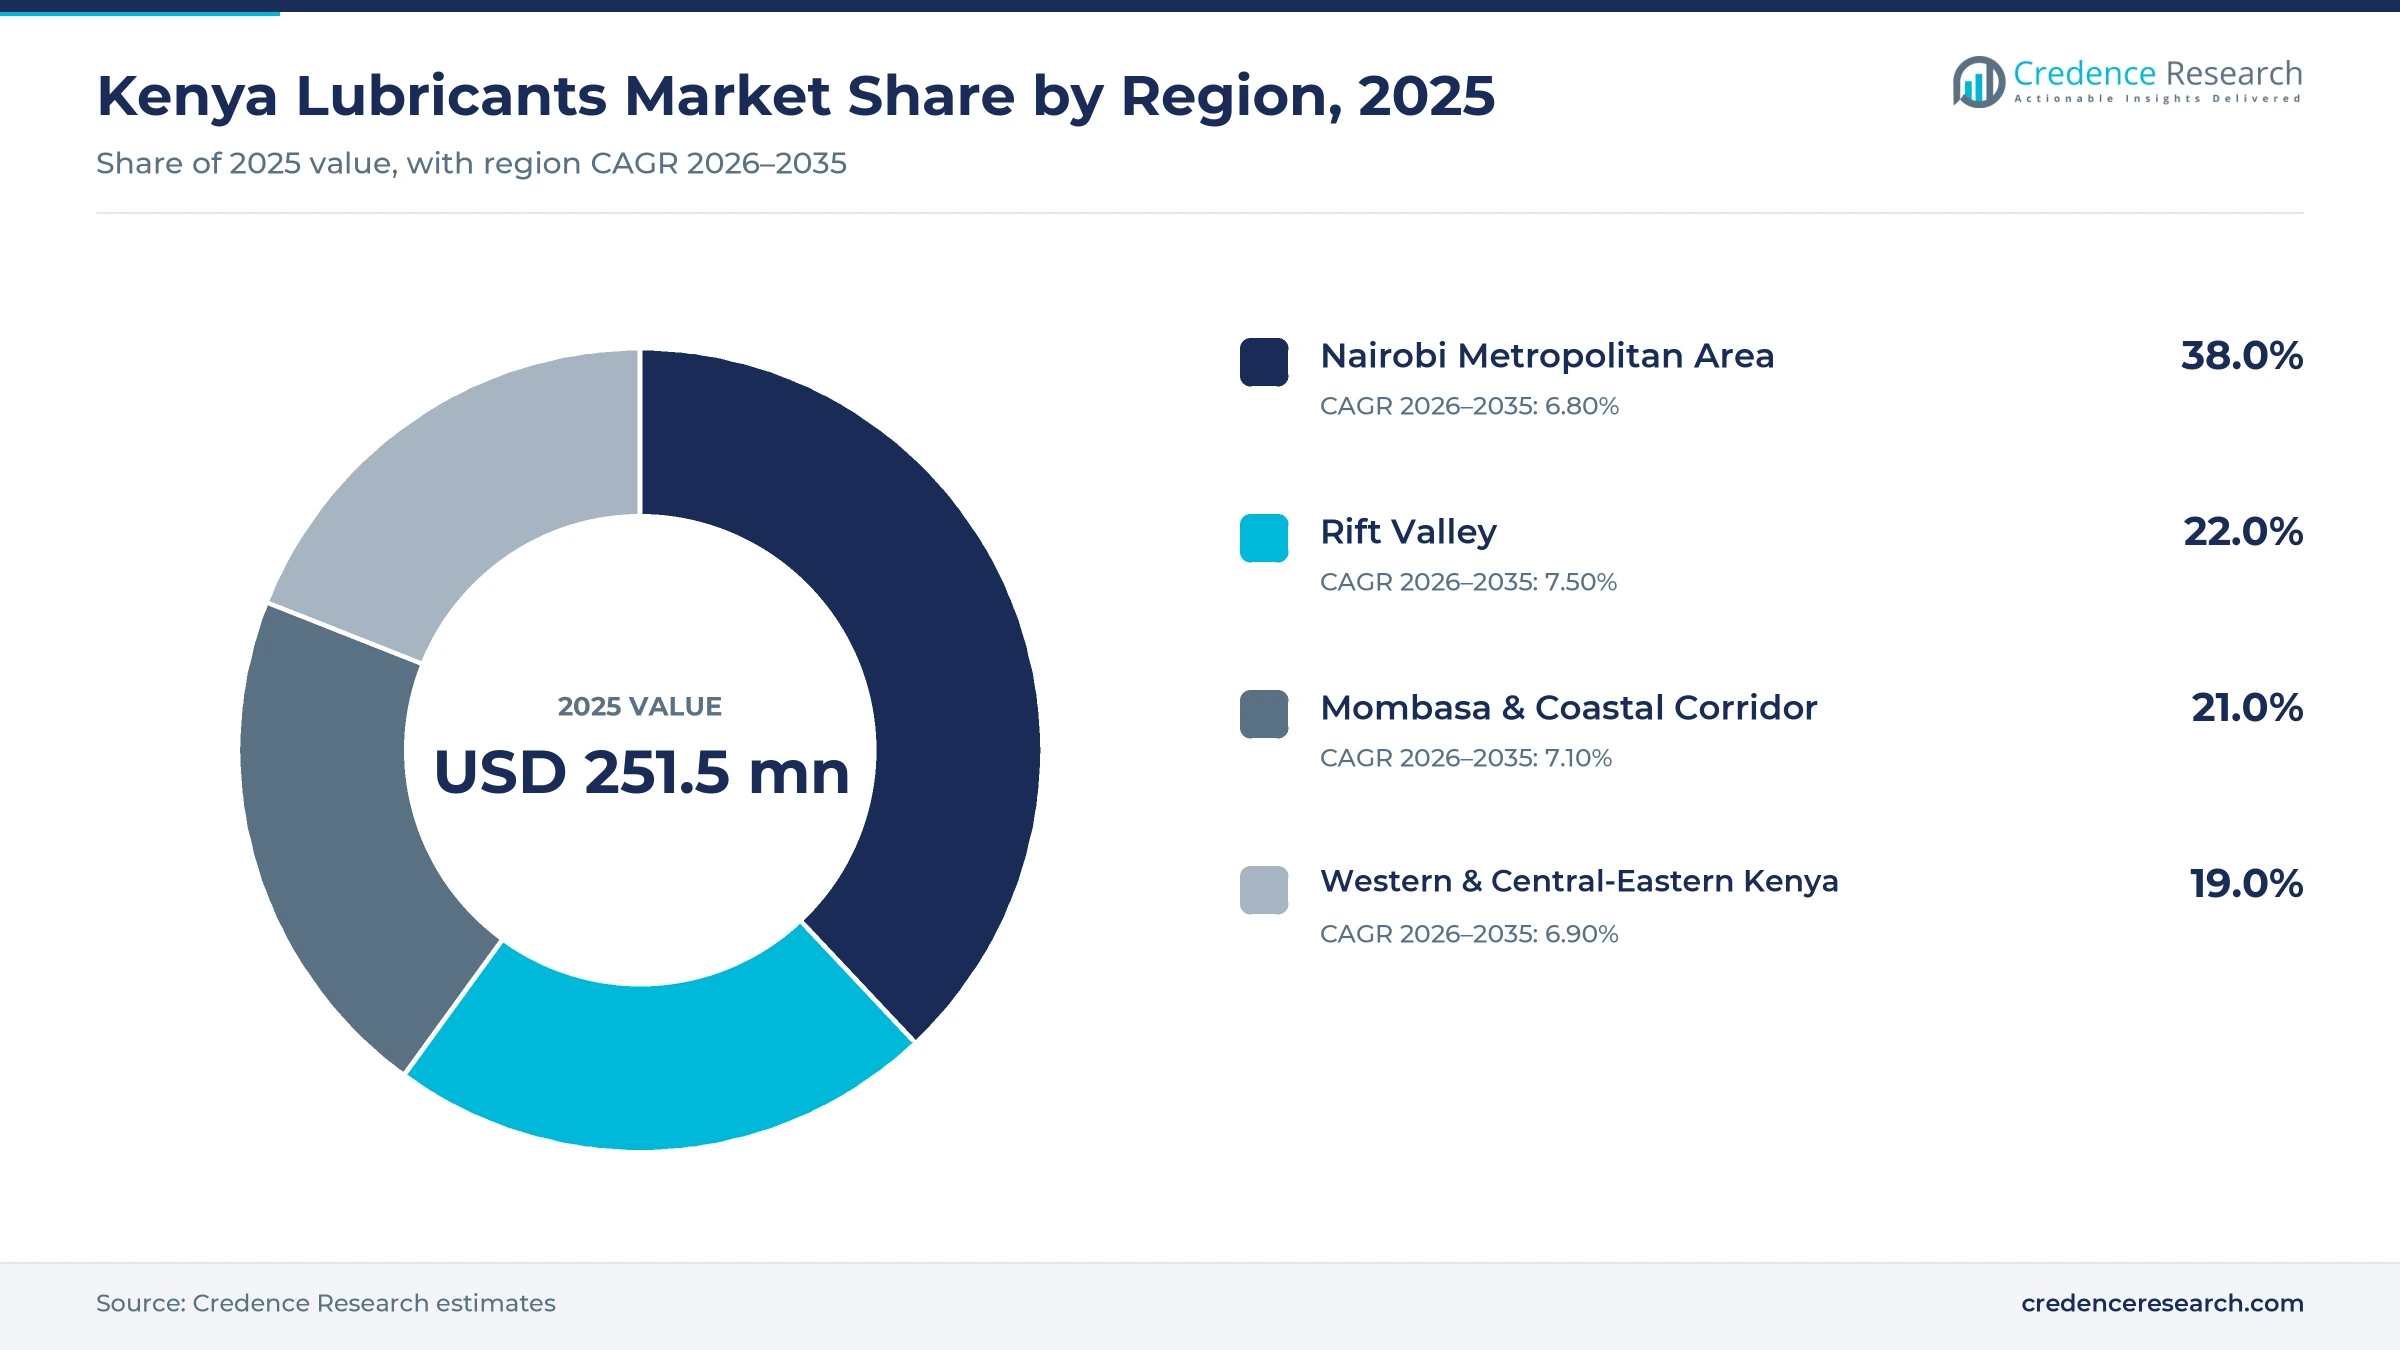
The Kenya lubricants market was valued at USD 251.5 million in 2025 and is projected to increase from USD 274.0 million in 2026 to USD 505.6 million by 2035, registering a CAGR of 7.04% during 2026–2035. Demand comes from matatu, truck and motorcycle fleets that change engine oil often, and from builders, factories and power plants that buy hydraulic fluids, gear oils and greases. Nairobi Metropolitan Area held the largest regional share, 38.0% in 2025, because the capital hosts the densest vehicle population, most service stations and the main industrial zones. The Rift Valley is the fastest-growing region at 7.50% a year, as Nakuru, Eldoret and Naivasha add logistics hubs, farms and geothermal works. In turn, the Energy and Petroleum Regulatory Authority now licenses lubricant facilities and businesses under new 2025 regulations, which pushes sellers toward tested and traceable products.
Which oils, fluids and greases does the estimate cover?
The estimate measures the value of engine oils, hydraulic fluids, gear and transmission oils, greases and specialty oils sold to vehicle owners, fleets, workshops, factories, contractors and utilities in Kenya. It covers products blended locally in Mombasa and imported finished packs, across mineral, semi-synthetic, full synthetic and bio-based grades.
The estimate excludes fuels, base oils sold for re-export, transit cargo moving to Uganda and other inland neighbors, and used oil collected for disposal. The value chain runs from base oil and additive importers through blending plants and oil marketing companies to distributors, service stations, workshops and industrial buyers.
Kenya Lubricants Market Insights
- The Kenya lubricants market was valued at USD 251.5 million in 2025 and is projected to reach USD 505.6 million by 2035, registering a CAGR of 7.04% during 2026–2035.
- Nairobi Metropolitan Area held a 38.0% share of 2025 value, because the capital hosts the largest vehicle fleet, most service stations and the main factories.
- Engine oils led with a 54.0% share of 2025 value, because cars, matatus, trucks and motorcycles need frequent oil changes.
- The Port of Mombasa handled a record 41.1 million metric tons of cargo in 2024, up 14.2% from 2023, which raised truck and handling equipment use.
- New motorcycle registrations rose from 68,804 in 2024 to 168,286 in 2025, and 15.3% of the 2025 total were electric.
Engine oils lead while hydraulic fluids gain the fastest
Why do engine oils hold most of the value?
Based on product type, the market is categorized into engine oils, hydraulic fluids, gear and transmission oils, and greases and specialty oils. Engine Oils led with a 54.0% share of 2025 value, because every car, matatu, truck and motorcycle needs regular oil changes. Hydraulic Fluids grow fastest at 7.73% a year, as excavators, cranes and port handling machines spread across road and housing projects.
How fast is construction and mining demand rising?
Based on end-use industry, the market is categorized into automotive, construction and mining, manufacturing and metalworking, and power and utilities. Automotive led with a 62.0% share of 2025 value, because road transport moves most goods and people. Construction & Mining grows fastest at 8.01% a year, while factories in Nairobi and Athi River buy more metalworking fluids for cutting and forming lines.
Which sales channels reach Kenyan buyers best?
Based on sales channel, the market is categorized into branded service stations, independent lubricant distributors, automotive workshops and parts retailers, and direct B2B and tender sales. Branded Service Stations led with a 33.0% share of 2025 value, because motorists trust sealed packs sold at branded forecourts. Direct B2B & Tender Sales grow fastest at 7.88% a year, as fleets, mines and utilities sign bulk supply contracts.
How quickly are synthetic grades gaining ground?
Based on base stock type, the market is categorized into mineral oil-based, semi-synthetic, full synthetic and bio-based products. Mineral Oil-Based products led with a 70.0% share of 2025 value, because older vehicles and price-sensitive buyers favor lower-cost grades. Full Synthetic products grow fastest at 9.53% a year, as newer engines with longer drain intervals need lower-viscosity oils.
| Segment Group | Leading Sub-segment | Share, 2025 | Fastest-growing Sub-segment | CAGR, 2026–2035 |
|---|---|---|---|---|
| By Product Type | Engine Oils | 54.0% | Hydraulic Fluids | 7.73% |
| By End-Use Industry | Automotive | 62.0% | Construction & Mining | 8.01% |
| By Sales Channel | Branded Service Stations | 33.0% | Direct B2B & Tender Sales | 7.88% |
| By Base Stock Type | Mineral Oil-Based | 70.0% | Full Synthetic | 9.53% |
Request a Free Sample
Fill in your details and we'll send you a free sample report.
- Sample data tables & charts
- Research methodology
Fleet servicing, freight and local blending lift demand
How does a large vehicle fleet keep oil sales recurring?
A large, aging vehicle base keeps oil sales recurring, because most cars, matatus and trucks on Kenyan roads are imported used units that need frequent oil changes. Newly registered cars fell 21.4% to 93,646 in 2024, according to the Economic Survey reported by Citizen Digital, so owners keep older vehicles longer and service them more often. The same survey shows locally assembled vehicles fell from 13,527 in 2023 to 11,555 in 2024. New motorcycle registrations, however, rose from 68,804 in 2024 to 168,286 in 2025, which adds many small engines that need two-stroke and four-stroke oils. As a result, engine oils hold 54.0% of 2025 value across the country.
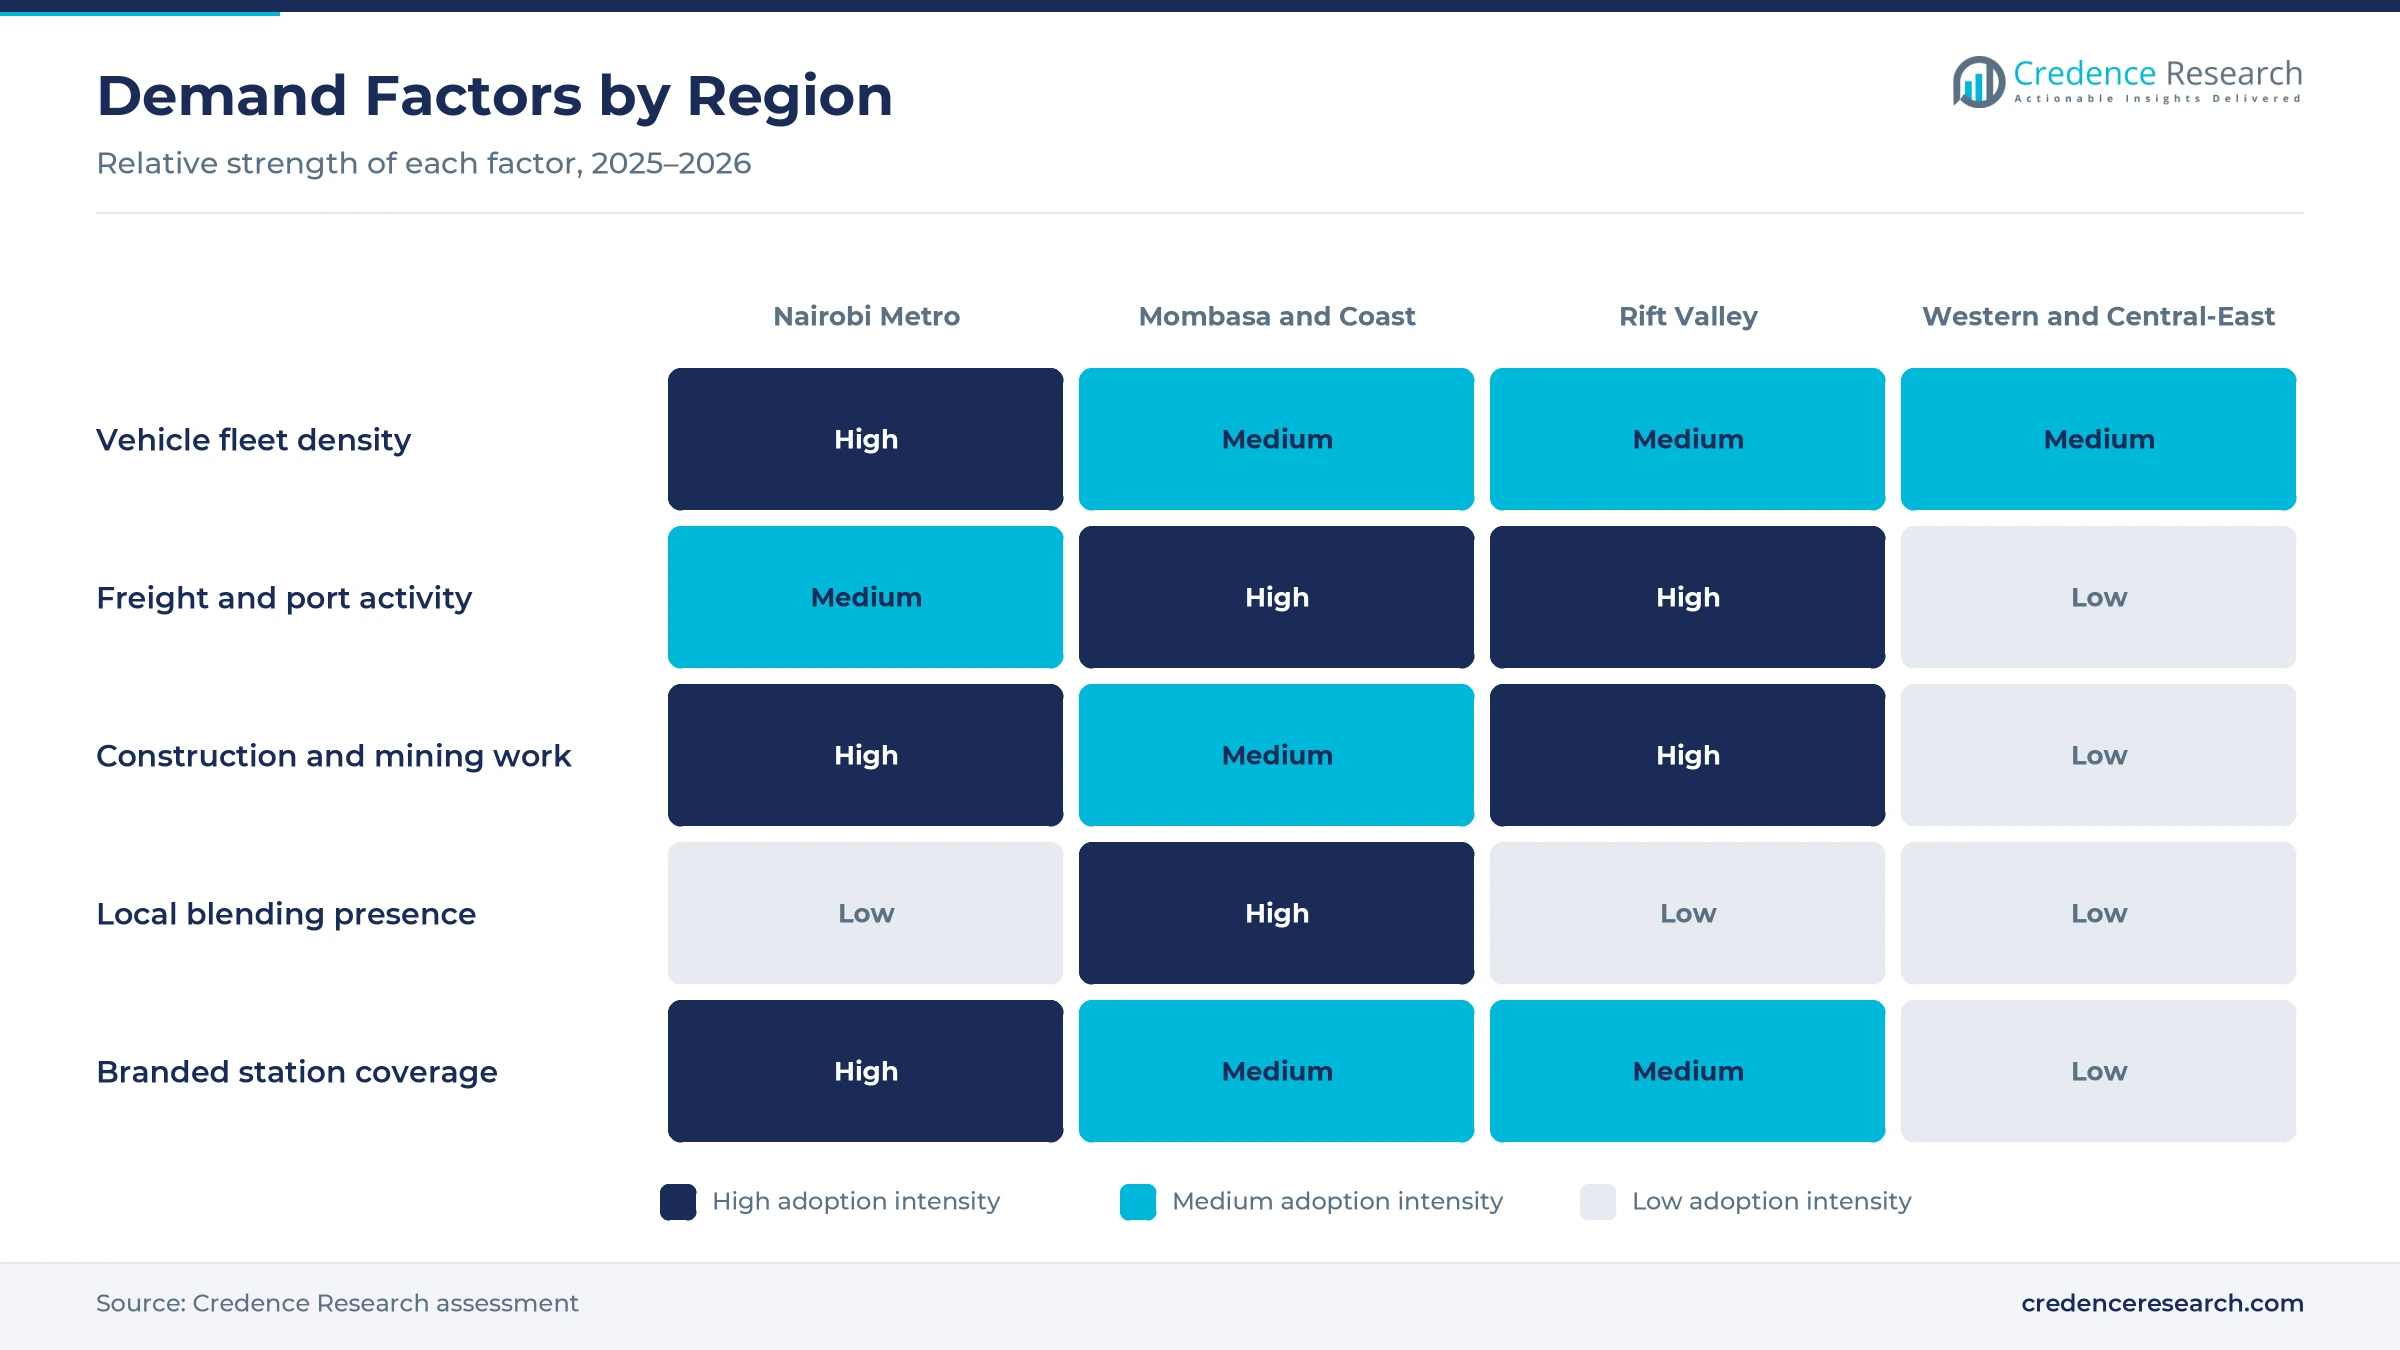
Why do freight, building and mining work lift oil use?
Freight, building and mining work lift oil use, because trucks, port machines and earthmovers run long hours and burn through gear oils, hydraulic fluids and grease. The Port of Mombasa handled 41.1 million metric tons of cargo in 2024, a 14.2% increase from 35.98 million metric tons in 2023, according to Capital FM. Transit cargo for inland neighbors rose 17.4% to 13.4 million metric tons in the same year. The World Bank reported in November 2025 that GDP expanded by 4.9% in the first quarter and 5.0% in the second quarter of 2025, helped by a rebound in construction. In turn, construction and mining demand grows at 8.01% a year.
How do local blending and station networks widen supply?
Local blending and branded station networks widen formal supply, because oil marketers can fill packs close to buyers and keep stock at forecourts across the country. Vivo Energy Kenya blends Shell lubricants at a Mombasa plant and has opened its 336th Shell service station at Imara Daima in Nairobi. OLA Energy also runs an ISO-certified lubricant blending plant in Mombasa. Rubis Energy Kenya partnered with Castrol in 2023 to sell its lubricants through more than 260 stations, distributors, workshops and spare shops. In January 2025, the East African Community announced a temporary tariff-rate quota for inputs used to make oil-based lubricants in Kenya. As a result, branded service stations hold 33.0% of 2025 value.
Why does rising fuel use signal more servicing demand?
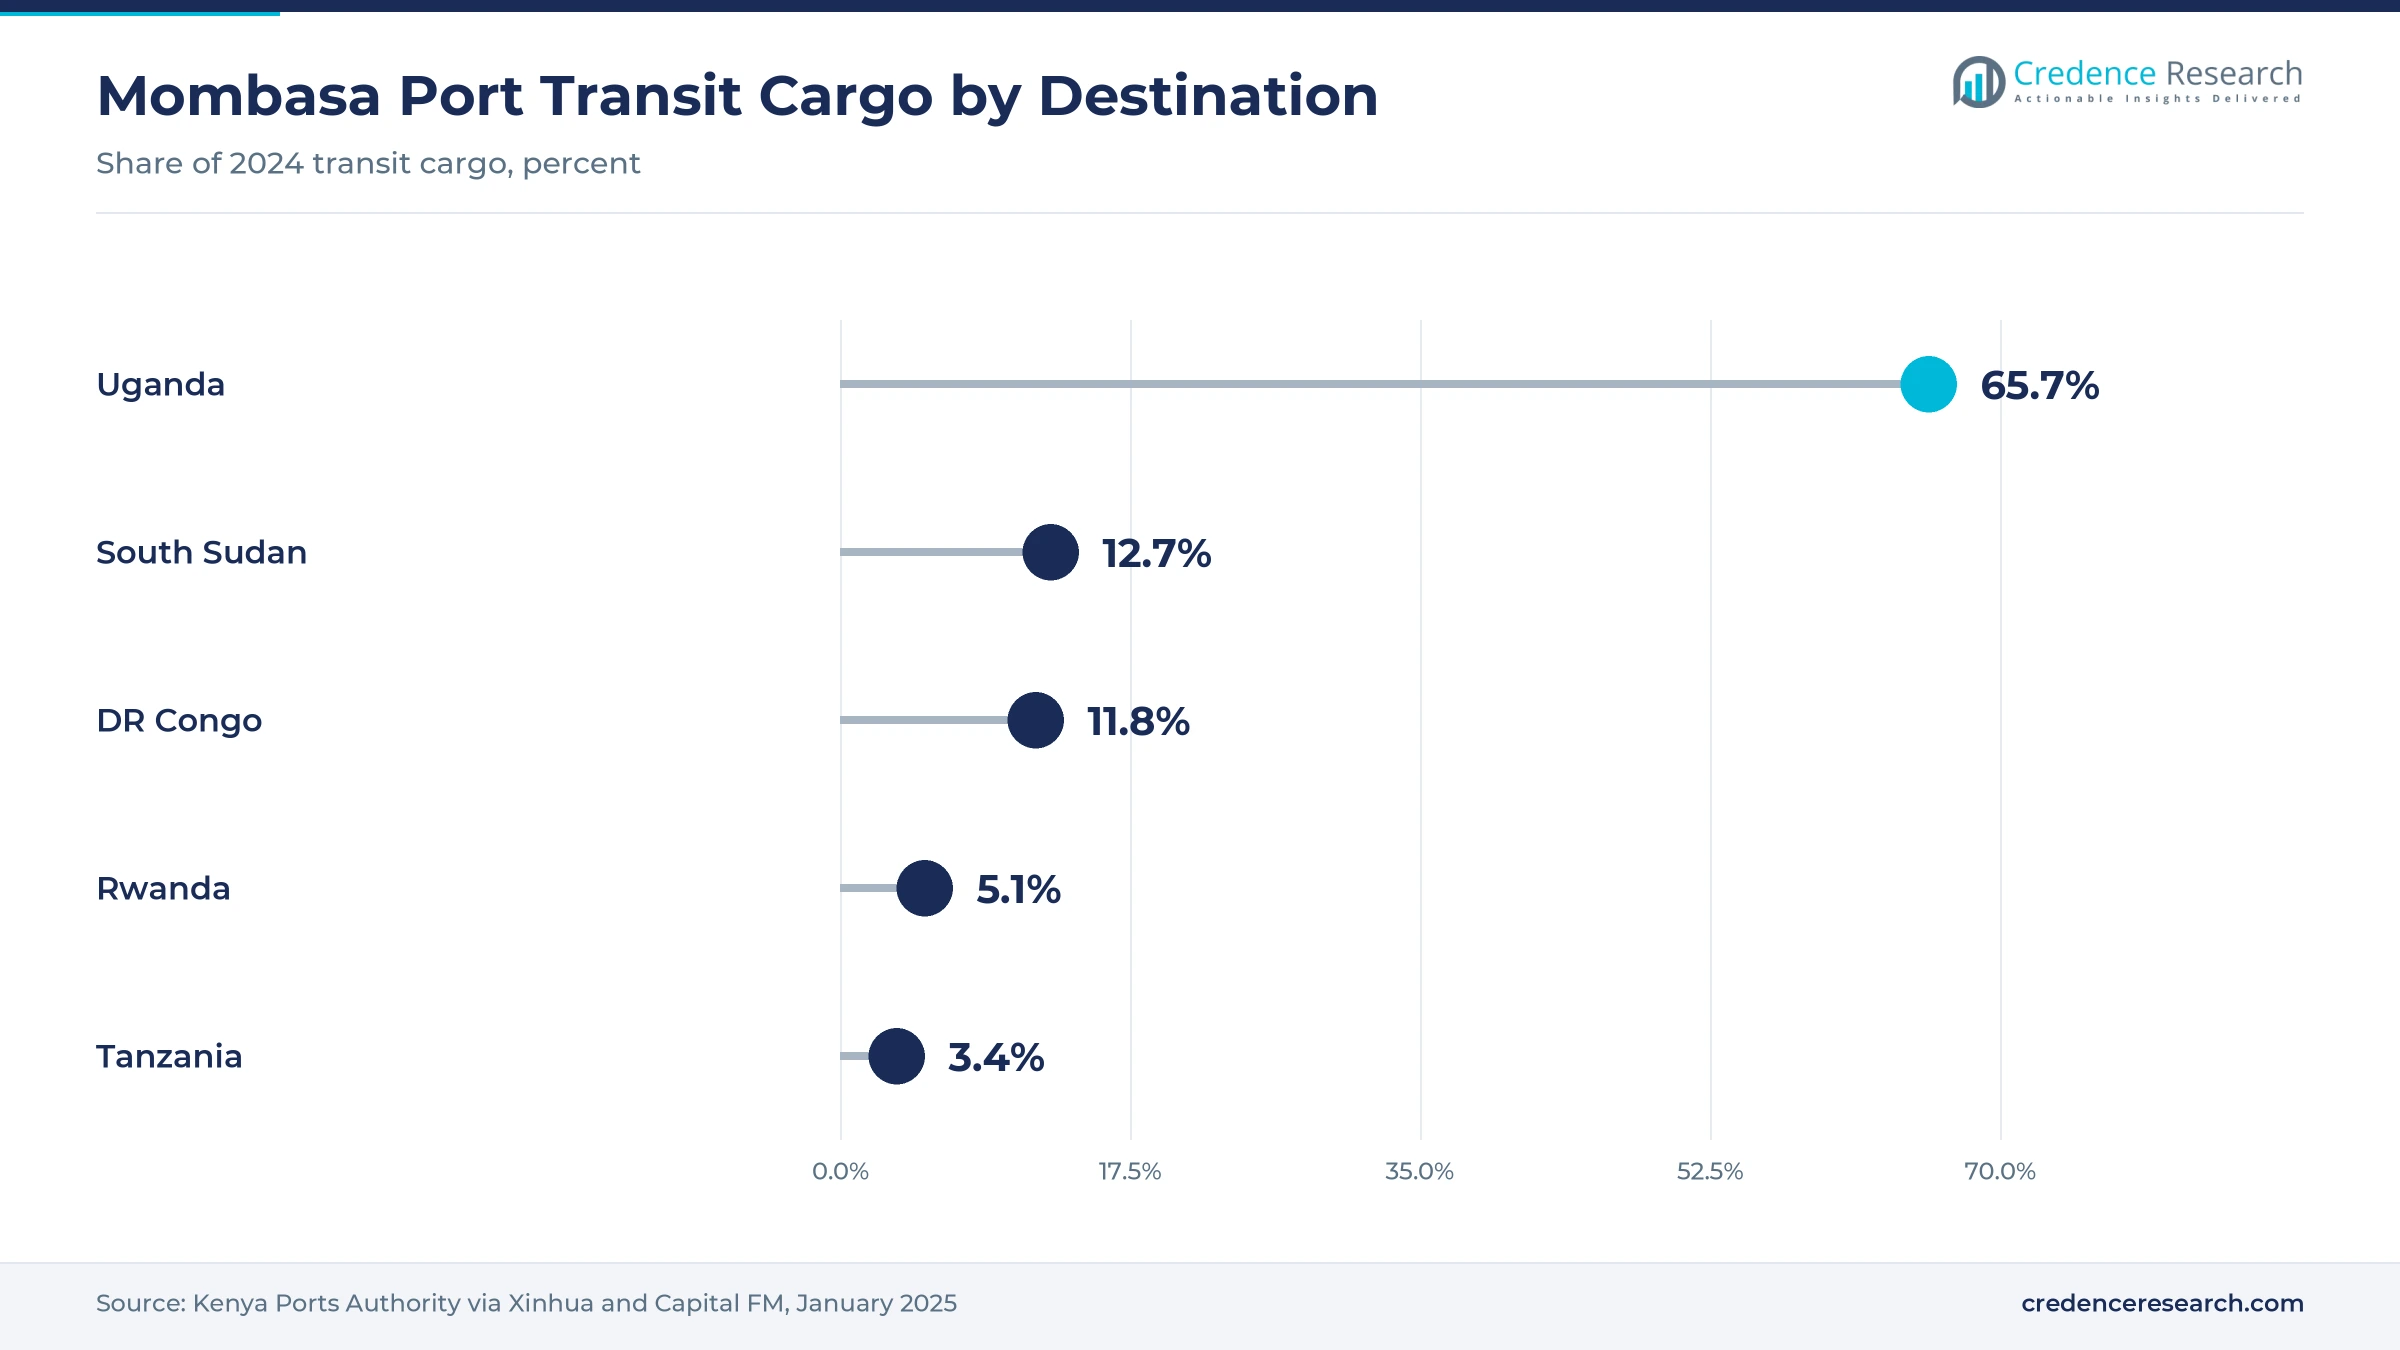
Rising fuel use signals more servicing demand, because every extra kilometer driven by trucks, buses and motorcycles brings the next oil change closer. Domestic petroleum consumption rose 8.41% to 6.33 million cubic meters in the year to June 2026, according to energy regulator statistics released in September 2026. The same release cited the 2026 Economic Survey, which shows transportation and storage grew by about 5.4% and construction by 5.7%. Uganda alone took 8.81 million metric tons of Mombasa transit cargo in 2024, which keeps long-haul trucks running on the Northern Corridor. As a result, automotive buyers hold 62.0% of 2025 value, while workshops and parts retailers keep steady volumes.
Licensing rules, e-motorcycles and exports reshape supply
How is the shift to regulator licensing changing the trade?
The shift to regulator licensing is changing the trade, because lubricant plants and sellers now need permits from the Energy and Petroleum Regulatory Authority. The Petroleum (Lubricants Facility Construction and Business Licensing) Regulations, 2025, set quality and safety standards for lubricant facilities, according to Expression Africa. The regulator announced the new rules to stakeholders in October 2025, alongside separate rules for retail dispensing sites. Director General Daniel Kiptoo said the measures close long-standing gaps in the petroleum value chain. As a result, licensed blenders and branded marketers gain an edge over unregistered sellers, while direct B2B and tender sales grow at 7.88% a year.
Why is the rise of pack verification significant?
The rise of pack verification is significant, because fake engine oil damages engines and erodes trust in branded products. The Anti-Counterfeit Authority has said counterfeiters claimed over 20% of the petroleum market, and it warned motorists about fake engine oil in July 2022. Kenya loses more than Ksh 2.1 billion in revenue each year to counterfeit products, according to the National Observatory on Illicit Trade. In June 2022, Vivo Energy Kenya launched a USSD code check that lets buyers confirm a Shell pack is genuine. In turn, buyers in Nairobi Metropolitan Area, which grows at 6.80% a year, lead the move toward sealed, traceable packs.
Can electric motorcycles open a niche for new fluids?
Electric motorcycles can open a niche for specialty fluids and greases, because their hubs, bearings and brakes still need lubrication even though they skip engine oil. Battery swapping startups expanded fast, and Kenya registered 25,277 electric motorcycles in 2025, or 15.3% of all new motorcycles, according to CleanTechnica. Electric units made up only 4,862 of new registrations in 2024 and 3.6% of motorcycles sold in 2023. Startups that run battery swapping fleets in Nairobi buy service products in bulk, which suits direct supply deals. As a result, electric motorcycles create new demand for hub greases and specialty oils, which suits suppliers with technical service teams.
Is regional export blending an opening for Mombasa plants?
Regional export blending offers an opening for Mombasa plants, because inland neighbors import most of their oils through the same port. Uganda took 65.7% of Mombasa transit cargo in 2024, followed by South Sudan at 12.7%, the Democratic Republic of the Congo at 11.8% and Rwanda at 5.1%. OLA Energy has argued that a 10% import duty on base oils and additives made exports harder against duty-free rivals. The East African Community tariff-rate quota of January 2025 gives Kenyan blenders cheaper inputs for a period. In turn, the Mombasa and Coastal Corridor, with 21.0% of 2025 value, can grow export volumes from local plants.
Counterfeits, import costs and weak car sales test sellers
How do counterfeit packs hurt branded sellers?
Counterfeit packs hurt branded sellers, because refilled bottles and copycat labels sell below genuine prices in informal shops. As a result, motorists who suffer engine damage may blame the brand rather than the fake product. Smaller workshops and rural buyers face the highest risk, since they often lack ways to check packs. Marketers respond with code checks, tamper seals, approved distributor lists and joint raids with enforcement agencies.
Why do import costs squeeze local blenders?
Import costs squeeze local blenders, because base oils and additives are bought in U.S. dollars and shipped from the Gulf and Asia. In turn, a weaker shilling or higher freight rates raise blending costs within weeks. Small independent brands feel the pressure first, since they hold less stock and weaker supplier terms. Blenders respond with longer supply contracts, larger bulk tanks in Mombasa and price packs that keep entry grades within reach.
How does weak new vehicle demand slow premium grades?
Weak new vehicle demand slows premium grades, because newer engines are the main users of full synthetic and low-viscosity oils. However, newly registered cars fell sharply in 2024, which keeps the fleet older and mineral grades dominant. Sellers of premium oils face slower uptake outside Nairobi as a result. Marketers respond with semi-synthetic blends, fleet trials that show longer drain intervals and workshop training on correct grades.
Why does used oil disposal create compliance costs?
Used oil disposal creates compliance costs, because drained oil must be collected, stored and handed to licensed handlers rather than dumped or burned. In turn, workshops and fleets need tanks, records and transport arrangements that add to service costs. Informal garages often skip these steps, which harms soil and water. Marketers respond with take-back schemes at stations, partnerships with licensed recyclers and simple collection drums for workshops.
Nairobi leads while the Rift Valley grows the fastest
| Region | Value, 2025 (USD million) | Share, 2025 | CAGR, 2026–2035 |
|---|---|---|---|
| Nairobi Metropolitan Area | 95.6 | 38.0% | 6.80% |
| Rift Valley | 55.3 | 22.0% | 7.50% |
| Mombasa & Coastal Corridor | 52.8 | 21.0% | 7.10% |
| Western & Central-Eastern Kenya | 47.8 | 19.0% | 6.90% |
Why does Nairobi Metropolitan Area hold the largest share?
Nairobi Metropolitan Area held a 38.0% share of 2025 value and grows at 6.80% a year, because the capital hosts the largest vehicle fleet and most service stations. Vivo Energy Kenya opened its 336th Shell station on Mombasa Road at Imara Daima. Factories in Industrial Area and Athi River also buy hydraulic fluids and gear oils for production lines. As a result, Nairobi leads demand for both automotive and industrial grades.
How is the Rift Valley adding the fastest growth?
The Rift Valley held a 22.0% share of 2025 value and grows fastest at 7.50% a year, because Nakuru, Eldoret and Naivasha are adding logistics depots, farms and geothermal plants. Nakuru county grew by 6.9% a year between 2019 and 2023, according to national county output statistics. Trucks on the Northern Corridor to Uganda also pass through the region every day. In turn, demand rises for heavy-duty engine oils, grease and tractor fluids across the zone.
Why does the Mombasa and Coastal Corridor matter for supply?
The Mombasa and Coastal Corridor held a 21.0% share of 2025 value and grows at 7.10% a year, because the port, blending plants and cargo terminals sit in the zone. The Port of Mombasa handled 41.1 million metric tons in 2024, which keeps cranes, reach stackers and trucks running. Vivo Energy Kenya and OLA Energy both blend lubricants in Mombasa. As a result, the coast supplies the rest of the country and inland neighbors.
How fast are Western and Central-Eastern Kenya growing?
Western and Central-Eastern Kenya held a 19.0% share of 2025 value and grows at 6.90% a year, because farming towns, motorcycle taxis and sugar and tea factories drive steady demand. Kisumu, Kakamega, Meru and Machakos depend on motorcycle taxis that need frequent oil changes. However, lower car ownership keeps premium grade sales small across most rural counties. In turn, mineral engine oils and small packs dominate purchases across these counties.
Rules, port records and company moves since 2024
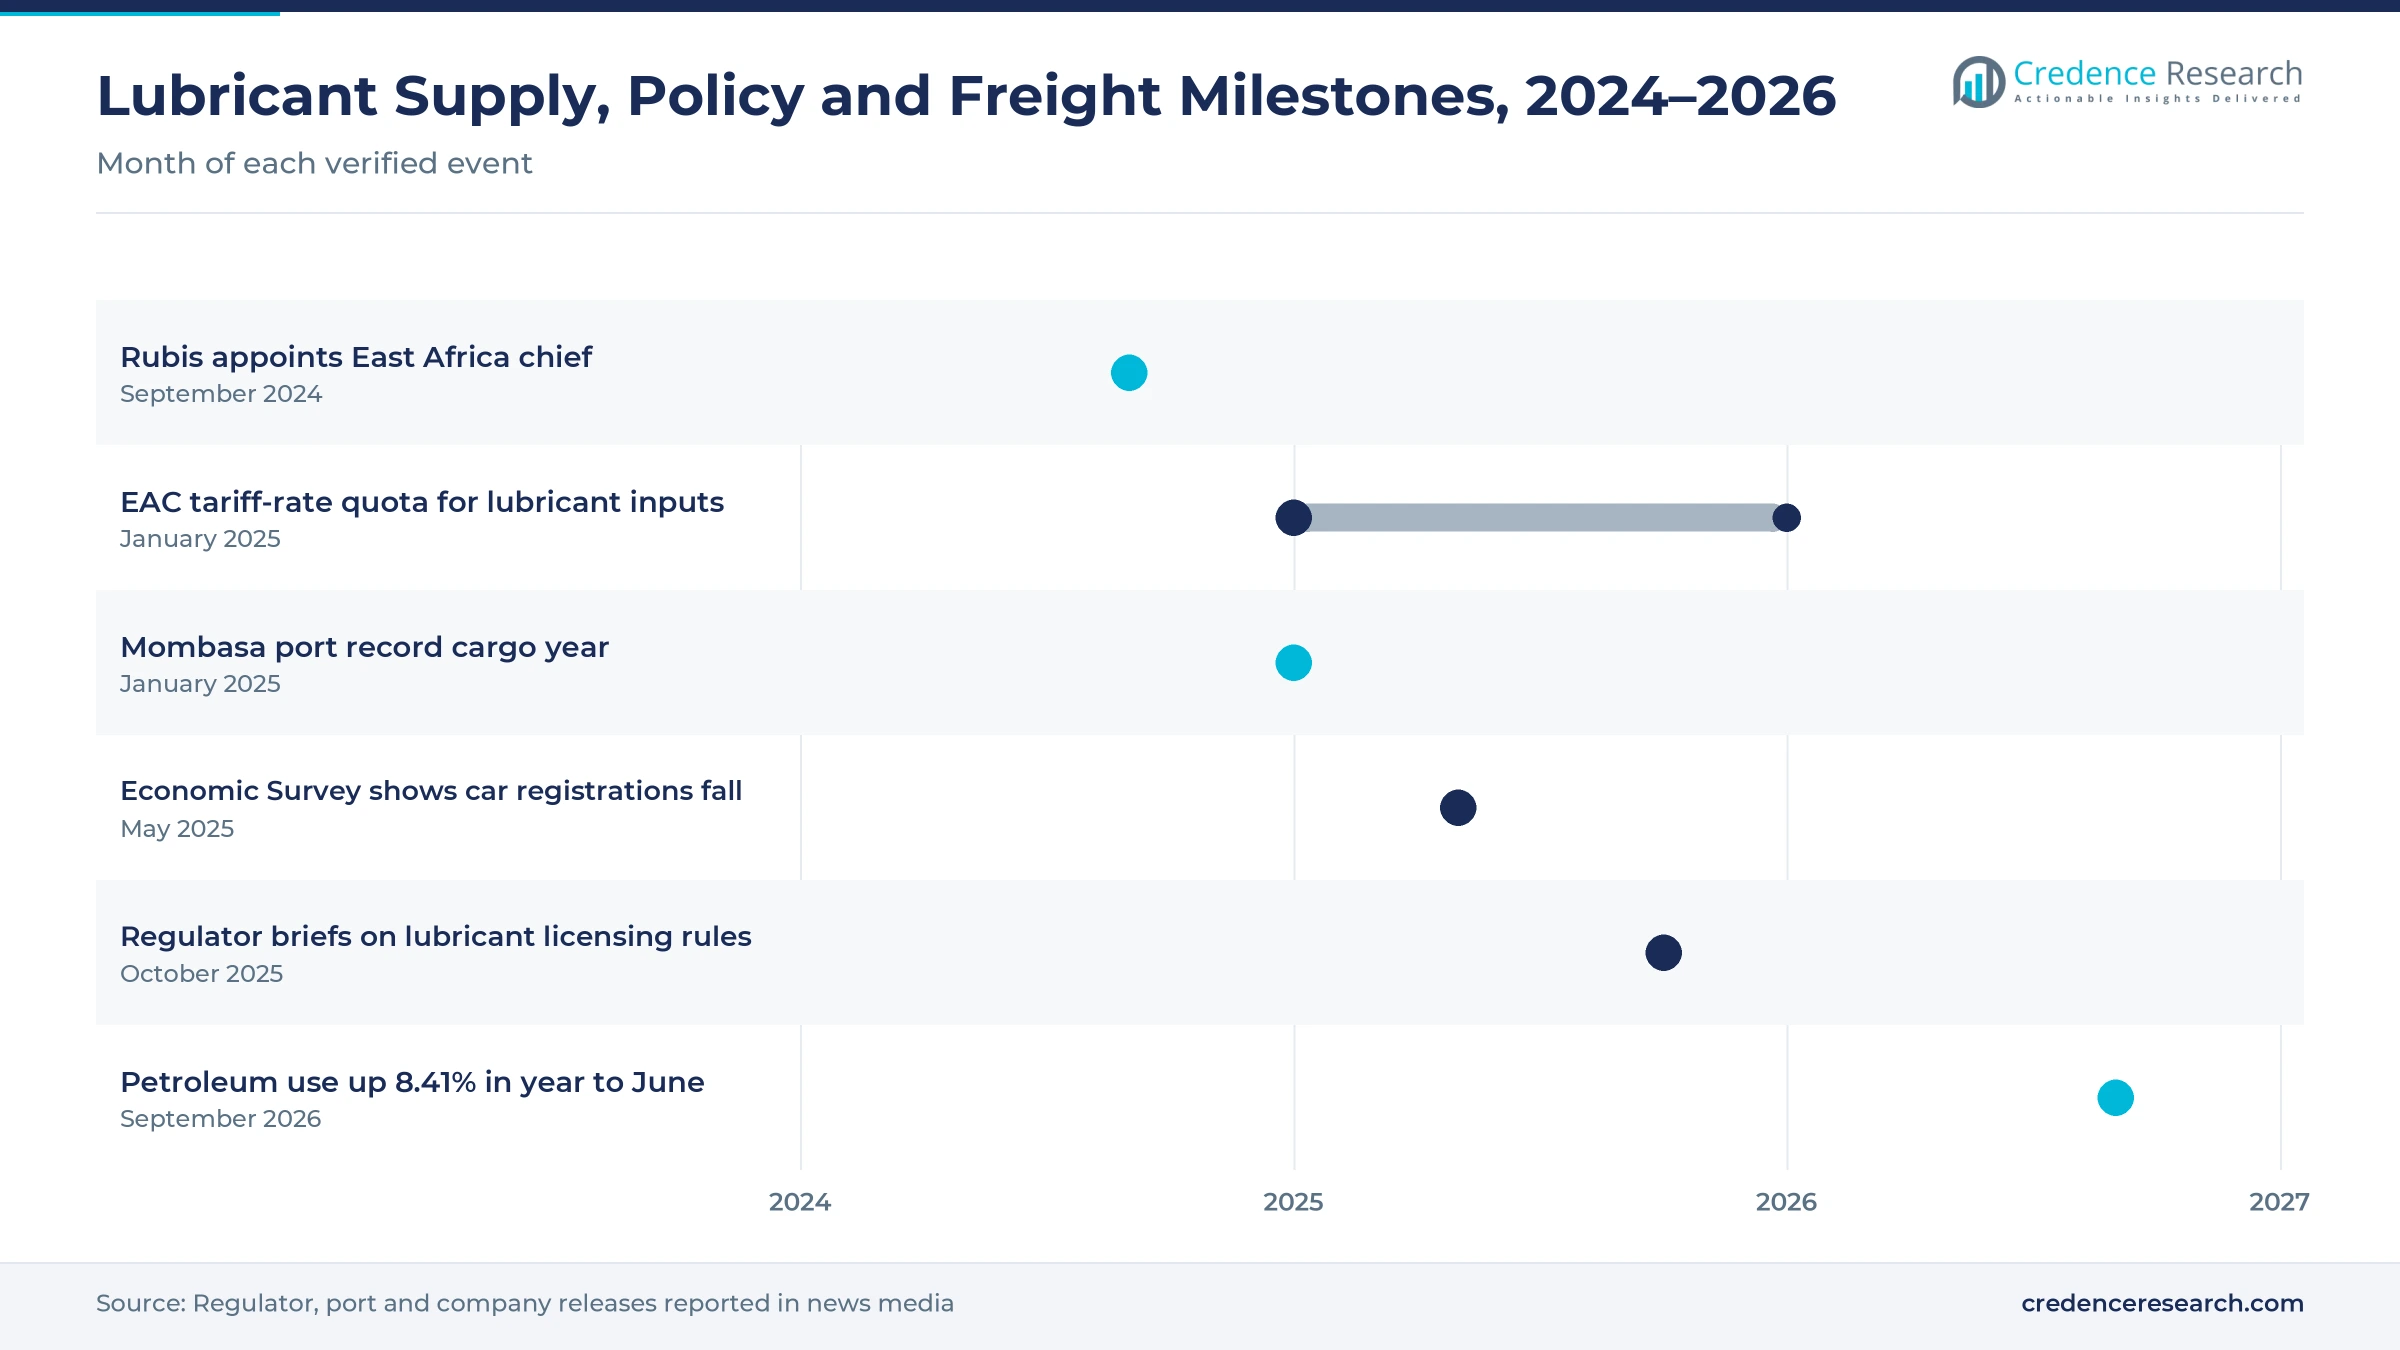
| Development | Status and market relevance |
|---|---|
| In September 2024, Rubis Energy appointed Olivier Sabrié as East Africa chief executive and group managing director of Rubis Energy Kenya. | Leadership change at the Castrol distributor |
| In January 2025, the East African Community issued a temporary tariff-rate quota for inputs used to make oil-based lubricants in Kenya. | Lowers input costs for local blending |
| In January 2025, the Port of Mombasa reported a record 41.1 million metric tons of cargo handled in 2024. | Signals higher freight and equipment use |
| In October 2025, the Energy and Petroleum Regulatory Authority briefed stakeholders on the 2025 lubricants facility and business licensing rules. | Brings lubricant plants and sellers under licensing |
| In September 2026, regulator statistics showed petroleum consumption rose 8.41% to 6.33 million cubic meters in the year to June 2026. | Points to more driving and servicing demand |
Blending, code checks and synthetics modernize supply
- Automated blending lines mix base oils and additive packages in Mombasa plants, which keeps grades consistent and cuts import lead times.
- Pack verification codes let buyers send a short code from under the cap to confirm a pack is genuine, which counters fake engine oil.
- Synthetic and low-viscosity grades protect newer engines over longer drain intervals, which suits fleets that want less downtime.
- Oil condition monitoring tests used oil from trucks and mining machines, which helps fleets plan changes and avoid breakdowns.
Need a Custom Version of This Report?
Tailor the scope, geography, or segments to your exact requirements.
- Custom geography or segment scope
- Direct access to our analyst team
Oil marketers compete on station reach and local blending
Competition is led by oil marketing companies with national station networks, alongside independent blenders and distributors. Vivo Energy Kenya sells Shell lubricants blended in Mombasa and runs more than 330 Shell stations. Rubis Energy Kenya distributes Castrol lubricants through stations, distributors, workshops and spare shops, while OLA Energy runs its own ISO-certified blending plant in Mombasa. TotalEnergies Marketing Kenya, listed on the Nairobi Securities Exchange, competes with a wide automotive and industrial range. Hass Petroleum, Galana Energies, National Oil Corporation of Kenya, Oryx Energies, Dalbit Petroleum and Quantum Lubricants serve fleets, distributors and regional buyers. Rivals compete on brand trust, anti-counterfeit features, station reach, credit terms for workshops and technical support for fleets. As licensing tightens, companies with registered plants and strong distributor control are best placed to gain share.
Which marketers shape Kenyan oil supply?
| Company | Type | Role in the market |
|---|---|---|
| Vivo Energy Kenya | Oil marketer and blender | Blends Shell lubricants in Mombasa and runs more than 330 Shell stations |
| Rubis Energy Kenya | Oil marketer | Distributes Castrol lubricants through stations, distributors and workshops |
| OLA Energy Kenya Limited | Oil marketer and blender | Runs an ISO-certified lubricant blending plant in Mombasa |
| TotalEnergies Marketing Kenya PLC | Oil marketer | Listed marketer serving motorists and industrial buyers |
Credence Research view on formal oil supply in Kenya
Credence Research's view is that the Kenyan market will grow through more freight, more building work and a shift to formal, traceable supply rather than through new car sales. Engine oils remain the largest value pool, while hydraulic fluids, synthetic grades and direct supply contracts add the fastest growth. The 2025 licensing rules should squeeze unregistered sellers, and Mombasa blenders can serve inland neighbors. Marketers with strong station networks, local plants and anti-counterfeit tools should gain the most, while currency swings and fake packs keep pressure on margins.
How the national oil and grease estimate was built
The report uses 2025 as the base year on a calendar basis, and market values come from the Credence Research model. That model combines vehicle registration data, port and transit cargo statistics, petroleum consumption figures, economic growth data and company releases. Regional shares, segment splits and growth rates are Credence Research estimates. Sources used are official statistics, regulator and World Bank releases, trade data and company releases reported in news media, and no interviews or surveys were used.
Freight, mining work and synthetics carry growth to 2035
The Kenya lubricants market is expected to reach USD 505.6 million by 2035, a 7.04% CAGR during 2026–2035, as freight, building and mining work keep machines running and fleets service vehicles more often. Growth should be strongest in hydraulic fluids, full synthetic grades, direct B2B supply and the Rift Valley, because these areas gain most from new logistics hubs, newer engines and bulk contracts. Licensing rules and pack checks will favor formal brands, while counterfeits and currency swings could slow some sellers.
Frequently Asked Questions
How big is the Kenya lubricants market?
Which product type leads Kenyan demand?
Which region leads the Kenyan market?
How do the 2025 licensing rules affect lubricant sellers?
Which base stock type is growing fastest?
How does freight activity support oil demand?
Who are the leading companies in the Kenyan market?
What are the main challenges for lubricant sellers in Kenya?
Table of Content
Chapter 1 Market Segmentation
- 1.1 Segmentation Framework
- 1.1.1 Product and Service Classification
- 1.1.2 Application and End-Use Classification
- 1.1.3 Technology and Solution Classification
- 1.1.4 Customer and Distribution Channel Classification
- 1.1.5 Geographic Segmentation
- 1.1.6 Market Segment Definitions and Boundaries
- 1.2 By Product Type
- 1.2.1 Engine Oils
- 1.2.2 Hydraulic Fluids
- 1.2.3 Gear & Transmission Oils
- 1.2.4 Greases & Specialty Oils
- 1.3 By End-Use Industry
- 1.3.1 Automotive
- 1.3.2 Construction & Mining
- 1.3.3 Manufacturing & Metalworking
- 1.3.4 Power & Utilities
- 1.4 By Sales Channel
- 1.4.1 Branded Service Stations
- 1.4.2 Independent Lubricant Distributors
- 1.4.3 Automotive Workshops & Parts Retailers
- 1.4.4 Direct B2B & Tender Sales
- 1.5 By Base Stock Type
- 1.5.1 Mineral Oil-Based
- 1.5.2 Semi-Synthetic
- 1.5.3 Full Synthetic
- 1.5.4 Bio-Based
Chapter 2 Introduction
- 2.1 Report Objectives and Scope
- 2.2 Product Definition and Industry Terminology
- 2.3 Market Inclusions and Exclusions
- 2.4 Research Process
- 2.4.1 Primary Research and Expert Interviews
- 2.4.2 Secondary Research and Source Review
- 2.4.3 Top-Down and Bottom-Up Estimation
- 2.4.4 Data Triangulation and Verification
- 2.5 Market Size Measurement Basis
- 2.5.1 2025: USD 251.5 million → 2035: USD 505.6 million
- 2.6 Historical and Forecast Reference Periods
- 2.6.1 Historical Period: 2018-2025
- 2.6.2 Base Year: 2025
- 2.6.3 Forecast Period: 2025-2035
- 2.7 Research Assumptions and Limitations
Chapter 3 Executive Summary
- 3.1 Market Snapshot and Key Findings
- 3.2 Base-Year Market Size, 2025
- 3.3 Forecast Market Size, 2035
- 3.4 Revenue and Volume Growth Outlook
- 3.5 Key Demand and Supply Indicators
- 3.6 Leading Market Segments
- 3.7 Fastest-Growing Market Opportunities
- 3.8 Regional Performance Highlights
- 3.9 Technology and Industry Transformation
- 3.10 Competitive Landscape Summary
- 3.11 Analyst View and Strategic Implications
Chapter 4 Kenya Lubricants Market Trends and Developments
- 4.1 Historical Industry Development, 2018-2025
- 4.2 Recent Market Trends and Developments
- 4.3 Demand and Customer Behavior Trends
- 4.4 Technology and Product Innovation
- 4.5 Artificial Intelligence, Automation and Digitalization
- 4.6 Local Manufacturing and Supply Chain Realignment
- 4.7 Industry Partnerships, Mergers and Acquisitions
- 4.8 Sustainability and Circular Economy Developments
- 4.9 Government and Private Sector Investment Trends
- 4.10 Emerging Business Models and Commercialization
- 4.11 Industry Developments and Announcements
Chapter 5 Kenya Lubricants Market Production, Supply and Demand Analysis
- 5.1 Demand Trend and Consumption Analysis, 2018-2025
- 5.2 Demand Forecast, 2025-2035
- 5.3 Production and Output Trend, 2018-2025
- 5.4 Production and Output Forecast, 2025-2035
- 5.5 Installed Capacity and Capacity Utilization
- 5.6 Company-Wise Production Plants and Statistics
- 5.6.1 Installed Production Capacity
- 5.6.2 Actual Production
- 5.6.3 Planned Capacity and Expansion Targets
- 5.7 Supply Chain Structure and Procurement Trends
- 5.8 Supply-Demand Gap and Bottlenecks
- 5.9 Import Dependence and Sourcing Structure
- 5.10 Contract Manufacturing and Outsourcing
- 5.11 Regional Supply and Demand Concentration
Chapter 6 Kenya Lubricants Market Pricing Analysis
- 6.1 Pricing Structure and Measurement
- 6.2 Historical Pricing Trends, 2018-2025
- 6.3 Pricing Outlook, 2025-2035
- 6.4 Average Selling Price and Unit Economics
- 6.5 Pricing by Product and Market Segment
- 6.6 Geographic Pricing Differences
- 6.7 Key Input, Energy, Labor and Logistics Costs
- 6.8 Contract Pricing and Purchasing Models
- 6.9 Pricing Sensitivity and Competitive Positioning
- 6.10 Price, Margin and Profitability Implications
Chapter 7 Kenya Lubricants Market Dynamics
- 7.1 Market Growth Drivers
- 7.1.1 Demand-Side Drivers
- 7.1.2 Technology and Innovation Drivers
- 7.1.3 Infrastructure and Investment Drivers
- 7.1.4 Regulatory and Policy Drivers
- 7.2 Market Restraints
- 7.2.1 Cost and Affordability Constraints
- 7.2.2 Technology and Adoption Barriers
- 7.2.3 Supply Chain and Operational Constraints
- 7.3 Market Challenges
- 7.3.1 Competitive Pressure and Margin Erosion
- 7.3.2 Skills, Infrastructure and Implementation Gaps
- 7.4 Emerging Market Opportunities
- 7.5 Market Dynamics Impact and Time-Horizon Assessment
Chapter 8 Kenya Lubricants Value Chain Analysis
- 8.1 Industry Value Chain Overview
- 8.2 Upstream Suppliers and Critical Inputs
- 8.3 Technology and Component Providers
- 8.4 Manufacturing or Service Delivery
- 8.5 Distribution, Channel Partners and Integrators
- 8.6 Downstream Applications and End Users
- 8.7 Value Addition and Profit Pools
- 8.8 Vertical Integration and Outsourcing
- 8.9 Supplier Concentration and Risk
- 8.10 Supply Chain Localization and Resilience
Chapter 9 Kenya Lubricants Market Regulations and Policies
- 9.1 Relevant Laws, Standards and Compliance Frameworks
- 9.2 Product, Service, Safety and Quality Requirements
- 9.3 Government Policies, Incentives and Subsidies
- 9.4 Imports, Exports and Trade Barriers
- 9.5 Public Procurement and Local Content Requirements
- 9.6 Environmental and Sustainability Compliance
- 9.7 Upcoming Policy Changes and Market Implications
Chapter 10 Kenya Lubricants Market Hotspots and Opportunities
- 10.1 Market Opportunity Mapping and Growth Hotspots
- 10.2 High-Growth Applications and Customer Groups
- 10.3 Underserved Markets and White-Space Opportunities
- 10.4 Emerging Technology and Product Opportunities
- 10.5 New Capacity and Investment Hotspots
- 10.6 Market Entry and Expansion Opportunities
- 10.7 Distribution and Partnership Opportunities
- 10.8 Near-Term and Long-Term Commercial Potential
- 10.9 Opportunity Attractiveness and Execution Risks
Chapter 11 Kenya Lubricants Market Outlook, 2025-2035
- 11.1 Market Size and Analysis
- 11.1.1 Revenue (Market Measurement: 2025: USD 251.5 million → 2035: USD 505.6 million)
- 11.1.2 Market Volume and Quantity Sold
- 11.1.3 Historical Market Size, 2018-2025
- 11.1.4 Base-Year Market Size, 2025
- 11.2 Market Forecast, 2025-2035
- 11.2.1 Revenue Forecast to 2035
- 11.2.2 Volume Forecast to 2035
- 11.2.3 CAGR and Year-on-Year Growth
- 11.2.4 Incremental Revenue Opportunity
- 11.3 Forecast Assumptions and Scenario Analysis
- 11.3.1 Base-Case Forecast
- 11.3.2 Optimistic and Conservative Scenarios
- 11.3.3 Technology, Pricing and Policy Sensitivities
- 11.4 Market Attractiveness and Growth Outlook
Chapter 12 Kenya Lubricants Market Segmentation and Outlook
- 12.1 Segmentation Summary and Market Shares, 2025
- 12.2 Largest and Fastest-Growing Segments
- 12.3 By Product Type - Market Size and Forecast, 2025-2035
- 12.3.1 Segment Definition and Scope
- 12.3.2 Historical Market Size, 2018-2025
- 12.3.3 Revenue Forecast, 2025-2035
- 12.3.4 Volume Forecast, 2025-2035
- 12.3.5 Base-Year Market Share, 2025
- 12.3.6 Segment CAGR and Growth Drivers
- 12.3.7 Subsegment Market Size and Forecast
- 12.3.7.1 Engine Oils
- 12.3.7.2 Hydraulic Fluids
- 12.3.7.3 Gear & Transmission Oils
- 12.3.7.4 Greases & Specialty Oils
- 12.3.8 Subsegment Pricing and Adoption Trends
- 12.3.9 Leading Suppliers and Competition
- 12.3.10 Regional Demand and Opportunities
- 12.4 By End-Use Industry - Market Size and Forecast, 2025-2035
- 12.4.1 Segment Definition and Scope
- 12.4.2 Historical Market Size, 2018-2025
- 12.4.3 Revenue Forecast, 2025-2035
- 12.4.4 Volume Forecast, 2025-2035
- 12.4.5 Base-Year Market Share, 2025
- 12.4.6 Segment CAGR and Growth Drivers
- 12.4.7 Subsegment Market Size and Forecast
- 12.4.7.1 Automotive
- 12.4.7.2 Construction & Mining
- 12.4.7.3 Manufacturing & Metalworking
- 12.4.7.4 Power & Utilities
- 12.4.8 Subsegment Pricing and Adoption Trends
- 12.4.9 Leading Suppliers and Competition
- 12.4.10 Regional Demand and Opportunities
- 12.5 By Sales Channel - Market Size and Forecast, 2025-2035
- 12.5.1 Segment Definition and Scope
- 12.5.2 Historical Market Size, 2018-2025
- 12.5.3 Revenue Forecast, 2025-2035
- 12.5.4 Volume Forecast, 2025-2035
- 12.5.5 Base-Year Market Share, 2025
- 12.5.6 Segment CAGR and Growth Drivers
- 12.5.7 Subsegment Market Size and Forecast
- 12.5.7.1 Branded Service Stations
- 12.5.7.2 Independent Lubricant Distributors
- 12.5.7.3 Automotive Workshops & Parts Retailers
- 12.5.7.4 Direct B2B & Tender Sales
- 12.5.8 Subsegment Pricing and Adoption Trends
- 12.5.9 Leading Suppliers and Competition
- 12.5.10 Regional Demand and Opportunities
- 12.6 By Base Stock Type - Market Size and Forecast, 2025-2035
- 12.6.1 Segment Definition and Scope
- 12.6.2 Historical Market Size, 2018-2025
- 12.6.3 Revenue Forecast, 2025-2035
- 12.6.4 Volume Forecast, 2025-2035
- 12.6.5 Base-Year Market Share, 2025
- 12.6.6 Segment CAGR and Growth Drivers
- 12.6.7 Subsegment Market Size and Forecast
- 12.6.7.1 Mineral Oil-Based
- 12.6.7.2 Semi-Synthetic
- 12.6.7.3 Full Synthetic
- 12.6.7.4 Bio-Based
- 12.6.8 Subsegment Pricing and Adoption Trends
- 12.6.9 Leading Suppliers and Competition
- 12.6.10 Regional Demand and Opportunities
- 12.7 Segment Growth Comparison
- 12.8 Segment Attractiveness and Priority Matrix
Chapter 13 Kenya Lubricants End-Use and Application Market Outlook
- 13.1 End-Use Industry and Customer Demand Structure
- 13.2 Leading Applications and Customer Groups
- 13.3 End-Use Market Size, Share and Forecast
- 13.4 Major End-Use Industry Deep Dives
- 13.4.1 Customer Requirements and Use Cases
- 13.4.2 Demand and Replacement Cycles
- 13.4.3 Technical and Regulatory Considerations
- 13.4.4 Purchasing and Procurement Models
- 13.4.5 Leading Vendors and Distribution Channels
- 13.4.6 Forecast and Commercial Opportunities
- 13.5 Emerging Applications and Cross-Segment Demand
- 13.6 End-Use Industry Investment Priorities
Chapter 14 Kenya Lubricants Geographic Market Outlook, 2025-2035
- 14.1 Domestic Market Distribution and Demand Clusters
- 14.2 State- or Province-Wise Market Size and Forecast, 2025-2035
- 14.3 City and Metropolitan Market Outlook
- 14.4 Industrial, Manufacturing and Commercial Clusters
- 14.5 Geographic Concentration of Key End Users
- 14.6 Local Pricing and Purchasing Differences
- 14.7 Domestic Production Facilities and Capacity Map
- 14.8 Local Infrastructure and Project Pipeline
- 14.9 State-Level Policy and Incentive Differences
- 14.10 Subnational Investment Hotspots and Opportunities
- 14.11 Distribution and Logistics Networks
- 14.12 Domestic Competitive Footprint
Chapter 15 Kenya Lubricants Technology, Innovation and Sustainability Outlook
- 15.1 Technology Landscape and Maturity
- 15.2 Product, Process and Service Innovation
- 15.3 AI, Automation and Digital Tools in the Industry
- 15.4 Technology Adoption and Performance Benchmarking
- 15.5 Innovation Pipeline and R&D Investment
- 15.6 Patent and Intellectual Property Trends
- 15.7 Energy Efficiency and Resource Management
- 15.8 Sustainability, Recycling and Circularity
- 15.9 Technology Roadmap, 2025-2035
- 15.10 Risks of Obsolescence and Technology Substitution
Chapter 16 Kenya Lubricants Market Key Strategic Imperatives
- 16.1 Growth and Market Entry Priorities
- 16.2 High-Return Products and Segments
- 16.3 Pricing, Profitability and Cost Optimization
- 16.4 Technology Investment and Product Differentiation
- 16.5 Supply Chain Localization and Resilience
- 16.6 Distribution and Customer Acquisition
- 16.7 Partnership, Acquisition and Capacity Strategy
- 16.8 Regional Expansion Priorities
- 16.9 Short-, Medium- and Long-Term Actions
Chapter 17 Competition Outlook
- 17.1 Industry Competition Characteristics
- 17.2 Market Structure and Concentration
- 17.3 Market Share and Competitive Positioning, 2025
- 17.4 Company-Wise Revenue and Product Benchmarking
- 17.5 Production and Service Capacity Benchmarking
- 17.6 Technology, Pricing and Differentiation
- 17.7 Regional Footprint and Distribution Strength
- 17.8 Mergers, Acquisitions and Strategic Alliances
- 17.9 New Entrants and Competitive Threats
- 17.10 Porter's Five Forces and Industry Attractiveness
- 17.11 Competitive Outlook, 2025-2035
Chapter 18 Company Profiles
- 18.1 Company Coverage and Selection Criteria
- 18.2 Vivo Energy Kenya
- 18.2.1 Business Description
- 18.2.2 Company Ownership and Geographic Presence
- 18.2.3 Product and Service Portfolio
- 18.2.4 Manufacturing and Operating Footprint
- 18.2.5 Production Capacity and Expansion Plans
- 18.2.6 Financial Performance and Investment
- 18.2.7 Market Share and Competitive Position
- 18.2.8 Technology and Innovation Capabilities
- 18.2.9 Strategic Alliances or Partnerships
- 18.2.10 Recent Developments
- 18.2.11 Growth Strategy and Outlook
- 18.3 TotalEnergies Marketing Kenya PLC
- 18.4 Rubis Energy Kenya
- 18.5 OLA Energy Kenya Limited
- 18.6 Hass Petroleum
- 18.7 Galana Energies Limited
- 18.8 National Oil Corporation of Kenya
- 18.9 Oryx Energies Kenya
- 18.10 Dalbit Petroleum Limited
- 18.11 Quantum Lubricants Limited
- 18.12 Other Relevant Market Participants
Note: Every listed company is profiled on the structure shown under the first company. The company list is preliminary and may change based on research findings, market developments, data availability and client requirements.
Chapter 19 Disclaimer
- 19.1 Research and Forecast Disclaimer
- 19.2 Data Source and Estimation Limitations
Note: The depth of individual sections depends on data availability for this market. Volume, capacity, trade and other unit-based metrics are included where applicable.

