
Engine oils anchor value as an older fleet keeps servicing
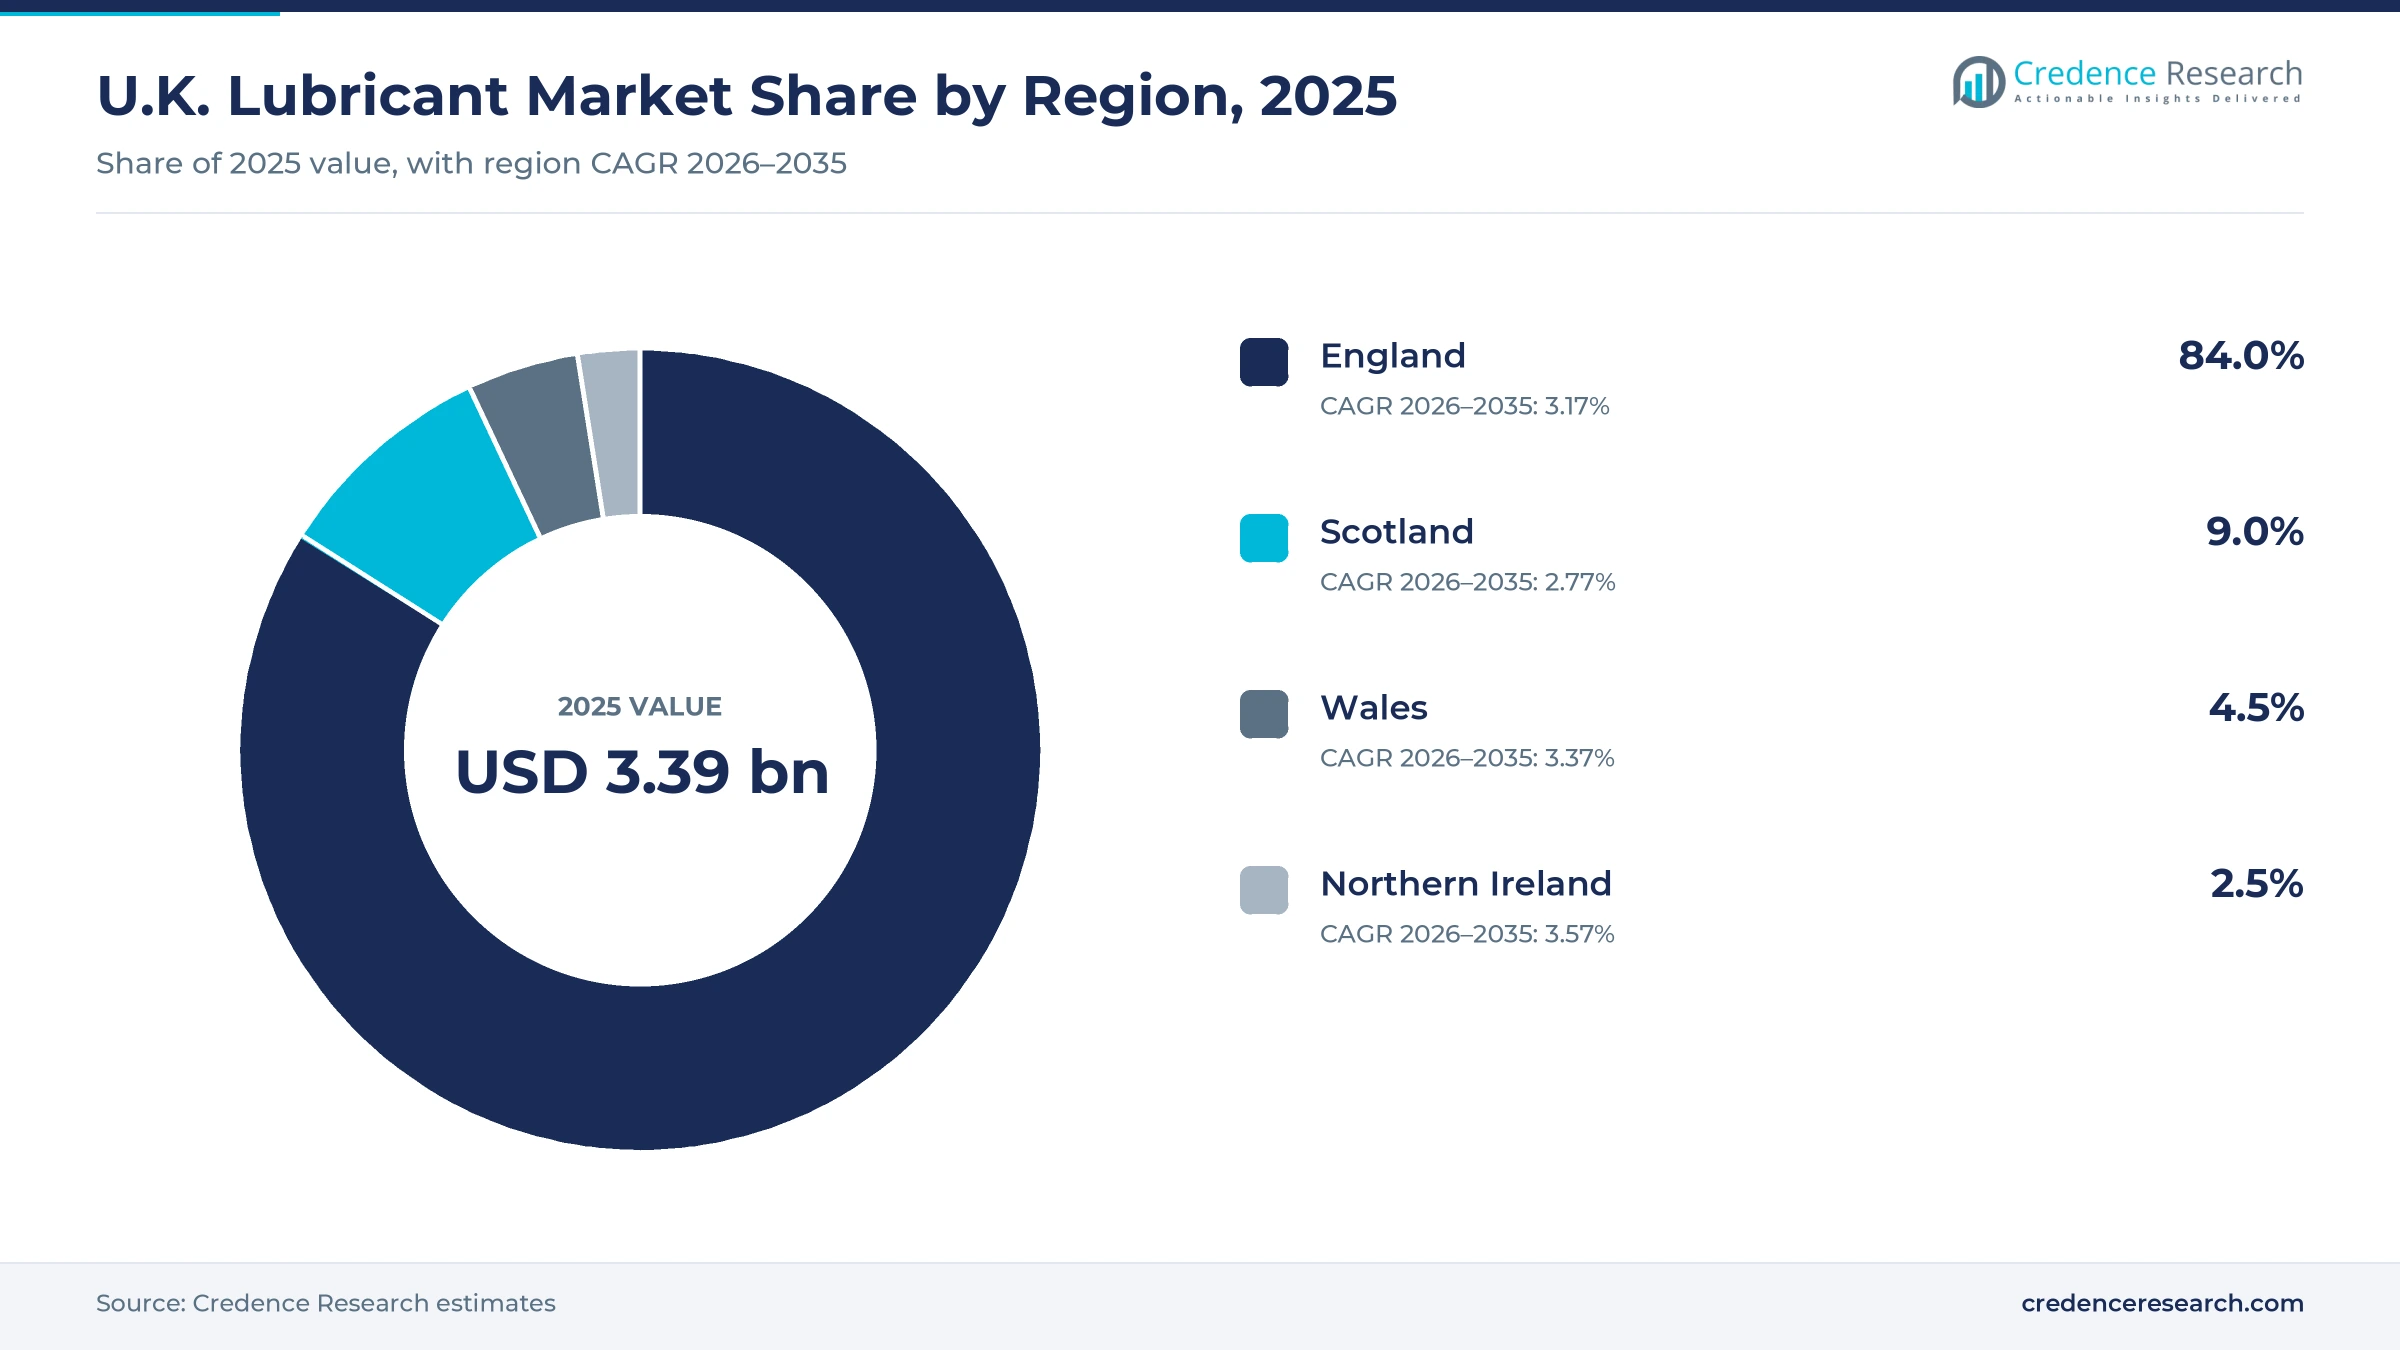
The UK lubricant market was valued at USD 3.39 billion in 2025 and is projected to increase from USD 3.52 billion in 2026 to USD 4.65 billion by 2035, registering a CAGR of 3.15% during 2026–2035. Demand comes from more than 36 million cars and a large van and truck fleet that need regular oil changes, and from factories, builders, ports and power plants that buy hydraulic fluids, gear oils and greases. England held the largest regional share, 84.0% in 2025, because most vehicles, plants and distribution hubs sit in the Midlands, the South East and the North. Northern Ireland is the fastest-growing region at 3.57% a year, as food processing, engineering and freight activity expand from a smaller base. In turn, the rising share of battery electric cars in new sales pushes suppliers toward low-viscosity engine oils, e-fluids and synthetic grades that carry higher prices per liter.
Which oils, fluids and greases does the estimate cover?
The estimate measures the value of engine oils, hydraulic fluids, gear oils and specialty fluids and greases sold to vehicle makers, fleets, workshops, retailers, factories, contractors, utilities and marine operators in the United Kingdom. It covers products blended in domestic plants and imported finished packs, across mineral, semi-synthetic, full synthetic and bio-based technologies.
The estimate excludes fuels, fuel additives sold separately, base oils sold to other blenders, process oils used as raw materials and re-exported products. The value chain runs from base oil and additive suppliers through blending and filling plants to distributors, motor factors, online sellers, service networks and industrial buyers.
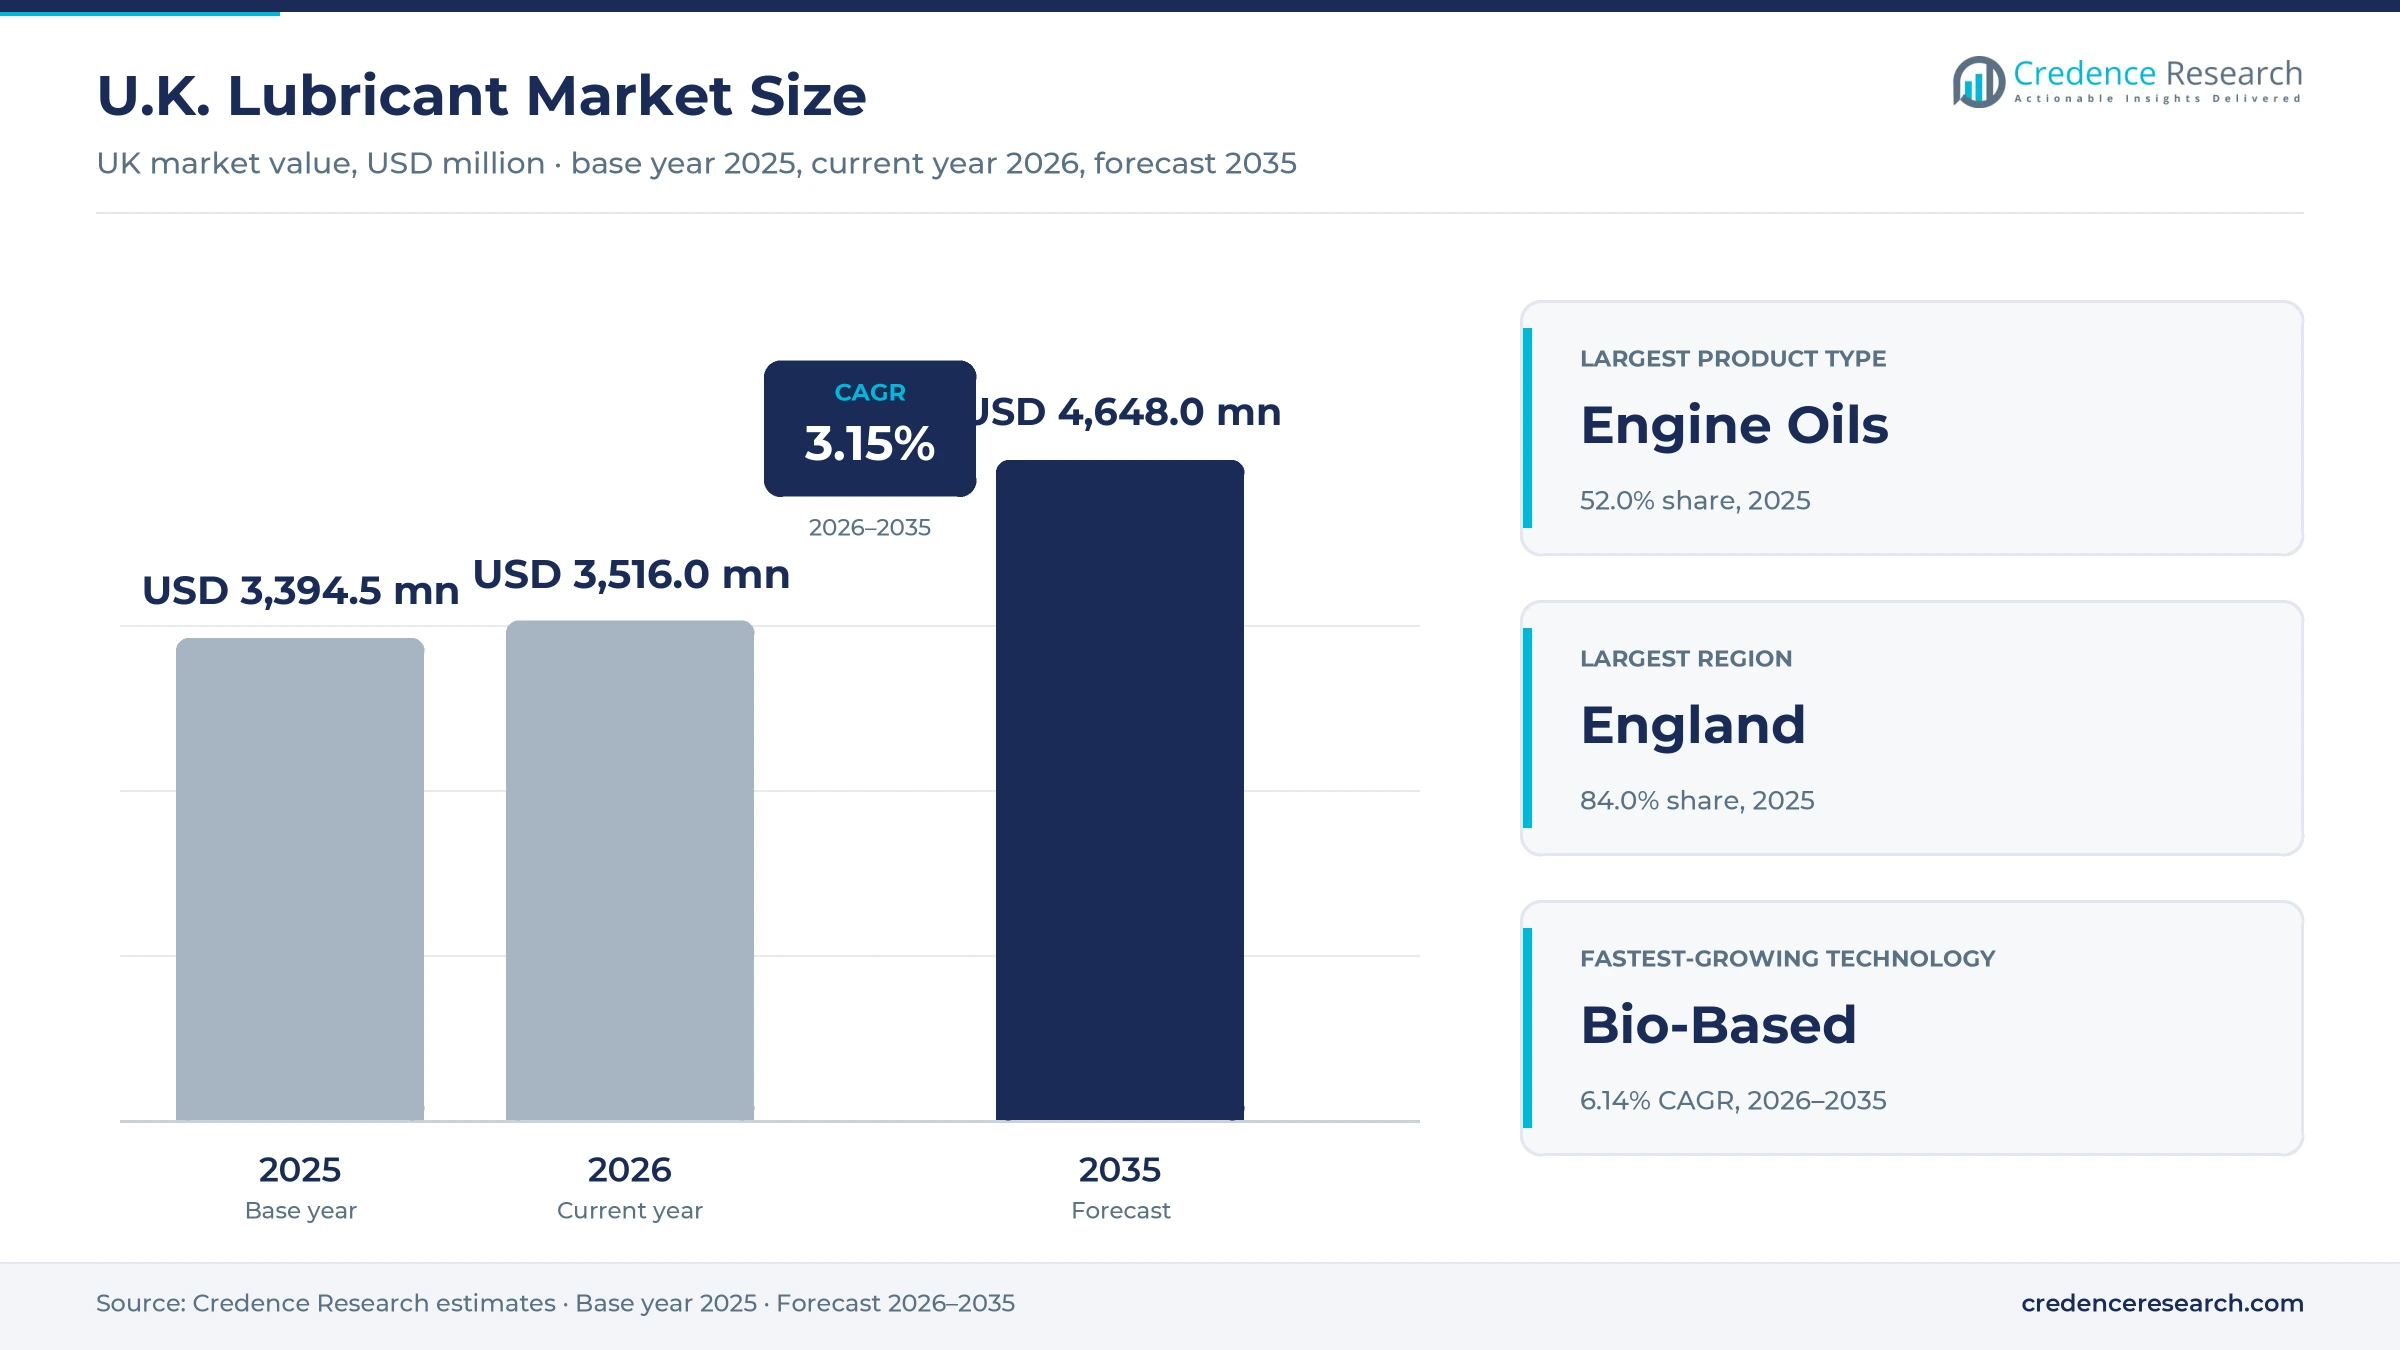
UK Lubricant Market Insights
- The UK lubricant market was valued at USD 3.39 billion in 2025 and is projected to reach USD 4.65 billion by 2035, registering a CAGR of 3.15% during 2026–2035.
- England held 84.0% of 2025 value, because most vehicles, factories, warehouses and service networks sit in the Midlands, the North and the South East.
- Engine oils led with 52.0% of 2025 value, because 36,676,185 cars on the road in 2025 need regular oil changes.
- The average car on UK roads was 9.7 years old in 2025, and 45.7% of cars were more than 10 years old, which keeps servicing demand high.
- Battery electric cars took 23.4% of 2,020,520 new car registrations in 2025, which shifts demand toward e-fluids, greases and low-viscosity synthetic oils.
Engine oils lead while specialty fluids grow the fastest
Why do engine oils hold most of the value?
Based on product type, the market is categorized into engine oils, hydraulic fluids, gear oils and specialty fluids and greases. Engine Oils led with 52.0% of 2025 value, because petrol, diesel and hybrid engines need regular oil changes at workshops and dealers. Specialty Fluids & Greases grow fastest at 4.09% a year, as electric drivetrains, wind turbines and precision machines need tailored fluids and long-life grease.
How fast is power and marine demand rising?
Based on end-use industry, the market is categorized into automotive and transport, manufacturing, construction and mining, and power and marine. Automotive & Transport led with 60.0% of 2025 value, because road transport keeps the largest number of engines in use. Power & Marine grows fastest at 4.08% a year, as offshore wind, port equipment and backup power need turbine oils and greases.
Which sales channels reach UK buyers best?
Based on sales channel, the market is categorized into direct OEM and industrial contracts, authorized distributors, automotive aftermarket retail and e-commerce and service networks. Authorized Distributors led with 32.0% of 2025 value, because workshops and factories rely on local stock and next-day delivery. E-Commerce & Service Networks grow fastest at 4.56% a year, as motorists and small garages order online.
How quickly are synthetic and bio-based grades gaining ground?
Based on technology, the market is categorized into mineral-based, semi-synthetic, full synthetic and bio-based products. Full Synthetic products led with 38.0% of 2025 value, because newer engines need low-viscosity grades with long drain intervals. Bio-Based products grow fastest at 6.14% a year, as utilities, marine operators and forestry contractors look for biodegradable fluids near water and soil.
| Segment Group | Leading Sub-segment | Share, 2025 | Fastest-growing Sub-segment | CAGR, 2026–2035 |
|---|---|---|---|---|
| By Product Type | Engine Oils | 52.0% | Specialty Fluids & Greases | 4.09% |
| By End-Use Industry | Automotive & Transport | 60.0% | Power & Marine | 4.08% |
| By Sales Channel | Authorized Distributors | 32.0% | E-Commerce & Service Networks | 4.56% |
| By Technology | Full Synthetic | 38.0% | Bio-Based | 6.14% |
Request a Free Sample
Fill in your details and we'll send you a free sample report.
- Sample data tables & charts
- Research methodology
Aging cars, factory output and tighter specs lift value
How does a large and aging car fleet keep oil sales steady?
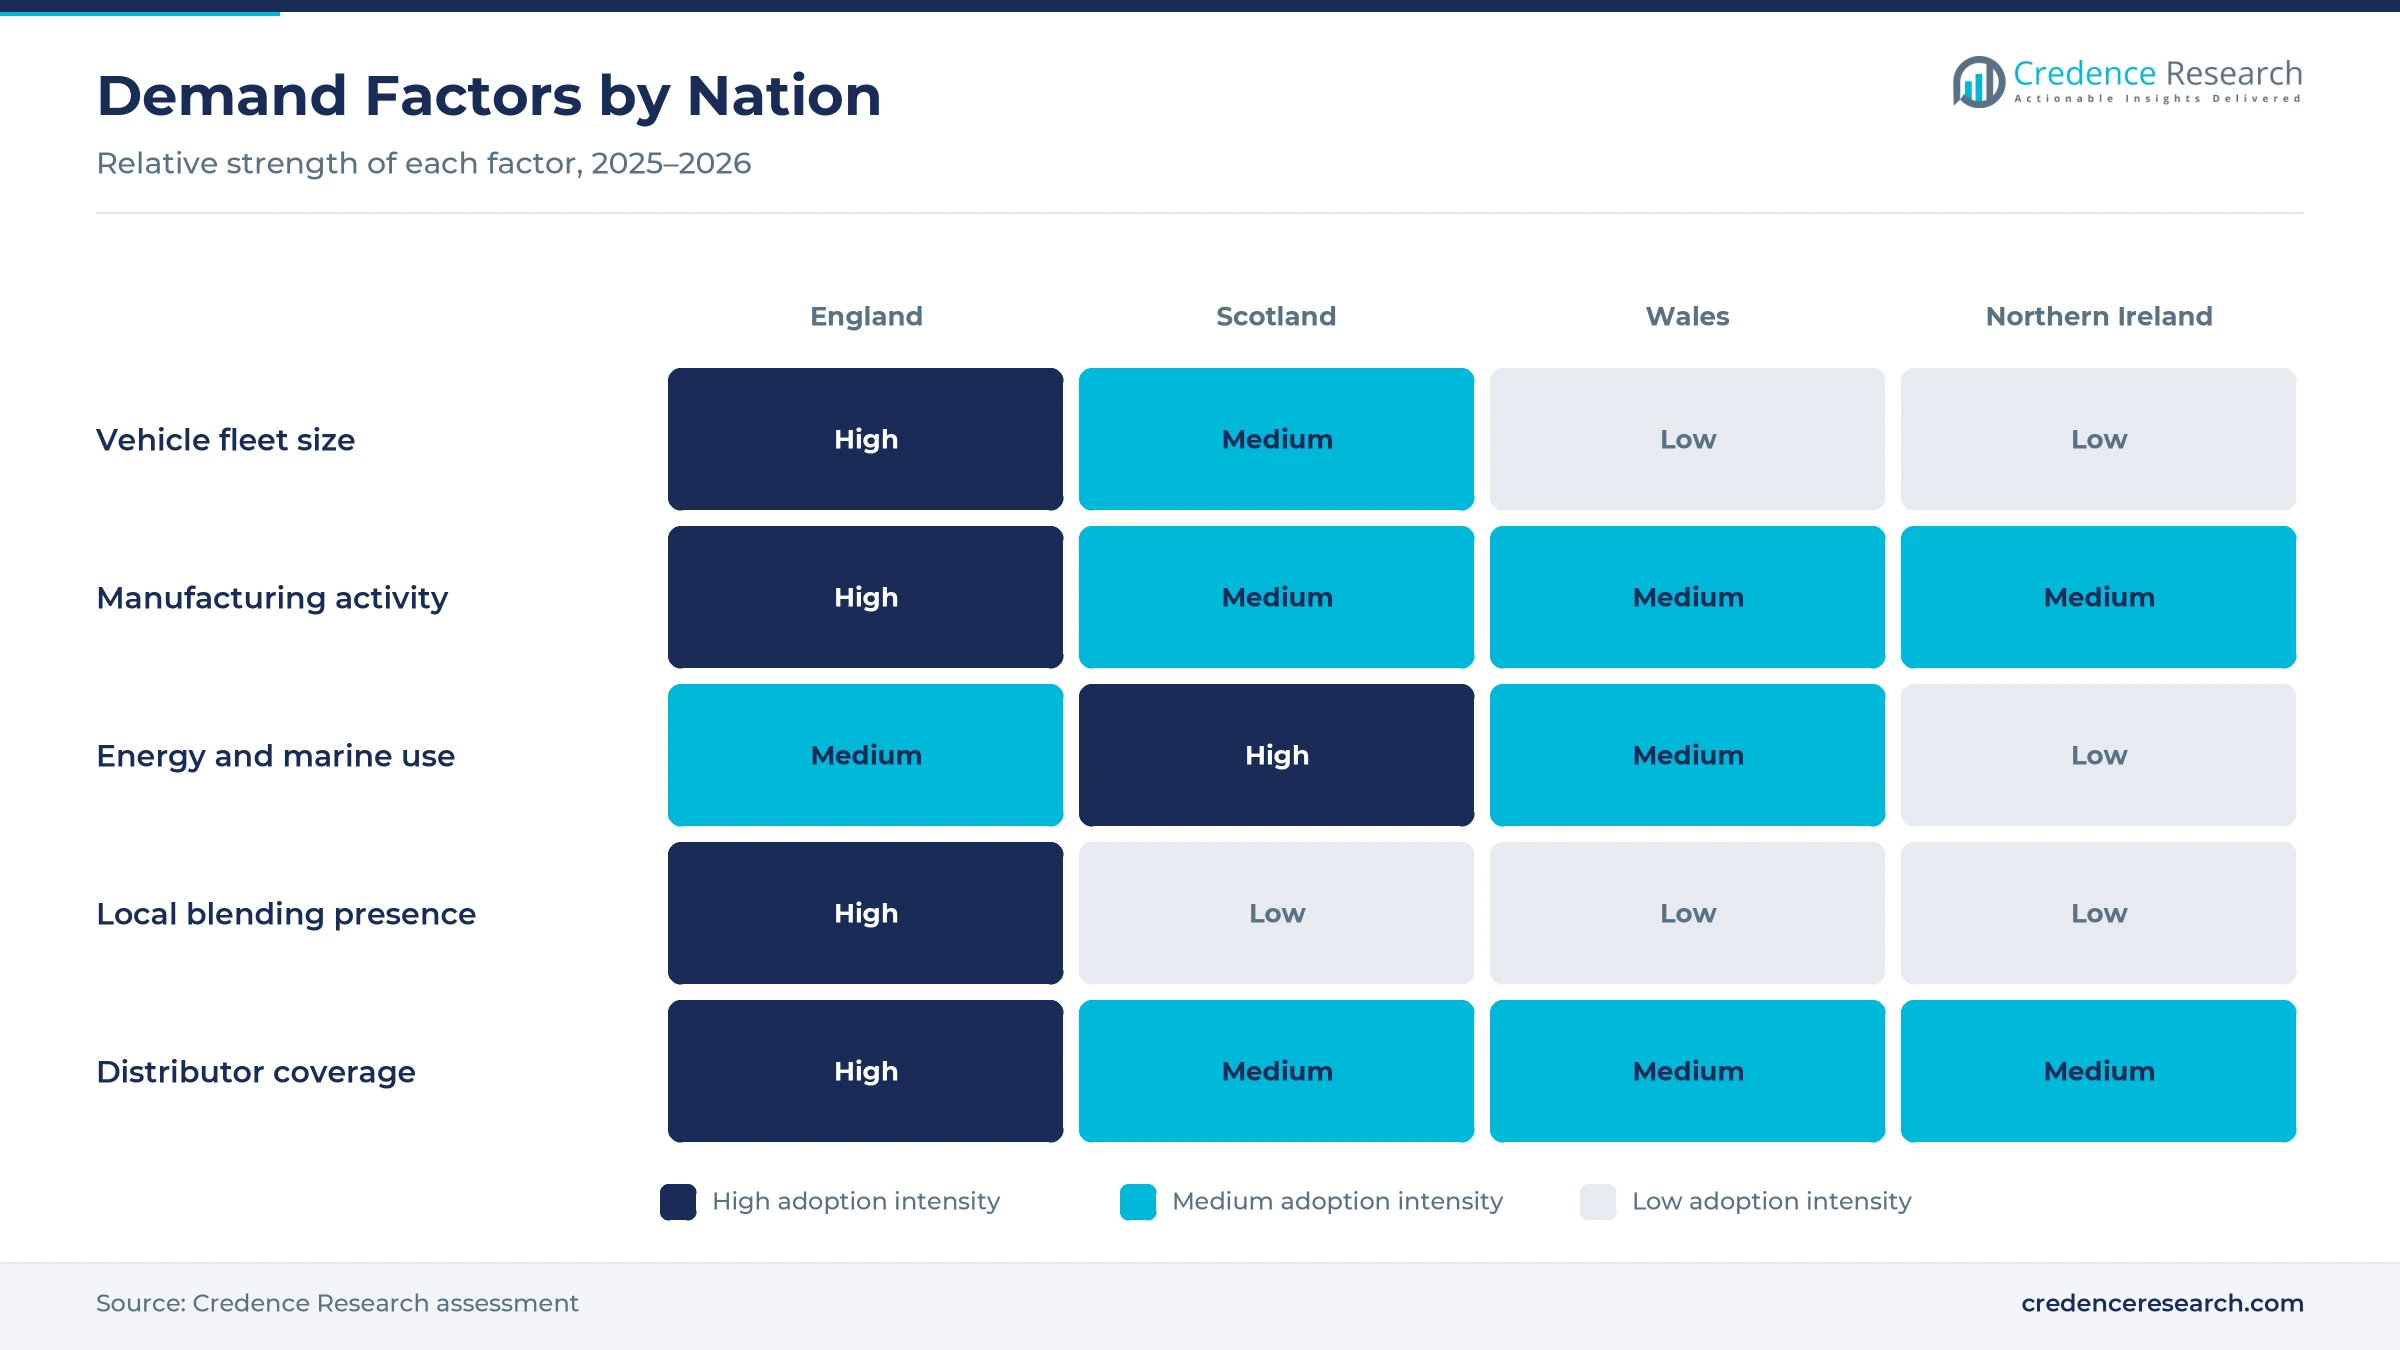
A large and aging vehicle fleet keeps oil sales steady, because older cars need more frequent servicing and top-ups between services. The UK vehicle parc reached a record 42,549,649 vehicles in 2025, up 1.4%, according to SMMT data reported by AM Online. Cars in use rose to 36,676,185, and the average car age reached 9.7 years. The share of cars more than 10 years old climbed to 45.7% in 2025 from 43.4% in 2024. The Department for Transport counted 42.3 million licensed vehicles at the end of 2025. As a result, engine oils hold 52.0% of 2025 value, while automotive and transport buyers hold 60.0%.
Why does advanced manufacturing support industrial demand?
Advanced manufacturing supports industrial demand, because machine tools, presses and production lines use hydraulic fluids, gear oils and metalworking fluids every shift. Manufacturing output rose 1.2% in August 2026, and 9 of 13 manufacturing subsectors grew in the month, according to the Office for National Statistics. In the three months to August 2026, computer, electronic and optical products rose 3.5%. However, UK vehicle production fell 15.5% to 764,715 units in 2025, which reduced first-fill volumes at car plants. In turn, factory buyers keep steady orders for hydraulic fluids and gear oils even when car plants slow.
How do premium grades and tighter specifications raise value?
Premium grades and tighter specifications raise value per liter, because modern engines, hybrids and industrial machines need approved formulations rather than generic oils. Hybrid electric cars took 13.9% of new registrations in 2025 and plug-in hybrids 11.1%, and both need low-viscosity oils for frequent stop-start running. The Verified Lubricant Specification scheme has examined more than 120 cases since 2013, with non-compliance with stated specifications the most common finding. FUCHS said on Feb. 17, 2026, that it added an eight-stage pouch filler and a Siemens execution system at its Stoke-on-Trent plant. As a result, full synthetic products hold 38.0% of 2025 value.
Why are blending and warehouse investments widening supply?
Blending and warehouse investments widen domestic supply, because local plants can respond faster to OEM approvals and distributor orders than importers. Exol Lubricants is redeveloping its Wednesbury site after a 5 million pound investment, which should raise capacity by about 40% to 50% when it completes in spring 2027. The company is also adding four blending vessels to the six at its Rotherham plant. Millers Oils reported on May 30, 2025, that it built a new warehouse and installed a robotic arm on its filling line. In turn, e-commerce and service networks grow at 4.56% a year as faster fulfillment reaches small garages.
Electric cars, spec checks and steel shifts reshape demand
How is the shift to electric cars changing fluid demand?
The shift to electric cars is changing fluid demand, because battery electric models skip engine oil but still need gear fluids, coolants, thermal fluids and greases. Battery electric cars reached 473,348 units, or 23.4% of new car registrations, in 2025, according to SMMT. That share stayed below the 28% zero-emission mandate target for the year. Licensed zero-emission vehicles reached 2,012,000 at the end of 2025, up 31.2%, according to the Department for Transport. Battery electric cars in use rose 34.7% to 1,797,809 during the same year. As a result, specialty fluids and greases grow at 4.09% a year while engine oil volumes slowly flatten.
Why is the rise of specification checks significant?
The rise of specification checks is significant, because fleets, dealers and insurers want proof that an oil meets the performance claimed on its label. The Verified Lubricant Specification scheme has examined more than 120 cases since its launch in 2013, and most involved products that did not meet stated specifications. Additive maker Lubrizol published a whitepaper on March 30, 2026, warning that self-declared suitable-for-use engine oils can hide unvalidated performance. OEM-approved oils, in contrast, pass engine tests set by vehicle makers before reaching the shelf. In turn, authorized distributors, which hold 32.0% of 2025 value, favor brands with full approval lists.
Can ownership changes open room for focused suppliers?
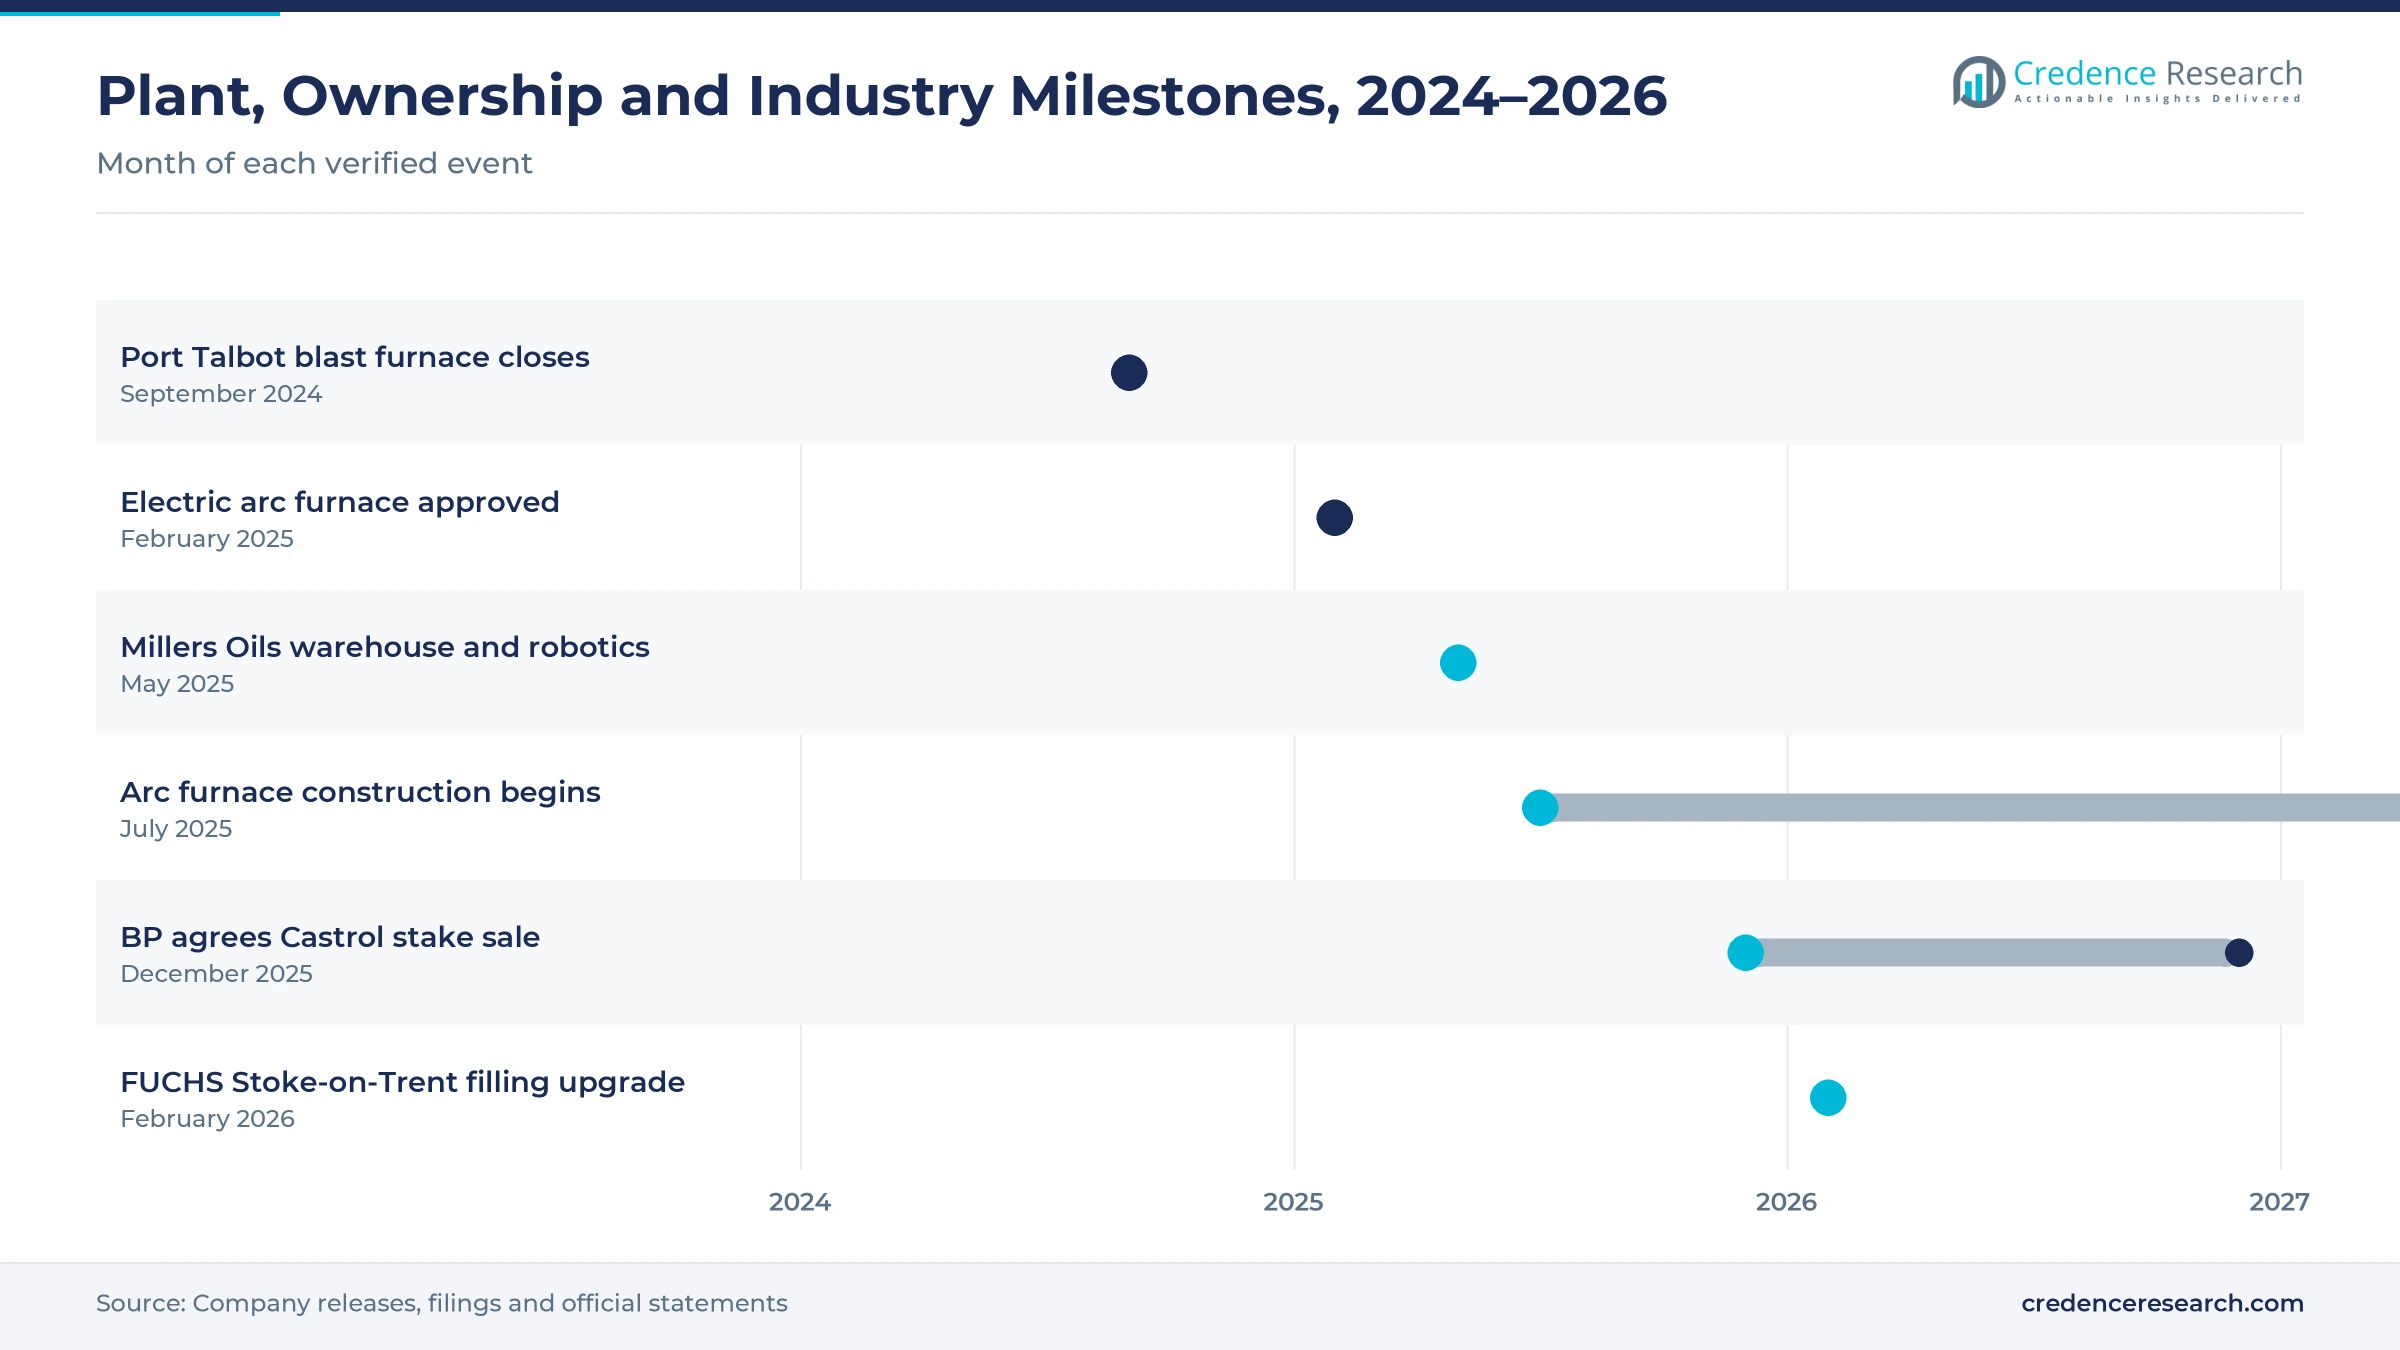
Ownership changes can open room for focused suppliers, because new owners often invest in brands, plants and distribution to grow value. BP agreed on Dec. 24, 2025, to sell a 65% stake in Castrol to infrastructure investor Stonepeak, keeping 35% through a joint venture, according to a filing with the U.S. Securities and Exchange Commission. The deal is expected to close by the end of 2026, subject to regulatory approvals. Exol Lubricants, formed in 1984, won a King's Award for International Trade in 2025. As a result, independent blenders can win contracts where buyers want flexible service, while direct OEM and industrial contracts grow at a steady pace.
Is the steel transition in Wales an opening for new fluids?
The steel transition in Wales offers an opening for new fluids, because electric arc furnaces, rolling mills and cranes need hydraulic oils, gear oils and greases. Blast furnace 4 at Port Talbot closed on Sept. 30, 2024, ending more than 100 years of primary steelmaking in the town. Neath Port Talbot council approved the electric arc furnace on Feb. 18, 2025, and construction began on July 14, 2025, with opening due by the end of 2027. The UK government gave the Tata Steel Transition Board 80 million pounds to support workers, suppliers and regeneration. In turn, Wales grows at 3.37% a year as new mill equipment comes online.
EV adoption, input costs and fake specs test suppliers
How does EV adoption cut engine oil volumes?
EV adoption cuts engine oil volumes, because battery electric cars never need an oil change during their service life. As a result, workshops that rely on oil service income see fewer visits from newer cars. Suppliers of mass-market mineral oils face the largest volume loss over the forecast. Many respond by adding e-fluids, thermal fluids and greases for electric drivetrains, and by moving customers to premium grades.
Why do base oil and additive costs squeeze margins?
Base oil and additive costs squeeze margins, because most inputs are imported and priced in U.S. dollars. In turn, a weaker pound or higher freight rates raise blending costs within weeks. Independent blenders feel this first, since they buy smaller volumes on shorter contracts. Suppliers respond with longer supply agreements, price indexation clauses in industrial contracts and tighter stock planning across plants.
How do misleading specification claims hurt buyers?
Misleading specification claims hurt buyers, because an oil that does not meet its label can damage engines, void warranties and raise repair costs. However, low-priced imports and online listings make checks harder for small garages and motorists. Fleets and workshops face the highest risk, since they buy large volumes on price. Industry bodies respond with verification schemes, sample testing and public case reports.
Why do weaker car plant volumes reduce first-fill demand?
Weaker car plant volumes reduce first-fill demand, because every new vehicle leaves the factory with engine oil, gear oil and greases already inside. As a result, lower production in 2025 cut orders from OEM plants. Commercial vehicle output fell the most after two plants were consolidated. Suppliers respond by targeting aftermarket service, export customers and industrial plants to keep blending lines busy.
England leads while Northern Ireland grows the fastest
| Region | Value, 2025 (USD billion) | Share, 2025 | CAGR, 2026–2035 |
|---|---|---|---|
| England | 2.85 | 84.0% | 3.17% |
| Scotland | 0.31 | 9.0% | 2.77% |
| Wales | 0.15 | 4.5% | 3.37% |
| Northern Ireland | 0.08 | 2.5% | 3.57% |
Why does England hold the largest share?
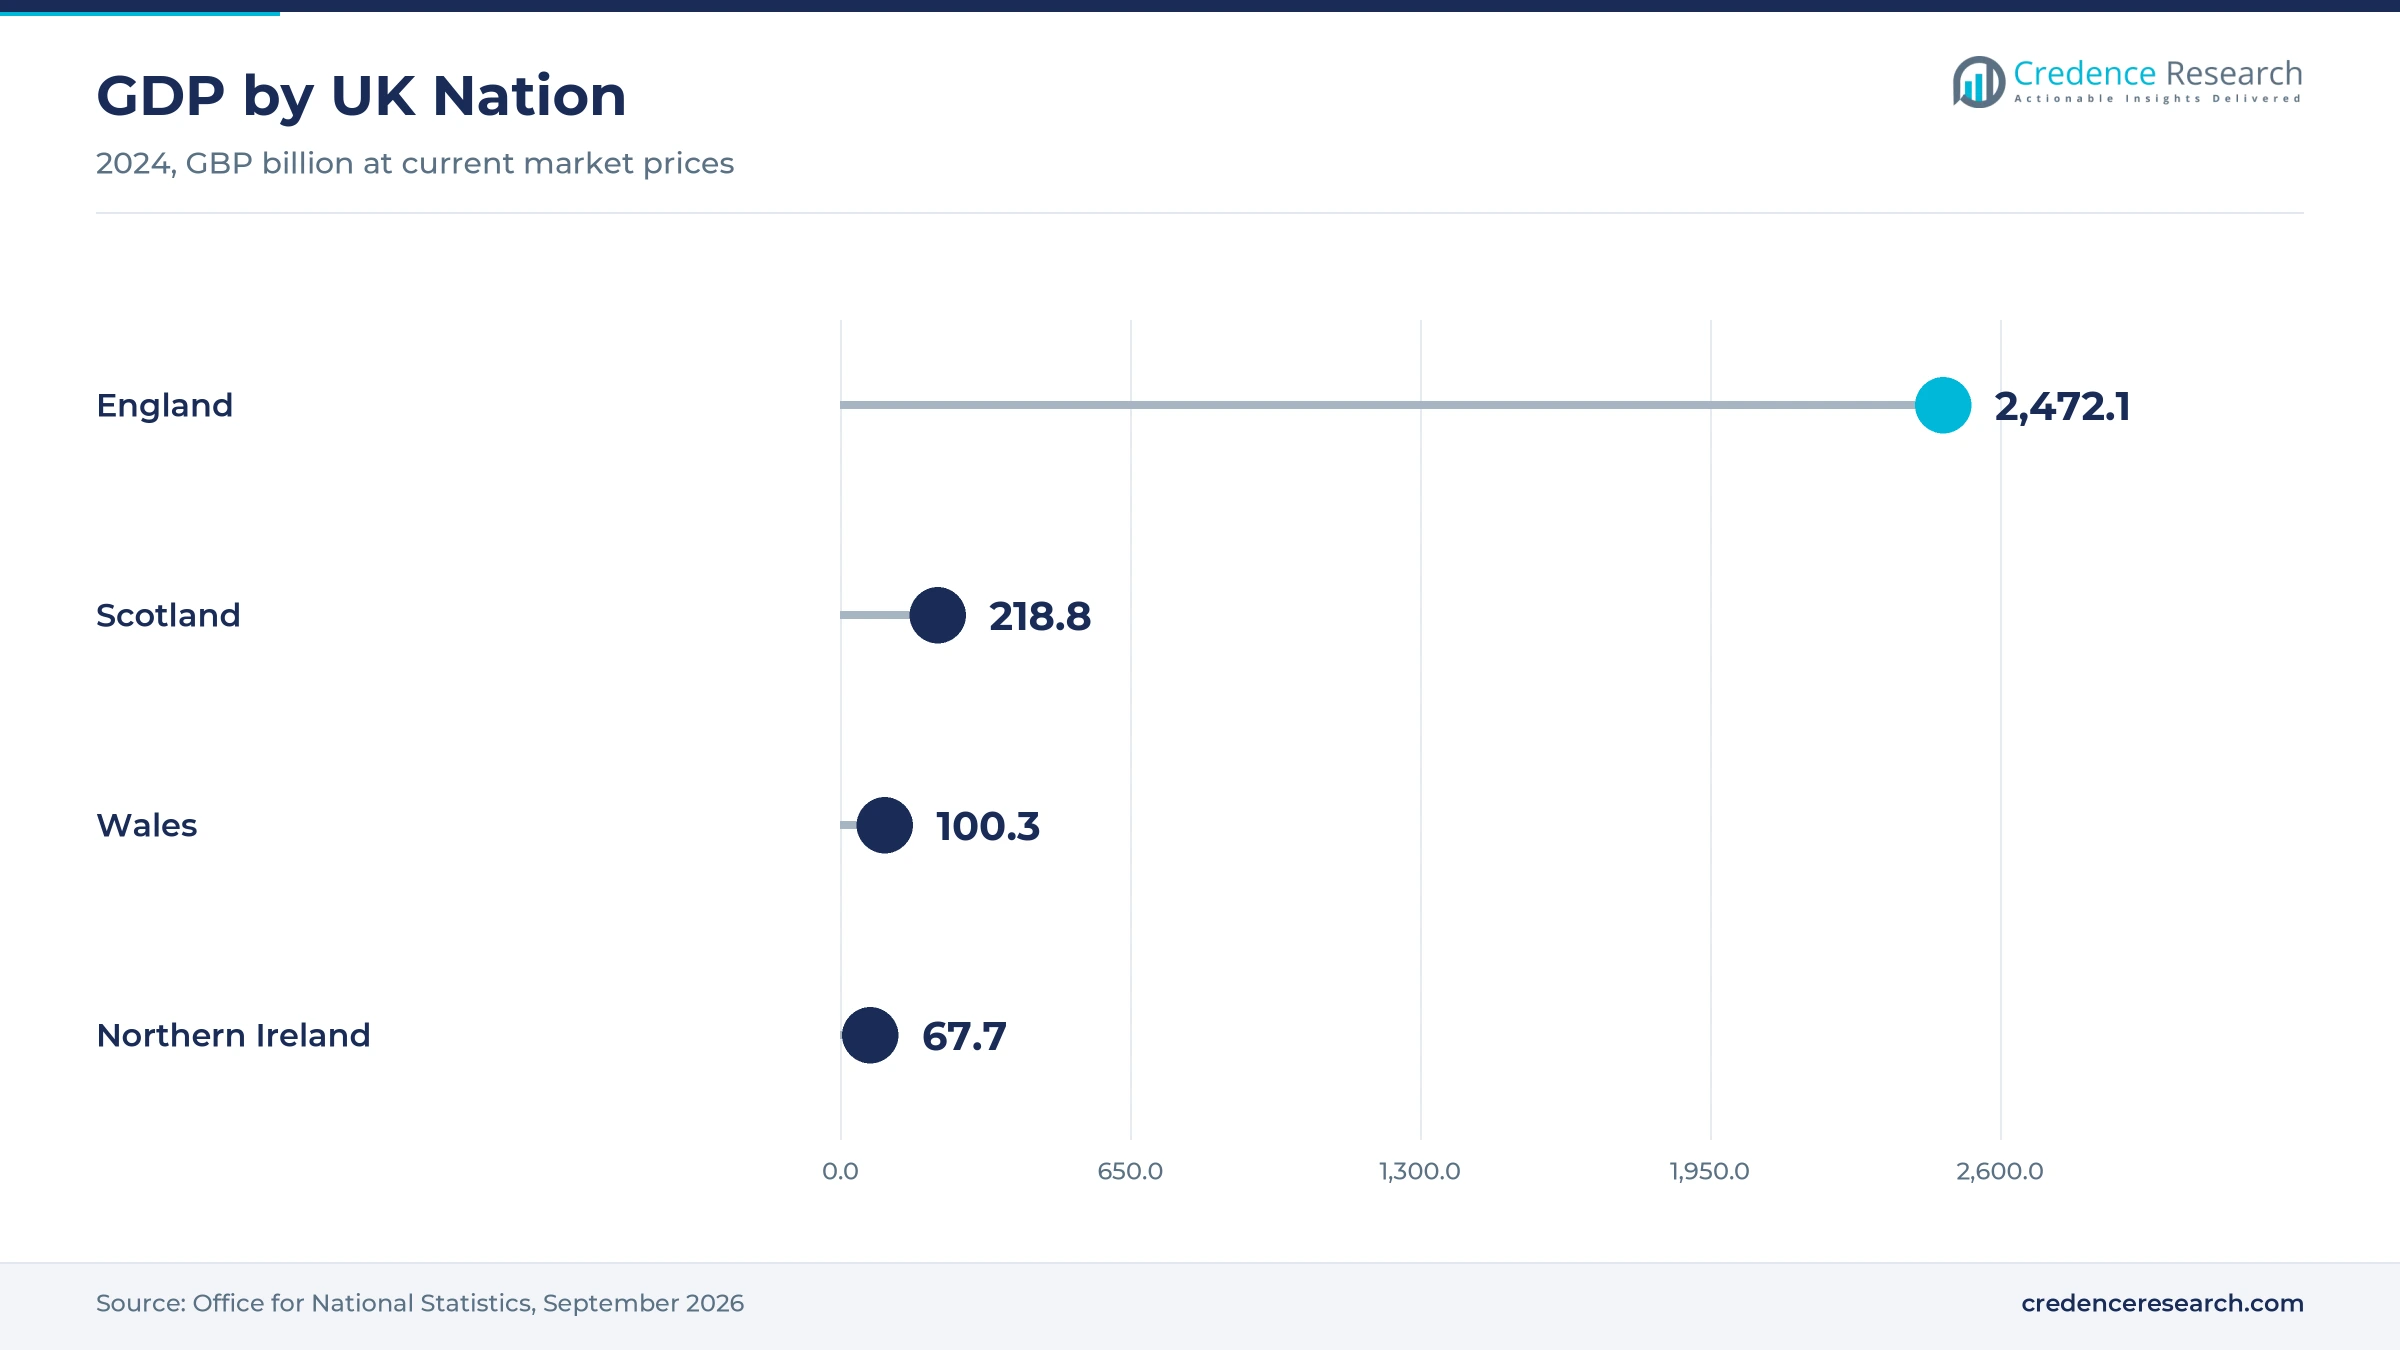
England held 84.0% of 2025 value and grows at 3.17% a year, because most vehicles, factories, warehouses and service networks sit in the Midlands, the North and the South East. England produced GBP 2,472.1 billion of GDP in 2024, according to national statistics. Exol Lubricants, FUCHS and Millers Oils all run blending or filling plants in England. As a result, England leads demand for both automotive and industrial grades.
How does Scotland rely on energy and marine buyers?
Scotland held 9.0% of 2025 value and grows at 2.77% a year, because offshore energy, shipping, distilling and forestry create demand for marine, turbine and hydraulic oils. Scotland produced GBP 218.8 billion of GDP in 2024, with real growth of 1.2%. However, mature North Sea fields reduce some offshore oil demand over time. In turn, offshore wind and port projects support specialty fluids and greases.
Why is Wales changing its industrial demand mix?
Wales held 4.5% of 2025 value and grows at 3.37% a year, because steel, manufacturing, farming and ports shape demand across the nation. Wales produced GBP 100.3 billion of GDP in 2024, with real growth of 0.5%. The closure of the last Port Talbot blast furnace cut some demand, while the electric arc furnace due by 2027 will need new equipment fluids. As a result, industrial buyers drive most of the growth across the nation.
How is Northern Ireland adding the fastest growth?
Northern Ireland held 2.5% of 2025 value and grows fastest at 3.57% a year, because food processing, engineering and freight to Great Britain and Ireland keep machines running. Northern Ireland produced GBP 67.7 billion of GDP in 2024, with real growth of 0.7%. Farm machinery and haulage fleets buy tractor fluids, base oil blends and heavy-duty engine oils. In turn, distributors expand delivery coverage across rural counties and market towns.
Plant, ownership and industry milestones since 2024
| Development | Status and market relevance |
|---|---|
| In September 2024, Tata Steel closed blast furnace 4 at Port Talbot, ending primary steelmaking in the town. | Shifts Welsh industrial fluid demand |
| In May 2025, Millers Oils reported a new warehouse, a larger labeling office and a robotic arm on its filling line. | Raises domestic packing capacity |
| In July 2025, construction began on the electric arc furnace at Port Talbot, due to open by the end of 2027. | Creates future demand for mill fluids |
| In December 2025, BP agreed to sell a 65% stake in Castrol to Stonepeak, keeping 35% through a joint venture. | Changes ownership of a leading brand |
| In February 2026, FUCHS added a pouch filler, a boom filler and a Siemens execution system at its Stoke-on-Trent plant. | Expands flexible filling capacity |
Synthetic bases, filling lines and oil analysis advance
- Synthetic base stocks give engine and gear oils stable viscosity over long drain intervals, which suits hybrids, fleets and high-load machines.
- Automated filling lines pack oils into pouches, drums and bulk containers with accurate fills, which speeds changeovers for distributors.
- E-fluids for electric drivetrains cool and protect motors, gears and bearings in battery electric cars, which opens a new product range.
- Oil condition monitoring tests used oil from fleets, wind turbines and factory machines, which helps operators plan changes and avoid breakdowns.
Need a Custom Version of This Report?
Tailor the scope, geography, or segments to your exact requirements.
- Custom geography or segment scope
- Direct access to our analyst team
Majors and independent blenders compete on approvals
Competition is led by integrated oil majors with OEM approvals and national distribution, alongside strong independent blenders. Castrol, Shell, ExxonMobil and TotalEnergies supply car makers, fleets and retailers with branded engine oils. BP agreed in December 2025 to sell a majority stake in Castrol to Stonepeak while keeping a minority holding. FUCHS runs a blending and filling plant in Stoke-on-Trent and invested in new filling equipment in 2026. Exol Lubricants blends in Rotherham and packs in Wednesbury, while Millers Oils expanded warehousing and automation in 2025. Morris Lubricants, Witham Group and Duckhams serve workshops, industrial users and classic car owners. Rivals compete on OEM approvals, technical service, distributor reach, delivery speed and synthetic product ranges.
Which suppliers shape UK oil and grease supply?
| Company | Type | Role in the market |
|---|---|---|
| Castrol | Oil major brand | Leading automotive brand, with a majority stake agreed for sale to Stonepeak in December 2025 |
| FUCHS Lubricants | Independent specialist | Runs a Stoke-on-Trent plant that added new filling equipment in 2026 |
| Exol Lubricants | Independent blender | Blends in Rotherham and is expanding its Wednesbury site to 2027 |
| Millers Oils | Independent blender | Added a warehouse and robotic filling in 2025 |
Credence Research view on oil and grease demand in Britain
Credence Research's view is that the UK market will grow slowly in volume but faster in value, as buyers move to synthetic, approved and specialty products. Engine oils remain the largest value pool, while specialty fluids, bio-based grades and online service channels add the fastest growth. The electric car shift will cut engine oil volumes over time, yet an older fleet slows that decline. Suppliers with OEM approvals, local blending and strong distributor networks should gain the most, while input costs keep pressure on margins.
How the national oil and grease estimate was built
The report uses 2025 as the base year on a calendar basis, and market values come from the Credence Research model. That model combines vehicle parc and registration data, vehicle licensing statistics, industrial production and regional output data, and company releases. Regional shares, segment splits and growth rates are Credence Research estimates. Sources used are official statistics, industry association data, company releases and filings and trade media, and no interviews or surveys were used.
Synthetics, industry and online service carry growth
The UK lubricant market is expected to reach USD 4.65 billion by 2035, a 3.15% CAGR during 2026–2035, as an older car fleet, steady factory output and premium grades support value. Growth should be strongest in specialty fluids and greases, bio-based products, e-commerce and service networks and Northern Ireland, because these areas gain most from new equipment, electric drivetrains and online buying. Electric cars will slowly reduce engine oil volumes, while specification checks will favor approved brands.
Frequently Asked Questions
How big is the UK lubricant market?
Which product type leads UK demand?
Which region leads the UK market?
How old is the UK car fleet?
How do electric cars affect the UK market?
Which technology grows fastest in the UK market?
Who are the leading companies in the UK market?
What are the main challenges for UK lubricant suppliers?
Table of Content
Chapter 1 Market Segmentation
- 1.1 Segmentation Framework
- 1.1.1 Product and Service Classification
- 1.1.2 Application and End-Use Classification
- 1.1.3 Technology and Solution Classification
- 1.1.4 Customer and Distribution Channel Classification
- 1.1.5 Geographic Segmentation
- 1.1.6 Market Segment Definitions and Boundaries
- 1.2 By Product Type
- 1.2.1 Engine Oils
- 1.2.2 Hydraulic Fluids
- 1.2.3 Gear Oils
- 1.2.4 Specialty Fluids & Greases
- 1.3 By End-Use Industry
- 1.3.1 Automotive & Transport
- 1.3.2 Manufacturing
- 1.3.3 Construction & Mining
- 1.3.4 Power & Marine
- 1.4 By Sales Channel
- 1.4.1 Direct OEM/Industrial Contracts
- 1.4.2 Authorized Distributors
- 1.4.3 Automotive Aftermarket Retail
- 1.4.4 E-Commerce & Service Networks
- 1.5 By Technology
- 1.5.1 Mineral-Based
- 1.5.2 Semi-Synthetic
- 1.5.3 Full Synthetic
- 1.5.4 Bio-Based
Chapter 2 Introduction
- 2.1 Report Objectives and Scope
- 2.2 Product Definition and Industry Terminology
- 2.3 Market Inclusions and Exclusions
- 2.4 Research Process
- 2.4.1 Primary Research and Expert Interviews
- 2.4.2 Secondary Research and Source Review
- 2.4.3 Top-Down and Bottom-Up Estimation
- 2.4.4 Data Triangulation and Verification
- 2.5 Market Size Measurement Basis
- 2.5.1 2025: USD 3.39 billion → 2035: USD 4.65 billion
- 2.6 Historical and Forecast Reference Periods
- 2.6.1 Historical Period: 2018-2025
- 2.6.2 Base Year: 2025
- 2.6.3 Forecast Period: 2025-2035
- 2.7 Research Assumptions and Limitations
Chapter 3 Executive Summary
- 3.1 Market Snapshot and Key Findings
- 3.2 Base-Year Market Size, 2025
- 3.3 Forecast Market Size, 2035
- 3.4 Revenue and Volume Growth Outlook
- 3.5 Key Demand and Supply Indicators
- 3.6 Leading Market Segments
- 3.7 Fastest-Growing Market Opportunities
- 3.8 Regional Performance Highlights
- 3.9 Technology and Industry Transformation
- 3.10 Competitive Landscape Summary
- 3.11 Analyst View and Strategic Implications
Chapter 4 UK Lubricant Market Trends and Developments
- 4.1 Historical Industry Development, 2018-2025
- 4.2 Recent Market Trends and Developments
- 4.3 Demand and Customer Behavior Trends
- 4.4 Technology and Product Innovation
- 4.5 Artificial Intelligence, Automation and Digitalization
- 4.6 Local Manufacturing and Supply Chain Realignment
- 4.7 Industry Partnerships, Mergers and Acquisitions
- 4.8 Sustainability and Circular Economy Developments
- 4.9 Government and Private Sector Investment Trends
- 4.10 Emerging Business Models and Commercialization
- 4.11 Industry Developments and Announcements
Chapter 5 UK Lubricant Market Production, Supply and Demand Analysis
- 5.1 Demand Trend and Consumption Analysis, 2018-2025
- 5.2 Demand Forecast, 2025-2035
- 5.3 Production and Output Trend, 2018-2025
- 5.4 Production and Output Forecast, 2025-2035
- 5.5 Installed Capacity and Capacity Utilization
- 5.6 Company-Wise Production Plants and Statistics
- 5.6.1 Installed Production Capacity
- 5.6.2 Actual Production
- 5.6.3 Planned Capacity and Expansion Targets
- 5.7 Supply Chain Structure and Procurement Trends
- 5.8 Supply-Demand Gap and Bottlenecks
- 5.9 Import Dependence and Sourcing Structure
- 5.10 Contract Manufacturing and Outsourcing
- 5.11 Regional Supply and Demand Concentration
Chapter 6 UK Lubricant Market Pricing Analysis
- 6.1 Pricing Structure and Measurement
- 6.2 Historical Pricing Trends, 2018-2025
- 6.3 Pricing Outlook, 2025-2035
- 6.4 Average Selling Price and Unit Economics
- 6.5 Pricing by Product and Market Segment
- 6.6 Geographic Pricing Differences
- 6.7 Key Input, Energy, Labor and Logistics Costs
- 6.8 Contract Pricing and Purchasing Models
- 6.9 Pricing Sensitivity and Competitive Positioning
- 6.10 Price, Margin and Profitability Implications
Chapter 7 UK Lubricant Market Dynamics
- 7.1 Market Growth Drivers
- 7.1.1 Demand-Side Drivers
- 7.1.2 Technology and Innovation Drivers
- 7.1.3 Infrastructure and Investment Drivers
- 7.1.4 Regulatory and Policy Drivers
- 7.2 Market Restraints
- 7.2.1 Cost and Affordability Constraints
- 7.2.2 Technology and Adoption Barriers
- 7.2.3 Supply Chain and Operational Constraints
- 7.3 Market Challenges
- 7.3.1 Competitive Pressure and Margin Erosion
- 7.3.2 Skills, Infrastructure and Implementation Gaps
- 7.4 Emerging Market Opportunities
- 7.5 Market Dynamics Impact and Time-Horizon Assessment
Chapter 8 UK Lubricant Value Chain Analysis
- 8.1 Industry Value Chain Overview
- 8.2 Upstream Suppliers and Critical Inputs
- 8.3 Technology and Component Providers
- 8.4 Manufacturing or Service Delivery
- 8.5 Distribution, Channel Partners and Integrators
- 8.6 Downstream Applications and End Users
- 8.7 Value Addition and Profit Pools
- 8.8 Vertical Integration and Outsourcing
- 8.9 Supplier Concentration and Risk
- 8.10 Supply Chain Localization and Resilience
Chapter 9 UK Lubricant Market Regulations and Policies
- 9.1 Relevant Laws, Standards and Compliance Frameworks
- 9.2 Product, Service, Safety and Quality Requirements
- 9.3 Government Policies, Incentives and Subsidies
- 9.4 Imports, Exports and Trade Barriers
- 9.5 Public Procurement and Local Content Requirements
- 9.6 Environmental and Sustainability Compliance
- 9.7 Upcoming Policy Changes and Market Implications
Chapter 10 UK Lubricant Market Hotspots and Opportunities
- 10.1 Market Opportunity Mapping and Growth Hotspots
- 10.2 High-Growth Applications and Customer Groups
- 10.3 Underserved Markets and White-Space Opportunities
- 10.4 Emerging Technology and Product Opportunities
- 10.5 New Capacity and Investment Hotspots
- 10.6 Market Entry and Expansion Opportunities
- 10.7 Distribution and Partnership Opportunities
- 10.8 Near-Term and Long-Term Commercial Potential
- 10.9 Opportunity Attractiveness and Execution Risks
Chapter 11 UK Lubricant Market Outlook, 2025-2035
- 11.1 Market Size and Analysis
- 11.1.1 Revenue (Market Measurement: 2025: USD 3.39 billion → 2035: USD 4.65 billion)
- 11.1.2 Market Volume and Quantity Sold
- 11.1.3 Historical Market Size, 2018-2025
- 11.1.4 Base-Year Market Size, 2025
- 11.2 Market Forecast, 2025-2035
- 11.2.1 Revenue Forecast to 2035
- 11.2.2 Volume Forecast to 2035
- 11.2.3 CAGR and Year-on-Year Growth
- 11.2.4 Incremental Revenue Opportunity
- 11.3 Forecast Assumptions and Scenario Analysis
- 11.3.1 Base-Case Forecast
- 11.3.2 Optimistic and Conservative Scenarios
- 11.3.3 Technology, Pricing and Policy Sensitivities
- 11.4 Market Attractiveness and Growth Outlook
Chapter 12 UK Lubricant Market Segmentation and Outlook
- 12.1 Segmentation Summary and Market Shares, 2025
- 12.2 Largest and Fastest-Growing Segments
- 12.3 By Product Type - Market Size and Forecast, 2025-2035
- 12.3.1 Segment Definition and Scope
- 12.3.2 Historical Market Size, 2018-2025
- 12.3.3 Revenue Forecast, 2025-2035
- 12.3.4 Volume Forecast, 2025-2035
- 12.3.5 Base-Year Market Share, 2025
- 12.3.6 Segment CAGR and Growth Drivers
- 12.3.7 Subsegment Market Size and Forecast
- 12.3.7.1 Engine Oils
- 12.3.7.2 Hydraulic Fluids
- 12.3.7.3 Gear Oils
- 12.3.7.4 Specialty Fluids & Greases
- 12.3.8 Subsegment Pricing and Adoption Trends
- 12.3.9 Leading Suppliers and Competition
- 12.3.10 Regional Demand and Opportunities
- 12.4 By End-Use Industry - Market Size and Forecast, 2025-2035
- 12.4.1 Segment Definition and Scope
- 12.4.2 Historical Market Size, 2018-2025
- 12.4.3 Revenue Forecast, 2025-2035
- 12.4.4 Volume Forecast, 2025-2035
- 12.4.5 Base-Year Market Share, 2025
- 12.4.6 Segment CAGR and Growth Drivers
- 12.4.7 Subsegment Market Size and Forecast
- 12.4.7.1 Automotive & Transport
- 12.4.7.2 Manufacturing
- 12.4.7.3 Construction & Mining
- 12.4.7.4 Power & Marine
- 12.4.8 Subsegment Pricing and Adoption Trends
- 12.4.9 Leading Suppliers and Competition
- 12.4.10 Regional Demand and Opportunities
- 12.5 By Sales Channel - Market Size and Forecast, 2025-2035
- 12.5.1 Segment Definition and Scope
- 12.5.2 Historical Market Size, 2018-2025
- 12.5.3 Revenue Forecast, 2025-2035
- 12.5.4 Volume Forecast, 2025-2035
- 12.5.5 Base-Year Market Share, 2025
- 12.5.6 Segment CAGR and Growth Drivers
- 12.5.7 Subsegment Market Size and Forecast
- 12.5.7.1 Direct OEM/Industrial Contracts
- 12.5.7.2 Authorized Distributors
- 12.5.7.3 Automotive Aftermarket Retail
- 12.5.7.4 E-Commerce & Service Networks
- 12.5.8 Subsegment Pricing and Adoption Trends
- 12.5.9 Leading Suppliers and Competition
- 12.5.10 Regional Demand and Opportunities
- 12.6 By Technology - Market Size and Forecast, 2025-2035
- 12.6.1 Segment Definition and Scope
- 12.6.2 Historical Market Size, 2018-2025
- 12.6.3 Revenue Forecast, 2025-2035
- 12.6.4 Volume Forecast, 2025-2035
- 12.6.5 Base-Year Market Share, 2025
- 12.6.6 Segment CAGR and Growth Drivers
- 12.6.7 Subsegment Market Size and Forecast
- 12.6.7.1 Mineral-Based
- 12.6.7.2 Semi-Synthetic
- 12.6.7.3 Full Synthetic
- 12.6.7.4 Bio-Based
- 12.6.8 Subsegment Pricing and Adoption Trends
- 12.6.9 Leading Suppliers and Competition
- 12.6.10 Regional Demand and Opportunities
- 12.7 Segment Growth Comparison
- 12.8 Segment Attractiveness and Priority Matrix
Chapter 13 UK Lubricant End-Use and Application Market Outlook
- 13.1 End-Use Industry and Customer Demand Structure
- 13.2 Leading Applications and Customer Groups
- 13.3 End-Use Market Size, Share and Forecast
- 13.4 Major End-Use Industry Deep Dives
- 13.4.1 Customer Requirements and Use Cases
- 13.4.2 Demand and Replacement Cycles
- 13.4.3 Technical and Regulatory Considerations
- 13.4.4 Purchasing and Procurement Models
- 13.4.5 Leading Vendors and Distribution Channels
- 13.4.6 Forecast and Commercial Opportunities
- 13.5 Emerging Applications and Cross-Segment Demand
- 13.6 End-Use Industry Investment Priorities
Chapter 14 UK Lubricant Geographic Market Outlook, 2025-2035
- 14.1 Domestic Market Distribution and Demand Clusters
- 14.2 State- or Province-Wise Market Size and Forecast, 2025-2035
- 14.3 City and Metropolitan Market Outlook
- 14.4 Industrial, Manufacturing and Commercial Clusters
- 14.5 Geographic Concentration of Key End Users
- 14.6 Local Pricing and Purchasing Differences
- 14.7 Domestic Production Facilities and Capacity Map
- 14.8 Local Infrastructure and Project Pipeline
- 14.9 State-Level Policy and Incentive Differences
- 14.10 Subnational Investment Hotspots and Opportunities
- 14.11 Distribution and Logistics Networks
- 14.12 Domestic Competitive Footprint
Chapter 15 UK Lubricant Technology, Innovation and Sustainability Outlook
- 15.1 Technology Landscape and Maturity
- 15.2 Product, Process and Service Innovation
- 15.3 AI, Automation and Digital Tools in the Industry
- 15.4 Technology Adoption and Performance Benchmarking
- 15.5 Innovation Pipeline and R&D Investment
- 15.6 Patent and Intellectual Property Trends
- 15.7 Energy Efficiency and Resource Management
- 15.8 Sustainability, Recycling and Circularity
- 15.9 Technology Roadmap, 2025-2035
- 15.10 Risks of Obsolescence and Technology Substitution
Chapter 16 UK Lubricant Market Key Strategic Imperatives
- 16.1 Growth and Market Entry Priorities
- 16.2 High-Return Products and Segments
- 16.3 Pricing, Profitability and Cost Optimization
- 16.4 Technology Investment and Product Differentiation
- 16.5 Supply Chain Localization and Resilience
- 16.6 Distribution and Customer Acquisition
- 16.7 Partnership, Acquisition and Capacity Strategy
- 16.8 Regional Expansion Priorities
- 16.9 Short-, Medium- and Long-Term Actions
Chapter 17 Competition Outlook
- 17.1 Industry Competition Characteristics
- 17.2 Market Structure and Concentration
- 17.3 Market Share and Competitive Positioning, 2025
- 17.4 Company-Wise Revenue and Product Benchmarking
- 17.5 Production and Service Capacity Benchmarking
- 17.6 Technology, Pricing and Differentiation
- 17.7 Regional Footprint and Distribution Strength
- 17.8 Mergers, Acquisitions and Strategic Alliances
- 17.9 New Entrants and Competitive Threats
- 17.10 Porter's Five Forces and Industry Attractiveness
- 17.11 Competitive Outlook, 2025-2035
Chapter 18 Company Profiles
- 18.1 Company Coverage and Selection Criteria
- 18.2 Castrol
- 18.2.1 Business Description
- 18.2.2 Company Ownership and Geographic Presence
- 18.2.3 Product and Service Portfolio
- 18.2.4 Manufacturing and Operating Footprint
- 18.2.5 Production Capacity and Expansion Plans
- 18.2.6 Financial Performance and Investment
- 18.2.7 Market Share and Competitive Position
- 18.2.8 Technology and Innovation Capabilities
- 18.2.9 Strategic Alliances or Partnerships
- 18.2.10 Recent Developments
- 18.2.11 Growth Strategy and Outlook
- 18.3 Shell
- 18.4 ExxonMobil
- 18.5 TotalEnergies
- 18.6 FUCHS Lubricants
- 18.7 Exol Lubricants
- 18.8 Morris Lubricants
- 18.9 Millers Oils
- 18.10 Witham Group
- 18.11 Duckhams
- 18.12 Other Relevant Market Participants
Note: Every listed company is profiled on the structure shown under the first company. The company list is preliminary and may change based on research findings, market developments, data availability and client requirements.
Chapter 19 Disclaimer
- 19.1 Research and Forecast Disclaimer
- 19.2 Data Source and Estimation Limitations
Note: The depth of individual sections depends on data availability for this market. Volume, capacity, trade and other unit-based metrics are included where applicable.

