
Gold plants and water utilities anchor national demand
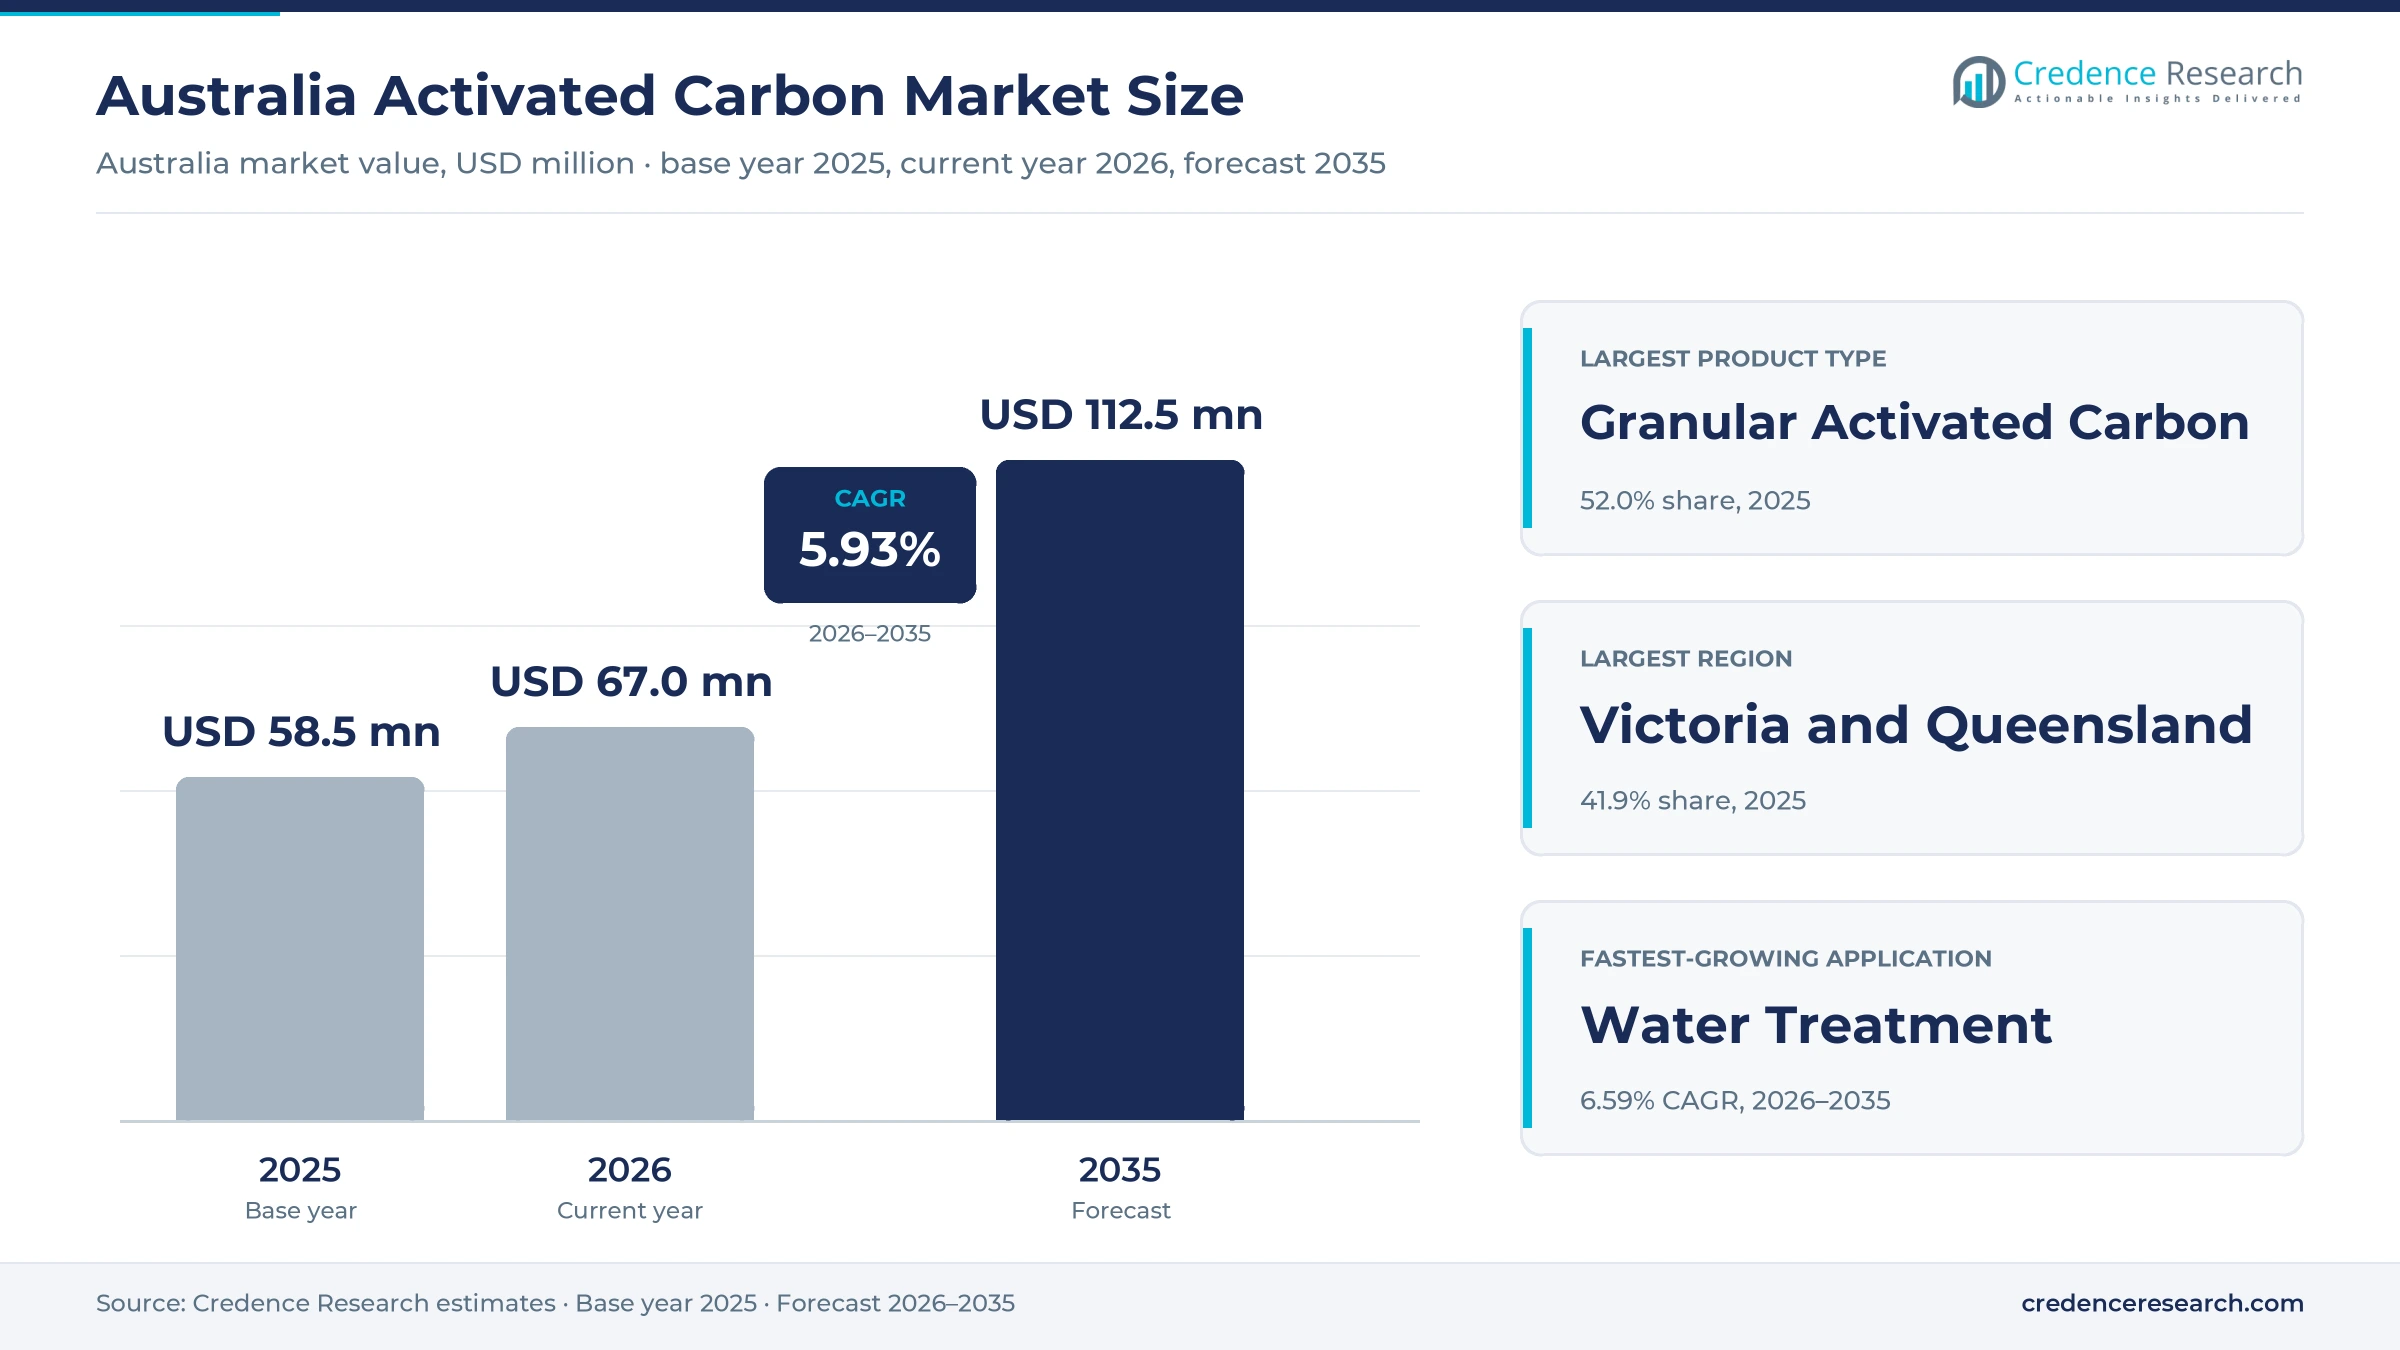
The Australia activated carbon market was valued at USD 58.5 million in 2025 and is projected to increase from USD 67.0 million in 2026 to USD 112.5 million by 2035, registering a CAGR of 5.93% during 2026–2035. Demand comes from gold processing plants that load carbon-in-leach circuits, water utilities that dose powder or run granular filters, and wineries, food plants and industrial sites that purify liquids and air. Victoria and Queensland held the largest regional share, 41.9% in 2025, because the two states combine the largest population with major utilities such as Seqwater. Western Australia is the fastest-growing region at 6.39% a year, as goldfield plants replace carbon lost through attrition and reactivation. At the same time, the June 2025 drinking water guideline update has made long-chain PFAS removal a planning priority for utilities across the country.
Which carbon grades, buyers and services does the estimate cover?
The estimate measures the value of granular, powdered, pelletised and bead activated carbon sold to buyers in Australia, whether made locally or imported. It counts carbon used for gold recovery, drinking water and wastewater treatment, food and beverage purification, and air and specialty purification, including reactivated carbon returned to service.
The estimate excludes charcoal and coal sold as fuel, filter coal and anthracite media, and the value of vessels, contactors and dosing equipment. The value chain runs from coconut shell, coal and wood precursors through steam or chemical activation, sizing and impregnation to distribution, changeout and thermal reactivation of spent carbon.
Australia Activated Carbon Market Insights
- The Australia activated carbon market was valued at USD 58.5 million in 2025 and is projected to reach USD 112.5 million by 2035, registering a CAGR of 5.93% during 2026–2035.
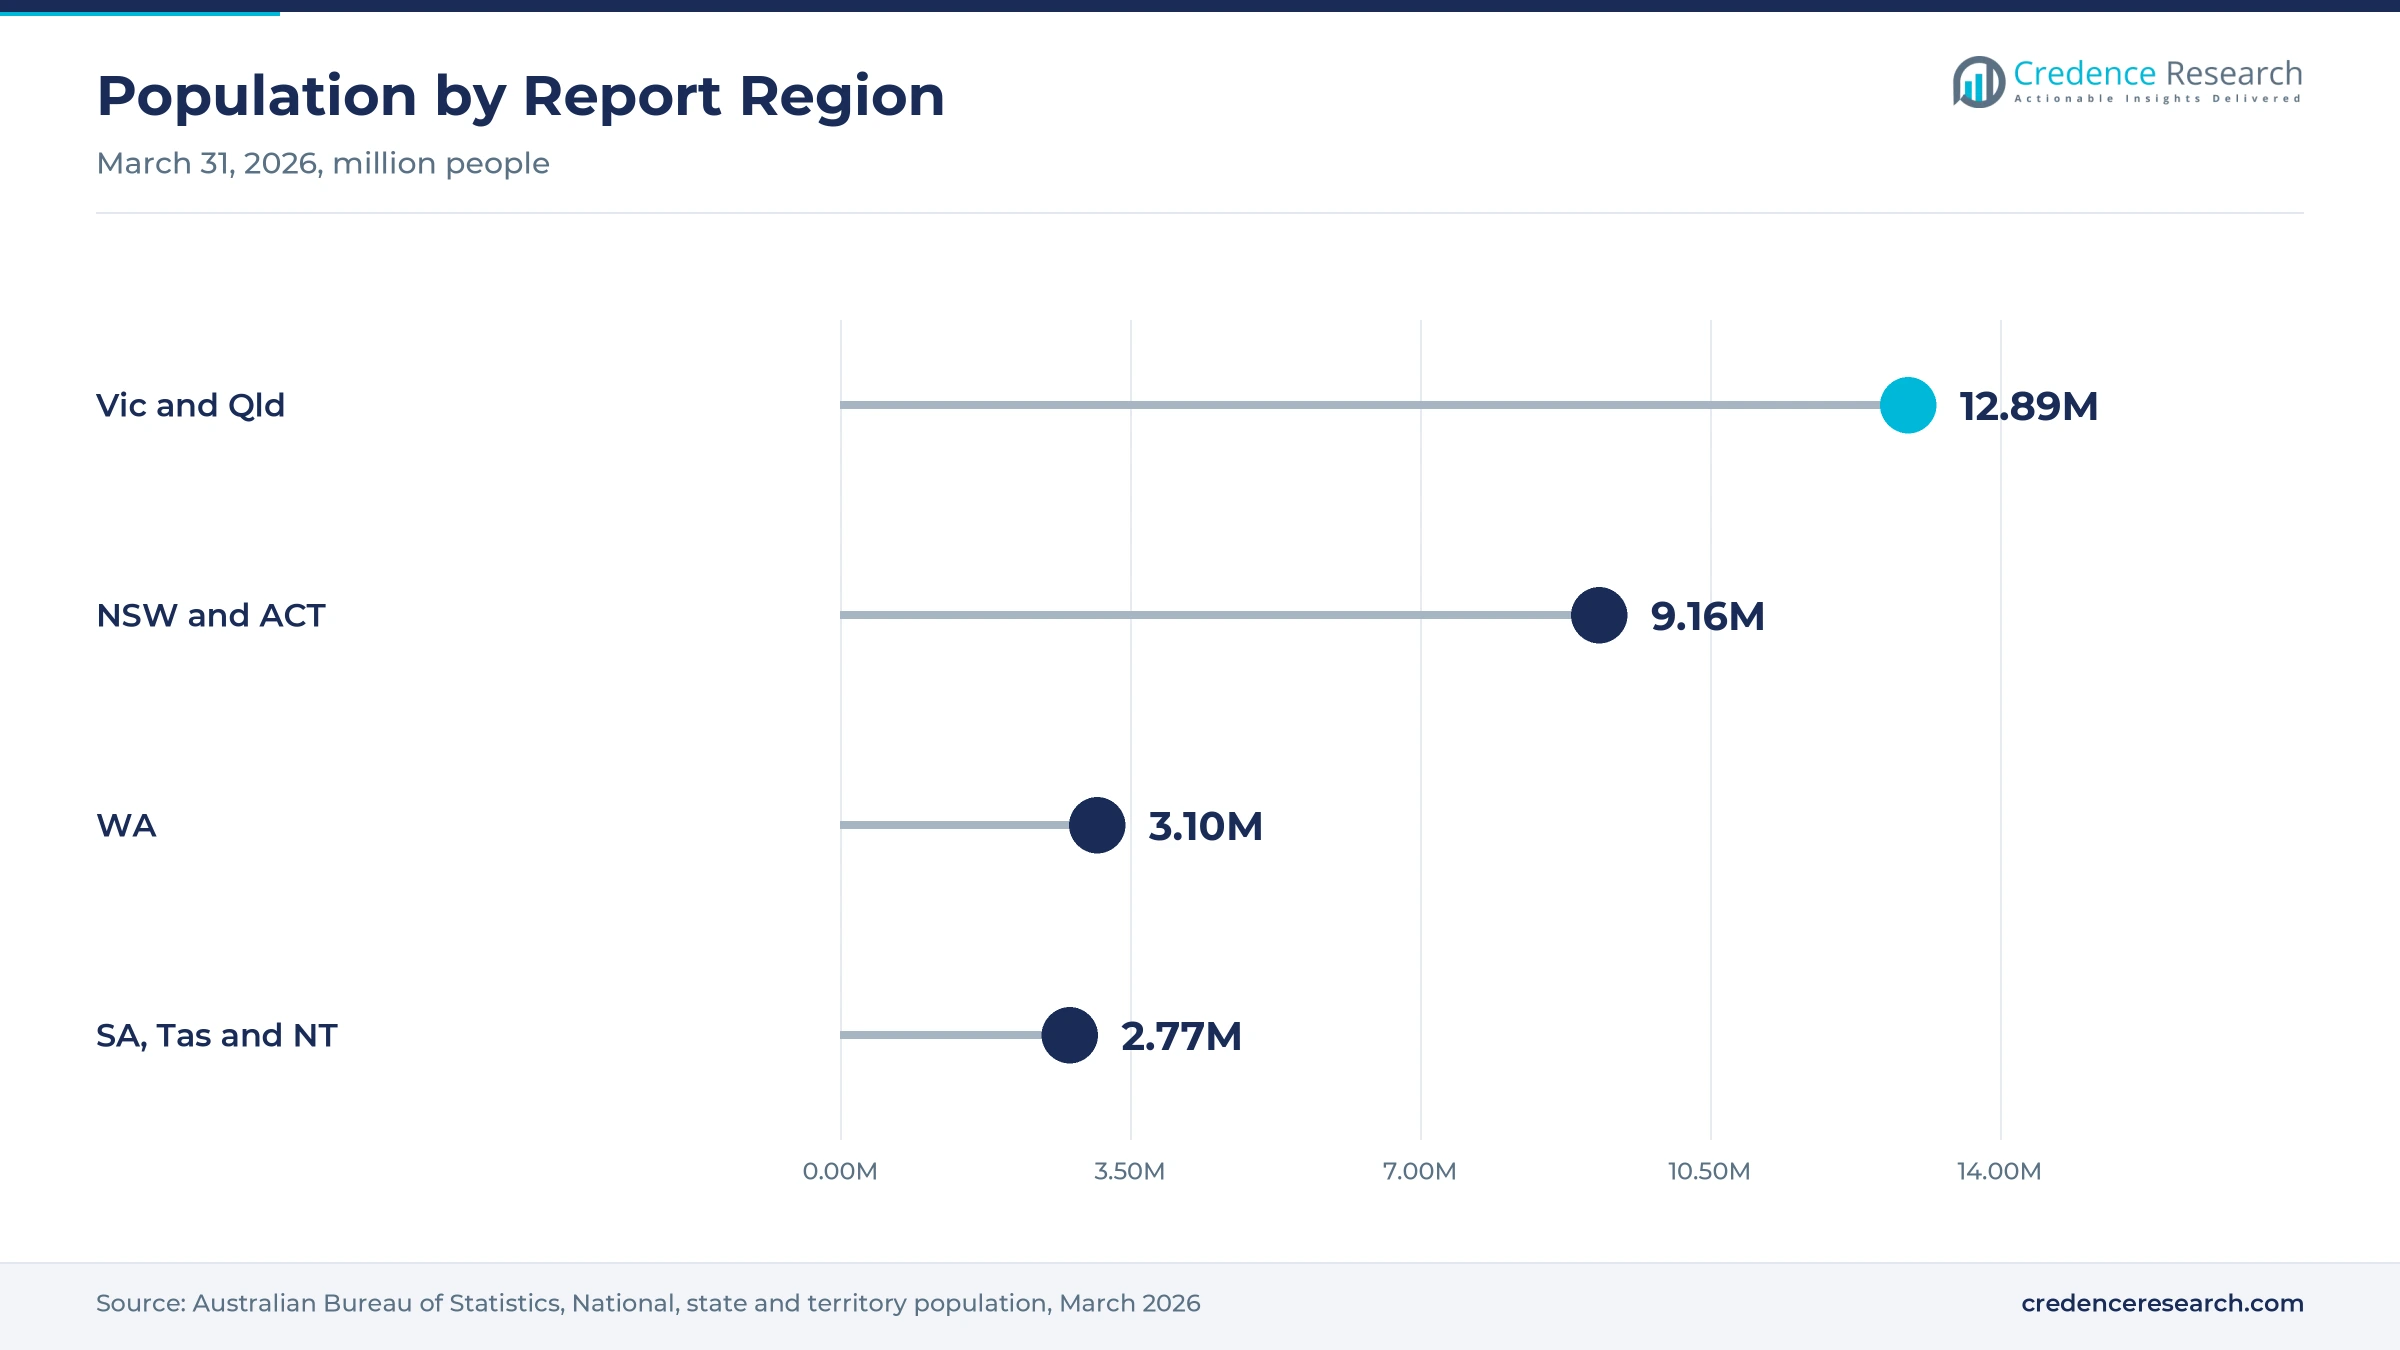
- Victoria and Queensland held a 41.9% share of 2025 value, because the two states hold about 12.9 million people and large utility networks.
- Gold recovery led with a 41.0% share of 2025 value, because carbon-in-leach circuits need steady top-ups as the carbon wears down.
- The national health research council set a PFOS guideline value of eight nanograms per liter on June 25, 2025, which pushed utilities toward granular filters.
- Integrated treatment procurement grows fastest at 6.74% a year, as utilities and remediation buyers order carbon inside bundled PFAS treatment contracts during 2026–2035.
Granular grades lead as PFAS filters lift utility orders
Why does granular activated carbon hold the largest value?
Based on product type, the market is categorized into granular activated carbon, powdered activated carbon, pelletised activated carbon and bead activated carbon. Granular Activated Carbon led with a 52.0% share of 2025 value, because gold circuits and fixed-bed water filters both use hard granules that survive repeated handling. The same grade also grows fastest at 6.28% a year, as utilities add PFAS filters.
How does coconut shell supply shape grade choice?
Based on raw material, the market is categorized into coconut shell, coal, wood and non-wood biomass and synthetic precursors. Coconut Shell led with a 48.0% share of 2025 value, because hard, micro-porous shell carbon resists abrasion in gold plants. Non-Wood Biomass and Synthetic Precursors grow fastest at 6.88% a year, as local startups convert nut shells, straw and wine waste into carbon.
Why do gold plants buy the most carbon?
Based on application, the market is categorized into gold recovery, water treatment, food and beverage purification, and air and specialty purification. Gold Recovery led with a 41.0% share of 2025 value, because Western Australian goldfield mills replace carbon lost in each elution and reactivation cycle. Water Treatment grows fastest at 6.59% a year, as utilities respond to tighter PFAS values.
Which buying routes move the most carbon?
Based on sales channel, the market is categorized into direct producer contracts, specialist distribution and integrated treatment procurement. Direct Producer Contracts led with a 50.0% share of 2025 value, because large miners and utilities sign multi-year supply tenders. Integrated Treatment Procurement grows fastest at 6.74% a year, as buyers order carbon inside complete PFAS treatment and operation contracts.
| Segment Group | Leading Sub-segment | Share, 2025 | Fastest-growing Sub-segment | CAGR, 2026–2035 |
|---|---|---|---|---|
| By Product Type | Granular Activated Carbon | 52.0% | Granular Activated Carbon | 6.28% |
| By Raw Material | Coconut Shell | 48.0% | Non-Wood Biomass and Synthetic Precursors | 6.88% |
| By Application | Gold Recovery | 41.0% | Water Treatment | 6.59% |
| By Sales Channel | Direct Producer Contracts | 50.0% | Integrated Treatment Procurement | 6.74% |
Request a Free Sample
Fill in your details and we'll send you a free sample report.
- Sample data tables & charts
- Research methodology
PFAS limits, gold circuits and food uses lift demand
How do tighter PFAS drinking water values lift orders?
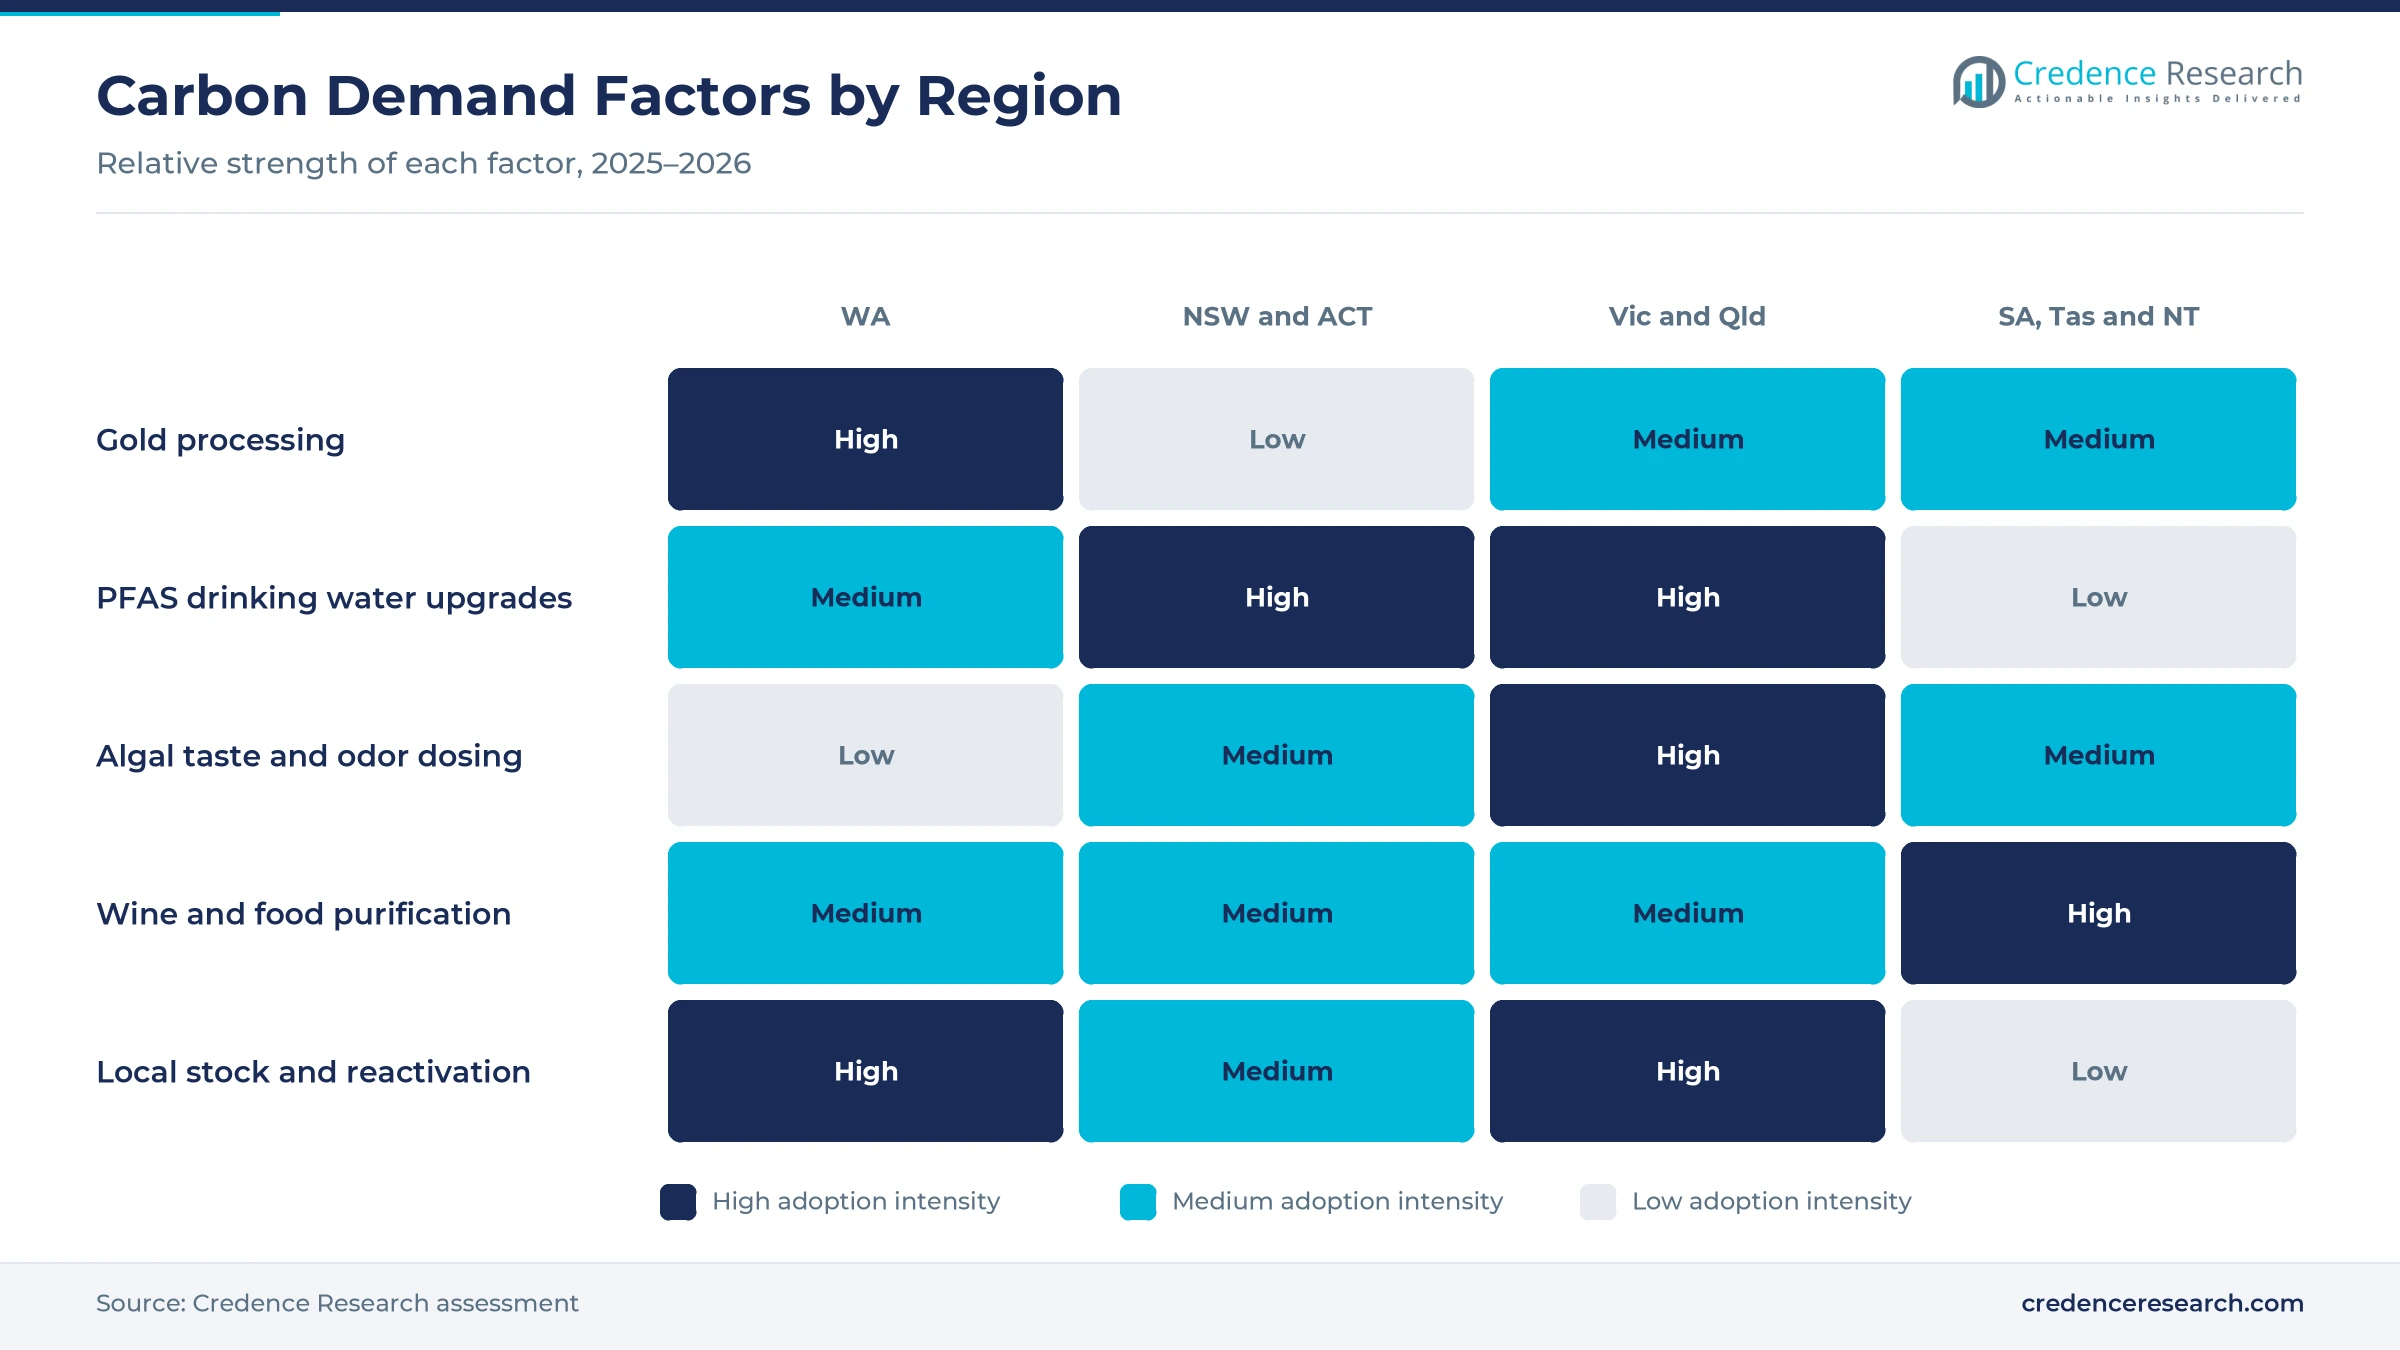
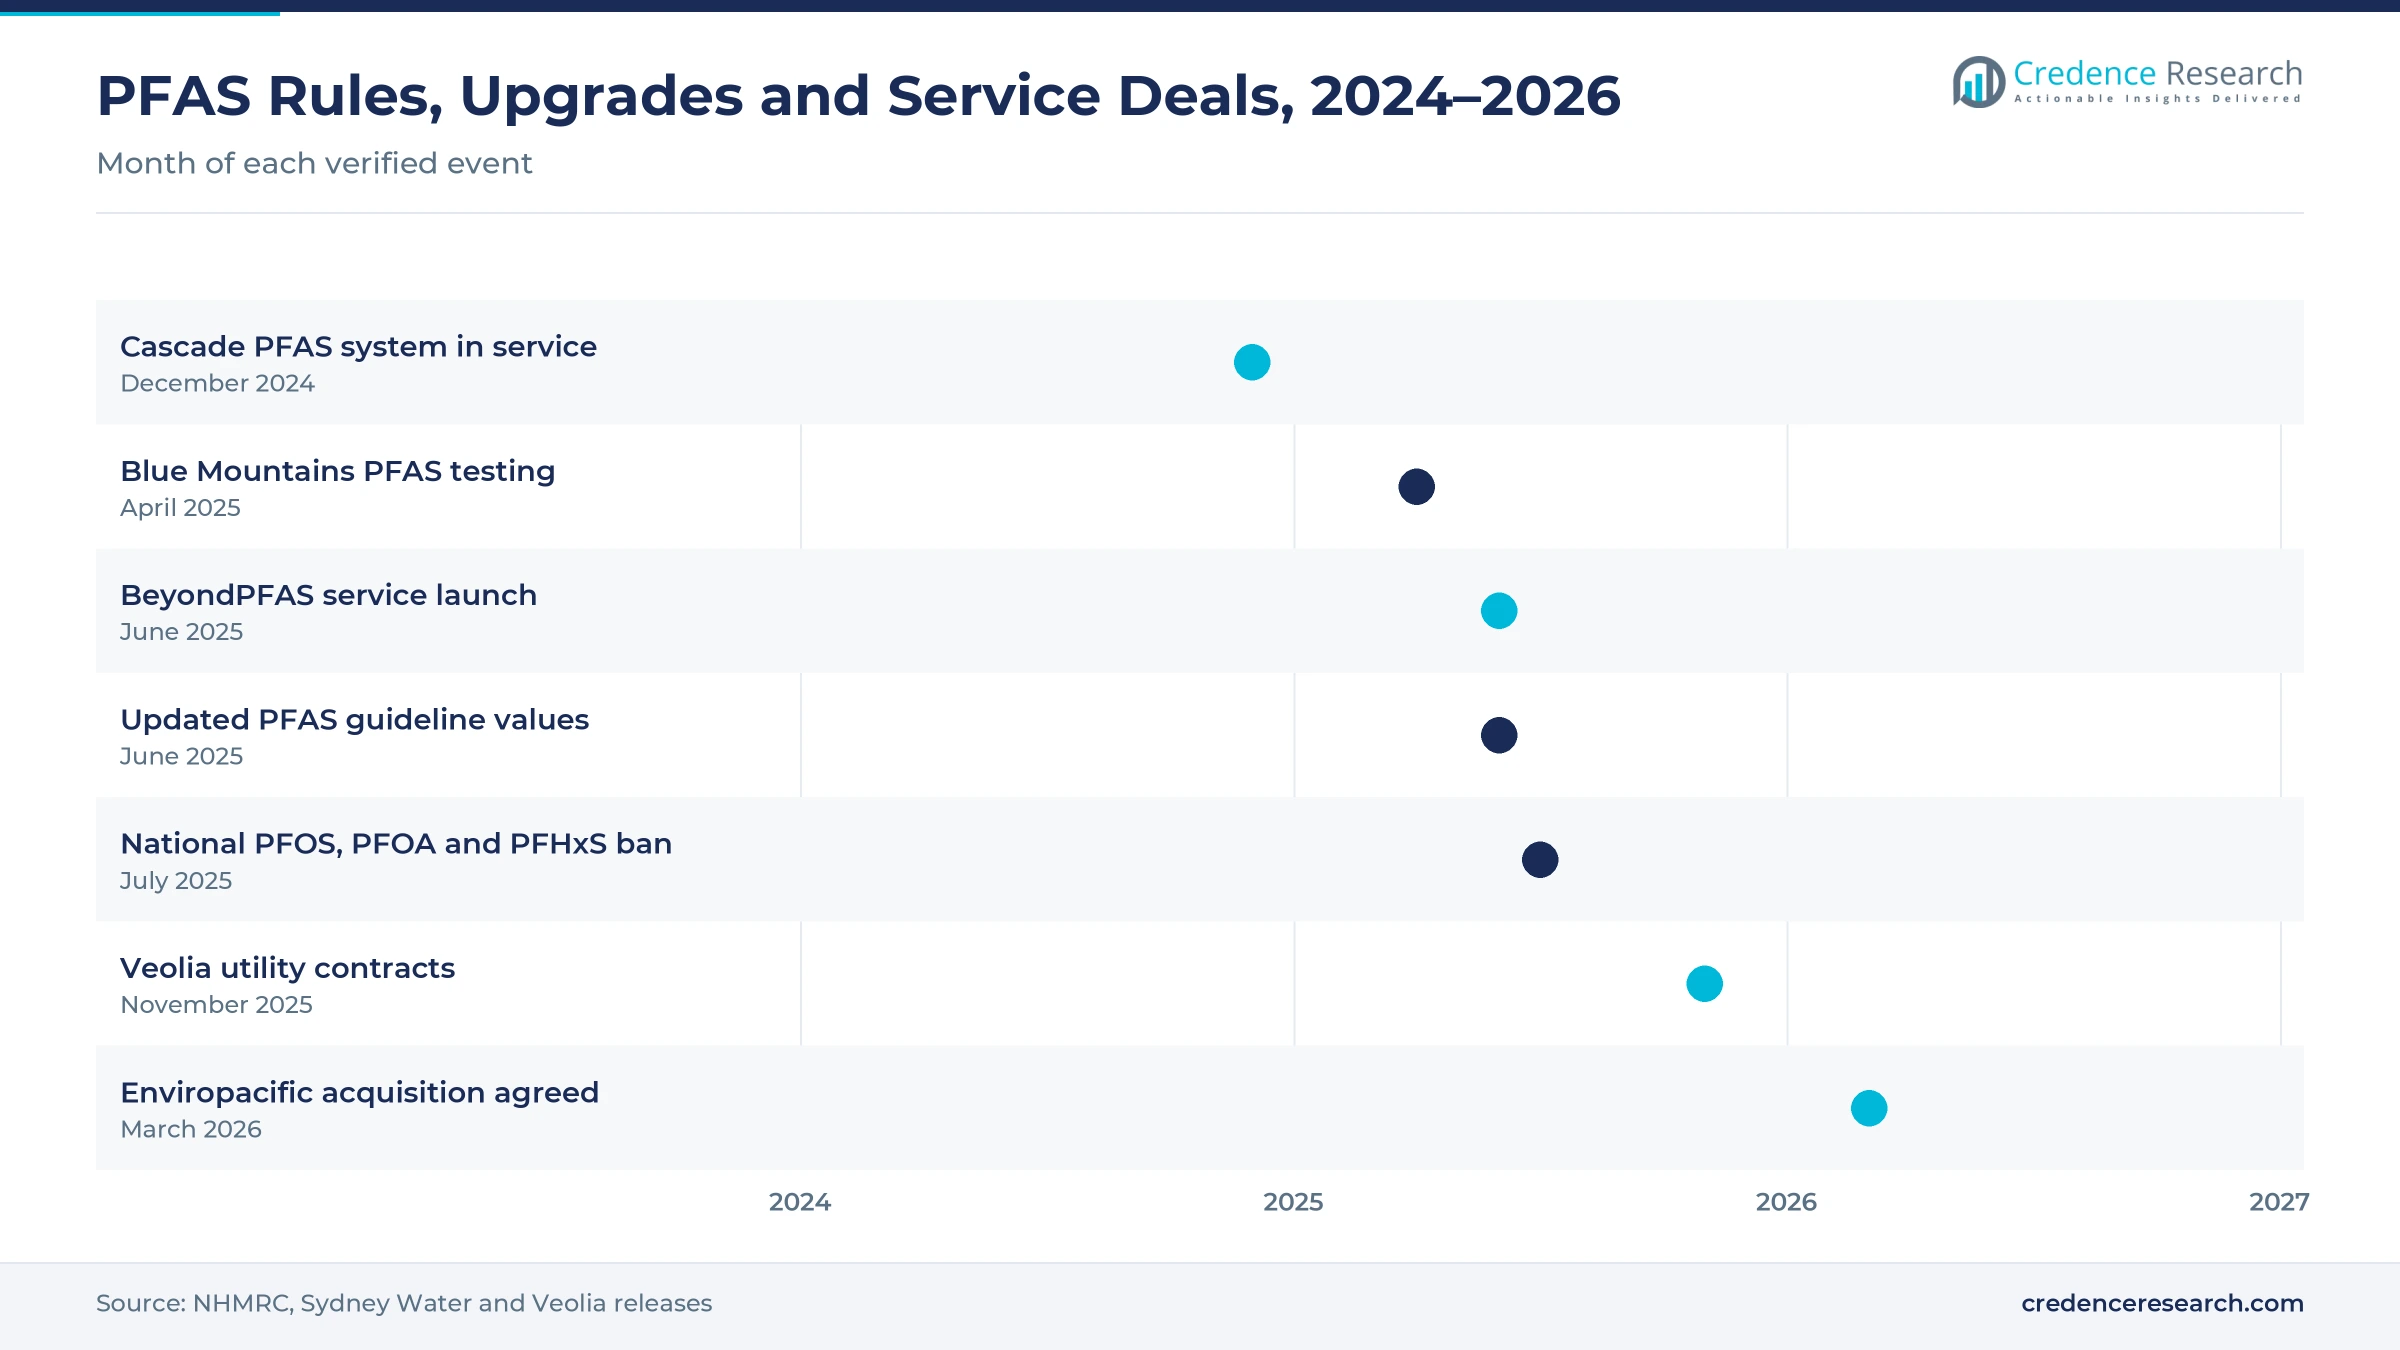
Utilities are ordering more granular media, because granular carbon is one of the few proven ways to remove long-chain PFAS at scale. The National Health and Medical Research Council published updated guidelines on June 25, 2025, with values of eight nanograms per liter for PFOS, 30 for PFHxS and 200 for PFOA. Sydney Water has run a AUD 3.4 million system using granular carbon and ion exchange resin at the Cascade plant in the Blue Mountains since December 2024, according to Sydney Water. That system has a 10-year design life, which signals repeat media purchases. As a result, water treatment grows at 6.59% a year, the fastest application, as utilities compare carbon with PFAS filtration options.
Why does recurring gold recovery replacement keep demand steady?
Gold mills buy carbon all year, because carbon-in-leach plants lose carbon through abrasion and must keep topping up their circuits. Western Australia produced 6.7 million ounces, or 209 metric tons, of gold in the 2024-25 financial year, with record sales of AUD 29 billion, according to the Western Australian government. The same statement put state mining and petroleum investment at AUD 33 billion, with an estimated AUD 49 billion of projects under construction or committed. Activated Carbon Technologies also runs a factory in Perth, close to the goldfields. In turn, Western Australia is the fastest-growing region, as mills that leach ore with sodium cyanide keep buying hard granular grades.
How do food and process purification needs add volume?
Wineries, sugar refiners and beverage plants add steady volume, because these buyers use carbon to remove color, odor and off-flavor compounds. The Australian Wine Research Institute advises that carbon mainly reduces the volatile phenols behind smoke taint, and it notes typical fining rates of around 500 milligrams per liter. Wine Australia reported a 2025 crush of about 1.57 million metric tons on July 8, 2025, up 11% on 2024, which lifts the volume of juice and wine to treat. The institute also notes that results depend on the carbon product, the wine type and the dose, which pushes winemakers toward tested grades. As a result, food and beverage purification holds a steady share, while powder grades serve batch fining.
Why do algal taste and odor events support powder sales?
Utilities dose powdered carbon when blue-green algae blooms reach raw water storages. Seqwater announced a AUD 3.5 million upgrade of the powdered carbon dosing plant at Image Flat on the Sunshine Coast in June 2022, adding dosing points in raw water pipelines. Rockhampton Regional Council used powdered carbon and added granular carbon on top of filters at Mount Morgan in March 2021, as falling dam levels let algae grow. Activated Carbon Technologies and James Cumming & Sons both list powder grades for algal tastes, toxins and pesticides. In turn, powdered carbon keeps a large base alongside other water treatment chemicals during 2026–2035.
PFAS services, reactivation and biomass feedstocks emerge
How is the shift toward bundled PFAS services changing buying?
Site owners increasingly buy PFAS work as a bundle, because they now order testing, treatment media and disposal from one contractor. Veolia launched its BeyondPFAS service in Australia on June 6, 2025, citing water treatment plants at 16 PFAS-contaminated sites and 75 million liters of contaminated water treated. Veolia then agreed on March 24, 2026, to acquire soil remediation firm Enviropacific for about AUD 220 million to strengthen its PFAS position. The national ban on making, importing and using PFOS, PFOA and PFHxS also took effect on July 1, 2025. As a result, integrated treatment procurement grows at 6.74% a year, the fastest sales channel during 2026–2035.
Why is the rise of local reactivation and changeout service notable?
Local service shortens the media cycle, because spent carbon from mines and filters can be restored at lower cost than buying new media. Carbon Activated Corporation offers changeouts and reactivation from its site at Laverton in Victoria. The same supplier also lists catalytic, impregnated and wood-based carbon alongside anthracite and sand. Haycarb also lists regeneration services for spent carbon, run through its CK Regen Systems unit in Thailand. Ores and metals made up about 34.6% of Australian merchandise exports in 2025, according to the World Bank, which keeps mineral processing central to carbon use. In turn, reactivation keeps direct producer contracts at 50.0% of 2025 value.
Can local biomass feedstocks open a new supply base?
Farm and winery residue could become a domestic precursor, because farms and wineries produce large volumes of residue that is often burned or left to decompose. Bygen, a University of Adelaide spinout, uses a low-temperature process to make carbon from nut shells, straw and wine waste, according to InDaily. The company is building its first commercial production plant with support from the university. Wine Australia also valued the 2025 crush of about 1.57 million metric tons at about AUD 1.13 billion, which points to a large base of winery residue. As a result, non-wood biomass and synthetic precursors grow at 6.88% a year, the fastest raw material during 2026–2035.
Is there room to grow through utility operation contracts?
Long plant operation deals create a steady route to market, because operators that run treatment plants also specify and buy filter media over long terms. Veolia secured about AUD 700 million in Australian water contracts on Nov. 11, 2025, including six Central Highlands Water plants for 15 years and Hunter Water facilities for 10 years. Xylem lists granular carbon adsorption systems and gravity contactors on its Australian PFAS treatment page. Australia also added about 392,700 people in the year to March 31, 2026, which raises the volume of water to treat. In turn, New South Wales and Australian Capital Territory grows at 6.19% a year as Sydney and Hunter utilities upgrade.
Imported feedstock, spent media and rival methods weigh
How does reliance on imported shell carbon raise risk?
Supply risk stays high for hard grades, because leading shell-based grades are made at Haycarb plants in Sri Lanka, Thailand and Indonesia. As a result, freight delays and coconut harvest swings can lift landed prices for Australian mines and utilities within months. Suppliers respond by holding buffer stock in Perth, Melbourne and Brisbane warehouses. Prices of coconut shell charcoal also feed directly into the cost of hard granular grades.
Why does spent PFAS media create a disposal burden?
Disposal adds cost after every filter change, because carbon loaded with forever chemicals cannot simply go to general landfill. In turn, utilities must pay for high-temperature reactivation, licensed thermal treatment or specialized landfill when they change filters. Suppliers respond with changeout services that collect spent media and return reactivated carbon where rules allow. This cost tends to favor suppliers with access to licensed reactivation capacity.
How do rival treatment methods limit carbon use?
Carbon does not win every PFAS project, because ion exchange resin and reverse osmosis can also remove PFAS from drinking water. Sydney Water notes that reverse osmosis works but is costly and energy-intensive, and its Cascade system pairs carbon with resin to reach very low levels. As a result, many new systems combine carbon with resin rather than relying on carbon alone. Carbon suppliers respond with grades tuned for lead-lag filter beds and pilot tests.
How do long haul routes lift landed costs at remote mines?
Remote sites pay more for each delivered bag, because heavy carbon must travel long routes to remote mines in the goldfields, the Pilbara and the Northern Territory. In turn, buyers far from ports pay more and need larger stocks to avoid circuit shortfalls. Suppliers respond with regional warehouses and bulk bag delivery schedules that match plant top-up cycles. Remote utilities in smaller towns also face higher per-unit costs because they order small volumes.
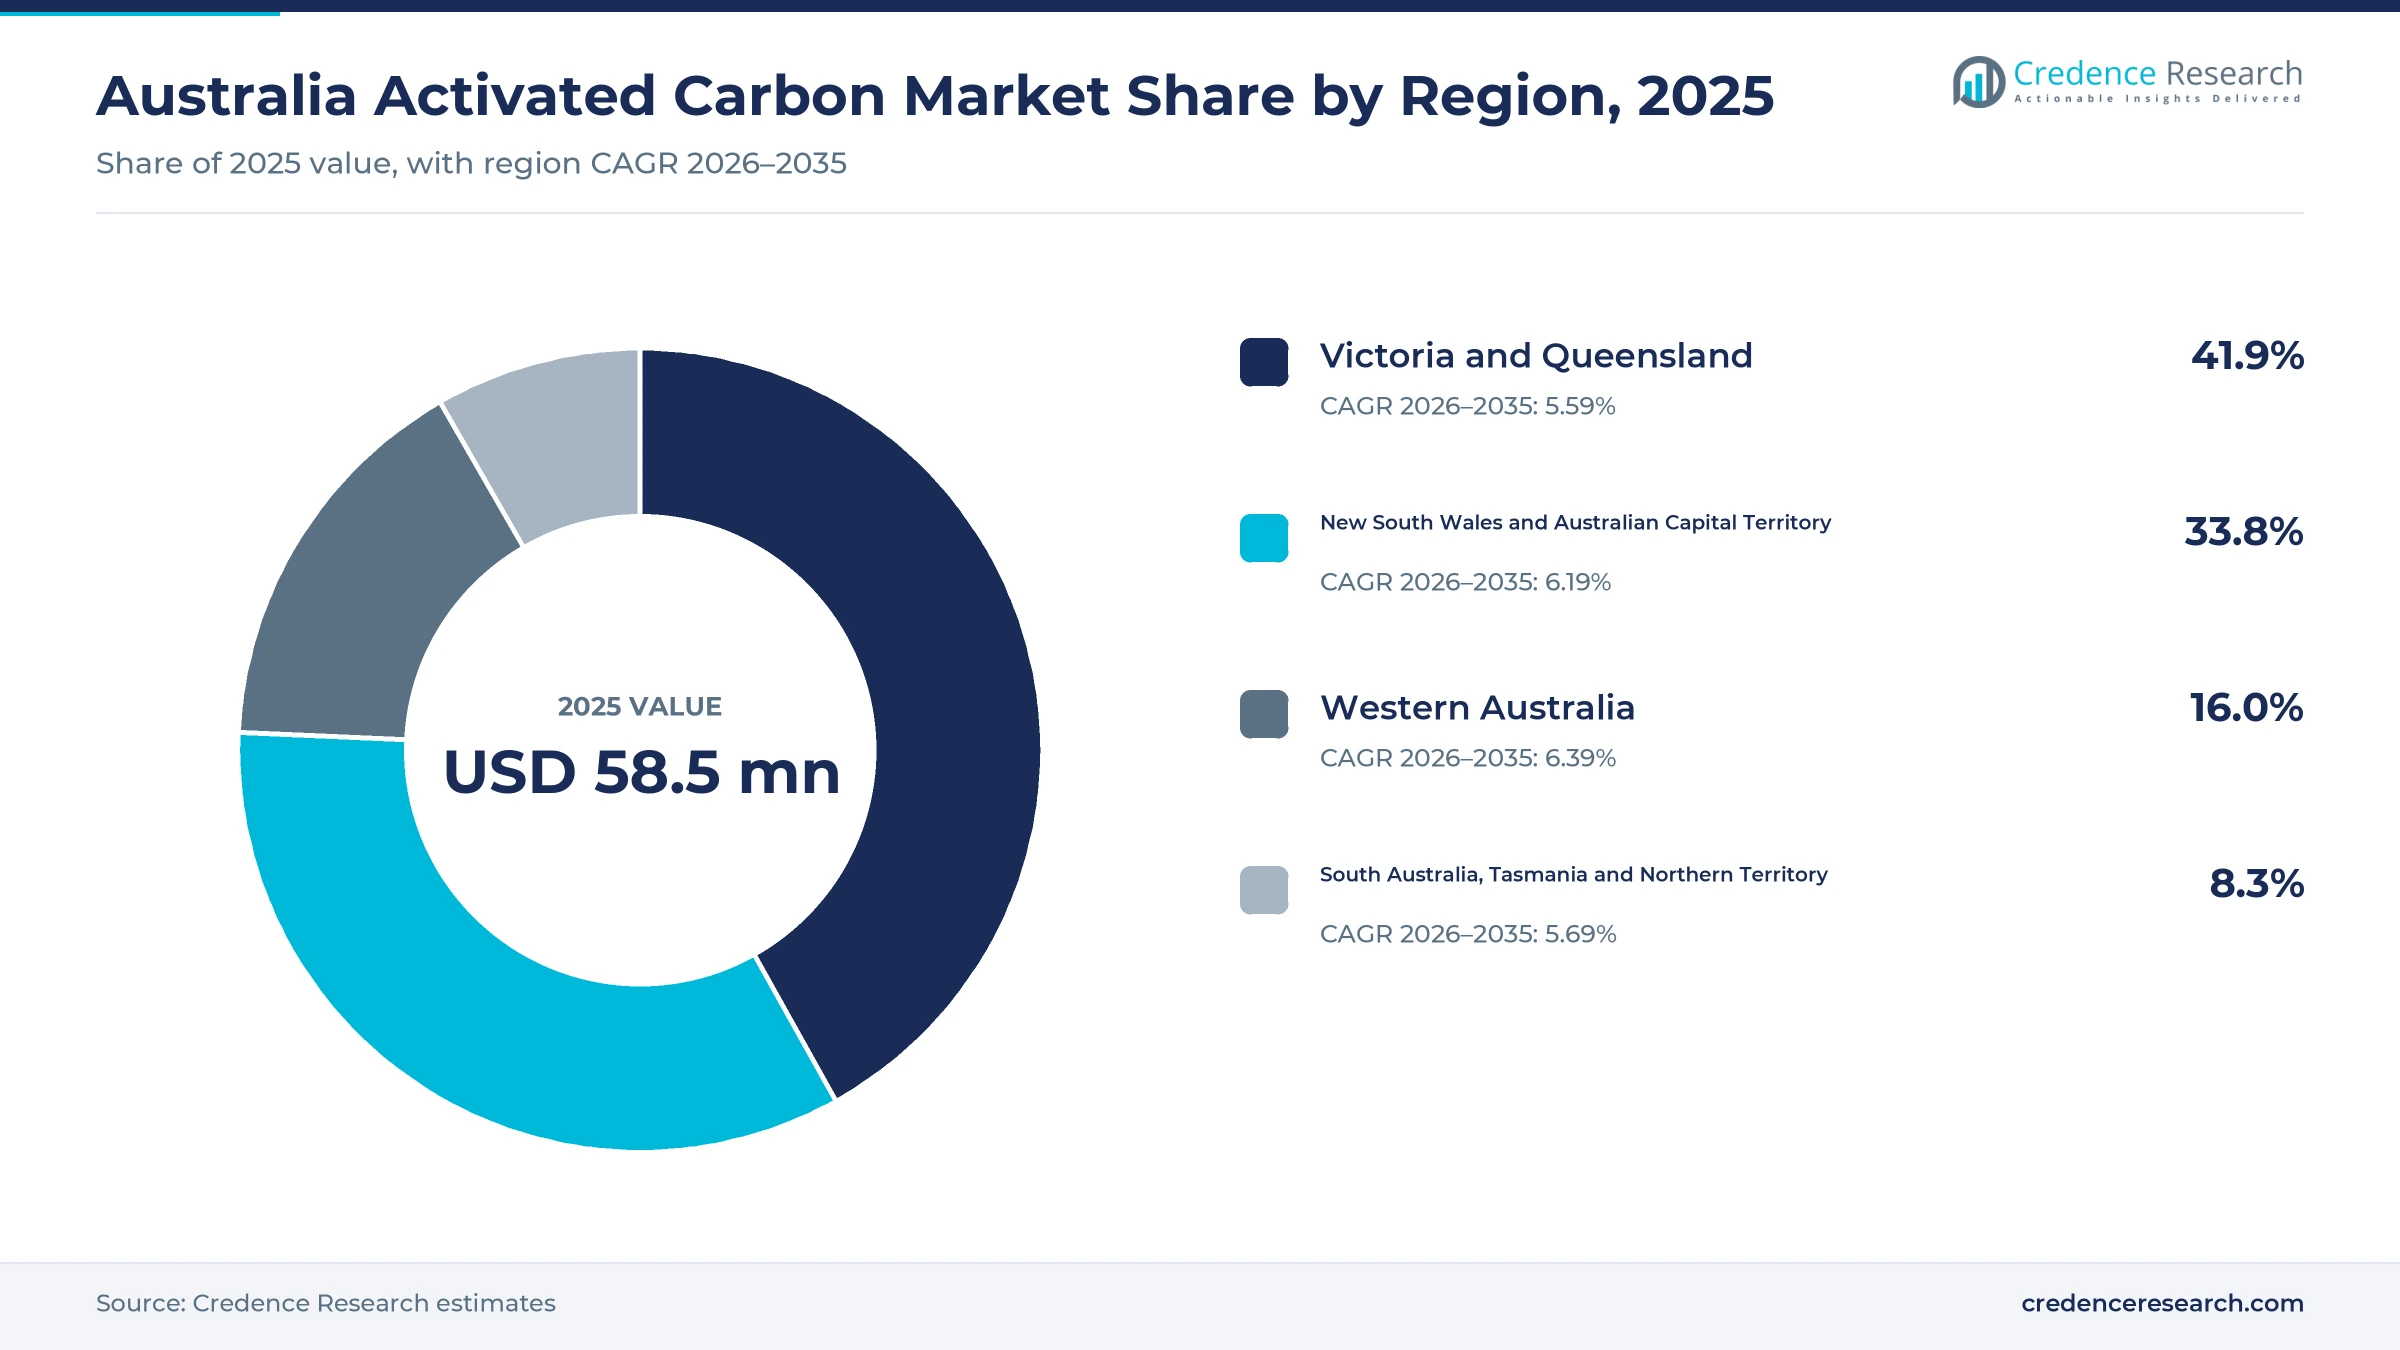
Victoria and Queensland lead while the west grows fastest
| Region | Value, 2025 (USD million) | Share, 2025 | CAGR, 2026–2035 |
|---|---|---|---|
| Victoria and Queensland | 24.5 | 41.9% | 5.59% |
| New South Wales and Australian Capital Territory | 19.8 | 33.8% | 6.19% |
| Western Australia | 9.4 | 16.0% | 6.39% |
| South Australia, Tasmania and Northern Territory | 4.9 | 8.3% | 5.69% |
Why do Victoria and Queensland hold the top share?
Victoria and Queensland held a 41.9% share of 2025 value and grow at 5.59% a year, because the two states had about 12.9 million people at March 31, 2026. Seqwater runs a powdered carbon dosing plant at Image Flat on the Sunshine Coast for taste and odor control. Victoria also hosts the Laverton site of Carbon Activated Corporation and the Australian arm of Haycarb. As a result, this region stays the main distribution hub.
Which utility upgrades shape demand around Sydney?
New South Wales and Australian Capital Territory held a 33.8% share of 2025 value and grow at 6.19% a year, because Sydney Water and Hunter Water serve large populations. New South Wales had about 8.67 million residents at March 31, 2026. Sydney Water tested 54 Blue Mountains sites for PFAS in April 2025. In turn, this region leads early PFAS filter orders among the four regions.
What keeps goldfield buying ahead in the west?
Western Australia held a 16.0% share of 2025 value and grows fastest at 6.39% a year, because goldfield mills replace carbon throughout each year. The state produced 209 metric tons of gold in 2024-25 and grew its population by 2.1% in the year to March 2026, the fastest of any state. Activated Carbon Technologies also runs a factory in Perth near these mills. As a result, this region gains the most mining volume by 2035.
How do South Australia, Tasmania and the Northern Territory contribute?
South Australia, Tasmania and Northern Territory held 8.3% of 2025 value and grow at 5.69% a year, because the three areas have about 2.77 million people. South Australian wine regions use carbon for fining, and Bygen is developing biomass carbon in Adelaide. In turn, this region relies on winery, mine site and small utility accounts.
PFAS rules, treatment upgrades and service deals
| Development | Status and market relevance |
|---|---|
| In December 2024, Sydney Water began running a granular carbon and ion exchange system at the Cascade plant. | AUD 3.4 million system with a 10-year design life |
| In June 2025, the National Health and Medical Research Council updated the drinking water guidelines for PFAS. | Sets PFOS at eight nanograms per liter and PFOA at 200 |
| In July 2025, the national ban on PFOS, PFOA and PFHxS took effect under the industrial chemicals standard. | Raises remediation and treatment work across Australia |
| In November 2025, Veolia secured about AUD 700 million in water contracts with three Australian utilities. | Adds long-term plant operation and media purchasing roles |
| In March 2026, Veolia agreed to acquire soil remediation firm Enviropacific. | Deal valued at about AUD 220 million to expand PFAS treatment |
Activation, reactivation and contactor design set quality
- Steam activation opens pores in coconut shell, coal and wood char with hot steam, which gives the hard granules that gold plants and water filters need.
- Chemical activation treats wood and biomass with activating agents at lower temperatures, which creates wide pores suited to color removal and food purification.
- Thermal reactivation burns adsorbed organics off spent carbon in kilns, which lets gold plants and utilities reuse most of their carbon inventory.
- Fixed-bed contactor design places granular carbon in lead-lag vessels, often beside ion exchange resin, which lets utilities hold PFAS below guideline values.
Need a Custom Version of This Report?
Tailor the scope, geography, or segments to your exact requirements.
- Custom geography or segment scope
- Direct access to our analyst team
Local suppliers, importers and water groups compete
Competition centers on local producers, importers of shell-based grades and water technology groups that bundle carbon into treatment systems. Activated Carbon Technologies runs a Perth factory and supplies powder, granular and impregnated grades to Australian and New Zealand utilities. James Cumming & Sons makes coal-based carbons in Auburn, New South Wales, from Australian coal. Haycarb sells through its Victorian subsidiary, while Carbon Activated Corporation offers changeouts and reactivation from Laverton. Jacobi serves gold plants with a dedicated Australian sales team. Veolia and Xylem compete for PFAS and utility treatment projects that specify granular media, and Bygen is developing biomass-based supply in Adelaide. Suppliers compete on hardness, adsorption capacity, reactivation service, stock near mines and technical support, and buyers also track global adsorbent supply when they set tenders.
Which producers and treatment groups supply Australian buyers?
| Company | Type | Role in the market |
|---|---|---|
| Activated Carbon Technologies Pty Ltd | Producer and distributor | Runs a Perth factory and a water and carbon applications laboratory |
| James Cumming & Sons Pty Ltd | Producer | Makes coal-based powder and granular carbons in Auburn, New South Wales |
| Haycarb Holdings Australia Pty Ltd | Distributor | Distributes the group shell-based carbon and technology from Victoria |
| Carbon Activated Corporation | Supplier and service provider | Offers supply, changeouts and reactivation from Laverton, Victoria |
| Jacobi Carbons Pty Ltd | Supplier | Serves gold plants with an Australian sales team and technical seminars |
| Bygen Pty Ltd | Developer | Develops low-temperature biomass carbon from agricultural waste in Adelaide |
| Veolia Water Technologies | Treatment provider | Runs PFAS treatment at 16 contaminated sites and utility plant contracts |
| Xylem | Treatment provider | Offers granular carbon adsorption systems and contactors for PFAS removal |
Credence Research view on Australian adsorbent demand
Credence Research's view is that Australian demand will grow steadily because gold plants need constant top-ups and drinking water rules now favor granular filters. Gold recovery stays the largest application, while water treatment grows fastest as utilities act on the June 2025 PFAS values. Suppliers that pair hard shell-based grades with local reactivation, changeout service and stock near the goldfields should gain share by 2035, while biomass feedstocks offer a longer-term local supply option. Buyers should also plan for spent media disposal costs when they compare carbon with resin systems.
How the national adsorbent estimate was built
The report uses 2025 as the base year on a calendar basis, and market values come from the Credence Research model. That model combines regulator guidelines, utility notices, state government statistics, company pages, industry research bodies and international economic data. Segment splits and regional growth rates are Credence Research estimates, while regional shares follow the client split. Sources used are government and regulator releases, utility and company pages, trade media, official population statistics and World Bank data, and no interviews or surveys were used.
Drinking water upgrades carry growth to 2035
The Australia activated carbon market is expected to reach USD 112.5 million by 2035, a 5.93% CAGR during 2026–2035, as gold plants, water utilities and food processors keep buying carbon. Growth should be strongest in granular grades, water treatment and Western Australia, because these areas gain most from PFAS upgrades and goldfield output. Imported feedstock, spent media disposal and rival resin systems could slow some projects, while local reactivation and biomass supply should improve resilience.
Frequently Asked Questions
How big is the Australia activated carbon market?
Which product type leads activated carbon value?
Which region leads the market?
How do PFAS drinking water rules affect demand?
Why do gold plants buy so much carbon?
Which application grows fastest?
Who are the leading companies in the Australian activated carbon market?
What are the main challenges for buyers and suppliers?
Table of Content
Chapter 1 Market Segmentation
- 1.1 Segmentation Framework
- 1.1.1 Product and Service Classification
- 1.1.2 Application and End-Use Classification
- 1.1.3 Technology and Solution Classification
- 1.1.4 Customer and Distribution Channel Classification
- 1.1.5 Geographic Segmentation
- 1.1.6 Market Segment Definitions and Boundaries
- 1.2 By Product Type
- 1.2.1 Granular Activated Carbon
- 1.2.2 Powdered Activated Carbon
- 1.2.3 Pelletised Activated Carbon
- 1.2.4 Bead Activated Carbon
- 1.3 By Raw Material
- 1.3.1 Coconut Shell
- 1.3.2 Coal
- 1.3.3 Wood
- 1.3.4 Non-Wood Biomass and Synthetic Precursors
- 1.4 By Application
- 1.4.1 Gold Recovery
- 1.4.2 Water Treatment
- 1.4.3 Food and Beverage Purification
- 1.4.4 Air and Specialty Purification
- 1.5 By Sales Channel
- 1.5.1 Direct Producer Contracts
- 1.5.2 Specialist Distribution
- 1.5.3 Integrated Treatment Procurement
Chapter 2 Introduction
- 2.1 Report Objectives and Scope
- 2.2 Product Definition and Industry Terminology
- 2.3 Market Inclusions and Exclusions
- 2.4 Research Process
- 2.4.1 Primary Research and Expert Interviews
- 2.4.2 Secondary Research and Source Review
- 2.4.3 Top-Down and Bottom-Up Estimation
- 2.4.4 Data Triangulation and Verification
- 2.5 Market Size Measurement Basis
- 2.5.1 2025: USD 58.5 million → 2035: USD 112.5 million
- 2.6 Historical and Forecast Reference Periods
- 2.6.1 Historical Period: 2018-2025
- 2.6.2 Base Year: 2025
- 2.6.3 Forecast Period: 2025-2035
- 2.7 Research Assumptions and Limitations
Chapter 3 Executive Summary
- 3.1 Market Snapshot and Key Findings
- 3.2 Base-Year Market Size, 2025
- 3.3 Forecast Market Size, 2035
- 3.4 Revenue and Volume Growth Outlook
- 3.5 Key Demand and Supply Indicators
- 3.6 Leading Market Segments
- 3.7 Fastest-Growing Market Opportunities
- 3.8 Regional Performance Highlights
- 3.9 Technology and Industry Transformation
- 3.10 Competitive Landscape Summary
- 3.11 Analyst View and Strategic Implications
Chapter 4 Australia Activated Carbon Market Trends and Developments
- 4.1 Historical Industry Development, 2018-2025
- 4.2 Recent Market Trends and Developments
- 4.3 Demand and Customer Behavior Trends
- 4.4 Technology and Product Innovation
- 4.5 Artificial Intelligence, Automation and Digitalization
- 4.6 Local Manufacturing and Supply Chain Realignment
- 4.7 Industry Partnerships, Mergers and Acquisitions
- 4.8 Sustainability and Circular Economy Developments
- 4.9 Government and Private Sector Investment Trends
- 4.10 Emerging Business Models and Commercialization
- 4.11 Industry Developments and Announcements
Chapter 5 Australia Activated Carbon Market Production, Supply and Demand Analysis
- 5.1 Demand Trend and Consumption Analysis, 2018-2025
- 5.2 Demand Forecast, 2025-2035
- 5.3 Production and Output Trend, 2018-2025
- 5.4 Production and Output Forecast, 2025-2035
- 5.5 Installed Capacity and Capacity Utilization
- 5.6 Company-Wise Production Plants and Statistics
- 5.6.1 Installed Production Capacity
- 5.6.2 Actual Production
- 5.6.3 Planned Capacity and Expansion Targets
- 5.7 Supply Chain Structure and Procurement Trends
- 5.8 Supply-Demand Gap and Bottlenecks
- 5.9 Import Dependence and Sourcing Structure
- 5.10 Contract Manufacturing and Outsourcing
- 5.11 Regional Supply and Demand Concentration
Chapter 6 Australia Activated Carbon Market Pricing Analysis
- 6.1 Pricing Structure and Measurement
- 6.2 Historical Pricing Trends, 2018-2025
- 6.3 Pricing Outlook, 2025-2035
- 6.4 Average Selling Price and Unit Economics
- 6.5 Pricing by Product and Market Segment
- 6.6 Geographic Pricing Differences
- 6.7 Key Input, Energy, Labor and Logistics Costs
- 6.8 Contract Pricing and Purchasing Models
- 6.9 Pricing Sensitivity and Competitive Positioning
- 6.10 Price, Margin and Profitability Implications
Chapter 7 Australia Activated Carbon Market Dynamics
- 7.1 Market Growth Drivers
- 7.1.1 Demand-Side Drivers
- 7.1.2 Technology and Innovation Drivers
- 7.1.3 Infrastructure and Investment Drivers
- 7.1.4 Regulatory and Policy Drivers
- 7.2 Market Restraints
- 7.2.1 Cost and Affordability Constraints
- 7.2.2 Technology and Adoption Barriers
- 7.2.3 Supply Chain and Operational Constraints
- 7.3 Market Challenges
- 7.3.1 Competitive Pressure and Margin Erosion
- 7.3.2 Skills, Infrastructure and Implementation Gaps
- 7.4 Emerging Market Opportunities
- 7.5 Market Dynamics Impact and Time-Horizon Assessment
Chapter 8 Australia Activated Carbon Value Chain Analysis
- 8.1 Industry Value Chain Overview
- 8.2 Upstream Suppliers and Critical Inputs
- 8.3 Technology and Component Providers
- 8.4 Manufacturing or Service Delivery
- 8.5 Distribution, Channel Partners and Integrators
- 8.6 Downstream Applications and End Users
- 8.7 Value Addition and Profit Pools
- 8.8 Vertical Integration and Outsourcing
- 8.9 Supplier Concentration and Risk
- 8.10 Supply Chain Localization and Resilience
Chapter 9 Australia Activated Carbon Market Regulations and Policies
- 9.1 Relevant Laws, Standards and Compliance Frameworks
- 9.2 Product, Service, Safety and Quality Requirements
- 9.3 Government Policies, Incentives and Subsidies
- 9.4 Imports, Exports and Trade Barriers
- 9.5 Public Procurement and Local Content Requirements
- 9.6 Environmental and Sustainability Compliance
- 9.7 Upcoming Policy Changes and Market Implications
Chapter 10 Australia Activated Carbon Market Hotspots and Opportunities
- 10.1 Market Opportunity Mapping and Growth Hotspots
- 10.2 High-Growth Applications and Customer Groups
- 10.3 Underserved Markets and White-Space Opportunities
- 10.4 Emerging Technology and Product Opportunities
- 10.5 New Capacity and Investment Hotspots
- 10.6 Market Entry and Expansion Opportunities
- 10.7 Distribution and Partnership Opportunities
- 10.8 Near-Term and Long-Term Commercial Potential
- 10.9 Opportunity Attractiveness and Execution Risks
Chapter 11 Australia Activated Carbon Market Outlook, 2025-2035
- 11.1 Market Size and Analysis
- 11.1.1 Revenue (Market Measurement: 2025: USD 58.5 million → 2035: USD 112.5 million)
- 11.1.2 Market Volume and Quantity Sold
- 11.1.3 Historical Market Size, 2018-2025
- 11.1.4 Base-Year Market Size, 2025
- 11.2 Market Forecast, 2025-2035
- 11.2.1 Revenue Forecast to 2035
- 11.2.2 Volume Forecast to 2035
- 11.2.3 CAGR and Year-on-Year Growth
- 11.2.4 Incremental Revenue Opportunity
- 11.3 Forecast Assumptions and Scenario Analysis
- 11.3.1 Base-Case Forecast
- 11.3.2 Optimistic and Conservative Scenarios
- 11.3.3 Technology, Pricing and Policy Sensitivities
- 11.4 Market Attractiveness and Growth Outlook
Chapter 12 Australia Activated Carbon Market Segmentation and Outlook
- 12.1 Segmentation Summary and Market Shares, 2025
- 12.2 Largest and Fastest-Growing Segments
- 12.3 By Product Type - Market Size and Forecast, 2025-2035
- 12.3.1 Segment Definition and Scope
- 12.3.2 Historical Market Size, 2018-2025
- 12.3.3 Revenue Forecast, 2025-2035
- 12.3.4 Volume Forecast, 2025-2035
- 12.3.5 Base-Year Market Share, 2025
- 12.3.6 Segment CAGR and Growth Drivers
- 12.3.7 Subsegment Market Size and Forecast
- 12.3.7.1 Granular Activated Carbon
- 12.3.7.2 Powdered Activated Carbon
- 12.3.7.3 Pelletised Activated Carbon
- 12.3.7.4 Bead Activated Carbon
- 12.3.8 Subsegment Pricing and Adoption Trends
- 12.3.9 Leading Suppliers and Competition
- 12.3.10 Regional Demand and Opportunities
- 12.4 By Raw Material - Market Size and Forecast, 2025-2035
- 12.4.1 Segment Definition and Scope
- 12.4.2 Historical Market Size, 2018-2025
- 12.4.3 Revenue Forecast, 2025-2035
- 12.4.4 Volume Forecast, 2025-2035
- 12.4.5 Base-Year Market Share, 2025
- 12.4.6 Segment CAGR and Growth Drivers
- 12.4.7 Subsegment Market Size and Forecast
- 12.4.7.1 Coconut Shell
- 12.4.7.2 Coal
- 12.4.7.3 Wood
- 12.4.7.4 Non-Wood Biomass and Synthetic Precursors
- 12.4.8 Subsegment Pricing and Adoption Trends
- 12.4.9 Leading Suppliers and Competition
- 12.4.10 Regional Demand and Opportunities
- 12.5 By Application - Market Size and Forecast, 2025-2035
- 12.5.1 Segment Definition and Scope
- 12.5.2 Historical Market Size, 2018-2025
- 12.5.3 Revenue Forecast, 2025-2035
- 12.5.4 Volume Forecast, 2025-2035
- 12.5.5 Base-Year Market Share, 2025
- 12.5.6 Segment CAGR and Growth Drivers
- 12.5.7 Subsegment Market Size and Forecast
- 12.5.7.1 Gold Recovery
- 12.5.7.2 Water Treatment
- 12.5.7.3 Food and Beverage Purification
- 12.5.7.4 Air and Specialty Purification
- 12.5.8 Subsegment Pricing and Adoption Trends
- 12.5.9 Leading Suppliers and Competition
- 12.5.10 Regional Demand and Opportunities
- 12.6 By Sales Channel - Market Size and Forecast, 2025-2035
- 12.6.1 Segment Definition and Scope
- 12.6.2 Historical Market Size, 2018-2025
- 12.6.3 Revenue Forecast, 2025-2035
- 12.6.4 Volume Forecast, 2025-2035
- 12.6.5 Base-Year Market Share, 2025
- 12.6.6 Segment CAGR and Growth Drivers
- 12.6.7 Subsegment Market Size and Forecast
- 12.6.7.1 Direct Producer Contracts
- 12.6.7.2 Specialist Distribution
- 12.6.7.3 Integrated Treatment Procurement
- 12.6.8 Subsegment Pricing and Adoption Trends
- 12.6.9 Leading Suppliers and Competition
- 12.6.10 Regional Demand and Opportunities
- 12.7 Segment Growth Comparison
- 12.8 Segment Attractiveness and Priority Matrix
Chapter 13 Australia Activated Carbon End-Use and Application Market Outlook
- 13.1 End-Use Industry and Customer Demand Structure
- 13.2 Leading Applications and Customer Groups
- 13.3 End-Use Market Size, Share and Forecast
- 13.4 Major End-Use Industry Deep Dives
- 13.4.1 Customer Requirements and Use Cases
- 13.4.2 Demand and Replacement Cycles
- 13.4.3 Technical and Regulatory Considerations
- 13.4.4 Purchasing and Procurement Models
- 13.4.5 Leading Vendors and Distribution Channels
- 13.4.6 Forecast and Commercial Opportunities
- 13.5 Emerging Applications and Cross-Segment Demand
- 13.6 End-Use Industry Investment Priorities
Chapter 14 Australia Activated Carbon Geographic Market Outlook, 2025-2035
- 14.1 Domestic Market Distribution and Demand Clusters
- 14.2 State- or Province-Wise Market Size and Forecast, 2025-2035
- 14.3 City and Metropolitan Market Outlook
- 14.4 Industrial, Manufacturing and Commercial Clusters
- 14.5 Geographic Concentration of Key End Users
- 14.6 Local Pricing and Purchasing Differences
- 14.7 Domestic Production Facilities and Capacity Map
- 14.8 Local Infrastructure and Project Pipeline
- 14.9 State-Level Policy and Incentive Differences
- 14.10 Subnational Investment Hotspots and Opportunities
- 14.11 Distribution and Logistics Networks
- 14.12 Domestic Competitive Footprint
Chapter 15 Australia Activated Carbon Technology, Innovation and Sustainability Outlook
- 15.1 Technology Landscape and Maturity
- 15.2 Product, Process and Service Innovation
- 15.3 AI, Automation and Digital Tools in the Industry
- 15.4 Technology Adoption and Performance Benchmarking
- 15.5 Innovation Pipeline and R&D Investment
- 15.6 Patent and Intellectual Property Trends
- 15.7 Energy Efficiency and Resource Management
- 15.8 Sustainability, Recycling and Circularity
- 15.9 Technology Roadmap, 2025-2035
- 15.10 Risks of Obsolescence and Technology Substitution
Chapter 16 Australia Activated Carbon Market Key Strategic Imperatives
- 16.1 Growth and Market Entry Priorities
- 16.2 High-Return Products and Segments
- 16.3 Pricing, Profitability and Cost Optimization
- 16.4 Technology Investment and Product Differentiation
- 16.5 Supply Chain Localization and Resilience
- 16.6 Distribution and Customer Acquisition
- 16.7 Partnership, Acquisition and Capacity Strategy
- 16.8 Regional Expansion Priorities
- 16.9 Short-, Medium- and Long-Term Actions
Chapter 17 Competition Outlook
- 17.1 Industry Competition Characteristics
- 17.2 Market Structure and Concentration
- 17.3 Market Share and Competitive Positioning, 2025
- 17.4 Company-Wise Revenue and Product Benchmarking
- 17.5 Production and Service Capacity Benchmarking
- 17.6 Technology, Pricing and Differentiation
- 17.7 Regional Footprint and Distribution Strength
- 17.8 Mergers, Acquisitions and Strategic Alliances
- 17.9 New Entrants and Competitive Threats
- 17.10 Porter's Five Forces and Industry Attractiveness
- 17.11 Competitive Outlook, 2025-2035
Chapter 18 Company Profiles
- 18.1 Company Coverage and Selection Criteria
- 18.2 Activated Carbon Technologies Pty Ltd
- 18.2.1 Business Description
- 18.2.2 Company Ownership and Geographic Presence
- 18.2.3 Product and Service Portfolio
- 18.2.4 Manufacturing and Operating Footprint
- 18.2.5 Production Capacity and Expansion Plans
- 18.2.6 Financial Performance and Investment
- 18.2.7 Market Share and Competitive Position
- 18.2.8 Technology and Innovation Capabilities
- 18.2.9 Strategic Alliances or Partnerships
- 18.2.10 Recent Developments
- 18.2.11 Growth Strategy and Outlook
- 18.3 Haycarb Holdings Australia Pty Ltd
- 18.4 Jacobi Carbons Pty Ltd
- 18.5 James Cumming & Sons Pty Ltd
- 18.6 Carbon Activated Corporation
- 18.7 Bygen Pty Ltd
- 18.8 Xylem
- 18.9 Veolia Water Technologies
- 18.10 Other Relevant Market Participants
Note: Every listed company is profiled on the structure shown under the first company. The company list is preliminary and may change based on research findings, market developments, data availability and client requirements.
Chapter 19 Disclaimer
- 19.1 Research and Forecast Disclaimer
- 19.2 Data Source and Estimation Limitations
Note: The depth of individual sections depends on data availability for this market. Volume, capacity, trade and other unit-based metrics are included where applicable.

