
Australian firms move sales and service onto cloud CRM
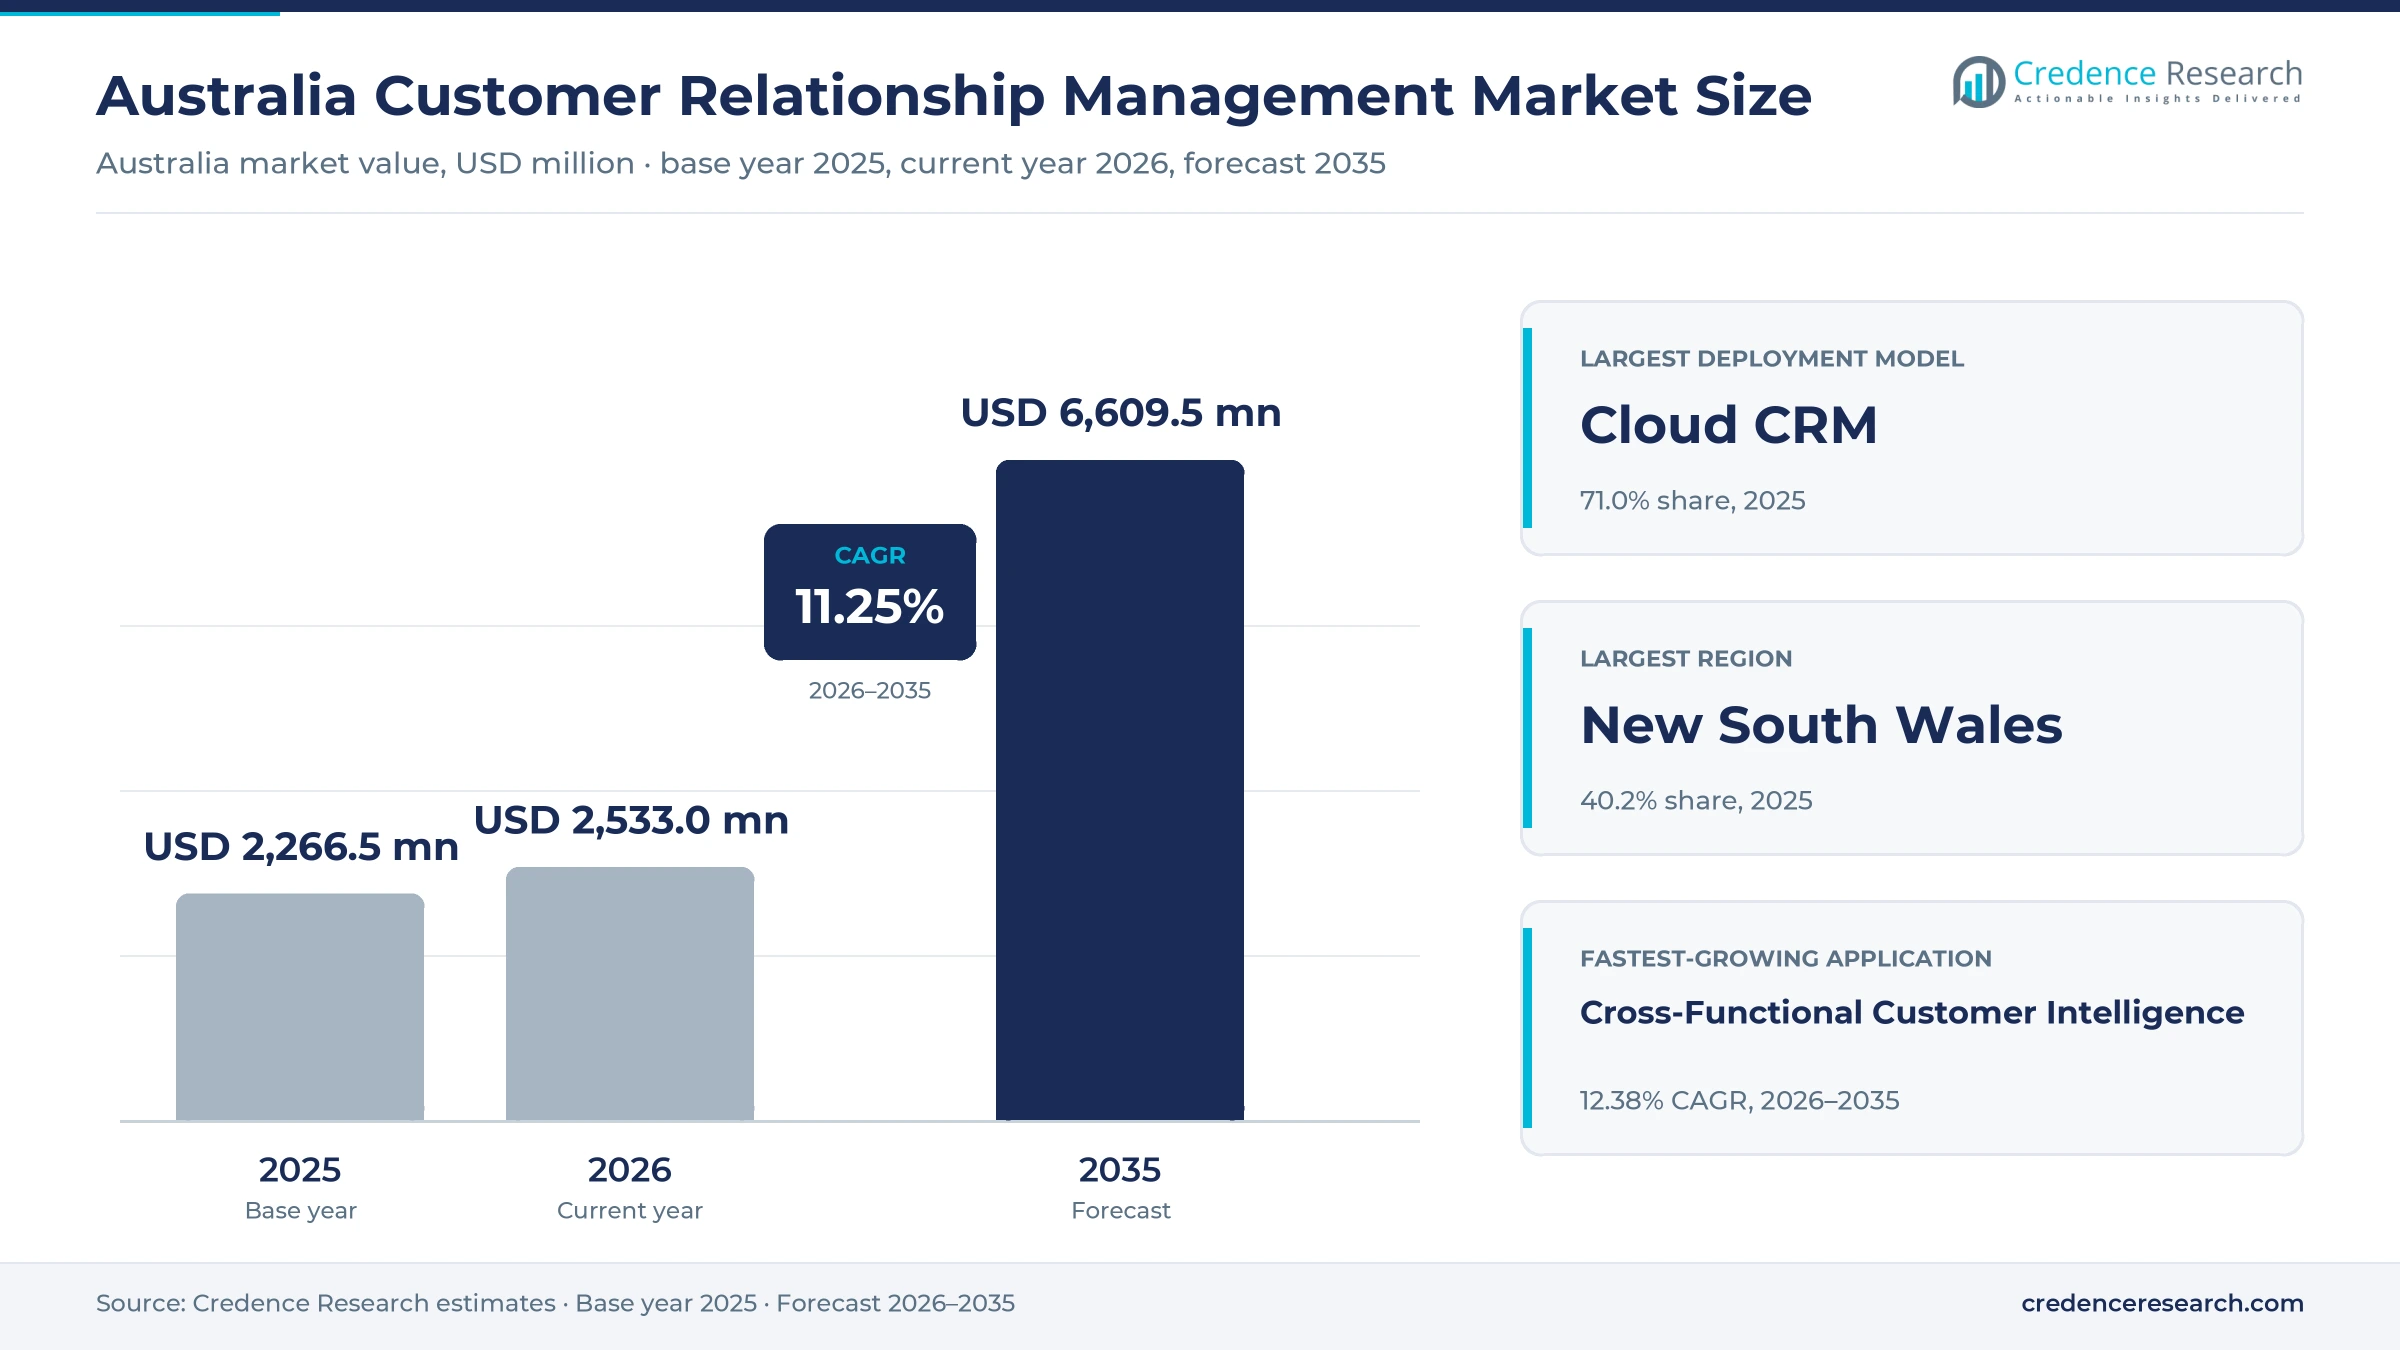
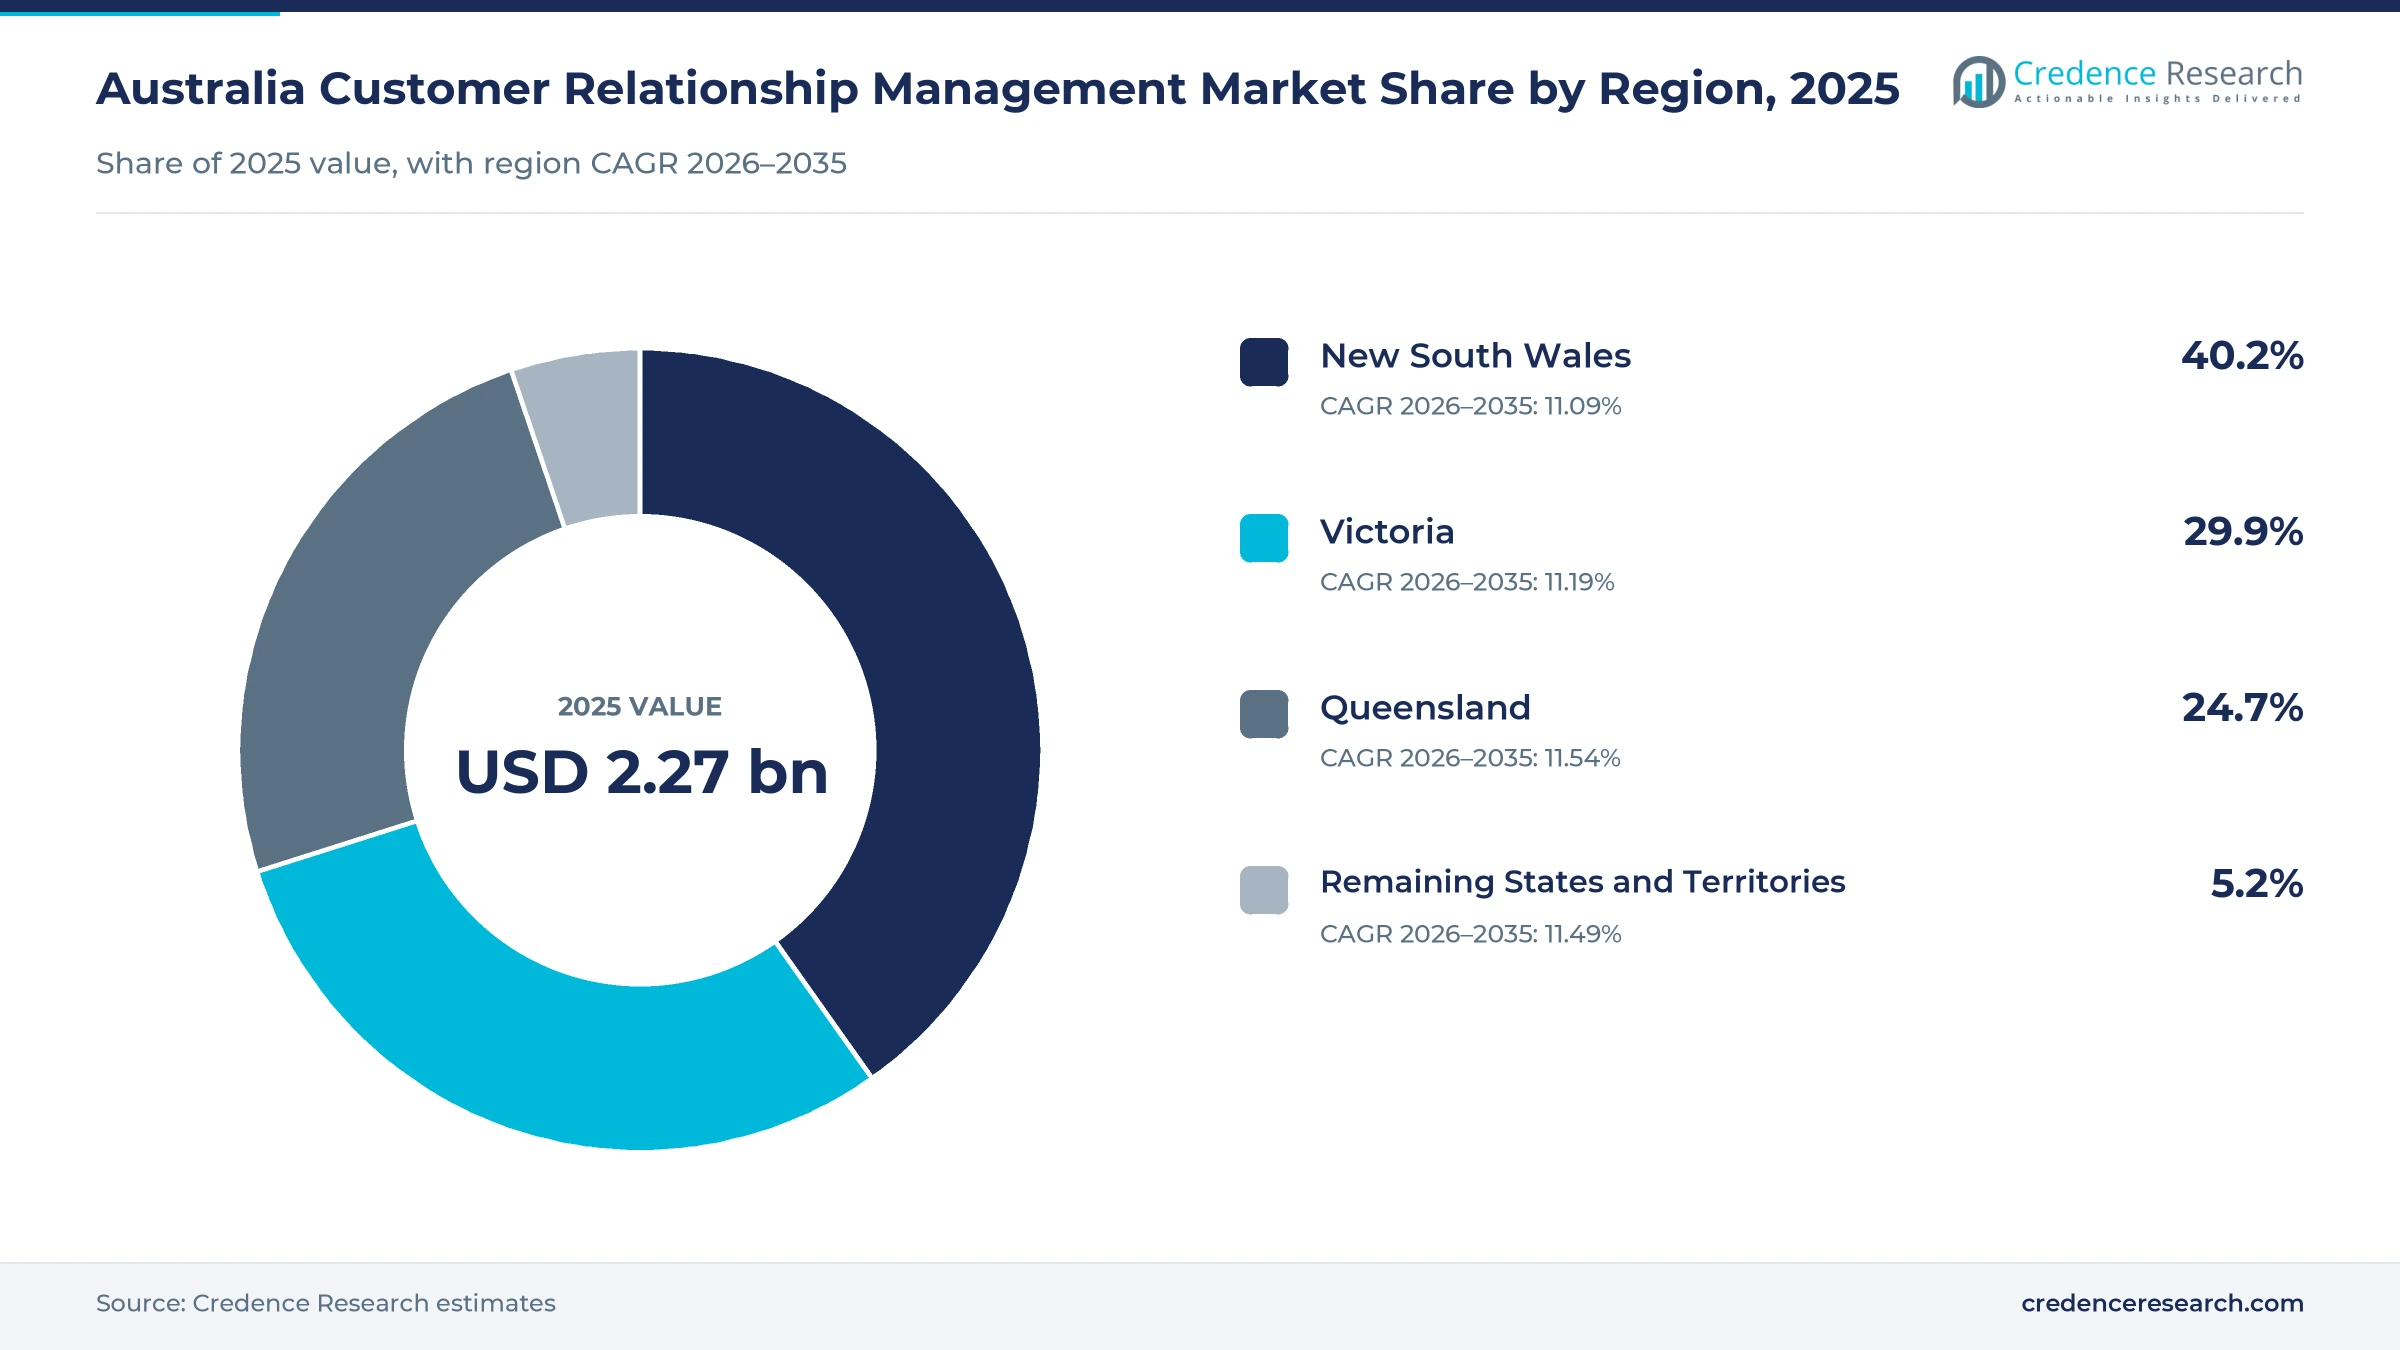
The Australia customer relationship management market was valued at USD 2.27 billion in 2025 and is projected to increase from USD 2.53 billion in 2026 to USD 6.61 billion by 2035, registering a CAGR of 11.25% during 2026–2035. Demand comes from banks, retailers, telcos, professional firms and public agencies that run sales, service and marketing on shared customer records instead of separate spreadsheets and inboxes. New South Wales held the largest regional share, 40.2% in 2025, because Sydney hosts most bank and insurer head offices and the local teams of the main software vendors. Queensland is the fastest-growing region at 11.54% a year, as its business base expands and state agencies replace older case systems. Vendors have also moved AI agents from pilots into live service work, and Telstra said in September 2026 that AI agents now handle interim services and refunds for its fixed line customers.
Which CRM spending does the Australian estimate count?
The estimate measures what Australian organizations spend on software and services that store customer records and run sales, service and marketing work on them. It covers CRM software subscriptions and licenses, implementation and integration projects, and managed administration and support contracts bought by large enterprises, medium enterprises and small businesses.
The estimate excludes contact center labor, telephony hardware, advertising spend and general office software bought without CRM modules. The value chain runs from global software vendors and cloud providers, through local systems integrators and consultancies that configure and connect the systems, to sales, service and marketing teams that use them every day.
Australia Customer Relationship Management Market Insights
- The Australia customer relationship management market was valued at USD 2.27 billion in 2025 and is projected to reach USD 6.61 billion by 2035, registering a CAGR of 11.25% during 2026–2035.
- New South Wales held a 40.2% share of 2025 value, because Sydney concentrates bank, insurer and retailer head offices and the regional teams of global CRM vendors.
- Cloud CRM led with a 71.0% share of 2025 value, because HubSpot, Microsoft and SAP now offer hosting inside Australia for buyers with data residency rules.
- Australia had 2,814,778 actively trading businesses at June 30, 2026, up 3.1% in a year, which keeps adding small firms that need shared customer records.
- Cross-functional customer intelligence grows fastest at 12.38% a year during 2026–2035, as firms link sales, service and marketing data for AI agents.
Cloud CRM software leads as managed services grow fastest
Why does CRM software hold the largest share?
Based on solution type, the market is categorized into CRM software, implementation services and managed services. CRM Software led with a 62.0% share of 2025 value, because recurring subscriptions carry most spending once a firm has moved its records onto a platform. Managed Services grow fastest at 12.01% a year, as agencies and mid-sized firms hand ongoing administration to partners that also sell cloud professional services.
How do cloud and on-premise systems split spending?
Based on deployment model, the market is categorized into cloud CRM, on-premise CRM and hybrid CRM. Cloud CRM led with a 71.0% share of 2025 value, because the main vendors now host their platforms in Australian data centers. Cloud CRM also grows fastest at 11.60% a year, while on-premise systems shrink as agencies such as Main Roads Western Australia move older installations to the cloud.
Which industries carry the largest CRM budgets?
Based on end-use industry, the market is categorized into financial services, consumer-facing industries, business-facing industries and public and social services. Financial Services led with a 31.0% share of 2025 value, because banks and insurers run large service operations under strict conduct rules. Public and Social Services grow fastest at 11.83% a year, as state governments buy CRM through standing contracts for health, housing and justice agencies.
Which CRM uses attract the most spending?
Based on application, the market is categorized into sales automation, customer service, customer marketing and cross-functional customer intelligence. Sales Automation led with a 34.0% share of 2025 value, because pipeline and account tools are usually the first modules a firm buys. Cross-Functional Customer Intelligence grows fastest at 12.38% a year, as buyers join sales, service and marketing records so AI agents can act on one view of each customer.
| Segment Group | Leading Sub-segment | Share, 2025 | Fastest-growing Sub-segment | CAGR, 2026–2035 |
|---|---|---|---|---|
| By Solution Type | CRM Software | 62.0% | Managed Services | 12.01% |
| By Deployment Model | Cloud CRM | 71.0% | Cloud CRM | 11.60% |
| By End-Use Industry | Financial Services | 31.0% | Public and Social Services | 11.83% |
| By Application | Sales Automation | 34.0% | Cross-Functional Customer Intelligence | 12.38% |
Request a Free Sample
Fill in your details and we'll send you a free sample report.
- Sample data tables & charts
- Research methodology
New firms, public sector upgrades and AI lift CRM budgets
How does a growing business base lift paid CRM uptake?
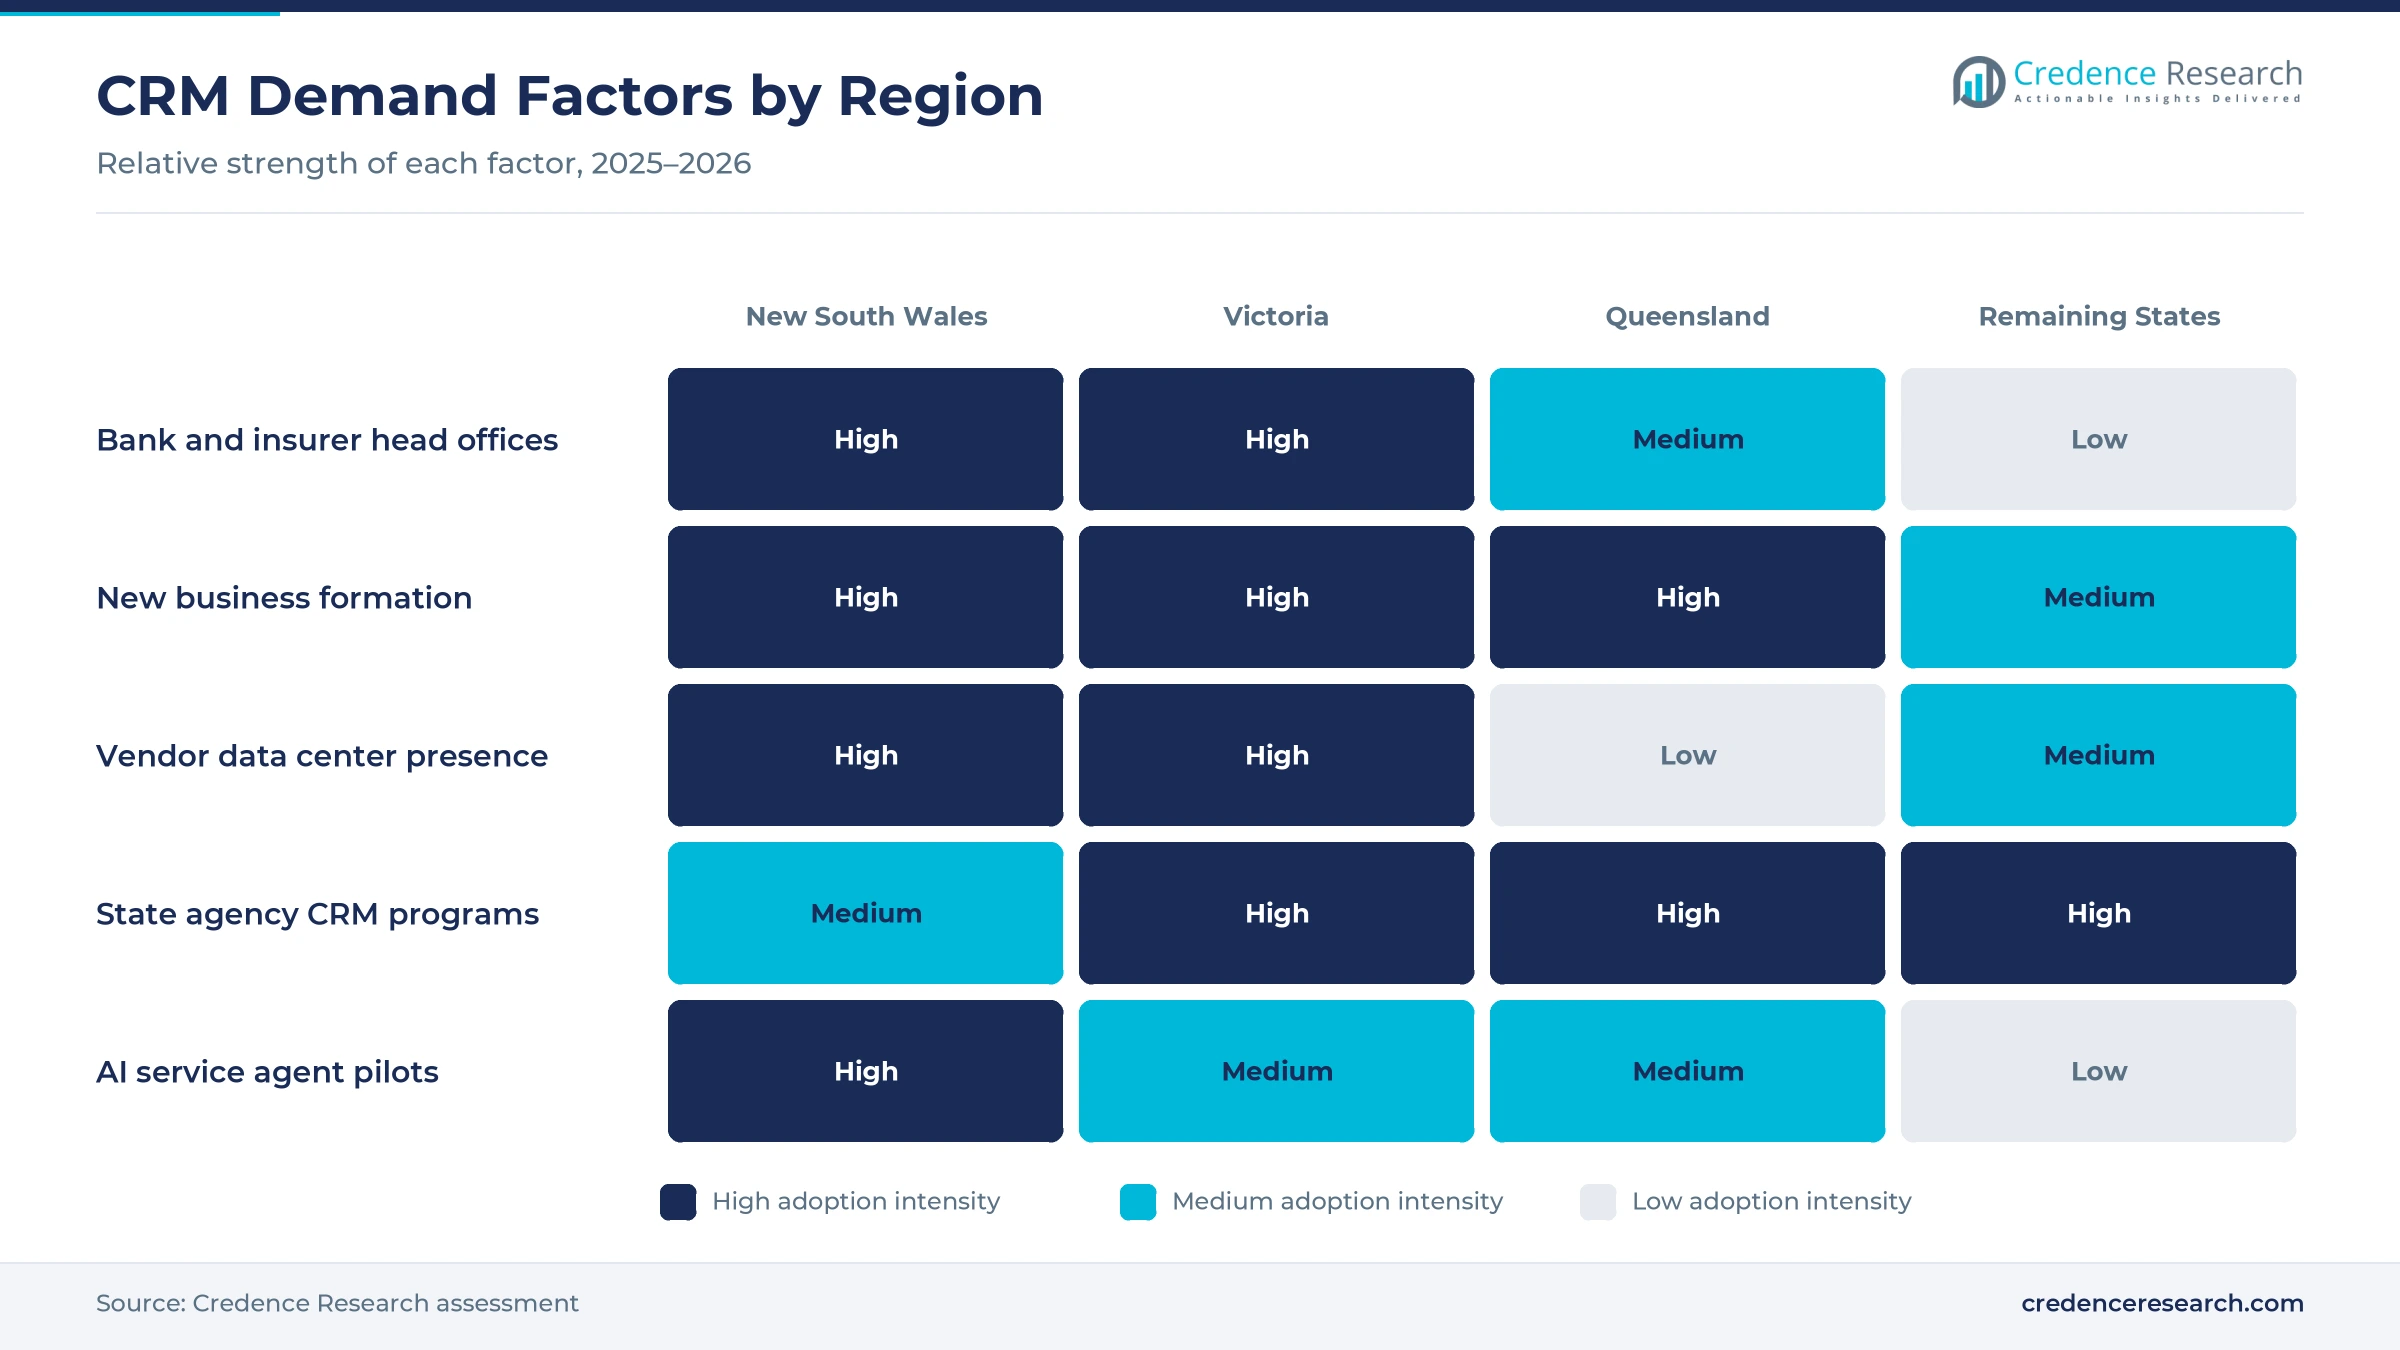
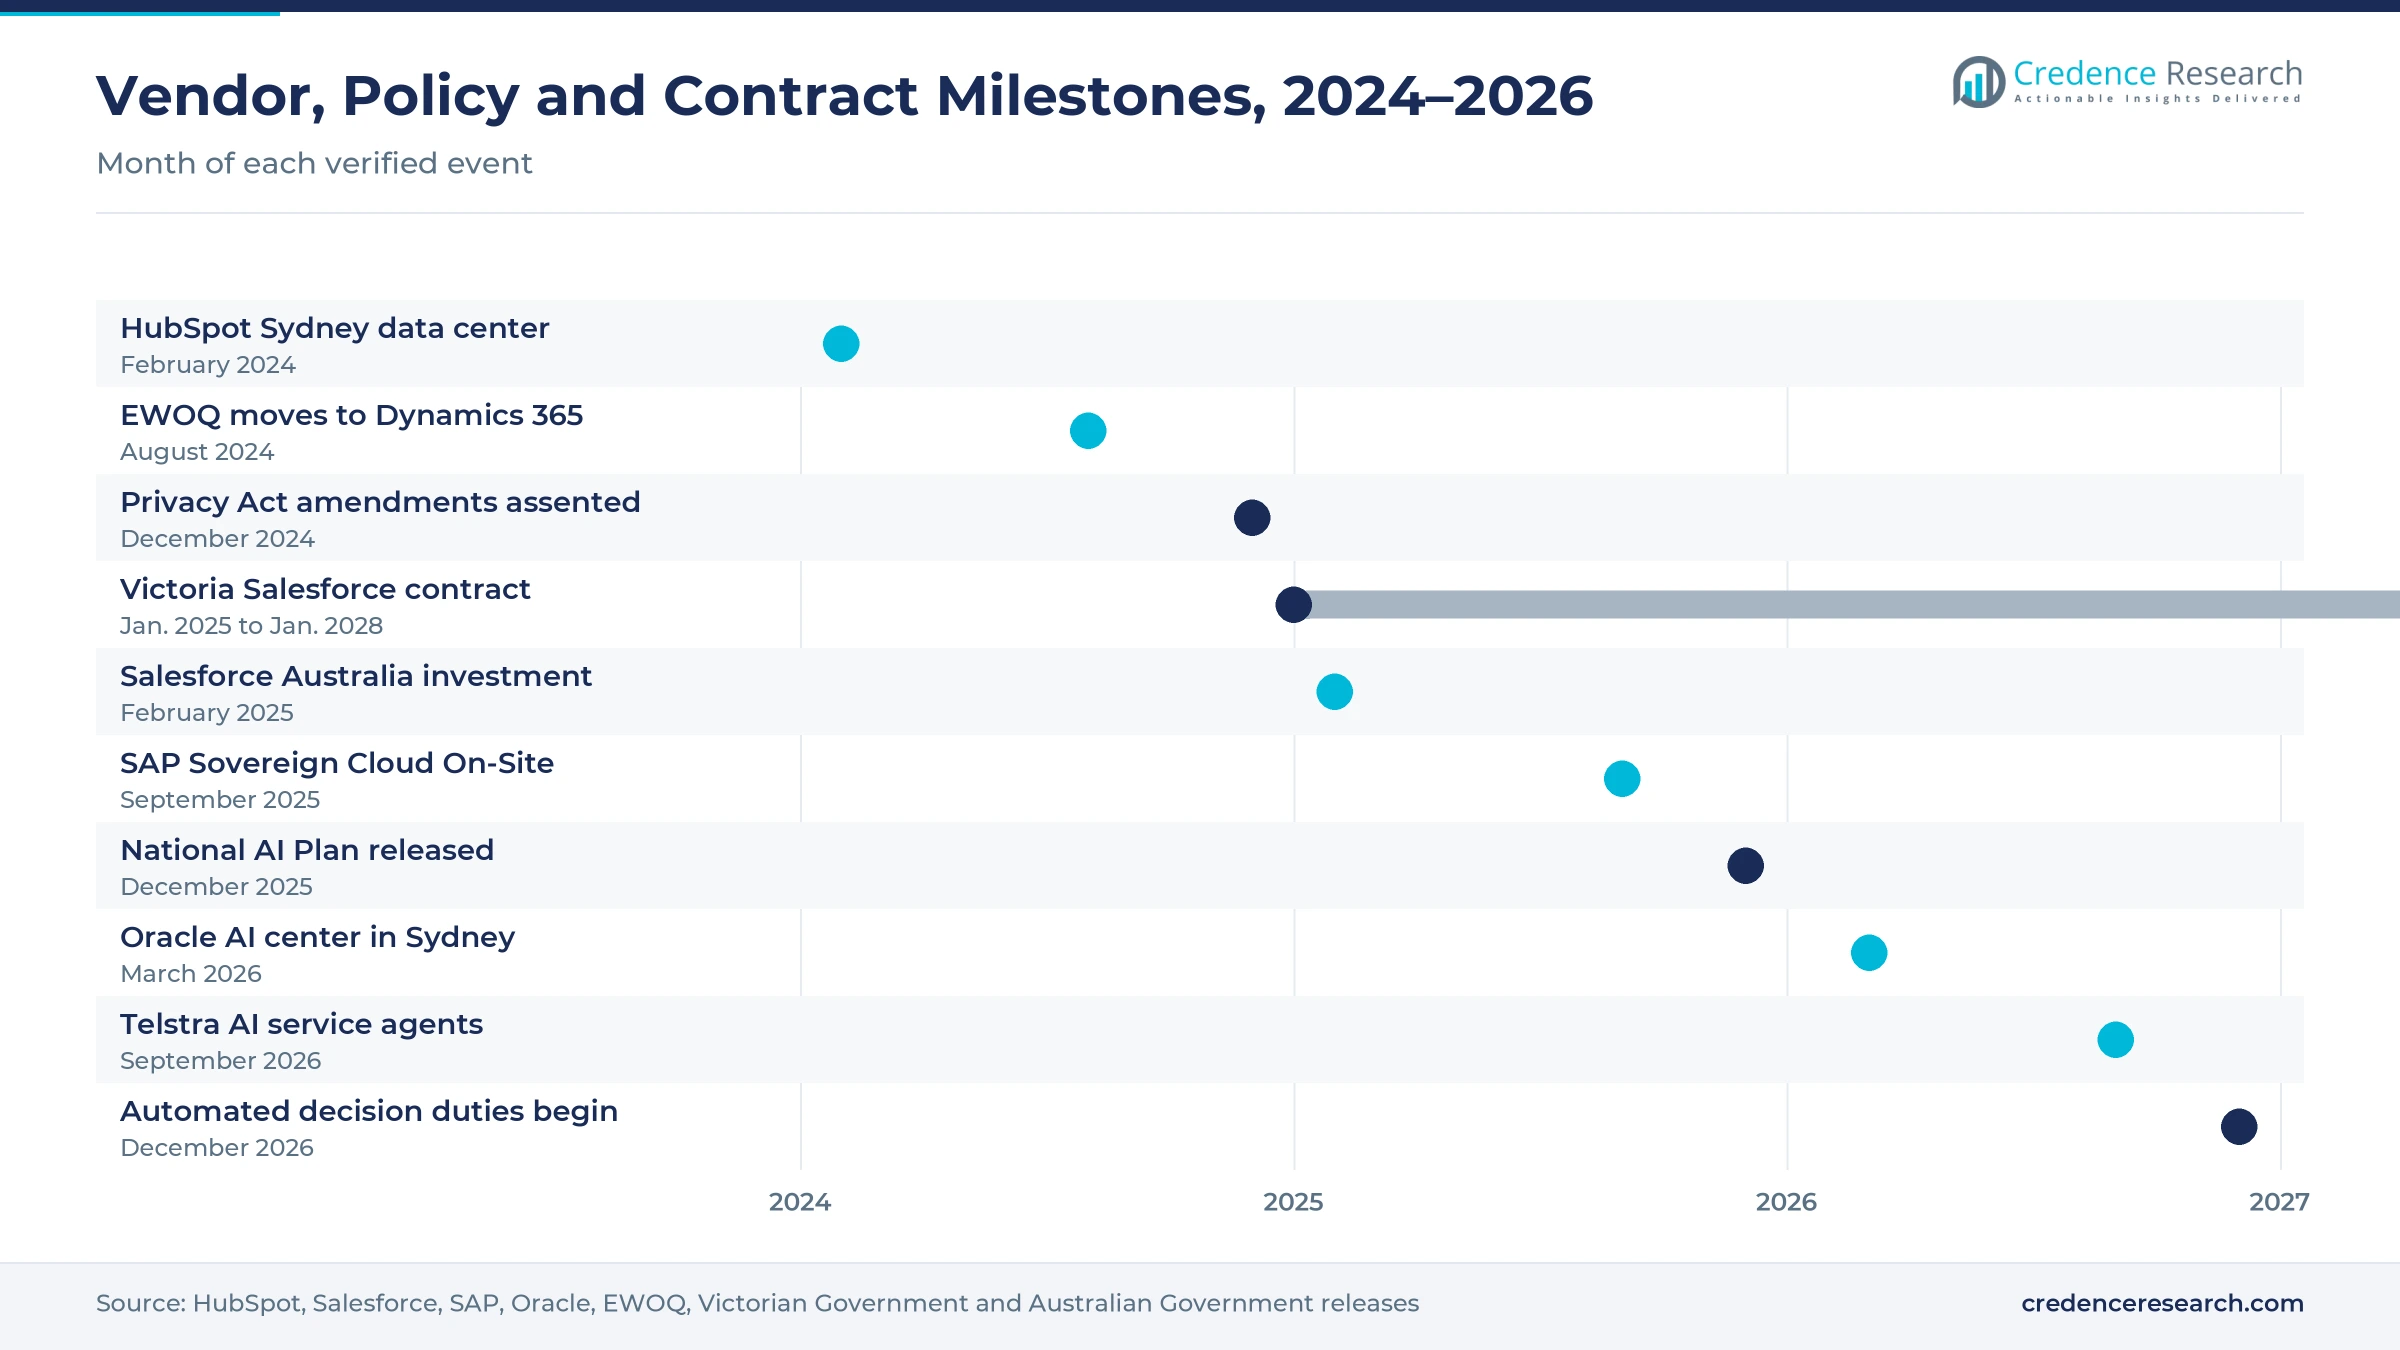
Australia keeps adding businesses, and many of them move from spreadsheets and free tools to paid CRM plans once staff begin sharing customer lists. The Australian Bureau of Statistics counted 2,814,778 actively trading businesses at June 30, 2026, an increase of 85,130, or 3.1%, during 2025-26. Employing businesses reached 996,203, which the bureau described as the first net rise in employing firms since 2021-22. HubSpot opened its first Australian data center in Sydney in February 2024, which lets smaller buyers keep CRM records onshore without running their own servers. As a result, cloud CRM held 71.0% of 2025 value, and many small firms run it beside cloud ERP platforms for quoting and invoicing.
Why do state contracts speed enterprise CRM upgrades?
State governments and large agencies are replacing older case and contact systems with cloud CRM, which creates long implementation and support programs for vendors and partners. The Victorian Government State Purchase Contract with Salesforce runs from Jan. 30, 2025, to Jan. 29, 2028, and covers sales, service, marketing, community, analytics and commerce products for all departments and agencies. South Australia signed a five-year whole-of-government agreement with Salesforce in June 2023, and SA Health, Education and Human Services already used the platform. The Energy and Water Ombudsman Queensland moved its dispute handling onto Dynamics 365 CRM on Aug. 5, 2024. Managed services, which carry this long-running support work, grow at 12.01% a year, the fastest solution rate in the market.
How do AI workflows sharpen platform competition?
CRM vendors now compete on AI tools that draft replies, route cases and complete routine tasks, which pushes buyers to upgrade licenses and data quality. About 35% of large businesses used AI in 2024-25, up from 9% in 2021-22, according to the Australian Bureau of Statistics, while adoption among financial and insurance firms rose to 24% from 1% in 2021-22. Salesforce announced a US$2.5 billion, five-year investment in Australia on Feb. 26, 2025, aimed at AI innovation and workforce skills. Oracle opened an AI Customer Excellence Centre in Sydney on March 24, 2026, to help firms adopt AI features in sales, service and marketing applications. As a result, cross-functional customer intelligence grows at 12.38% a year, the fastest application rate.
Why do privacy and spam rules push firms to governed CRM?
Firms now keep consent, contact history and data access in one audited system, because regulators have raised penalties and disclosure duties for poor data handling. The Privacy and Other Legislation Amendment Act 2024 received royal assent on Dec. 10, 2024, and its automated decision transparency duties take effect on Dec. 10, 2026, two years after assent. The Office of the Australian Information Commissioner received 1,205 data breach notifications in 2025, the highest yearly total since the scheme began in 2018. The communications regulator penalized Lululemon A$702,900 for more than 370,000 commercial emails sent without an unsubscribe option, and businesses paid over A$6.7 million in spam penalties in 18 months. In turn, financial services, facing the strictest conduct rules, held 31.0% of 2025 value, the largest end-use share.
AI service agents, onshore hosting and agencies gain ground
How is the shift to AI service agents changing CRM?
Large service operations are moving AI agents from pilots into live customer work, which raises spending on service modules and the data that feeds them. Telstra said on Sept. 22, 2026, that Salesforce AI agents now guide customers through interim services and refunds while fixed services are repaired, supporting more than 1,000 contact center staff. Commonwealth Bank said in June 2022 that its Customer Engagement Engine made more than 35 million decisions every day across its channels. Salesforce has run Agentforce learning days and hackathons in Sydney, Melbourne and Brisbane for employees of more than 270 companies. Service teams now increasingly link CRM with contact center as a service platforms.
Why is the rise of onshore hosting reshaping vendor choice?
Banks, agencies and media firms increasingly ask for customer records to stay inside Australia, and vendors have expanded local hosting to win those contracts. HubSpot launched its first Australian data center in Sydney on Feb. 5, 2024, and Fetch TV was among the first local customers to store CRM data there. Microsoft committed A$5 billion in October 2023 to grow its local data center sites from 20 to 29 across Canberra, Melbourne and Sydney. SAP announced Sovereign Cloud On-Site in Australia on Sept. 3, 2025, and plans sovereign options for SAP Business Data Cloud in 2026. This local capacity helps cloud CRM grow at 11.60% a year, the fastest deployment rate.
Why are medium-sized firms adopting CRM faster?
Firms with 20 to 199 staff have started adopting AI and digital tools quickly, which gives vendors a buyer group they have mostly reached through partners so far. About 22% of medium businesses used AI in 2024-25, compared with 3% in 2021-22, while uptake among small and micro businesses stood at about 11%, according to the Australian Bureau of Statistics. Innovation-active small businesses adopted AI at 19%, almost five times the rate of small firms without innovation activity. About 96.1% of Australians used the internet in 2024, according to the World Bank, so nearly every customer can be reached online. That reach lets vendors bundle CRM with marketing automation platforms for firms without large IT teams.
Why are state agencies widening CRM purchasing?
State and federal agencies are buying CRM for health, housing, schools and complaints, which opens multi-year work beyond the commercial sector. Salesforce said on June 25, 2025, that it would set up a Victorian Government Centre of Excellence and give free licenses to the state's 79 specialist public schools. The federal government released its National AI Plan on Dec. 2, 2025, including the GovAI platform for public services and A$29.9 million for an AI Safety Institute in 2026. Main Roads Western Australia moved its Dynamics CRM to the cloud, where more than 1,200 staff and 25 contractors record stakeholder engagement. In turn, public and social services grow at 11.83% a year, the fastest end-use rate.
Breaches, spam rules and thin skills slow CRM rollouts
How do data breaches raise the cost of CRM projects?
CRM systems hold names, contact details and service histories, which makes them a direct target for criminals. Malicious or criminal attacks caused 716 of the 1,205 breach notifications made in 2025, and financial services firms reported 157 of them. As a result, buyers must fund access controls, audits and security reviews before they widen data collection. Vendors respond with encryption, permission monitoring and onshore hosting that suit regulated buyers.
Why do spam rules complicate CRM marketing work?
Marketing teams that send order, delivery and loyalty messages from CRM tools face strict spam rules on promotional content. The communications regulator treats any message with sales content as commercial, which means it must carry a working unsubscribe option. In turn, retailers must review message templates and consent records before they automate campaigns. Vendors respond with consent fields, preference centers and audit logs built into their marketing modules.
How does slow uptake among small firms limit growth?
Many small and micro businesses still run sales from email, phone and spreadsheets because they lack time and staff to configure CRM. Only about 11% of small and micro businesses used AI in 2024-25, according to the Australian Bureau of Statistics, well below the rate for large firms. As a result, advanced CRM features may sell slowly outside larger buyers. Vendors respond with free entry tiers, templates and partner-led setup packages.
Why do AI accountability concerns slow automation?
Firms want people to stay responsible for customer decisions, which slows full automation of service and sales tasks. Telstra said in its September 2026 release that its people remain accountable and core to customer service delivery even as AI agents take on routine work. In turn, buyers often limit agents to narrow tasks and keep human review steps. Vendors respond with approval workflows, decision logs and tools that explain why an agent took an action.
New South Wales leads as Queensland grows fastest
| Region | Value, 2025 (USD billion) | Share, 2025 | CAGR, 2026–2035 |
|---|---|---|---|
| New South Wales | 0.91 | 40.2% | 11.09% |
| Victoria | 0.68 | 29.9% | 11.19% |
| Queensland | 0.56 | 24.7% | 11.54% |
| Remaining States and Territories | 0.12 | 5.2% | 11.49% |
Why do Sydney head offices give the state the lead?
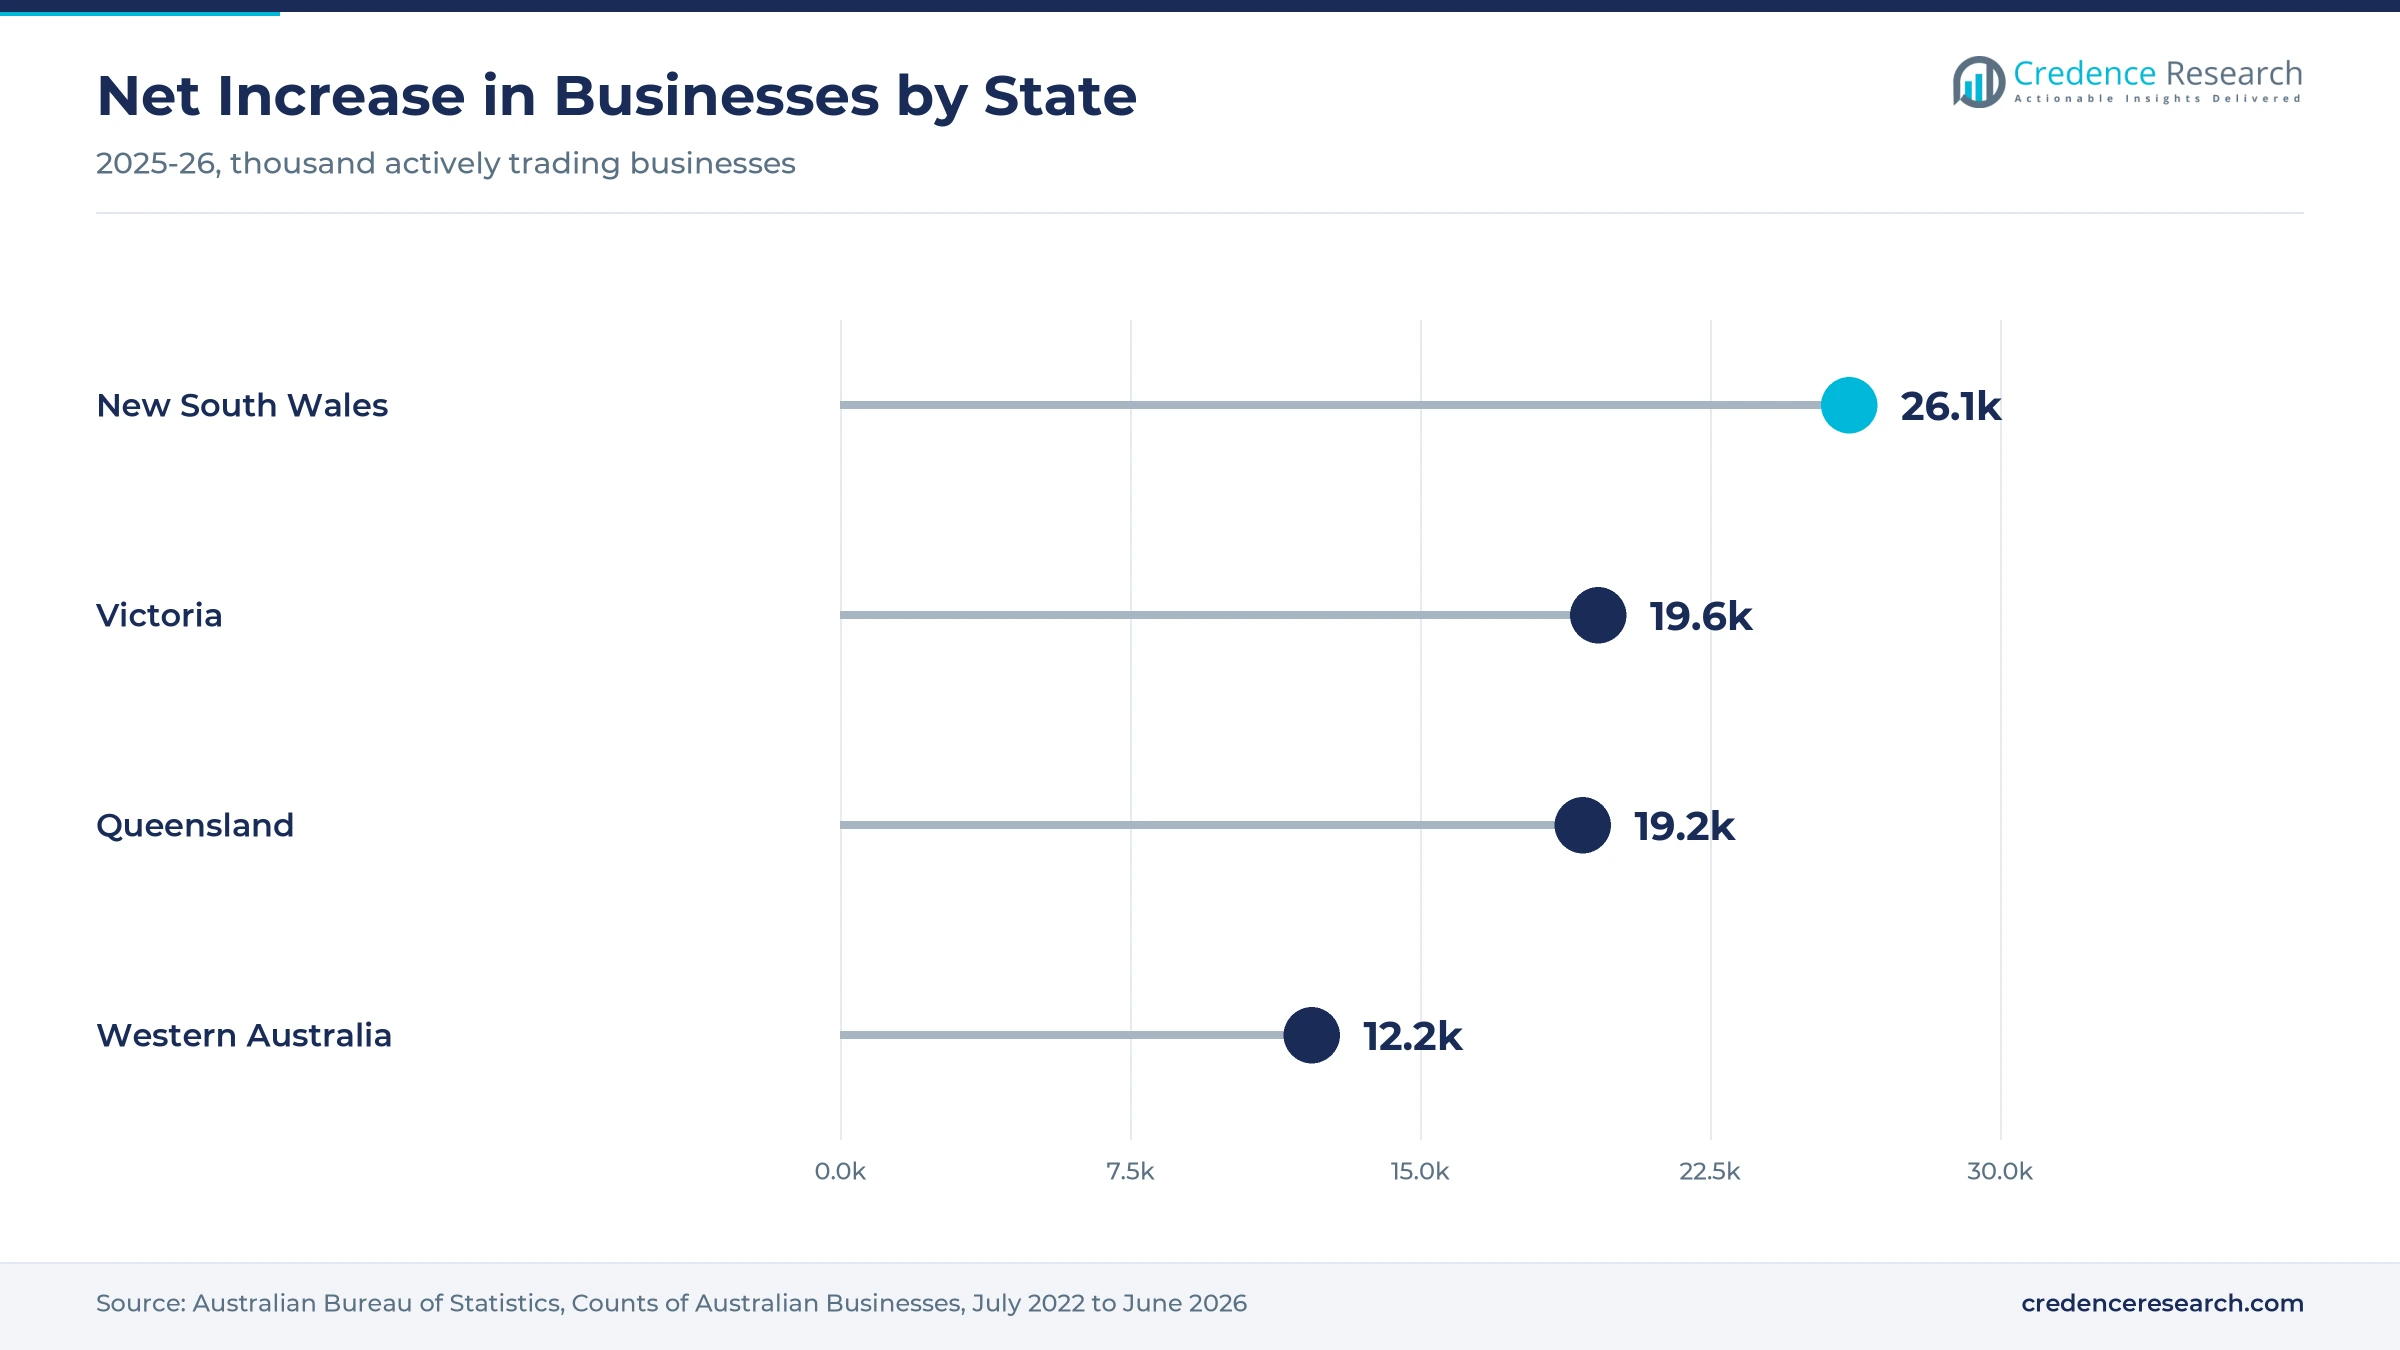
New South Wales held a 40.2% share of 2025 value and grows at 11.09% a year, because Sydney hosts the head offices of the largest banks, insurers and telcos. The state added 26,057 businesses in 2025-26, the largest net increase of any state or territory, according to the Australian Bureau of Statistics. HubSpot runs its Australian data center in Sydney, and Oracle opened its AI Customer Excellence Centre in the city in March 2026. Most large enterprise CRM projects therefore still start in the state.
How does Victoria build on state contracts and cloud sites?
Victoria held a 29.9% share of 2025 value and grows at 11.19% a year, because Melbourne hosts large retail, insurance and telecom employers. The state added 19,581 businesses in 2025-26, the second-largest net increase. Its State Purchase Contract with Salesforce lets every department and agency buy sales, service and marketing products to January 2028. Microsoft also named Melbourne among the cities in its October 2023 data center expansion. Victorian agencies and firms therefore gain local hosting and simpler purchasing.
Why does Queensland lead growth in CRM spending?
Queensland held a 24.7% share of 2025 value and grows fastest at 11.54% a year, because its business base is expanding almost as quickly as the Victorian one from a smaller starting point. The state added 19,244 businesses in 2025-26, according to the Australian Bureau of Statistics. The Energy and Water Ombudsman Queensland moved its case handling onto Dynamics 365 CRM in August 2024, and Salesforce held Agentforce learning days in Brisbane. As a result, state agencies and service firms add new CRM projects.
How do the remaining states and territories add demand?
Western Australia, South Australia, Tasmania and the two territories held 5.2% of 2025 value and grow at 11.49% a year, because fewer enterprise head offices sit outside the three largest states. Western Australia added 12,248 businesses in 2025-26, the largest percentage increase in the country at 4.6%. South Australia has a whole-of-government agreement with Salesforce, and Microsoft named Canberra among its new data center locations. In turn, agencies in these zones add steady CRM demand.
Vendor investments, state contracts and privacy rules
| Development | Status and market relevance |
|---|---|
| In February 2024, HubSpot launched its first Australian data center in Sydney, with Fetch TV among the first local CRM customers. | Brings onshore hosting to smaller buyers |
| In January 2025, the Victorian Government State Purchase Contract with Salesforce began, running to January 2028 for all departments and agencies. | Simplifies agency CRM purchasing |
| In February 2025, Salesforce announced a US$2.5 billion, five-year investment in Australia at Agentforce World Tour Sydney. | Expands local AI and skills support |
| In September 2025, SAP announced Sovereign Cloud On-Site in Australia and set plans for sovereign SAP Business Data Cloud in 2026. | Widens sovereign options for regulated buyers |
| In September 2026, Telstra said Salesforce AI agents were handling interim services and refunds for fixed line customers. | Shows AI agents in live service work |
AI agents, onshore clouds and consent tools shape buying
- AI service agents check eligibility, apply refunds and update records, as Telstra describes for its interim service agent, which frees contact center staff for complex cases.
- Onshore cloud hosting keeps customer records inside Australia, which suits banks, agencies and media firms with residency rules and shortens security reviews for new projects.
- Consent and preference tools record what each person has agreed to receive, which supports spam and privacy compliance when marketing teams automate campaigns.
- Permission monitoring flags risky user access and settings across the CRM, which reduces the chance of a data breach, which shortens manual access audits for administrators.
Need a Custom Version of This Report?
Tailor the scope, geography, or segments to your exact requirements.
- Custom geography or segment scope
- Direct access to our analyst team
Global suites and local partners compete for buyers
Competition centers on global CRM suites that combine sales, service, marketing and AI tools, supported by local systems integrators. Salesforce, which has operated in Australia since 2004 and employs more than 2,400 people locally, holds state purchasing agreements in Victoria and South Australia and supplies AI agents to Telstra. Microsoft sells Dynamics 365 to agencies such as the Energy and Water Ombudsman Queensland and Main Roads Western Australia, backed by its local data center expansion. HubSpot targets small and mid-sized firms and hosts their data in Sydney. Oracle supports AI adoption in its Fusion applications through a Sydney center, while SAP, with more than 1,400 local staff, sells through its Australian sovereign cloud. Rivals compete on onshore hosting, AI features, partner networks and price.
Which software vendors lead Australian CRM?
| Company | Type | Role in the market |
|---|---|---|
| Salesforce | CRM and AI platform vendor | State purchasing agreements and AI agents at Telstra |
| Microsoft | Cloud and business software vendor | Dynamics 365 CRM for state agencies |
| HubSpot | CRM platform vendor | Sydney data center for small and mid-sized buyers |
| Oracle | Cloud and applications vendor | AI Customer Excellence Centre in Sydney |
| SAP | Enterprise software vendor | Sovereign cloud options in Australia |
Credence Research view on Australian CRM spending
Credence Research's view is that Australian CRM spending will grow faster than most business software budgets, because new firms, state agency upgrades and AI service tools all add demand at once. Cloud software keeps the largest share, while managed services grow faster as buyers without large IT teams outsource administration. Banks remain the largest buyers, yet public and social services add the fastest growth through standing state contracts. Vendors that combine onshore hosting, consent controls and dependable AI agents should gain the most share by 2035.
Business counts, AI use and vendor data behind the model
The report uses 2025 as the base year on a calendar basis, and market values come from the Credence Research model. That model combines ABS business count and technology statistics, OAIC and communications regulator releases, state government purchasing records, and vendor announcements on local hosting and AI products. Segment splits and zone growth rates are Credence Research estimates. Sources used are statistics agency and regulator publications, government releases, company releases and international agency data, and no interviews or surveys were used.
AI service work and agency upgrades carry demand to 2035
The Australia customer relationship management market is expected to reach USD 6.61 billion by 2035, an 11.25% CAGR during 2026–2035, as firms and agencies run more sales, service and marketing work on shared customer records. Growth should be strongest in managed services, cloud deployment, public and social services, cross-functional customer intelligence and Queensland, because these areas gain most from AI agents and agency upgrades. Data breaches, spam rules and slow uptake among small firms could hold back some projects, while onshore hosting should support regulated buyers through the forecast period.
Frequently Asked Questions
How big is the Australia customer relationship management market?
Which deployment model leads the market?
Which region leads the market?
How many businesses operate in Australia?
How do privacy reforms affect CRM buyers?
How are AI agents used in Australian CRM?
Who are the leading companies in the market?
What are the main challenges for the market?
Table of Content
Chapter 1 Market Segmentation
- 1.1 Segmentation Framework
- 1.1.1 Product and Service Classification
- 1.1.2 Application and End-Use Classification
- 1.1.3 Technology and Solution Classification
- 1.1.4 Customer and Distribution Channel Classification
- 1.1.5 Geographic Segmentation
- 1.1.6 Market Segment Definitions and Boundaries
- 1.2 By Solution Type
- 1.2.1 CRM Software
- 1.2.2 Implementation Services
- 1.2.3 Managed Services
- 1.3 By Deployment Model
- 1.3.1 Cloud CRM
- 1.3.2 On-Premise CRM
- 1.3.3 Hybrid CRM
- 1.4 By End-Use Industry
- 1.4.1 Financial Services
- 1.4.2 Consumer-Facing Industries
- 1.4.3 Business-Facing Industries
- 1.4.4 Public and Social Services
- 1.5 By Application
- 1.5.1 Sales Automation
- 1.5.2 Customer Service
- 1.5.3 Customer Marketing
- 1.5.4 Cross-Functional Customer Intelligence
Chapter 2 Introduction
- 2.1 Report Objectives and Scope
- 2.2 Product Definition and Industry Terminology
- 2.3 Market Inclusions and Exclusions
- 2.4 Research Process
- 2.4.1 Primary Research and Expert Interviews
- 2.4.2 Secondary Research and Source Review
- 2.4.3 Top-Down and Bottom-Up Estimation
- 2.4.4 Data Triangulation and Verification
- 2.5 Market Size Measurement Basis
- 2.5.1 2025: USD 2.27 billion → 2035: USD 6.61 billion
- 2.6 Historical and Forecast Reference Periods
- 2.6.1 Historical Period: 2018-2025
- 2.6.2 Base Year: 2025
- 2.6.3 Forecast Period: 2025-2035
- 2.7 Research Assumptions and Limitations
Chapter 3 Executive Summary
- 3.1 Market Snapshot and Key Findings
- 3.2 Base-Year Market Size, 2025
- 3.3 Forecast Market Size, 2035
- 3.4 Revenue and Volume Growth Outlook
- 3.5 Key Demand and Supply Indicators
- 3.6 Leading Market Segments
- 3.7 Fastest-Growing Market Opportunities
- 3.8 Regional Performance Highlights
- 3.9 Technology and Industry Transformation
- 3.10 Competitive Landscape Summary
- 3.11 Analyst View and Strategic Implications
Chapter 4 Australia Customer Relationship Management Market Trends and Developments
- 4.1 Historical Industry Development, 2018-2025
- 4.2 Recent Market Trends and Developments
- 4.3 Demand and Customer Behavior Trends
- 4.4 Technology and Product Innovation
- 4.5 Artificial Intelligence, Automation and Digitalization
- 4.6 Local Manufacturing and Supply Chain Realignment
- 4.7 Industry Partnerships, Mergers and Acquisitions
- 4.8 Sustainability and Circular Economy Developments
- 4.9 Government and Private Sector Investment Trends
- 4.10 Emerging Business Models and Commercialization
- 4.11 Industry Developments and Announcements
Chapter 5 Australia Customer Relationship Management Market Supply and Demand Analysis
- 5.1 Demand Trend and Consumption Analysis, 2018-2025
- 5.2 Demand Forecast, 2025-2035
- 5.3 Supply Chain Structure and Procurement Trends
- 5.4 Supply-Demand Gap and Bottlenecks
- 5.5 Import Dependence and Sourcing Structure
- 5.6 Regional Supply and Demand Concentration
Chapter 6 Australia Customer Relationship Management Market Pricing Analysis
- 6.1 Pricing Structure and Measurement
- 6.2 Historical Pricing Trends, 2018-2025
- 6.3 Pricing Outlook, 2025-2035
- 6.4 Pricing by Product and Market Segment
- 6.5 Geographic Pricing Differences
- 6.6 Key Input, Energy, Labor and Logistics Costs
- 6.7 Contract Pricing and Purchasing Models
- 6.8 Pricing Sensitivity and Competitive Positioning
- 6.9 Price, Margin and Profitability Implications
Chapter 7 Australia Customer Relationship Management Market Dynamics
- 7.1 Market Growth Drivers
- 7.1.1 Demand-Side Drivers
- 7.1.2 Technology and Innovation Drivers
- 7.1.3 Infrastructure and Investment Drivers
- 7.1.4 Regulatory and Policy Drivers
- 7.2 Market Restraints
- 7.2.1 Cost and Affordability Constraints
- 7.2.2 Technology and Adoption Barriers
- 7.2.3 Supply Chain and Operational Constraints
- 7.3 Market Challenges
- 7.3.1 Competitive Pressure and Margin Erosion
- 7.3.2 Skills, Infrastructure and Implementation Gaps
- 7.4 Emerging Market Opportunities
- 7.5 Market Dynamics Impact and Time-Horizon Assessment
Chapter 8 Australia Customer Relationship Management Value Chain Analysis
- 8.1 Industry Value Chain Overview
- 8.2 Upstream Suppliers and Critical Inputs
- 8.3 Technology and Component Providers
- 8.4 Manufacturing or Service Delivery
- 8.5 Distribution, Channel Partners and Integrators
- 8.6 Downstream Applications and End Users
- 8.7 Value Addition and Profit Pools
- 8.8 Vertical Integration and Outsourcing
- 8.9 Supplier Concentration and Risk
- 8.10 Supply Chain Localization and Resilience
Chapter 9 Australia Customer Relationship Management Market Regulations and Policies
- 9.1 Relevant Laws, Standards and Compliance Frameworks
- 9.2 Product, Service, Safety and Quality Requirements
- 9.3 Government Policies, Incentives and Subsidies
- 9.4 Imports, Exports and Trade Barriers
- 9.5 Public Procurement and Local Content Requirements
- 9.6 Data Protection, AI and Cybersecurity Compliance
- 9.7 Upcoming Policy Changes and Market Implications
Chapter 10 Australia Customer Relationship Management Market Hotspots and Opportunities
- 10.1 Market Opportunity Mapping and Growth Hotspots
- 10.2 High-Growth Applications and Customer Groups
- 10.3 Underserved Markets and White-Space Opportunities
- 10.4 Emerging Technology and Product Opportunities
- 10.5 New Capacity and Investment Hotspots
- 10.6 Market Entry and Expansion Opportunities
- 10.7 Distribution and Partnership Opportunities
- 10.8 Near-Term and Long-Term Commercial Potential
- 10.9 Opportunity Attractiveness and Execution Risks
Chapter 11 Australia Customer Relationship Management Market Outlook, 2025-2035
- 11.1 Market Size and Analysis
- 11.1.1 Revenue (Market Measurement: 2025: USD 2.27 billion → 2035: USD 6.61 billion)
- 11.1.2 Historical Market Size, 2018-2025
- 11.1.3 Base-Year Market Size, 2025
- 11.2 Market Forecast, 2025-2035
- 11.2.1 Revenue Forecast to 2035
- 11.2.2 CAGR and Year-on-Year Growth
- 11.2.3 Incremental Revenue Opportunity
- 11.3 Forecast Assumptions and Scenario Analysis
- 11.3.1 Base-Case Forecast
- 11.3.2 Optimistic and Conservative Scenarios
- 11.3.3 Technology, Pricing and Policy Sensitivities
- 11.4 Market Attractiveness and Growth Outlook
Chapter 12 Australia Customer Relationship Management Market Segmentation and Outlook
- 12.1 Segmentation Summary and Market Shares, 2025
- 12.2 Largest and Fastest-Growing Segments
- 12.3 By Solution Type - Market Size and Forecast, 2025-2035
- 12.3.1 Segment Definition and Scope
- 12.3.2 Historical Market Size, 2018-2025
- 12.3.3 Revenue Forecast, 2025-2035
- 12.3.4 Base-Year Market Share, 2025
- 12.3.5 Segment CAGR and Growth Drivers
- 12.3.6 Subsegment Market Size and Forecast
- 12.3.6.1 CRM Software
- 12.3.6.2 Implementation Services
- 12.3.6.3 Managed Services
- 12.3.7 Subsegment Pricing and Adoption Trends
- 12.3.8 Leading Suppliers and Competition
- 12.3.9 Regional Demand and Opportunities
- 12.4 By Deployment Model - Market Size and Forecast, 2025-2035
- 12.4.1 Segment Definition and Scope
- 12.4.2 Historical Market Size, 2018-2025
- 12.4.3 Revenue Forecast, 2025-2035
- 12.4.4 Base-Year Market Share, 2025
- 12.4.5 Segment CAGR and Growth Drivers
- 12.4.6 Subsegment Market Size and Forecast
- 12.4.6.1 Cloud CRM
- 12.4.6.2 On-Premise CRM
- 12.4.6.3 Hybrid CRM
- 12.4.7 Subsegment Pricing and Adoption Trends
- 12.4.8 Leading Suppliers and Competition
- 12.4.9 Regional Demand and Opportunities
- 12.5 By End-Use Industry - Market Size and Forecast, 2025-2035
- 12.5.1 Segment Definition and Scope
- 12.5.2 Historical Market Size, 2018-2025
- 12.5.3 Revenue Forecast, 2025-2035
- 12.5.4 Base-Year Market Share, 2025
- 12.5.5 Segment CAGR and Growth Drivers
- 12.5.6 Subsegment Market Size and Forecast
- 12.5.6.1 Financial Services
- 12.5.6.2 Consumer-Facing Industries
- 12.5.6.3 Business-Facing Industries
- 12.5.6.4 Public and Social Services
- 12.5.7 Subsegment Pricing and Adoption Trends
- 12.5.8 Leading Suppliers and Competition
- 12.5.9 Regional Demand and Opportunities
- 12.6 By Application - Market Size and Forecast, 2025-2035
- 12.6.1 Segment Definition and Scope
- 12.6.2 Historical Market Size, 2018-2025
- 12.6.3 Revenue Forecast, 2025-2035
- 12.6.4 Base-Year Market Share, 2025
- 12.6.5 Segment CAGR and Growth Drivers
- 12.6.6 Subsegment Market Size and Forecast
- 12.6.6.1 Sales Automation
- 12.6.6.2 Customer Service
- 12.6.6.3 Customer Marketing
- 12.6.6.4 Cross-Functional Customer Intelligence
- 12.6.7 Subsegment Pricing and Adoption Trends
- 12.6.8 Leading Suppliers and Competition
- 12.6.9 Regional Demand and Opportunities
- 12.7 Segment Growth Comparison
- 12.8 Segment Attractiveness and Priority Matrix
Chapter 13 Australia Customer Relationship Management End-Use and Application Market Outlook
- 13.1 End-Use Industry and Customer Demand Structure
- 13.2 Leading Applications and Customer Groups
- 13.3 End-Use Market Size, Share and Forecast
- 13.4 Major End-Use Industry Deep Dives
- 13.4.1 Customer Requirements and Use Cases
- 13.4.2 Demand and Replacement Cycles
- 13.4.3 Technical and Regulatory Considerations
- 13.4.4 Purchasing and Procurement Models
- 13.4.5 Leading Vendors and Distribution Channels
- 13.4.6 Forecast and Commercial Opportunities
- 13.5 Emerging Applications and Cross-Segment Demand
- 13.6 End-Use Industry Investment Priorities
Chapter 14 Australia Customer Relationship Management Geographic Market Outlook, 2025-2035
- 14.1 Domestic Market Distribution and Demand Clusters
- 14.2 State- or Province-Wise Market Size and Forecast, 2025-2035
- 14.3 City and Metropolitan Market Outlook
- 14.4 Industrial, Manufacturing and Commercial Clusters
- 14.5 Geographic Concentration of Key End Users
- 14.6 Local Pricing and Purchasing Differences
- 14.7 Domestic Production Facilities and Capacity Map
- 14.8 Local Infrastructure and Project Pipeline
- 14.9 State-Level Policy and Incentive Differences
- 14.10 Subnational Investment Hotspots and Opportunities
- 14.11 Distribution and Logistics Networks
- 14.12 Domestic Competitive Footprint
Chapter 15 Australia Customer Relationship Management Technology, Innovation and Sustainability Outlook
- 15.1 Technology Landscape and Maturity
- 15.2 Product, Process and Service Innovation
- 15.3 AI, Automation and Digital Tools in the Industry
- 15.4 Technology Adoption and Performance Benchmarking
- 15.5 Innovation Pipeline and R&D Investment
- 15.6 Patent and Intellectual Property Trends
- 15.7 Energy Efficiency and Resource Management
- 15.8 Sustainability, Recycling and Circularity
- 15.9 Technology Roadmap, 2025-2035
- 15.10 Risks of Obsolescence and Technology Substitution
Chapter 16 Australia Customer Relationship Management Market Key Strategic Imperatives
- 16.1 Growth and Market Entry Priorities
- 16.2 High-Return Products and Segments
- 16.3 Pricing, Profitability and Cost Optimization
- 16.4 Technology Investment and Product Differentiation
- 16.5 Supply Chain Localization and Resilience
- 16.6 Distribution and Customer Acquisition
- 16.7 Partnership, Acquisition and Capacity Strategy
- 16.8 Regional Expansion Priorities
- 16.9 Short-, Medium- and Long-Term Actions
Chapter 17 Competition Outlook
- 17.1 Industry Competition Characteristics
- 17.2 Market Structure and Concentration
- 17.3 Market Share and Competitive Positioning, 2025
- 17.4 Company-Wise Revenue and Product Benchmarking
- 17.5 Production and Service Capacity Benchmarking
- 17.6 Technology, Pricing and Differentiation
- 17.7 Regional Footprint and Distribution Strength
- 17.8 Mergers, Acquisitions and Strategic Alliances
- 17.9 New Entrants and Competitive Threats
- 17.10 Porter's Five Forces and Industry Attractiveness
- 17.11 Competitive Outlook, 2025-2035
Chapter 18 Company Profiles
- 18.1 Company Coverage and Selection Criteria
- 18.2 Salesforce
- 18.2.1 Business Description
- 18.2.2 Company Ownership and Geographic Presence
- 18.2.3 Product and Service Portfolio
- 18.2.4 Manufacturing and Operating Footprint
- 18.2.5 Financial Performance and Investment
- 18.2.6 Market Share and Competitive Position
- 18.2.7 Technology and Innovation Capabilities
- 18.2.8 Strategic Alliances or Partnerships
- 18.2.9 Recent Developments
- 18.2.10 Growth Strategy and Outlook
- 18.3 Microsoft
- 18.4 HubSpot
- 18.5 Oracle
- 18.6 SAP
- 18.7 Other Relevant Market Participants
Note: Every listed company is profiled on the structure shown under the first company. The company list is preliminary and may change based on research findings, market developments, data availability and client requirements.
Chapter 19 Disclaimer
- 19.1 Research and Forecast Disclaimer
- 19.2 Data Source and Estimation Limitations
Note: The depth of individual sections depends on data availability for this market. Volume, capacity, trade and other unit-based metrics are included where applicable.

