
Small firms move core finance and operations online
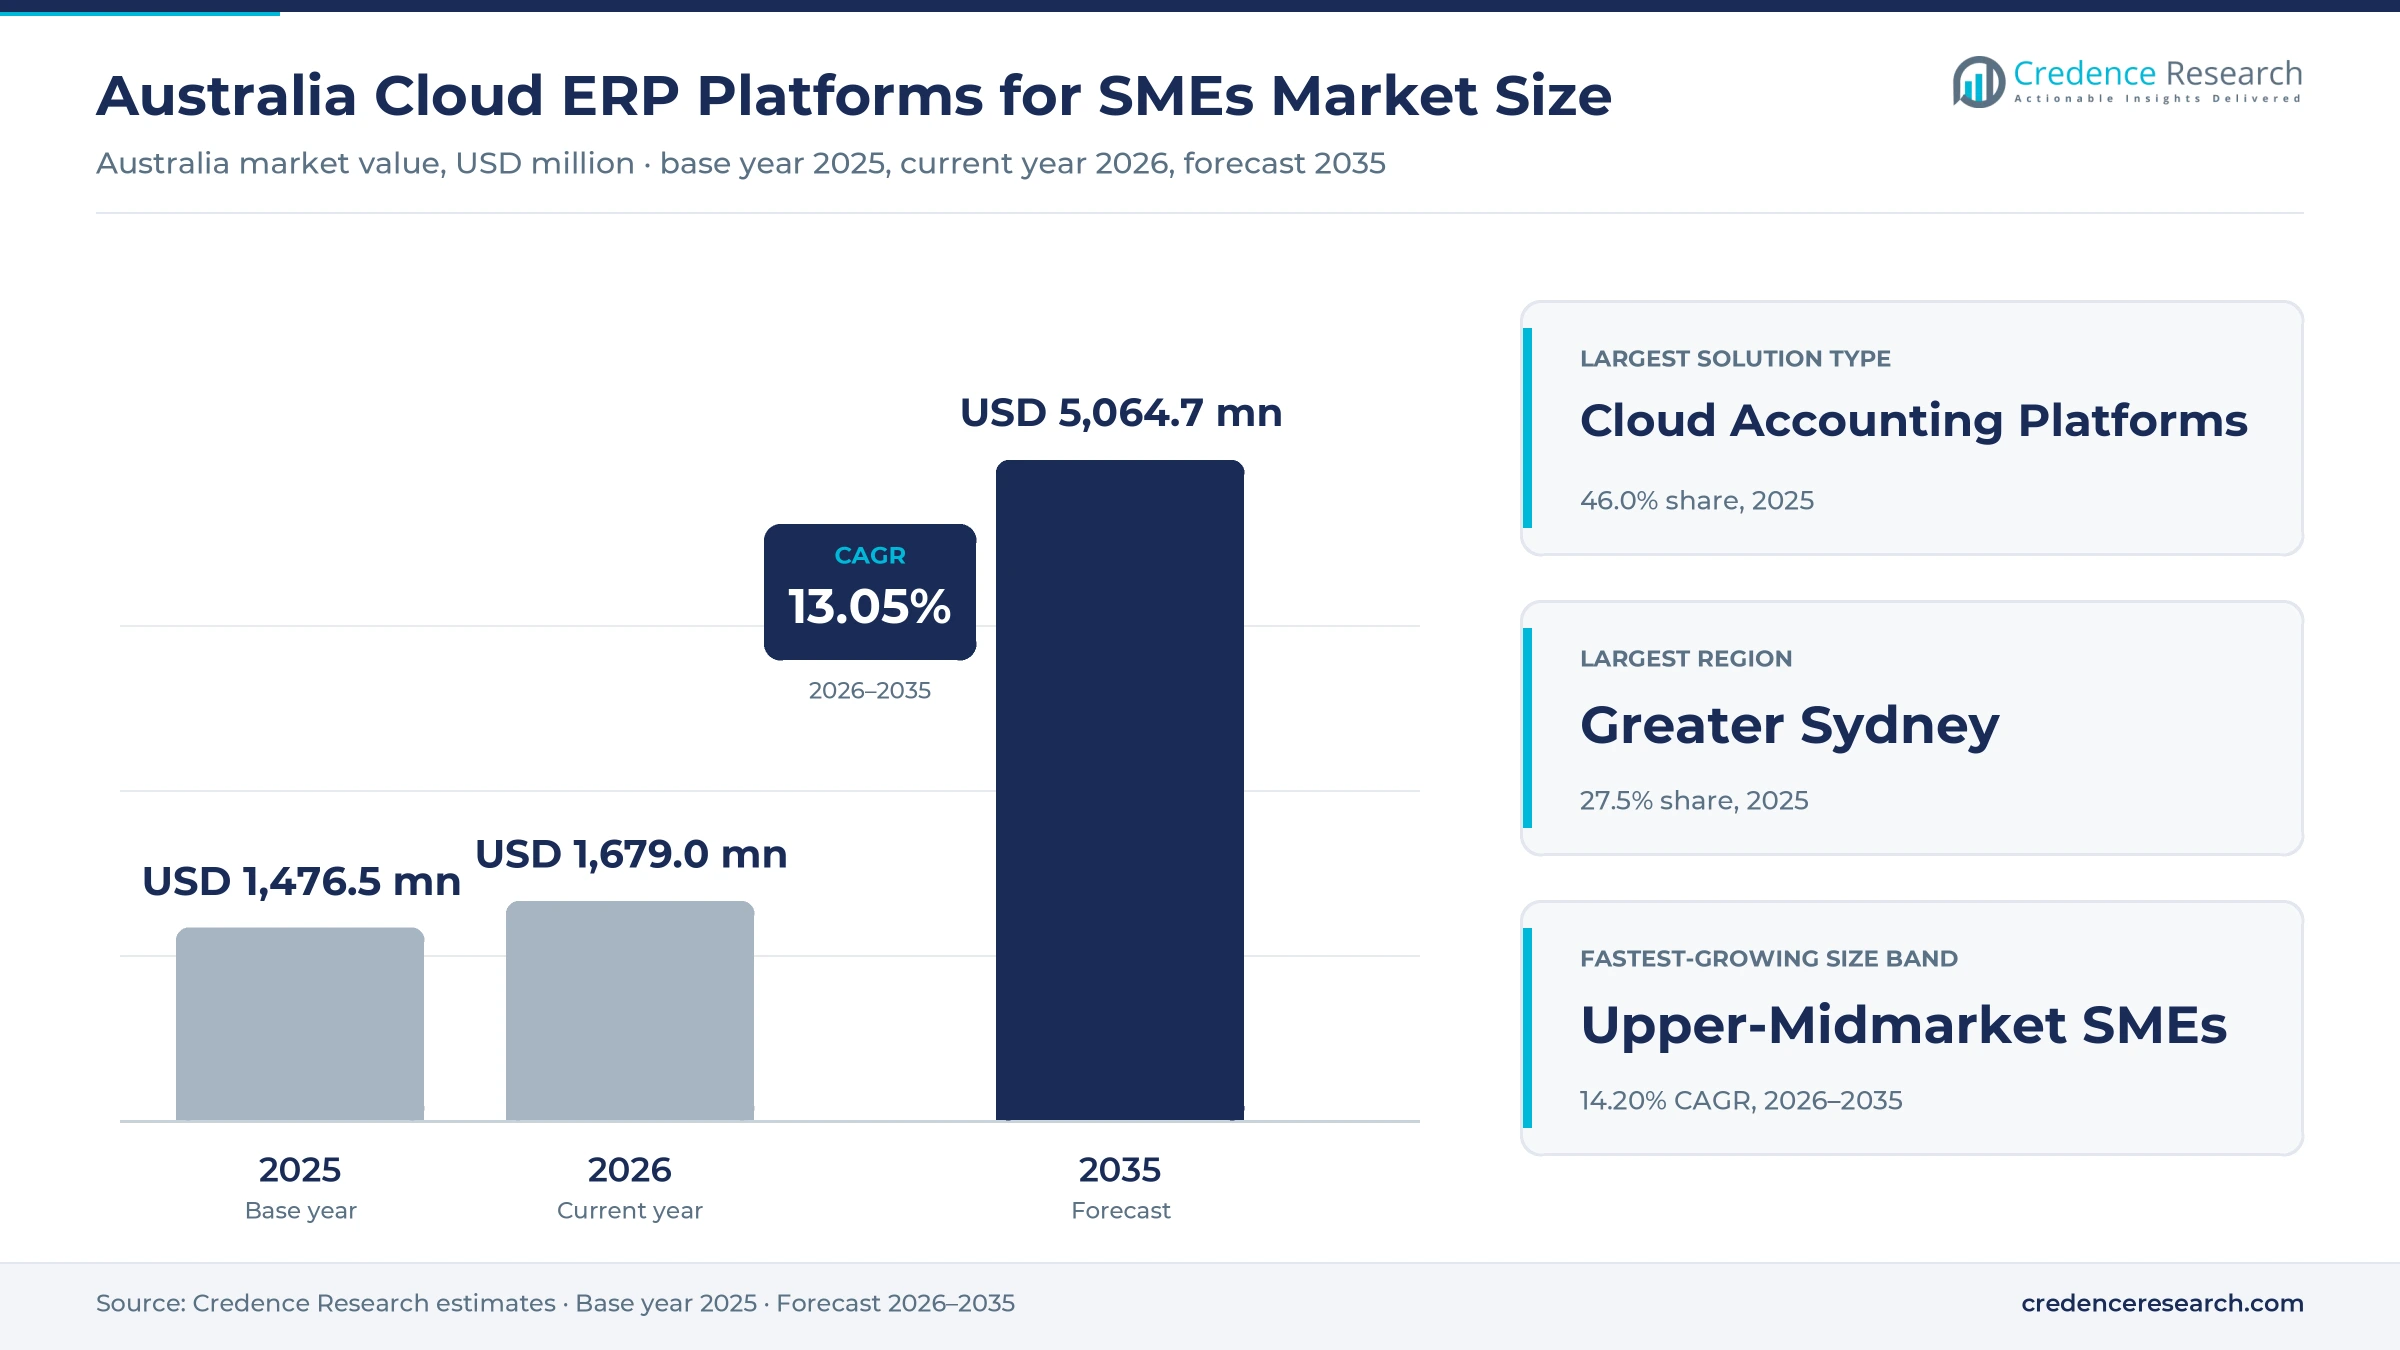
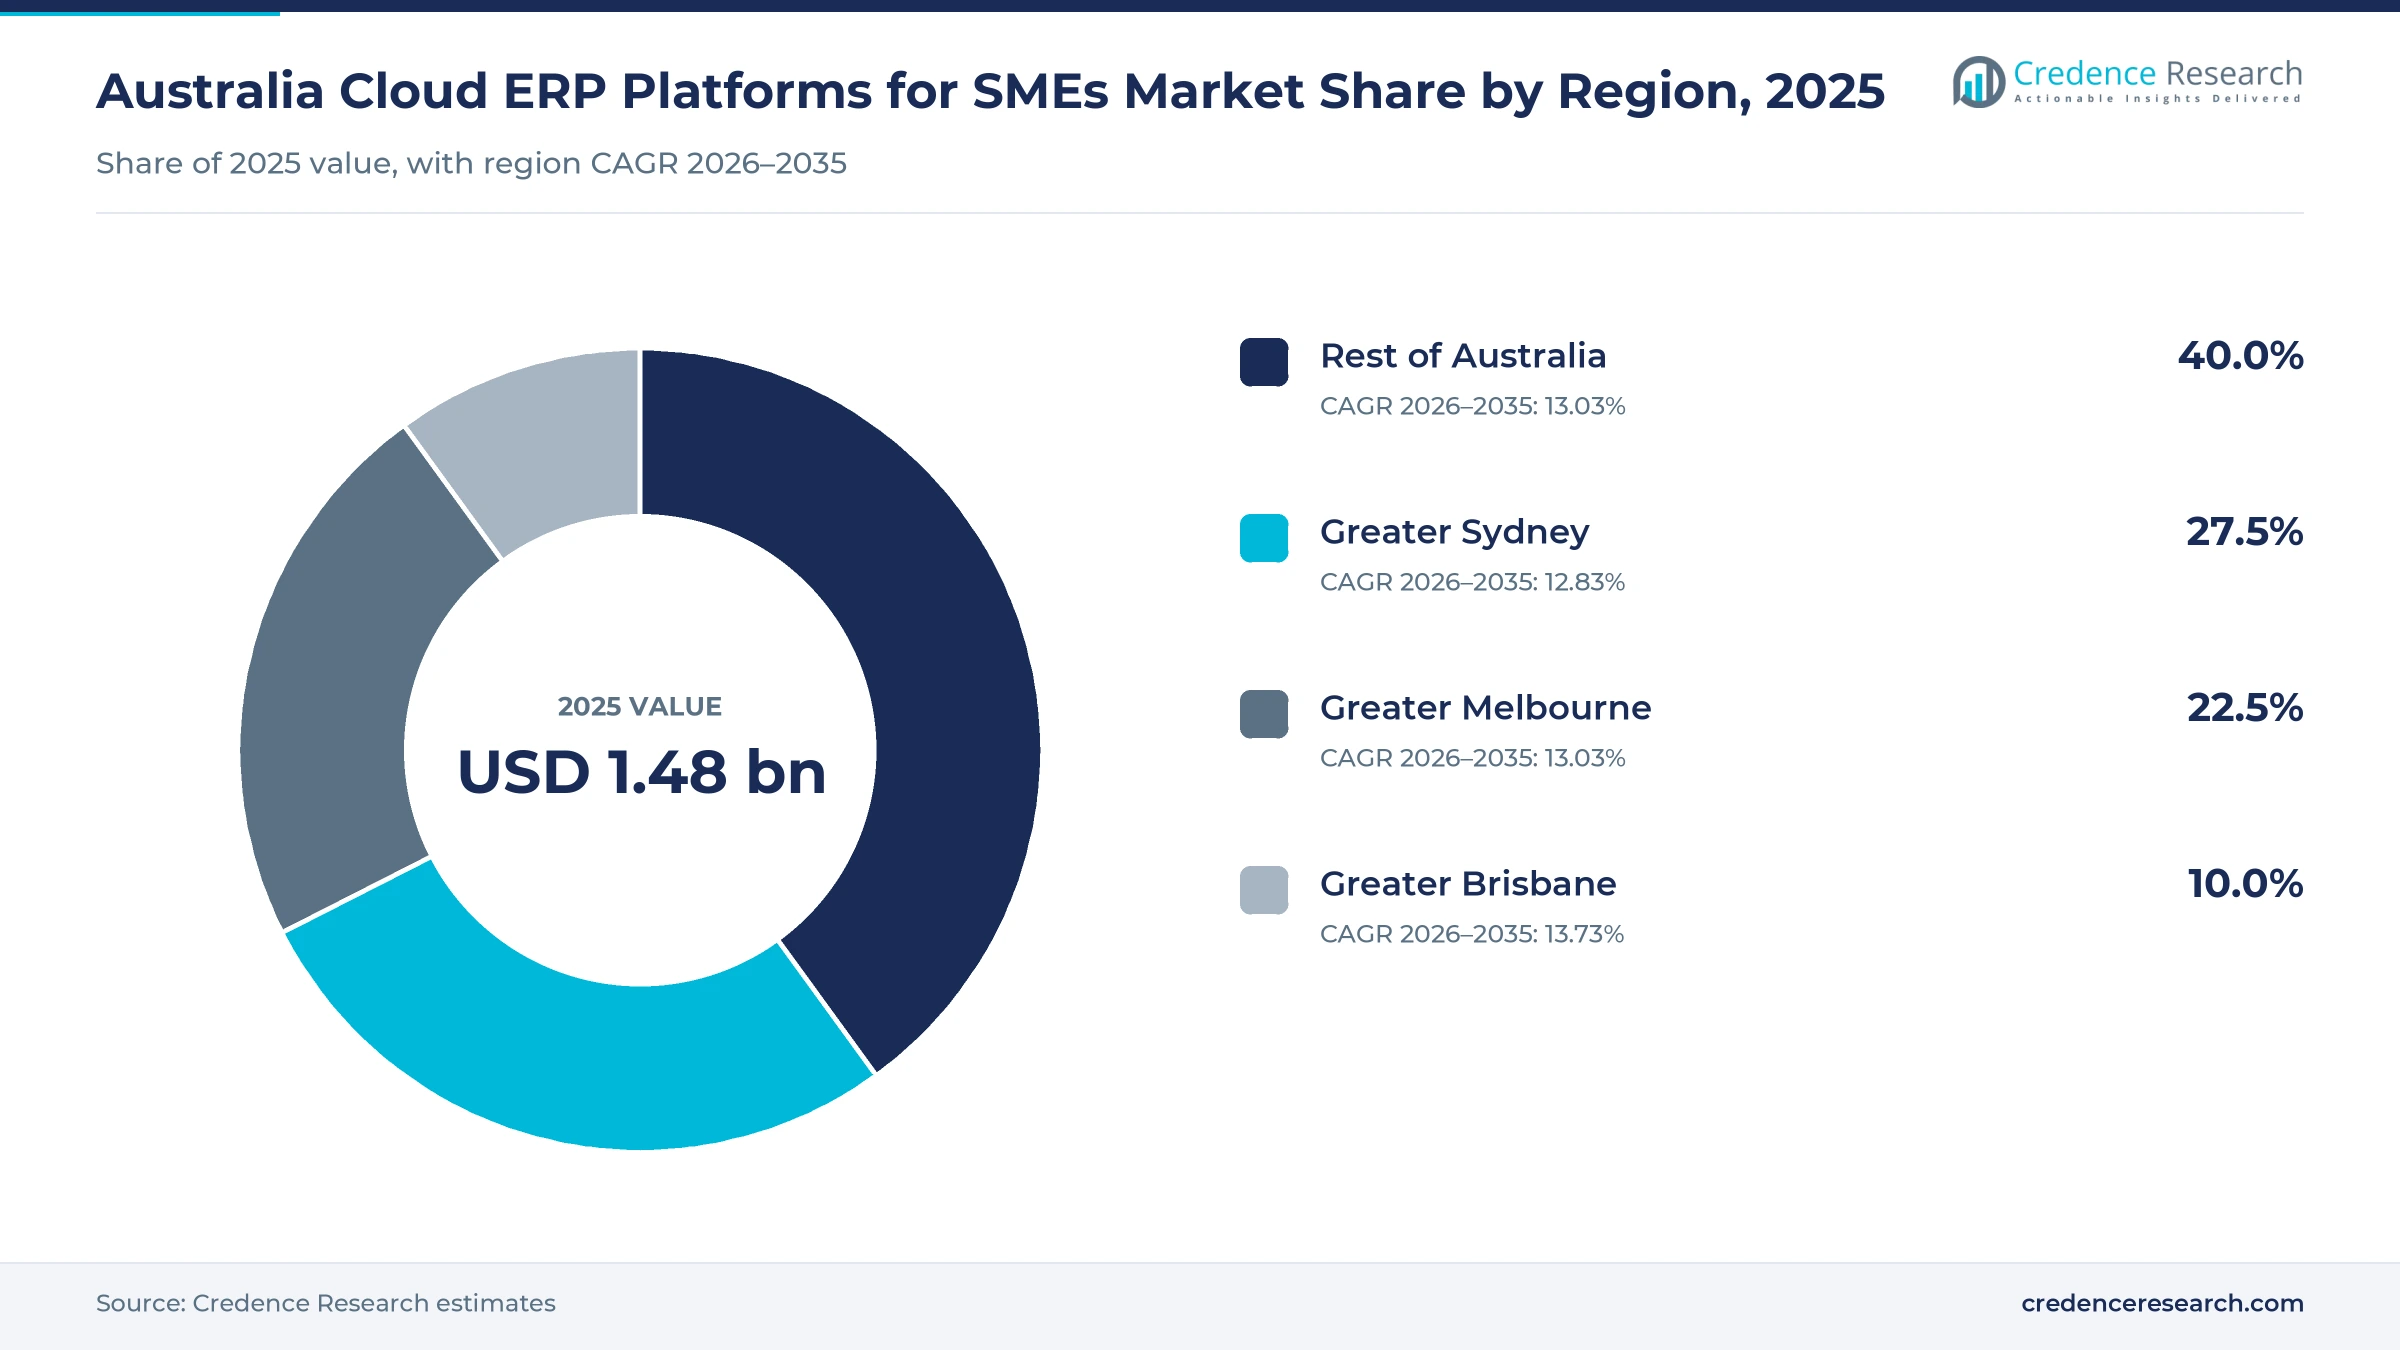
The Australia cloud ERP platforms for SMEs market was valued at USD 1.48 billion in 2025 and is projected to increase from USD 1.68 billion in 2026 to USD 5.06 billion by 2035, registering a CAGR of 13.05% during 2026–2035. Demand comes from micro, small and medium firms that pay subscriptions for accounting, inventory, project and payroll software hosted by vendors, plus the partners that implement and manage those systems. Greater Sydney held the largest share among the capital city regions, 27.5% in 2025, because it hosts the largest pool of employing businesses and many head offices of growing firms. Greater Brisbane is the fastest-growing region at 13.73% a year, as its population and business base expand quickly. At the same time, the compliance load changed on July 1, 2026, when Payday Super required employers to pay superannuation with wages, which pushed many firms off spreadsheets and desktop payroll toward connected online systems.
Which subscriptions and services does the estimate count?
The estimate counts platform subscription fees, module and usage fees and professional services fees paid by Australian businesses with fewer than 200 employees for cloud accounting suites, mid-market and vertical business management suites, and the implementation and managed services that set them up. Buyers usually subscribe monthly or annually, and many rely on accountants, bookkeepers or software partners to choose, configure and support the system.
The estimate excludes on-premise licenses, hardware, payment processing margins, lending and the software spending of firms with 200 or more employees. The value chain links global and local software vendors, implementation partners, accounting practices, app marketplaces and the Australian Taxation Office, which sets the payroll, tax and invoice standards that business software must support.
Australia Cloud ERP Platforms for SMEs Market Insights
- The Australia cloud ERP platforms for SMEs market was valued at USD 1.48 billion in 2025 and is projected to reach USD 5.06 billion by 2035, registering a CAGR of 13.05% during 2026–2035.
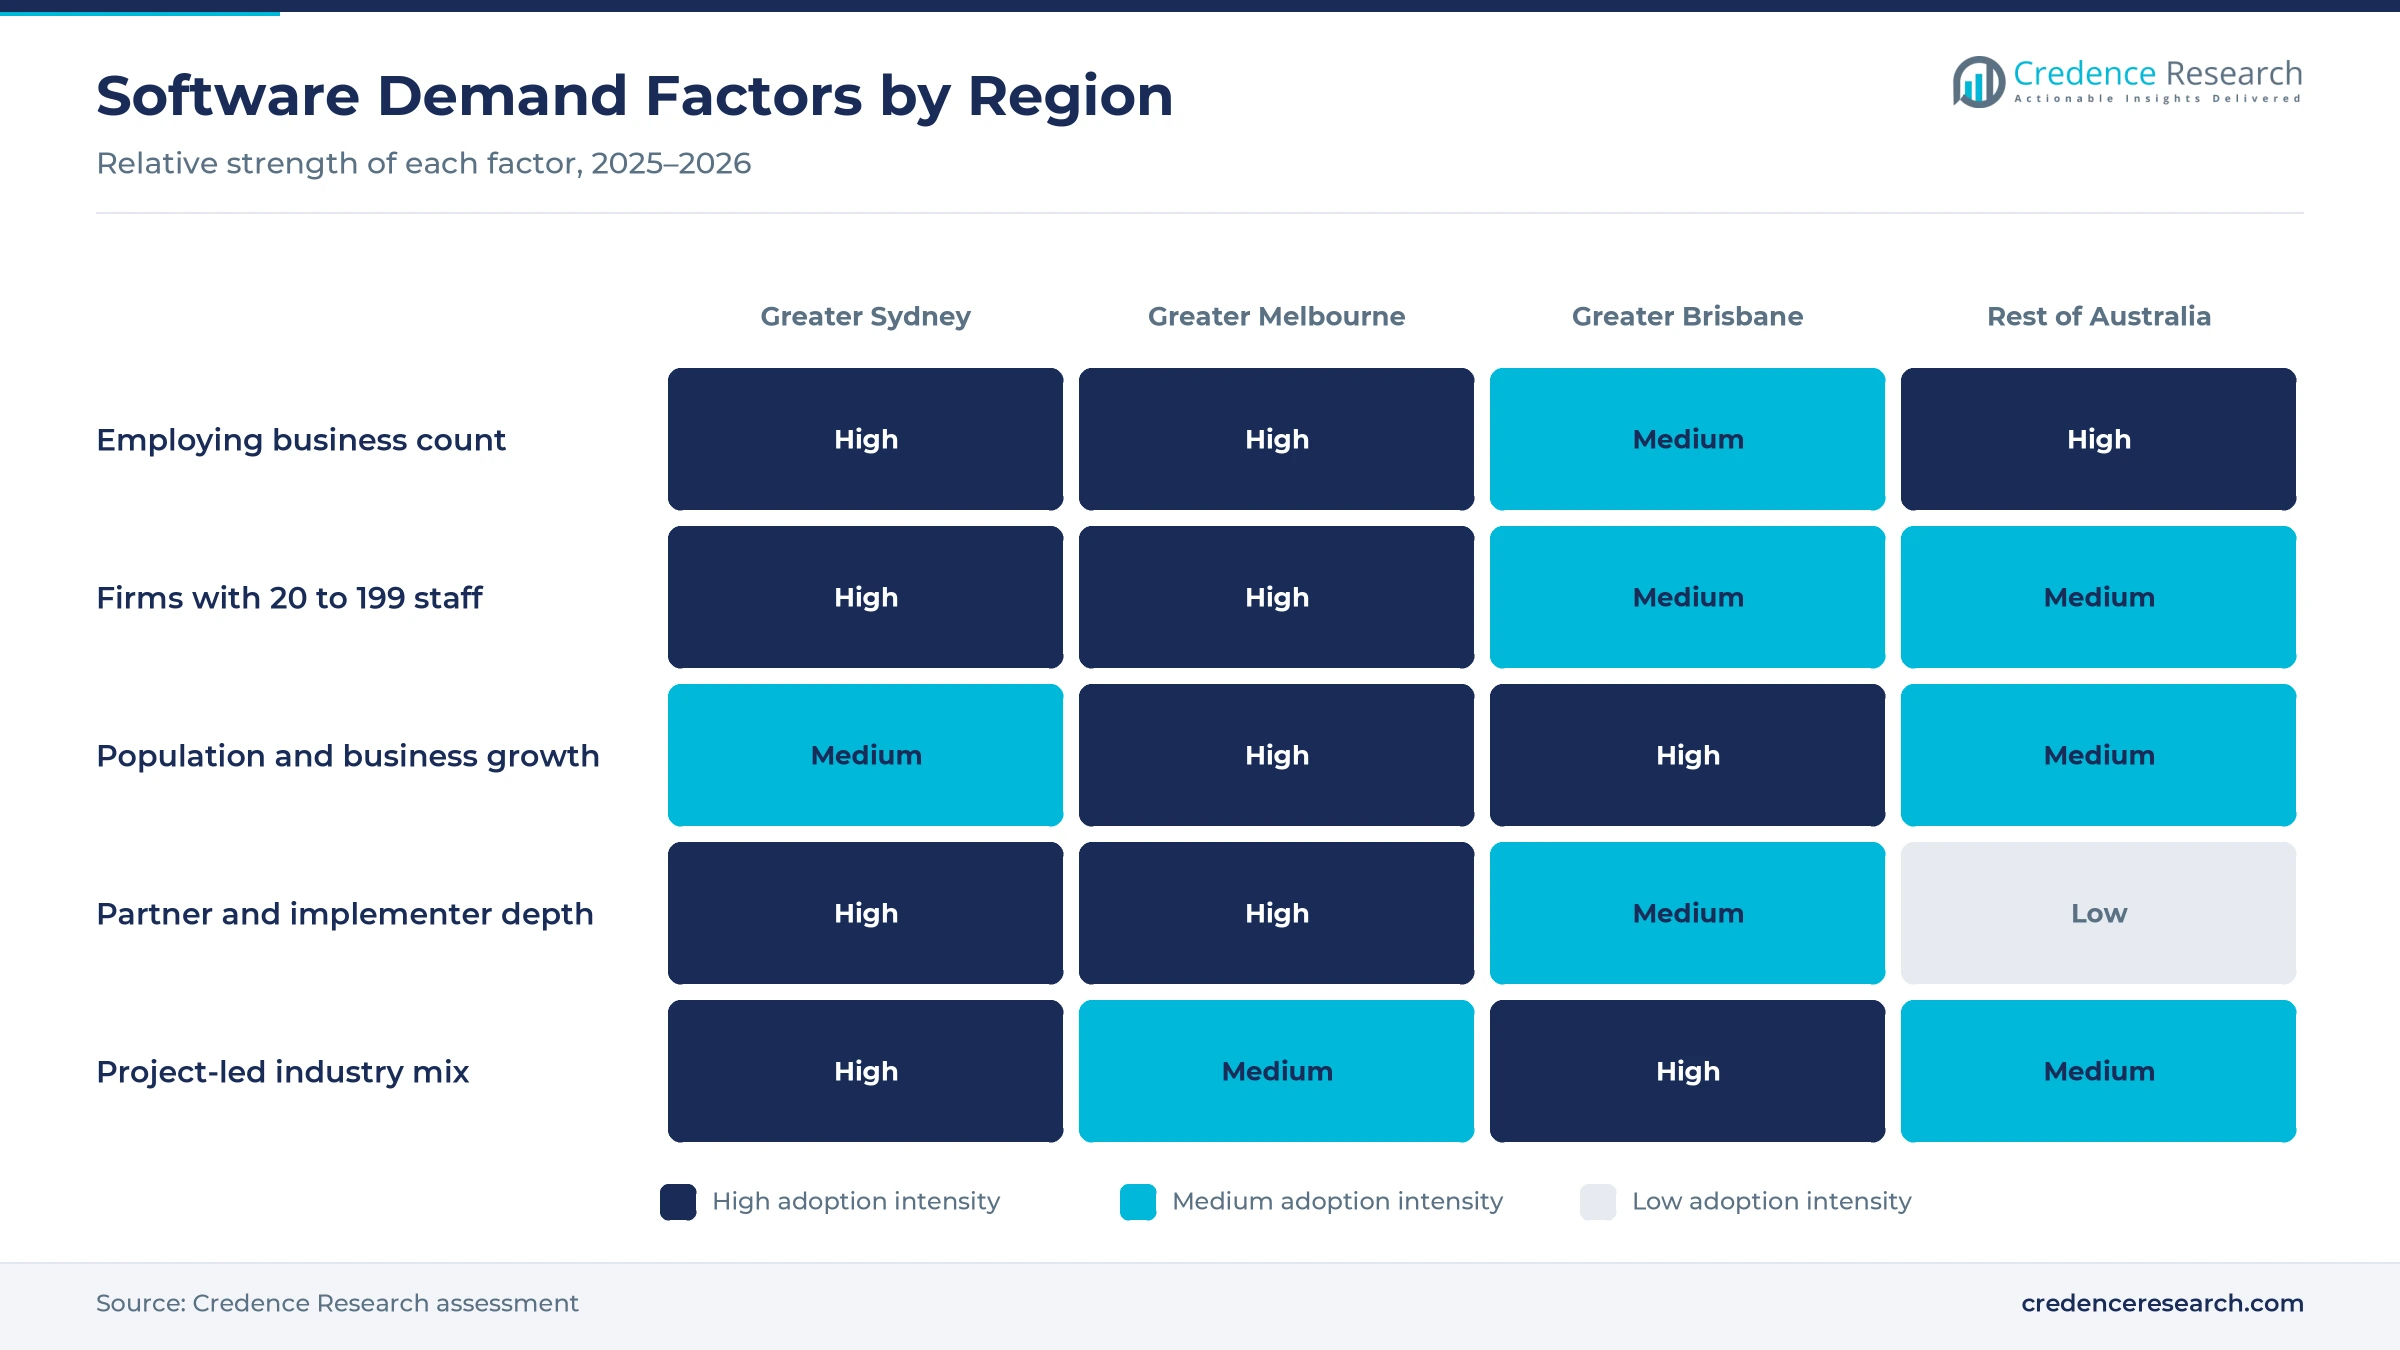
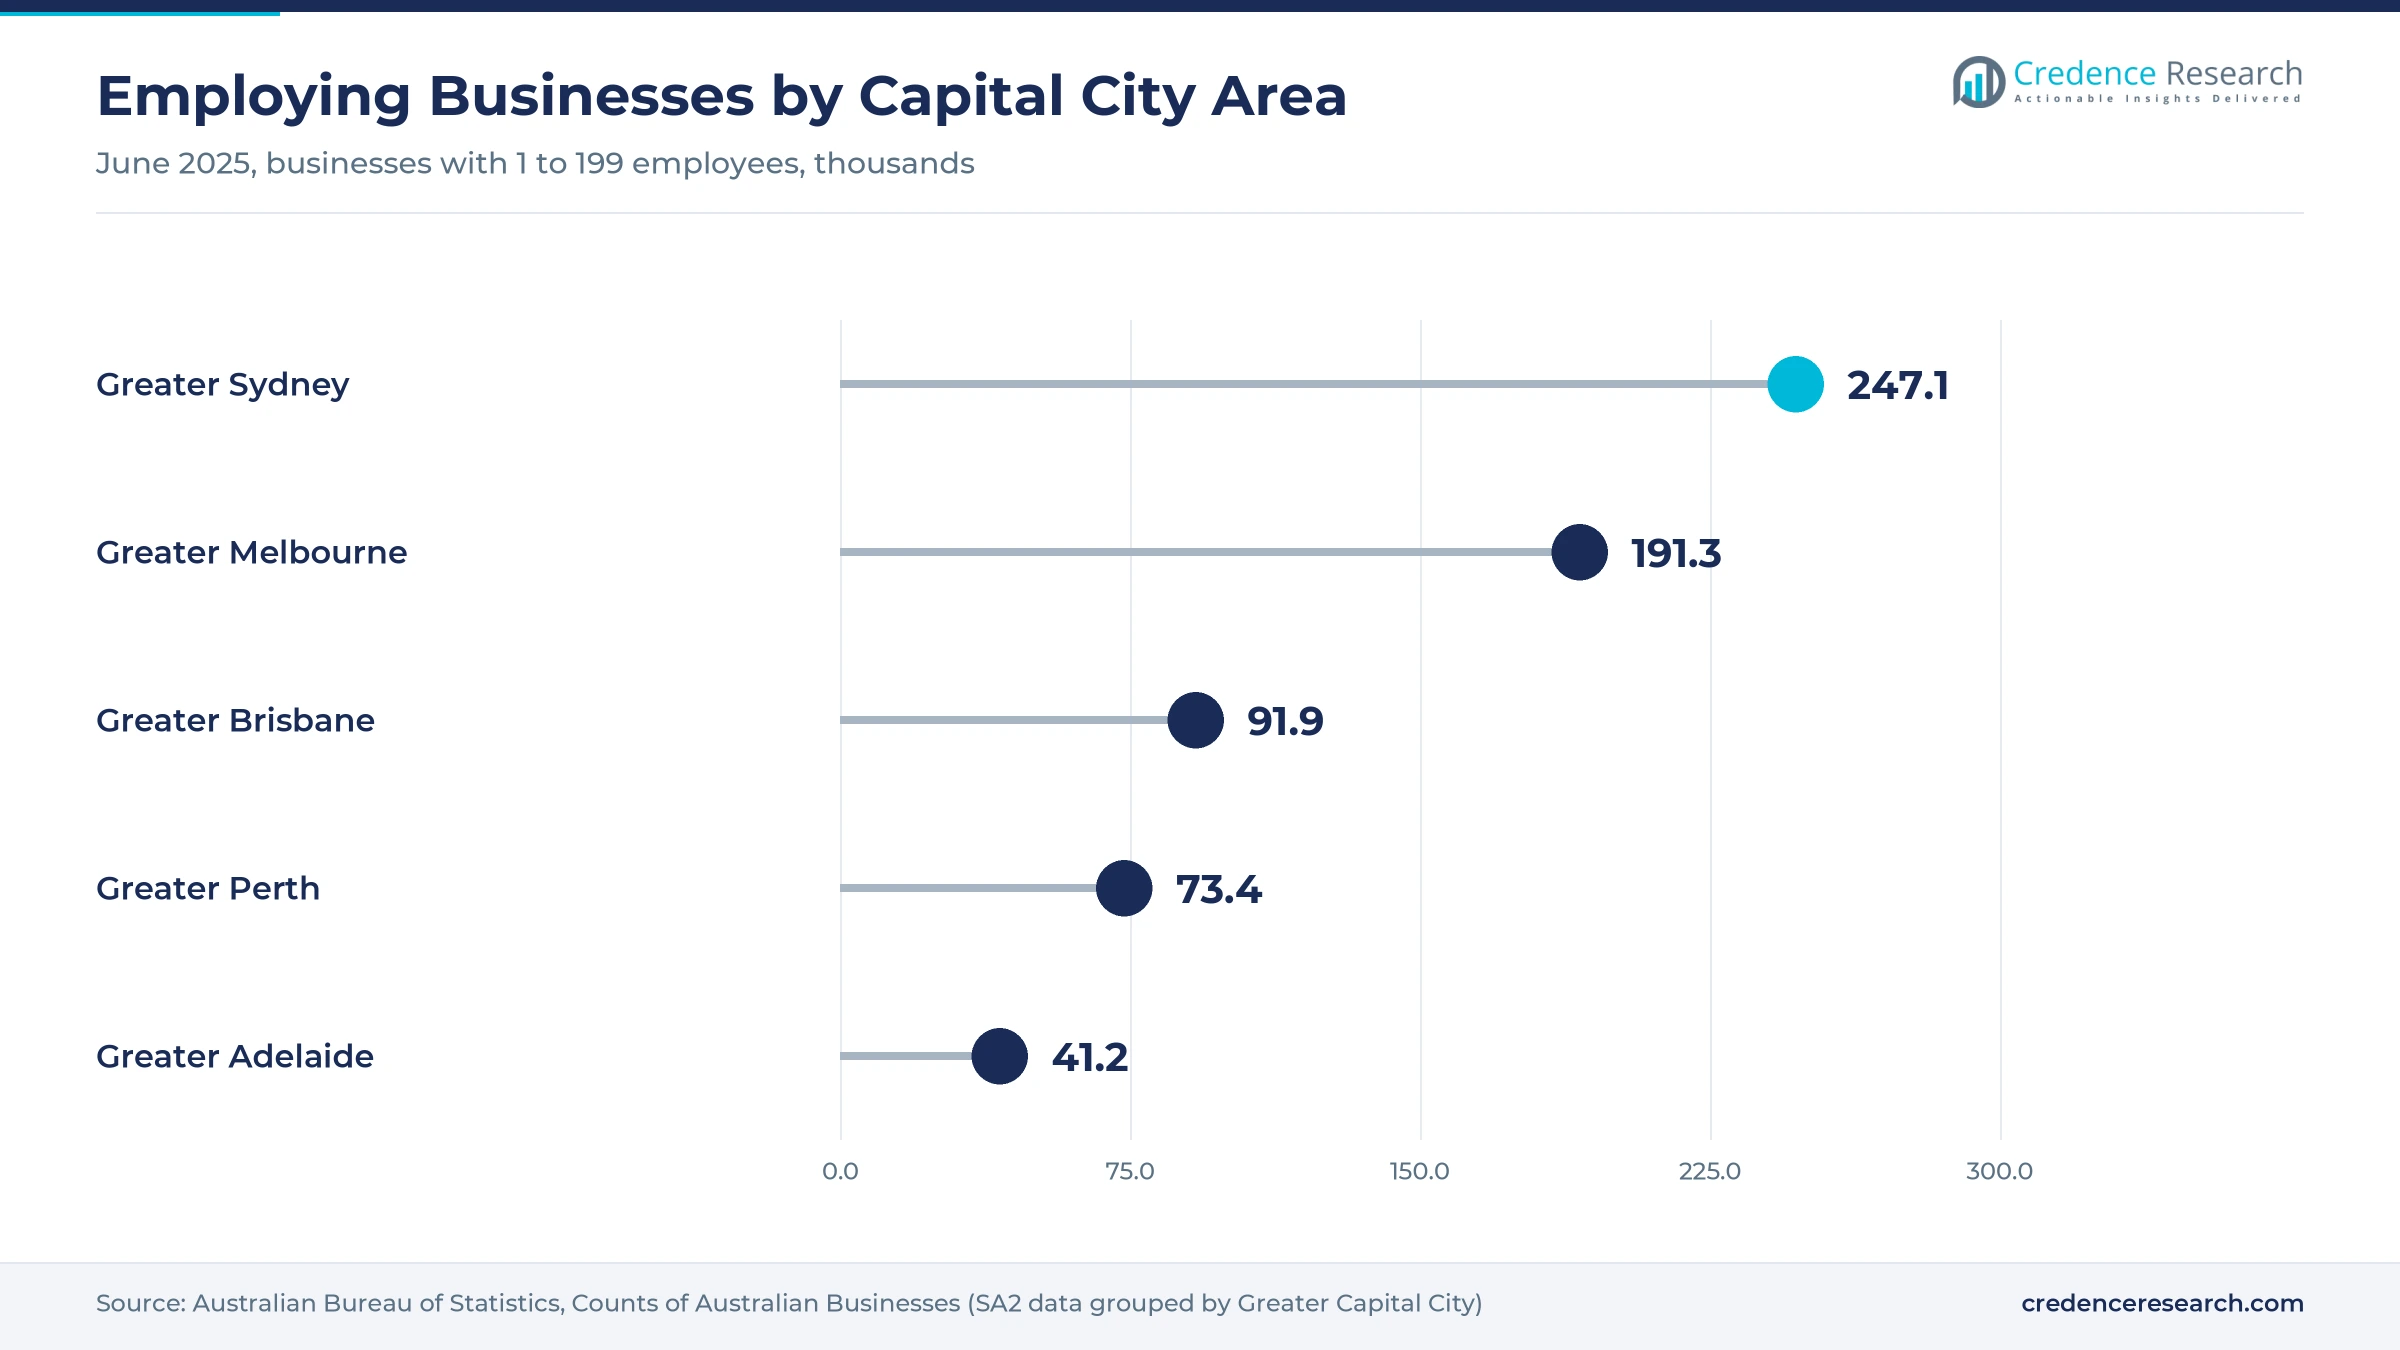
- Greater Sydney held a 27.5% share of 2025 value, because it hosts about 247,000 businesses with one to 199 employees, the most of any capital city.
- Cloud Accounting Platforms led solution types with a 46.0% share of 2025 value, because micro and small firms buy online bookkeeping first.
- Australian Peppol e-invoicing registrations passed 400,000 in 2025, and federal agencies must process electronic invoices automatically by December 2026.
- Upper-midmarket firms grow fastest at 14.20% a year during 2026–2035, as vendors add multi-entity, inventory and project tools for growing businesses.
Accounting suites lead while mid-market suites grow fastest
Why do online accounting suites hold the largest share?
Based on solution type, the market is categorized into cloud accounting platforms, mid-market cloud ERP, configurable and vertical cloud ERP, and implementation and managed services. Cloud Accounting Platforms led with a 46.0% share of 2025 value, because most micro and small firms start with online bookkeeping, GST reporting and payroll. Mid-Market Cloud ERP grows fastest at 14.02% a year, as growing firms outgrow entry suites and need inventory, multi-entity and project controls.
Why does vendor-managed multitenant hosting dominate?
Based on deployment model, the market is categorized into vendor-managed multitenant cloud, dedicated hosted cloud and partner-managed shared cloud. Vendor-Managed Multitenant Cloud led with a 72.0% share of 2025 value, because the main accounting suites run every customer on shared, automatically updated code. Vendor-Managed Multitenant Cloud grows fastest at 13.30% a year, as small firms prefer updates and security handled by the vendor rather than by local servers.
Which business sizes spend most on online systems?
Based on enterprise size, the market is categorized into micro businesses (0-4 employees), small businesses (5-19 employees), medium businesses (20-99 employees) and upper-midmarket SMEs (100-199 employees). Micro Businesses (0-4 Employees) led with a 34.0% share of 2025 value, because they are by far the most numerous buyers. Upper-Midmarket SMEs (100-199 Employees) grow fastest at 14.20% a year, as larger firms buy broader suites and paid implementation.
How do inventory and project needs change software choice?
Based on application, the market is categorized into finance-led management, inventory-led operations and project-led operations. Finance-Led Management led with a 55.0% share of 2025 value, because bookkeeping, tax lodgment and payroll are the first jobs most firms move online. Project-Led Operations grows fastest at 13.93% a year, as builders, consultants and trade firms link quotes, timesheets, job costs and invoices in one system.
| Segment Group | Leading Sub-segment | Share, 2025 | Fastest-growing Sub-segment | CAGR, 2026–2035 |
|---|---|---|---|---|
| By Solution Type | Cloud Accounting Platforms | 46.0% | Mid-Market Cloud ERP | 14.02% |
| By Deployment Model | Vendor-Managed Multitenant Cloud | 72.0% | Vendor-Managed Multitenant Cloud | 13.30% |
| By Enterprise Size | Micro Businesses (0-4 Employees) | 34.0% | Upper-Midmarket SMEs (100-199 Employees) | 14.20% |
| By Application | Finance-Led Management | 55.0% | Project-Led Operations | 13.93% |
Request a Free Sample
Fill in your details and we'll send you a free sample report.
- Sample data tables & charts
- Research methodology
Payroll rules, system sprawl and Peppol lift adoption
How does financial workflow digitization lift subscriptions?
Payroll and tax rules now assume that wages, superannuation and payroll data move through connected software, which turns digital bookkeeping into a basic compliance need for every employer. Single Touch Payroll Phase 2, expanded from Jan. 1, 2022, requires employers to report pay details through STP-enabled software. Payday Super took effect on July 1, 2026, and requires employers to pay superannuation at the same time as salary and wages. There were 994,178 employing businesses among 2,729,648 actively trading businesses at June 30, 2025, according to the Australian Bureau of Statistics, and each must meet these payroll rules. As a result, finance-led management holds 55.0% of 2025 value, the largest application share in the market for SMEs.
Why does integrated operational migration widen spending?
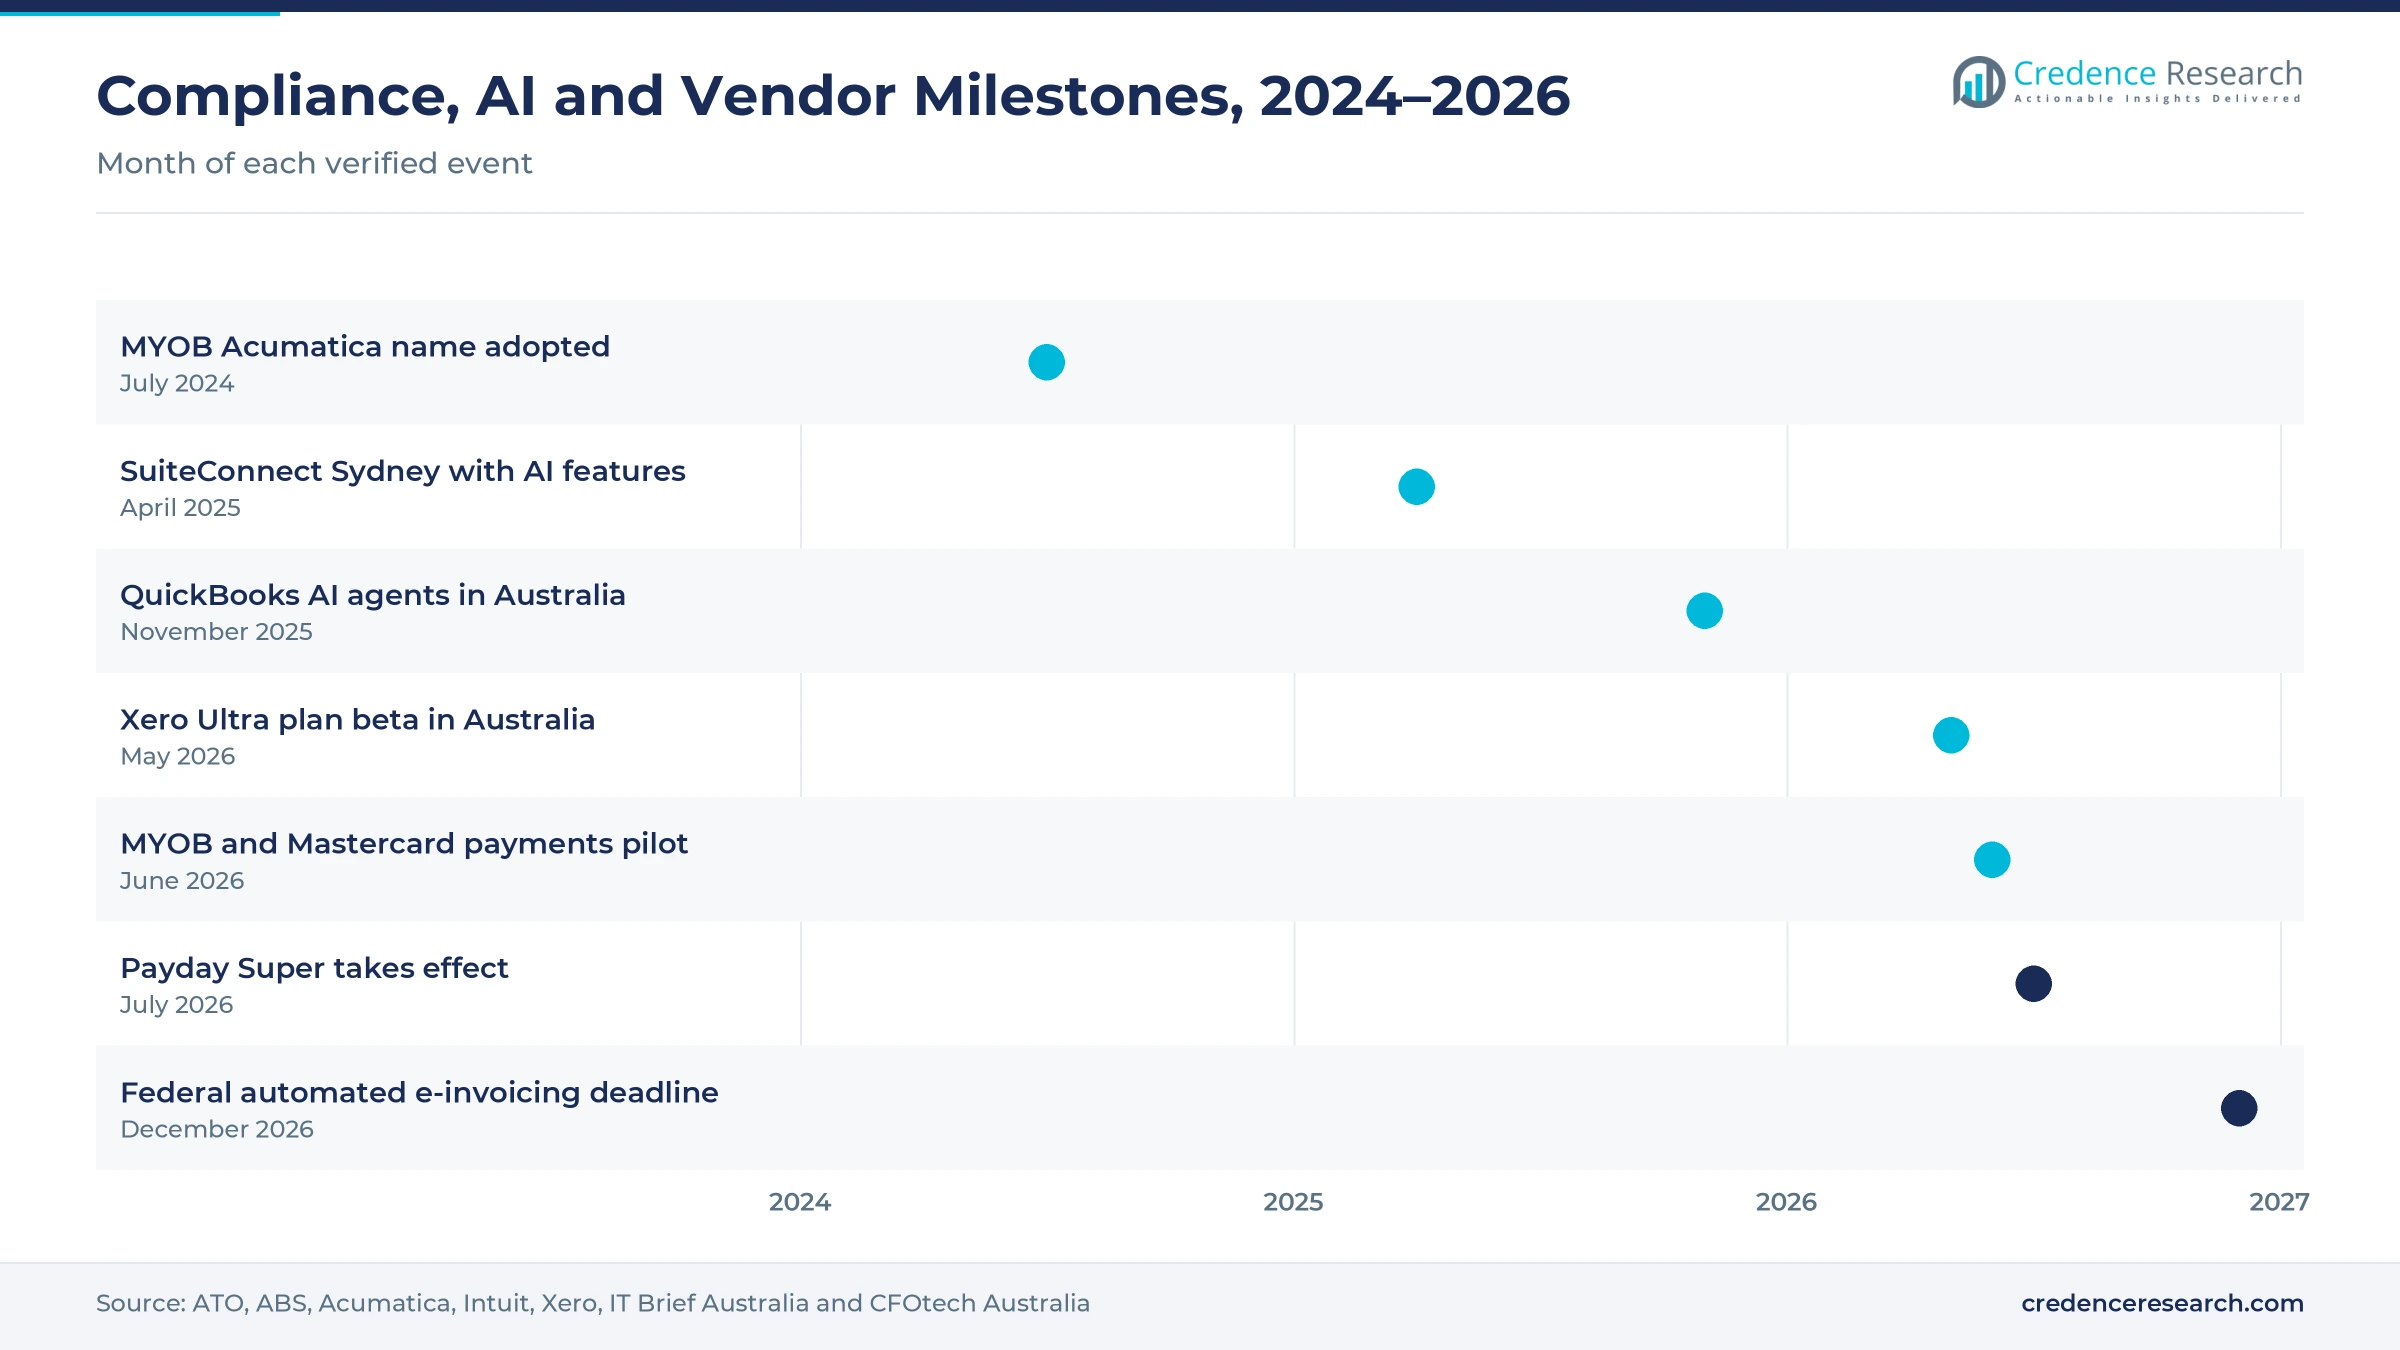
Many growing firms run accounting, stock, quoting and payroll in separate tools, which creates rekeying, errors and delays that integrated suites remove. Leaders of Australian small and mid-sized firms lose roughly two days a month to operational overload linked to switching between six and nine systems, according to an Intuit QuickBooks release dated Nov. 13, 2025. Kieser, a health and strength training provider, moved from 23 separate accounting files to NetSuite OneWorld and cut its budgeting cycle from three months to about one month, according to IT Brief Australia. MYOB announced in July 2024 that its localized Acumatica edition would be renamed MYOB Acumatica to serve mid-sized firms. In turn, mid-market cloud ERP grows at 14.02% a year, the fastest solution type.
How does structured invoice connectivity push upgrades?
Electronic invoices sent through the Peppol network move straight into accounts payable systems, which rewards firms that run software able to send and receive them. Australian Peppol registrations surpassed 400,000 during 2025, and well over 100 Commonwealth agencies are enabled for e-invoicing, according to the Australian Taxation Office. Federal non-corporate entities are expected to raise e-invoicing to 30% of invoices received by July 1, 2026, and to process and send e-invoices automatically by December 2026. Suppliers to government agencies therefore need accounting systems with Peppol access built in or added through partners. As a result, platform subscriptions gain value as invoice exchange becomes a standard function for SMEs.
Why does near-universal internet use support online suites?
Online business software only works well when owners, staff and advisers can reach it reliably from offices, sites and homes, and Australia meets that condition for most firms. About 96.1% of Australians used the internet in 2024, according to the World Bank, which supports browser and mobile access across cities and regional towns. Xero reported 2.8 million customers across Australia and New Zealand in its FY26 results release dated May 14, 2026. MYOB serves customers ranging from sole operators to firms with up to 1,000 employees, which shows how far online suites now reach. In turn, vendor-managed multitenant cloud holds 72.0% of 2025 value, the largest deployment share.
AI agents and embedded payments reshape SME software
How is the rise of AI agents changing bookkeeping work?
Vendors now build AI agents that categorize transactions, reconcile bank lines and draft reports, which shifts software value from record keeping toward automated finance work. Intuit made accounting, customer, finance and projects agents available to QuickBooks customers in Australia in November 2025, with a GST agent marked as coming soon. Xero said its JAX assistant had reconciled more than 40 million transactions with a reported 97% accuracy, according to its FY26 results release. About 12% of Australian businesses used artificial intelligence in 2024 to 2025, up from 1% in an earlier survey, according to the Australian Bureau of Statistics. As a result, AI features increasingly decide which accounting suites SMEs keep or replace.
Why is the shift to embedded payments reshaping software?
Small firms want to pay bills and collect money inside the same system that records the transaction, which moves payments into accounting software. In June 2026, MYOB and Mastercard announced a pilot of agent-driven payments that let owners set rules for which bills to pay, when to pay them and which method to use, according to CFOtech Australia. The same report cites MYOB research showing that 27% of small business owners face extreme cash flow pressure. ASIC has reported that 52% of small business failures stem from inadequate cash flow or excessive cash use, according to the report. In turn, vendors compete on payment, open banking and cash flow features rather than on ledgers alone.
Can upper-midmarket upgrades open larger contracts?
Firms that grow past 100 staff often need multi-entity consolidation, inventory control and approval workflows, which opens larger subscription and services contracts. There were 67,857 businesses with 20 to 199 employees at June 30, 2025, according to the Australian Bureau of Statistics. Xero announced in May 2026 that its new top-tier Ultra plan for growing businesses was in beta in Australia, with general availability planned for late June 2026. NetSuite drew about 800 users, partners and prospects to SuiteConnect Sydney in April 2025, according to IT Brief Australia. As a result, upper-midmarket firms grow at 14.20% a year, the fastest enterprise size band.
Is there an opening in project-led service firms?
Builders, trade contractors and professional service firms price and bill by job, so they need software that ties quotes, timesheets, purchases and invoices to each project. Intuit's projects agent, released in Australia in November 2025, pre-fills details for draft projects inside QuickBooks. Smithbridge Group, a construction and logistics business, uses NetSuite OneWorld and NetSuite Analytics Warehouse to view performance across six entities, according to IT Brief Australia. Professional, scientific and technical services firms reported 24% AI use in 2024 to 2025, according to the Australian Bureau of Statistics, while construction firms reported only 6%. As a result, project-led operations grow at 13.93% a year, the fastest application.
Cash pressure, migration risk and cyber threats slow uptake
How does tight cash flow delay software upgrades?
Many owners delay new subscriptions and implementation projects when cash is tight, because software costs recur every month. MYOB research cited by CFOtech Australia shows 27% of small business owners face extreme cash flow pressure. As a result, micro firms often stay on basic plans and add modules only when compliance forces them. Vendors respond with tiered plans, monthly billing and payment tools that help firms collect money faster.
Why does data migration risk slow suite changes?
Moving years of ledgers, stock records and payroll history into a new suite carries real risk of errors and downtime, which makes owners cautious about switching. In turn, many firms keep older tools longer than their needs justify, especially during payroll year-end. Implementation partners reduce this risk with staged data conversion, parallel runs and fixed-scope packages, which supports demand for implementation work and related payroll and HR services.
How do cyber incidents raise buyer caution?
Small firms hold payroll, bank and customer data in online accounts, which makes them attractive targets for fraud and credential theft. About 18% of businesses that reported a cyber incident in 2024 to 2025 suffered financial loss, according to the Australian Bureau of Statistics. As a result, buyers now ask about multifactor login, audit trails and data hosting before they sign. Vendors respond with stronger access controls and security monitoring built into subscriptions.
Why do skills gaps limit use of advanced modules?
Many owners use only the basic features of the software they already pay for, because staff lack time or training to set up automation. NetSuite executives said at SuiteConnect Sydney in April 2025 that many customers do not use functionality they already have. In turn, firms see less value from upgrades and delay moves to broader suites. Accountants, bookkeepers and partners close this gap with training and managed services.
Sydney leads the capitals while Brisbane grows fastest
| Region | Value, 2025 (USD billion) | Share, 2025 | CAGR, 2026–2035 |
|---|---|---|---|
| Rest of Australia | 0.59 | 40.0% | 13.03% |
| Greater Sydney | 0.41 | 27.5% | 12.83% |
| Greater Melbourne | 0.33 | 22.5% | 13.03% |
| Greater Brisbane | 0.15 | 10.0% | 13.73% |
What makes Greater Sydney the largest capital city market?
Greater Sydney held a 27.5% share of 2025 value and grows at 12.83% a year, because it hosts the largest group of employing businesses in the country. Australian Bureau of Statistics counts for June 2025 show about 247,000 Sydney businesses with one to 199 employees, including about 14,500 with 20 to 199 staff. Many professional service firms and regional head offices sit in the city, which lifts demand for multi-entity and project suites. As a result, Sydney leads spending on both subscriptions and implementation.
Why does Greater Melbourne rank second among the capitals?
Greater Melbourne held a 22.5% share of 2025 value and grows at 13.03% a year, because its business base is nearly as large as Sydney's. The city had about 596,000 actively trading businesses in June 2025, including about 191,000 with one to 199 employees, according to Australian Bureau of Statistics counts. Melbourne also added about 105,000 residents in 2024 to 2025, the largest increase of any capital. In turn, new firms and expanding retailers keep demand for accounting suites and inventory management software strong.
What lifts software adoption around Brisbane?
Greater Brisbane held a 10.0% share of 2025 value and grows fastest at 13.73% a year, because its population and business base expand quickly. Brisbane added about 58,200 residents in 2024 to 2025 and was one of only two capitals with net internal migration gains, according to the Australian Bureau of Statistics. The area had about 92,000 businesses with one to 199 employees in June 2025. As a result, newly formed firms adopt online suites from the start rather than migrating from desktop tools.
How do regional firms and other capitals add demand?
Rest of Australia held a 40.0% share of 2025 value and grows at 13.03% a year, because it combines Perth, Adelaide, Hobart, Darwin, Canberra and regional towns. Greater Perth had about 73,000 businesses with one to 199 employees in June 2025, and Greater Adelaide had about 41,000. Regional farms, contractors and retailers rely on browser and mobile access, since local IT support is thinner outside the main cities. In turn, partner-managed services matter more across this large and dispersed zone.
Payday Super, AI agents and vendor moves mark 2024 to 2026
| Development | Status and market relevance |
|---|---|
| In July 2024, MYOB renamed its localized edition of Acumatica as MYOB Acumatica for mid-sized businesses in Australia and New Zealand. | Sharpened the local mid-market offer |
| In April 2025, NetSuite held SuiteConnect Sydney with about 800 users, partners and prospects and presented built-in AI features. | Showed demand from growing local firms |
| In November 2025, Intuit made accounting, customer, finance and projects AI agents available to QuickBooks customers in Australia. | Raised AI expectations for small firms |
| In May 2026, Xero reported 2.8 million customers across Australia and New Zealand and an Ultra plan in beta in Australia. | Extended entry suites toward larger firms |
| In July 2026, Payday Super took effect, requiring employers to pay superannuation at the same time as wages. | Raised payroll software needs for employers |
Bank feeds, open APIs and AI assistants shape daily use
- Bank feeds and open banking links import transactions daily from Australian banks, which lets owners reconcile accounts in minutes rather than at month-end.
- Peppol access points send and receive structured invoices between registered businesses and agencies, which removes manual keying of supplier bills.
- Open APIs and app marketplaces connect accounting cores with inventory, point-of-sale, job management and payroll apps, which lets firms build a suite step by step.
- AI assistants and agents categorize transactions, draft reports and flag unusual entries, which reduces bookkeeping time and helps owners act on cash flow sooner.
Need a Custom Version of This Report?
Tailor the scope, geography, or segments to your exact requirements.
- Custom geography or segment scope
- Direct access to our analyst team
Local accounting leaders face global suite vendors
Competition combines locally rooted accounting suites, global small business vendors and broader business management suites sold through partners. Xero reported 2.8 million customers across Australia and New Zealand in its FY26 results and is testing a top-tier Ultra plan for growing businesses in Australia. MYOB serves firms from sole operators to those with up to 1,000 employees and sells MYOB Acumatica to mid-sized firms through its own team and partners. Intuit competes with QuickBooks and launched AI agents for Australian customers in November 2025. Oracle NetSuite sells multi-entity suites to fast-growing firms and runs SuiteConnect events in Sydney. Microsoft offers an Australian version of Dynamics 365 Business Central with local functionality through its partner network. Rivals compete on compliance updates, app ecosystems, AI features, accountant relationships and the cost of moving between suites.
Which vendors shape small business software choices?
| Company | Type | Role in the market |
|---|---|---|
| Xero | Cloud accounting vendor | Serves 2.8 million customers across Australia and New Zealand |
| MYOB | Local business software vendor | Sells accounting suites and MYOB Acumatica for mid-sized firms |
| Intuit | Global small business vendor | Offers QuickBooks with AI agents for Australian customers |
| Oracle NetSuite | Business management suite vendor | Sells multi-entity suites to growing local firms |
| Microsoft | Business software vendor | Offers an Australian version of Dynamics 365 Business Central |
Credence Research view on SME business software
Credence Research's view is that Australian small and medium firms will keep moving core finance and operations online because payroll, superannuation and invoicing rules now assume connected software. Cloud accounting suites remain the largest spending pool, yet growth increasingly comes from firms with 20 to 199 staff that need inventory, project and multi-entity controls. Vendors that combine compliance updates, Peppol access, payments and practical AI agents with strong accountant and partner networks should gain share as buyers consolidate tools.
How the subscription and services estimate was built
The report uses 2025 as the base year on a calendar basis, and market values come from the Credence Research model. That model combines national business counts by employment size and area, population statistics, business technology use data, tax office program pages and vendor releases. Zone shares, zone growth rates and segment splits are Credence Research estimates built from employing business counts by capital city area. Sources used are government, statistical agency, international organization, trade press and company publications, and no interviews or surveys were used.
Upper-midmarket moves and e-invoicing drive growth to 2035
The Australia cloud ERP platforms for SMEs market is expected to reach USD 5.06 billion by 2035, a 13.05% CAGR during 2026–2035, as payroll rules, e-invoicing and system consolidation keep pulling firms onto connected suites. Growth should be strongest among upper-midmarket firms, project-led operations and Greater Brisbane, because these groups gain most from integrated records. Spending on small business bookkeeping software will keep shaping vendor road maps as growing firms move up to broader suites.
Frequently Asked Questions
How big is the Australia cloud ERP platforms for SMEs market?
Which solution type leads spending?
Which region leads the market?
How many businesses operate in Australia?
How does Payday Super affect small business software?
How widely is Peppol e-invoicing used in Australia?
Who are the leading companies in the market?
What are the main challenges for adoption?
Table of Content
Chapter 1 Market Segmentation
- 1.1 Segmentation Framework
- 1.1.1 Product and Service Classification
- 1.1.2 Application and End-Use Classification
- 1.1.3 Technology and Solution Classification
- 1.1.4 Customer and Distribution Channel Classification
- 1.1.5 Geographic Segmentation
- 1.1.6 Market Segment Definitions and Boundaries
- 1.2 By Solution Type
- 1.2.1 Cloud Accounting Platforms
- 1.2.2 Mid-Market Cloud ERP
- 1.2.3 Configurable and Vertical Cloud ERP
- 1.2.4 Implementation and Managed Services
- 1.3 By Deployment Model
- 1.3.1 Vendor-Managed Multitenant Cloud
- 1.3.2 Dedicated Hosted Cloud
- 1.3.3 Partner-Managed Shared Cloud
- 1.4 By Enterprise Size
- 1.4.1 Micro Businesses (0-4 Employees)
- 1.4.2 Small Businesses (5-19 Employees)
- 1.4.3 Medium Businesses (20-99 Employees)
- 1.4.4 Upper-Midmarket SMEs (100-199 Employees)
- 1.5 By Application
- 1.5.1 Finance-Led Management
- 1.5.2 Inventory-Led Operations
- 1.5.3 Project-Led Operations
Chapter 2 Introduction
- 2.1 Report Objectives and Scope
- 2.2 Product Definition and Industry Terminology
- 2.3 Market Inclusions and Exclusions
- 2.4 Research Process
- 2.4.1 Primary Research and Expert Interviews
- 2.4.2 Secondary Research and Source Review
- 2.4.3 Top-Down and Bottom-Up Estimation
- 2.4.4 Data Triangulation and Verification
- 2.5 Market Size Measurement Basis
- 2.5.1 2025: USD 1.48 billion → 2035: USD 5.06 billion
- 2.6 Historical and Forecast Reference Periods
- 2.6.1 Historical Period: 2018-2025
- 2.6.2 Base Year: 2025
- 2.6.3 Forecast Period: 2025-2035
- 2.7 Research Assumptions and Limitations
Chapter 3 Executive Summary
- 3.1 Market Snapshot and Key Findings
- 3.2 Base-Year Market Size, 2025
- 3.3 Forecast Market Size, 2035
- 3.4 Revenue and Volume Growth Outlook
- 3.5 Key Demand and Supply Indicators
- 3.6 Leading Market Segments
- 3.7 Fastest-Growing Market Opportunities
- 3.8 Regional Performance Highlights
- 3.9 Technology and Industry Transformation
- 3.10 Competitive Landscape Summary
- 3.11 Analyst View and Strategic Implications
Chapter 4 Australia Cloud ERP Platforms for SMEs Market Trends and Developments
- 4.1 Historical Industry Development, 2018-2025
- 4.2 Recent Market Trends and Developments
- 4.3 Demand and Customer Behavior Trends
- 4.4 Technology and Product Innovation
- 4.5 Artificial Intelligence, Automation and Digitalization
- 4.6 Local Manufacturing and Supply Chain Realignment
- 4.7 Industry Partnerships, Mergers and Acquisitions
- 4.8 Sustainability and Circular Economy Developments
- 4.9 Government and Private Sector Investment Trends
- 4.10 Emerging Business Models and Commercialization
- 4.11 Industry Developments and Announcements
Chapter 5 Australia Cloud ERP Platforms for SMEs Market Supply and Demand Analysis
- 5.1 Demand Trend and Consumption Analysis, 2018-2025
- 5.2 Demand Forecast, 2025-2035
- 5.3 Supply Chain Structure and Procurement Trends
- 5.4 Supply-Demand Gap and Bottlenecks
- 5.5 Import Dependence and Sourcing Structure
- 5.6 Regional Supply and Demand Concentration
Chapter 6 Australia Cloud ERP Platforms for SMEs Market Pricing Analysis
- 6.1 Pricing Structure and Measurement
- 6.2 Historical Pricing Trends, 2018-2025
- 6.3 Pricing Outlook, 2025-2035
- 6.4 Pricing by Product and Market Segment
- 6.5 Geographic Pricing Differences
- 6.6 Key Input, Energy, Labor and Logistics Costs
- 6.7 Contract Pricing and Purchasing Models
- 6.8 Pricing Sensitivity and Competitive Positioning
- 6.9 Price, Margin and Profitability Implications
Chapter 7 Australia Cloud ERP Platforms for SMEs Market Dynamics
- 7.1 Market Growth Drivers
- 7.1.1 Demand-Side Drivers
- 7.1.2 Technology and Innovation Drivers
- 7.1.3 Infrastructure and Investment Drivers
- 7.1.4 Regulatory and Policy Drivers
- 7.2 Market Restraints
- 7.2.1 Cost and Affordability Constraints
- 7.2.2 Technology and Adoption Barriers
- 7.2.3 Supply Chain and Operational Constraints
- 7.3 Market Challenges
- 7.3.1 Competitive Pressure and Margin Erosion
- 7.3.2 Skills, Infrastructure and Implementation Gaps
- 7.4 Emerging Market Opportunities
- 7.5 Market Dynamics Impact and Time-Horizon Assessment
Chapter 8 Australia Cloud ERP Platforms for SMEs Value Chain Analysis
- 8.1 Industry Value Chain Overview
- 8.2 Upstream Suppliers and Critical Inputs
- 8.3 Technology and Component Providers
- 8.4 Manufacturing or Service Delivery
- 8.5 Distribution, Channel Partners and Integrators
- 8.6 Downstream Applications and End Users
- 8.7 Value Addition and Profit Pools
- 8.8 Vertical Integration and Outsourcing
- 8.9 Supplier Concentration and Risk
- 8.10 Supply Chain Localization and Resilience
Chapter 9 Australia Cloud ERP Platforms for SMEs Market Regulations and Policies
- 9.1 Relevant Laws, Standards and Compliance Frameworks
- 9.2 Product, Service, Safety and Quality Requirements
- 9.3 Government Policies, Incentives and Subsidies
- 9.4 Imports, Exports and Trade Barriers
- 9.5 Public Procurement and Local Content Requirements
- 9.6 Data Protection, AI and Cybersecurity Compliance
- 9.7 Upcoming Policy Changes and Market Implications
Chapter 10 Australia Cloud ERP Platforms for SMEs Market Hotspots and Opportunities
- 10.1 Market Opportunity Mapping and Growth Hotspots
- 10.2 High-Growth Applications and Customer Groups
- 10.3 Underserved Markets and White-Space Opportunities
- 10.4 Emerging Technology and Product Opportunities
- 10.5 New Capacity and Investment Hotspots
- 10.6 Market Entry and Expansion Opportunities
- 10.7 Distribution and Partnership Opportunities
- 10.8 Near-Term and Long-Term Commercial Potential
- 10.9 Opportunity Attractiveness and Execution Risks
Chapter 11 Australia Cloud ERP Platforms for SMEs Market Outlook, 2025-2035
- 11.1 Market Size and Analysis
- 11.1.1 Revenue (Market Measurement: 2025: USD 1.48 billion → 2035: USD 5.06 billion)
- 11.1.2 Historical Market Size, 2018-2025
- 11.1.3 Base-Year Market Size, 2025
- 11.2 Market Forecast, 2025-2035
- 11.2.1 Revenue Forecast to 2035
- 11.2.2 CAGR and Year-on-Year Growth
- 11.2.3 Incremental Revenue Opportunity
- 11.3 Forecast Assumptions and Scenario Analysis
- 11.3.1 Base-Case Forecast
- 11.3.2 Optimistic and Conservative Scenarios
- 11.3.3 Technology, Pricing and Policy Sensitivities
- 11.4 Market Attractiveness and Growth Outlook
Chapter 12 Australia Cloud ERP Platforms for SMEs Market Segmentation and Outlook
- 12.1 Segmentation Summary and Market Shares, 2025
- 12.2 Largest and Fastest-Growing Segments
- 12.3 By Solution Type - Market Size and Forecast, 2025-2035
- 12.3.1 Segment Definition and Scope
- 12.3.2 Historical Market Size, 2018-2025
- 12.3.3 Revenue Forecast, 2025-2035
- 12.3.4 Base-Year Market Share, 2025
- 12.3.5 Segment CAGR and Growth Drivers
- 12.3.6 Subsegment Market Size and Forecast
- 12.3.6.1 Cloud Accounting Platforms
- 12.3.6.2 Mid-Market Cloud ERP
- 12.3.6.3 Configurable and Vertical Cloud ERP
- 12.3.6.4 Implementation and Managed Services
- 12.3.7 Subsegment Pricing and Adoption Trends
- 12.3.8 Leading Suppliers and Competition
- 12.3.9 Regional Demand and Opportunities
- 12.4 By Deployment Model - Market Size and Forecast, 2025-2035
- 12.4.1 Segment Definition and Scope
- 12.4.2 Historical Market Size, 2018-2025
- 12.4.3 Revenue Forecast, 2025-2035
- 12.4.4 Base-Year Market Share, 2025
- 12.4.5 Segment CAGR and Growth Drivers
- 12.4.6 Subsegment Market Size and Forecast
- 12.4.6.1 Vendor-Managed Multitenant Cloud
- 12.4.6.2 Dedicated Hosted Cloud
- 12.4.6.3 Partner-Managed Shared Cloud
- 12.4.7 Subsegment Pricing and Adoption Trends
- 12.4.8 Leading Suppliers and Competition
- 12.4.9 Regional Demand and Opportunities
- 12.5 By Enterprise Size - Market Size and Forecast, 2025-2035
- 12.5.1 Segment Definition and Scope
- 12.5.2 Historical Market Size, 2018-2025
- 12.5.3 Revenue Forecast, 2025-2035
- 12.5.4 Base-Year Market Share, 2025
- 12.5.5 Segment CAGR and Growth Drivers
- 12.5.6 Subsegment Market Size and Forecast
- 12.5.6.1 Micro Businesses (0-4 Employees)
- 12.5.6.2 Small Businesses (5-19 Employees)
- 12.5.6.3 Medium Businesses (20-99 Employees)
- 12.5.6.4 Upper-Midmarket SMEs (100-199 Employees)
- 12.5.7 Subsegment Pricing and Adoption Trends
- 12.5.8 Leading Suppliers and Competition
- 12.5.9 Regional Demand and Opportunities
- 12.6 By Application - Market Size and Forecast, 2025-2035
- 12.6.1 Segment Definition and Scope
- 12.6.2 Historical Market Size, 2018-2025
- 12.6.3 Revenue Forecast, 2025-2035
- 12.6.4 Base-Year Market Share, 2025
- 12.6.5 Segment CAGR and Growth Drivers
- 12.6.6 Subsegment Market Size and Forecast
- 12.6.6.1 Finance-Led Management
- 12.6.6.2 Inventory-Led Operations
- 12.6.6.3 Project-Led Operations
- 12.6.7 Subsegment Pricing and Adoption Trends
- 12.6.8 Leading Suppliers and Competition
- 12.6.9 Regional Demand and Opportunities
- 12.7 Segment Growth Comparison
- 12.8 Segment Attractiveness and Priority Matrix
Chapter 13 Australia Cloud ERP Platforms for SMEs End-Use and Application Market Outlook
- 13.1 End-Use Industry and Customer Demand Structure
- 13.2 Leading Applications and Customer Groups
- 13.3 End-Use Market Size, Share and Forecast
- 13.4 Major End-Use Industry Deep Dives
- 13.4.1 Customer Requirements and Use Cases
- 13.4.2 Demand and Replacement Cycles
- 13.4.3 Technical and Regulatory Considerations
- 13.4.4 Purchasing and Procurement Models
- 13.4.5 Leading Vendors and Distribution Channels
- 13.4.6 Forecast and Commercial Opportunities
- 13.5 Emerging Applications and Cross-Segment Demand
- 13.6 End-Use Industry Investment Priorities
Chapter 14 Australia Cloud ERP Platforms for SMEs Geographic Market Outlook, 2025-2035
- 14.1 Domestic Market Distribution and Demand Clusters
- 14.2 State- or Province-Wise Market Size and Forecast, 2025-2035
- 14.3 City and Metropolitan Market Outlook
- 14.4 Industrial, Manufacturing and Commercial Clusters
- 14.5 Geographic Concentration of Key End Users
- 14.6 Local Pricing and Purchasing Differences
- 14.7 Domestic Production Facilities and Capacity Map
- 14.8 Local Infrastructure and Project Pipeline
- 14.9 State-Level Policy and Incentive Differences
- 14.10 Subnational Investment Hotspots and Opportunities
- 14.11 Distribution and Logistics Networks
- 14.12 Domestic Competitive Footprint
Chapter 15 Australia Cloud ERP Platforms for SMEs Technology, Innovation and Sustainability Outlook
- 15.1 Technology Landscape and Maturity
- 15.2 Product, Process and Service Innovation
- 15.3 AI, Automation and Digital Tools in the Industry
- 15.4 Technology Adoption and Performance Benchmarking
- 15.5 Innovation Pipeline and R&D Investment
- 15.6 Patent and Intellectual Property Trends
- 15.7 Energy Efficiency and Resource Management
- 15.8 Sustainability, Recycling and Circularity
- 15.9 Technology Roadmap, 2025-2035
- 15.10 Risks of Obsolescence and Technology Substitution
Chapter 16 Australia Cloud ERP Platforms for SMEs Market Key Strategic Imperatives
- 16.1 Growth and Market Entry Priorities
- 16.2 High-Return Products and Segments
- 16.3 Pricing, Profitability and Cost Optimization
- 16.4 Technology Investment and Product Differentiation
- 16.5 Supply Chain Localization and Resilience
- 16.6 Distribution and Customer Acquisition
- 16.7 Partnership, Acquisition and Capacity Strategy
- 16.8 Regional Expansion Priorities
- 16.9 Short-, Medium- and Long-Term Actions
Chapter 17 Competition Outlook
- 17.1 Industry Competition Characteristics
- 17.2 Market Structure and Concentration
- 17.3 Market Share and Competitive Positioning, 2025
- 17.4 Company-Wise Revenue and Product Benchmarking
- 17.5 Production and Service Capacity Benchmarking
- 17.6 Technology, Pricing and Differentiation
- 17.7 Regional Footprint and Distribution Strength
- 17.8 Mergers, Acquisitions and Strategic Alliances
- 17.9 New Entrants and Competitive Threats
- 17.10 Porter's Five Forces and Industry Attractiveness
- 17.11 Competitive Outlook, 2025-2035
Chapter 18 Company Profiles
- 18.1 Company Coverage and Selection Criteria
- 18.2 Xero
- 18.2.1 Business Description
- 18.2.2 Company Ownership and Geographic Presence
- 18.2.3 Product and Service Portfolio
- 18.2.4 Manufacturing and Operating Footprint
- 18.2.5 Financial Performance and Investment
- 18.2.6 Market Share and Competitive Position
- 18.2.7 Technology and Innovation Capabilities
- 18.2.8 Strategic Alliances or Partnerships
- 18.2.9 Recent Developments
- 18.2.10 Growth Strategy and Outlook
- 18.3 MYOB
- 18.4 Intuit
- 18.5 Oracle NetSuite
- 18.6 Microsoft
- 18.7 Other Relevant Market Participants
Note: Every listed company is profiled on the structure shown under the first company. The company list is preliminary and may change based on research findings, market developments, data availability and client requirements.
Chapter 19 Disclaimer
- 19.1 Research and Forecast Disclaimer
- 19.2 Data Source and Estimation Limitations
Note: The depth of individual sections depends on data availability for this market. Volume, capacity, trade and other unit-based metrics are included where applicable.

