
Parcel density turns software into core retail plumbing
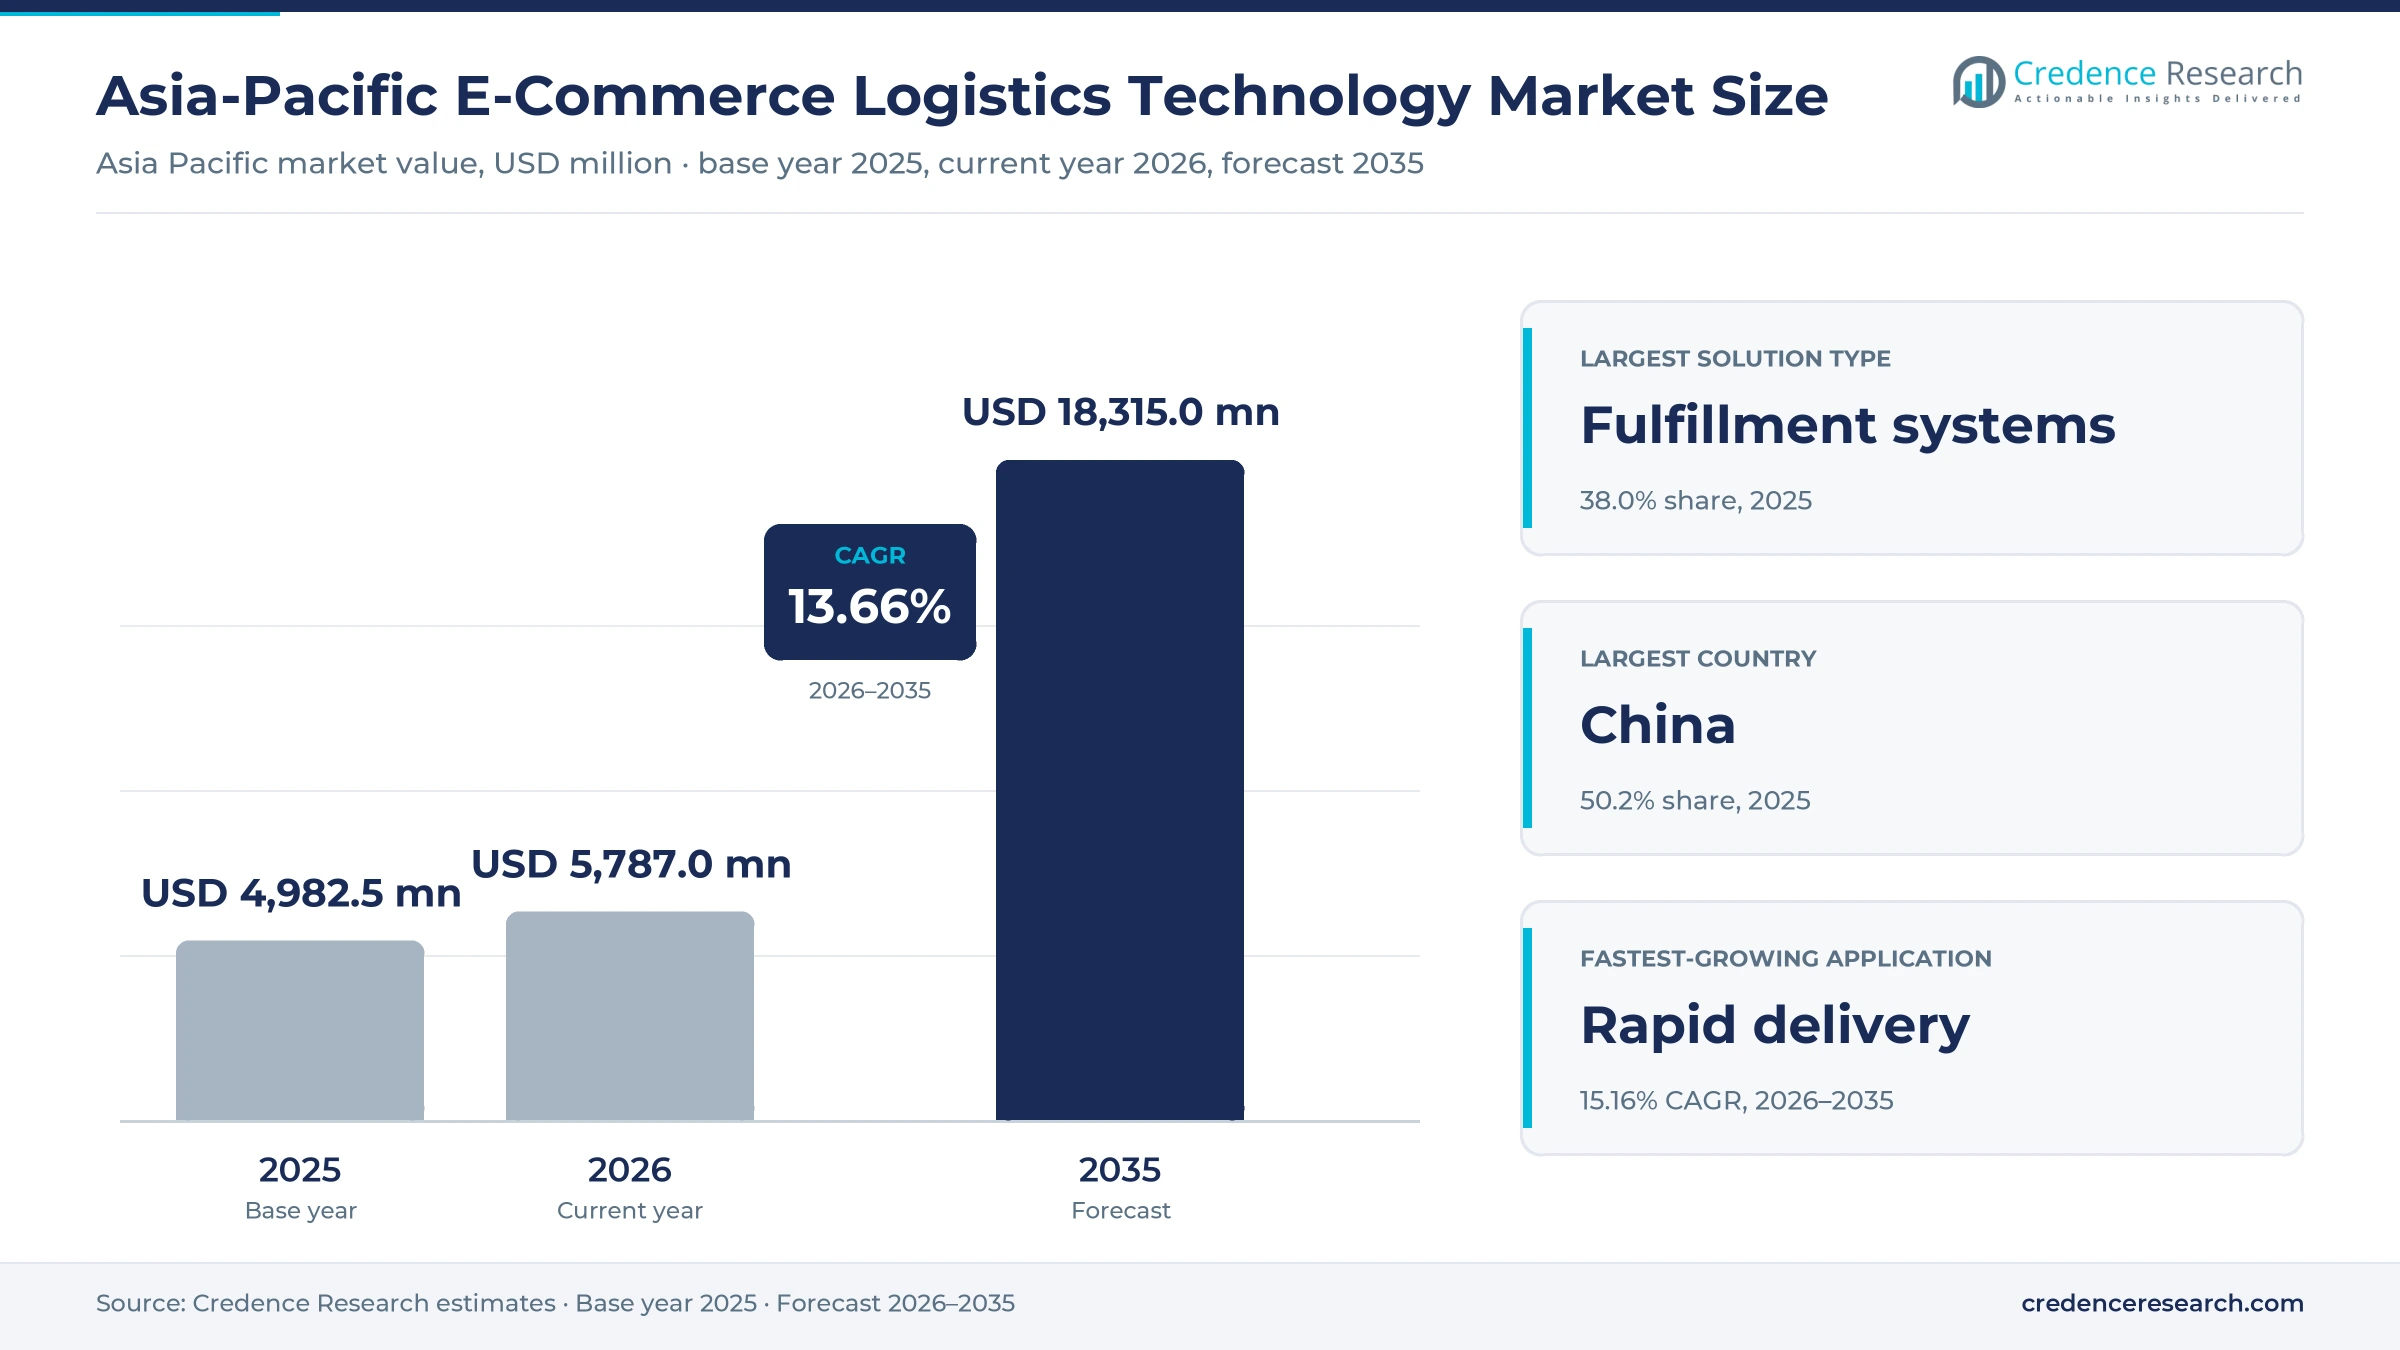
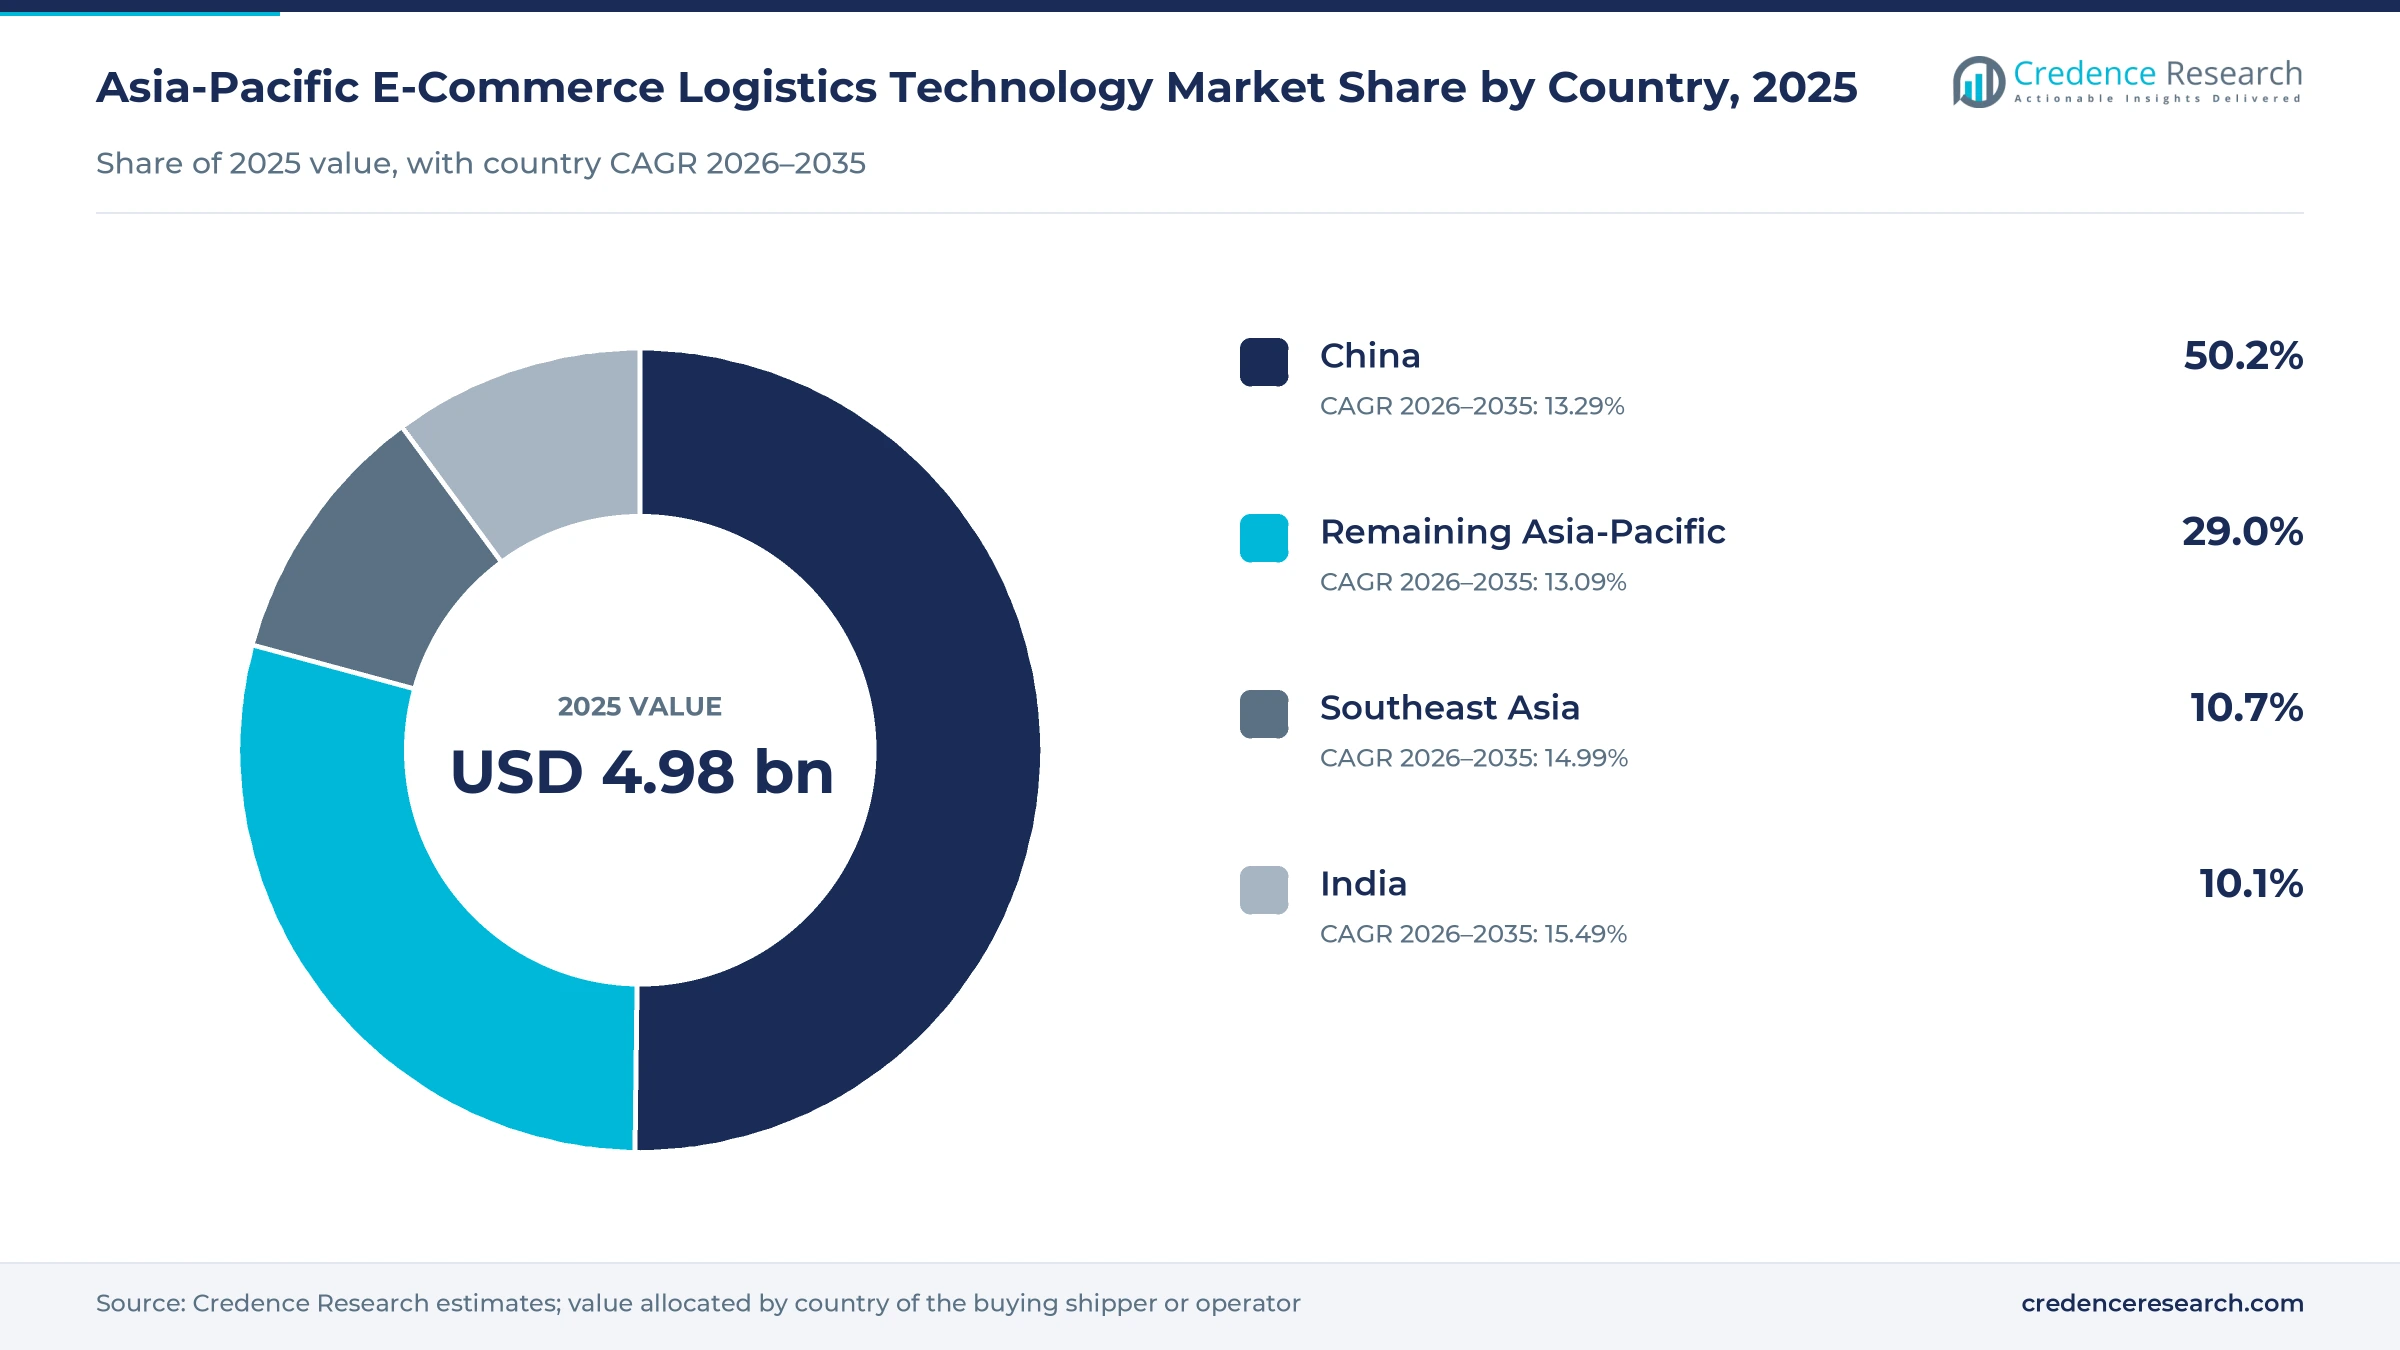
The Asia-Pacific e-commerce logistics technology market was valued at USD 4.98 billion in 2025 and is projected to increase from USD 5.79 billion in 2026 to USD 18.31 billion by 2035, registering a CAGR of 13.66% during 2026–2035. Demand comes from retailers, marketplaces and parcel operators that need software to run warehouses, plan routes, clear goods across borders and track orders for shoppers. China held the largest country share, 50.2% in 2025, because its express sector handled close to 200 billion parcels that year. India is the fastest-growing country at 15.49% a year, as dark stores and digital payments push order volumes into smaller cities. Southeast Asia follows closely, where marketplace sellers and parcel firms are moving from spreadsheets to cloud warehouse tools. Vendors have also started to add AI agents that plan routes and handle delivery exceptions, which shifts buying from single tools toward platforms that run several workflows at once.
What counts as delivery software spending in this region?
The estimate measures spending on software and platform services that run online order logistics in the Asia-Pacific region. It covers warehouse and order management systems, transport and last-mile execution tools, cross-border shipping and customs platforms, and tracking, analytics and visibility services. Values include subscriptions, usage fees, licenses with maintenance and implementation contracts sold to shippers and operators.
The estimate excludes the cost of moving parcels, warehouse rent, vehicles and robots sold as hardware. The value chain runs from cloud software vendors and logistics platform owners through system integrators and resellers to retailers, grocery and quick commerce operators, parcel and fulfillment firms, and digital marketplaces across China, India, Southeast Asia and the remaining Asia-Pacific markets.
Asia-Pacific E-Commerce Logistics Technology Market Insights
- The Asia-Pacific e-commerce logistics technology market was valued at USD 4.98 billion in 2025 and is projected to reach USD 18.31 billion by 2035, registering a CAGR of 13.66% during 2026–2035.
- China held a 50.2% share of 2025 value, because its express sector handled about 199 billion parcels in 2025, up 13.7% from the year before.
- Fulfillment systems led solution demand with a 38.0% share of 2025 value, because warehouse and order control is the first system most shippers buy.
- FarEye launched an agentic AI dispatcher on April 23, 2026, which coordinates 11 AI agents and builds delivery routes in under 15 minutes.
- Rapid delivery grows fastest among applications at 15.16% a year during 2026–2035, as Indian quick commerce chains add hundreds of dark stores each year.
Fulfillment systems lead while rapid delivery grows fastest
Why do visibility tools outgrow warehouse systems?
Based on solution type, the market is categorized into fulfillment systems, transport execution, cross-border platforms and intelligence and visibility. Fulfillment Systems led with a 38.0% share of 2025 value, because warehouse and order control is the first system a growing shipper buys. Intelligence and Visibility grows fastest at 14.50% a year, as shoppers and retailers expect live tracking and predicted delivery times.
How does rapid delivery reshape application demand?
Based on application, the market is categorized into domestic forward fulfillment, cross-border fulfillment, rapid delivery and reverse logistics. Domestic Forward Fulfillment led with a 55.0% share of 2025 value, because most orders still ship from a local warehouse to a local address. Rapid Delivery grows fastest at 15.16% a year, as dark stores need slotting, picking and dispatch tools that work in minutes.
Why do grocery operators gain share from retailers?
Based on end-use industry, the market is categorized into general merchandise retail, grocery and quick commerce, e-commerce logistics services and digital marketplaces. General Merchandise Retail led with a 34.0% share of 2025 value, because large retailers run their own warehouse and order systems. Grocery and Quick Commerce grows fastest at 15.05% a year, as store networks in India expand quickly.
How fast is cloud software replacing on-site systems?
Based on deployment model, the market is categorized into public cloud SaaS, private cloud, on-premises and hybrid deployment. Public Cloud SaaS led with a 46.0% share of 2025 value, because small and mid-sized sellers prefer monthly fees over license costs. Public Cloud SaaS also grows fastest at 14.41% a year, as large operators retire older warehouse servers at each upgrade cycle.
| Segment Group | Leading Sub-segment | Share, 2025 | Fastest-growing Sub-segment | CAGR, 2026–2035 |
|---|---|---|---|---|
| By Solution Type | Fulfillment Systems | 38.0% | Intelligence and Visibility | 14.50% |
| By Application | Domestic Forward Fulfillment | 55.0% | Rapid Delivery | 15.16% |
| By End-Use Industry | General Merchandise Retail | 34.0% | Grocery and Quick Commerce | 15.05% |
| By Deployment Model | Public Cloud SaaS | 46.0% | Public Cloud SaaS | 14.41% |
Request a Free Sample
Fill in your details and we'll send you a free sample report.
- Sample data tables & charts
- Research methodology
Parcel density, warehouse upgrades and border data lift use
How does digital retail transaction density lift demand?
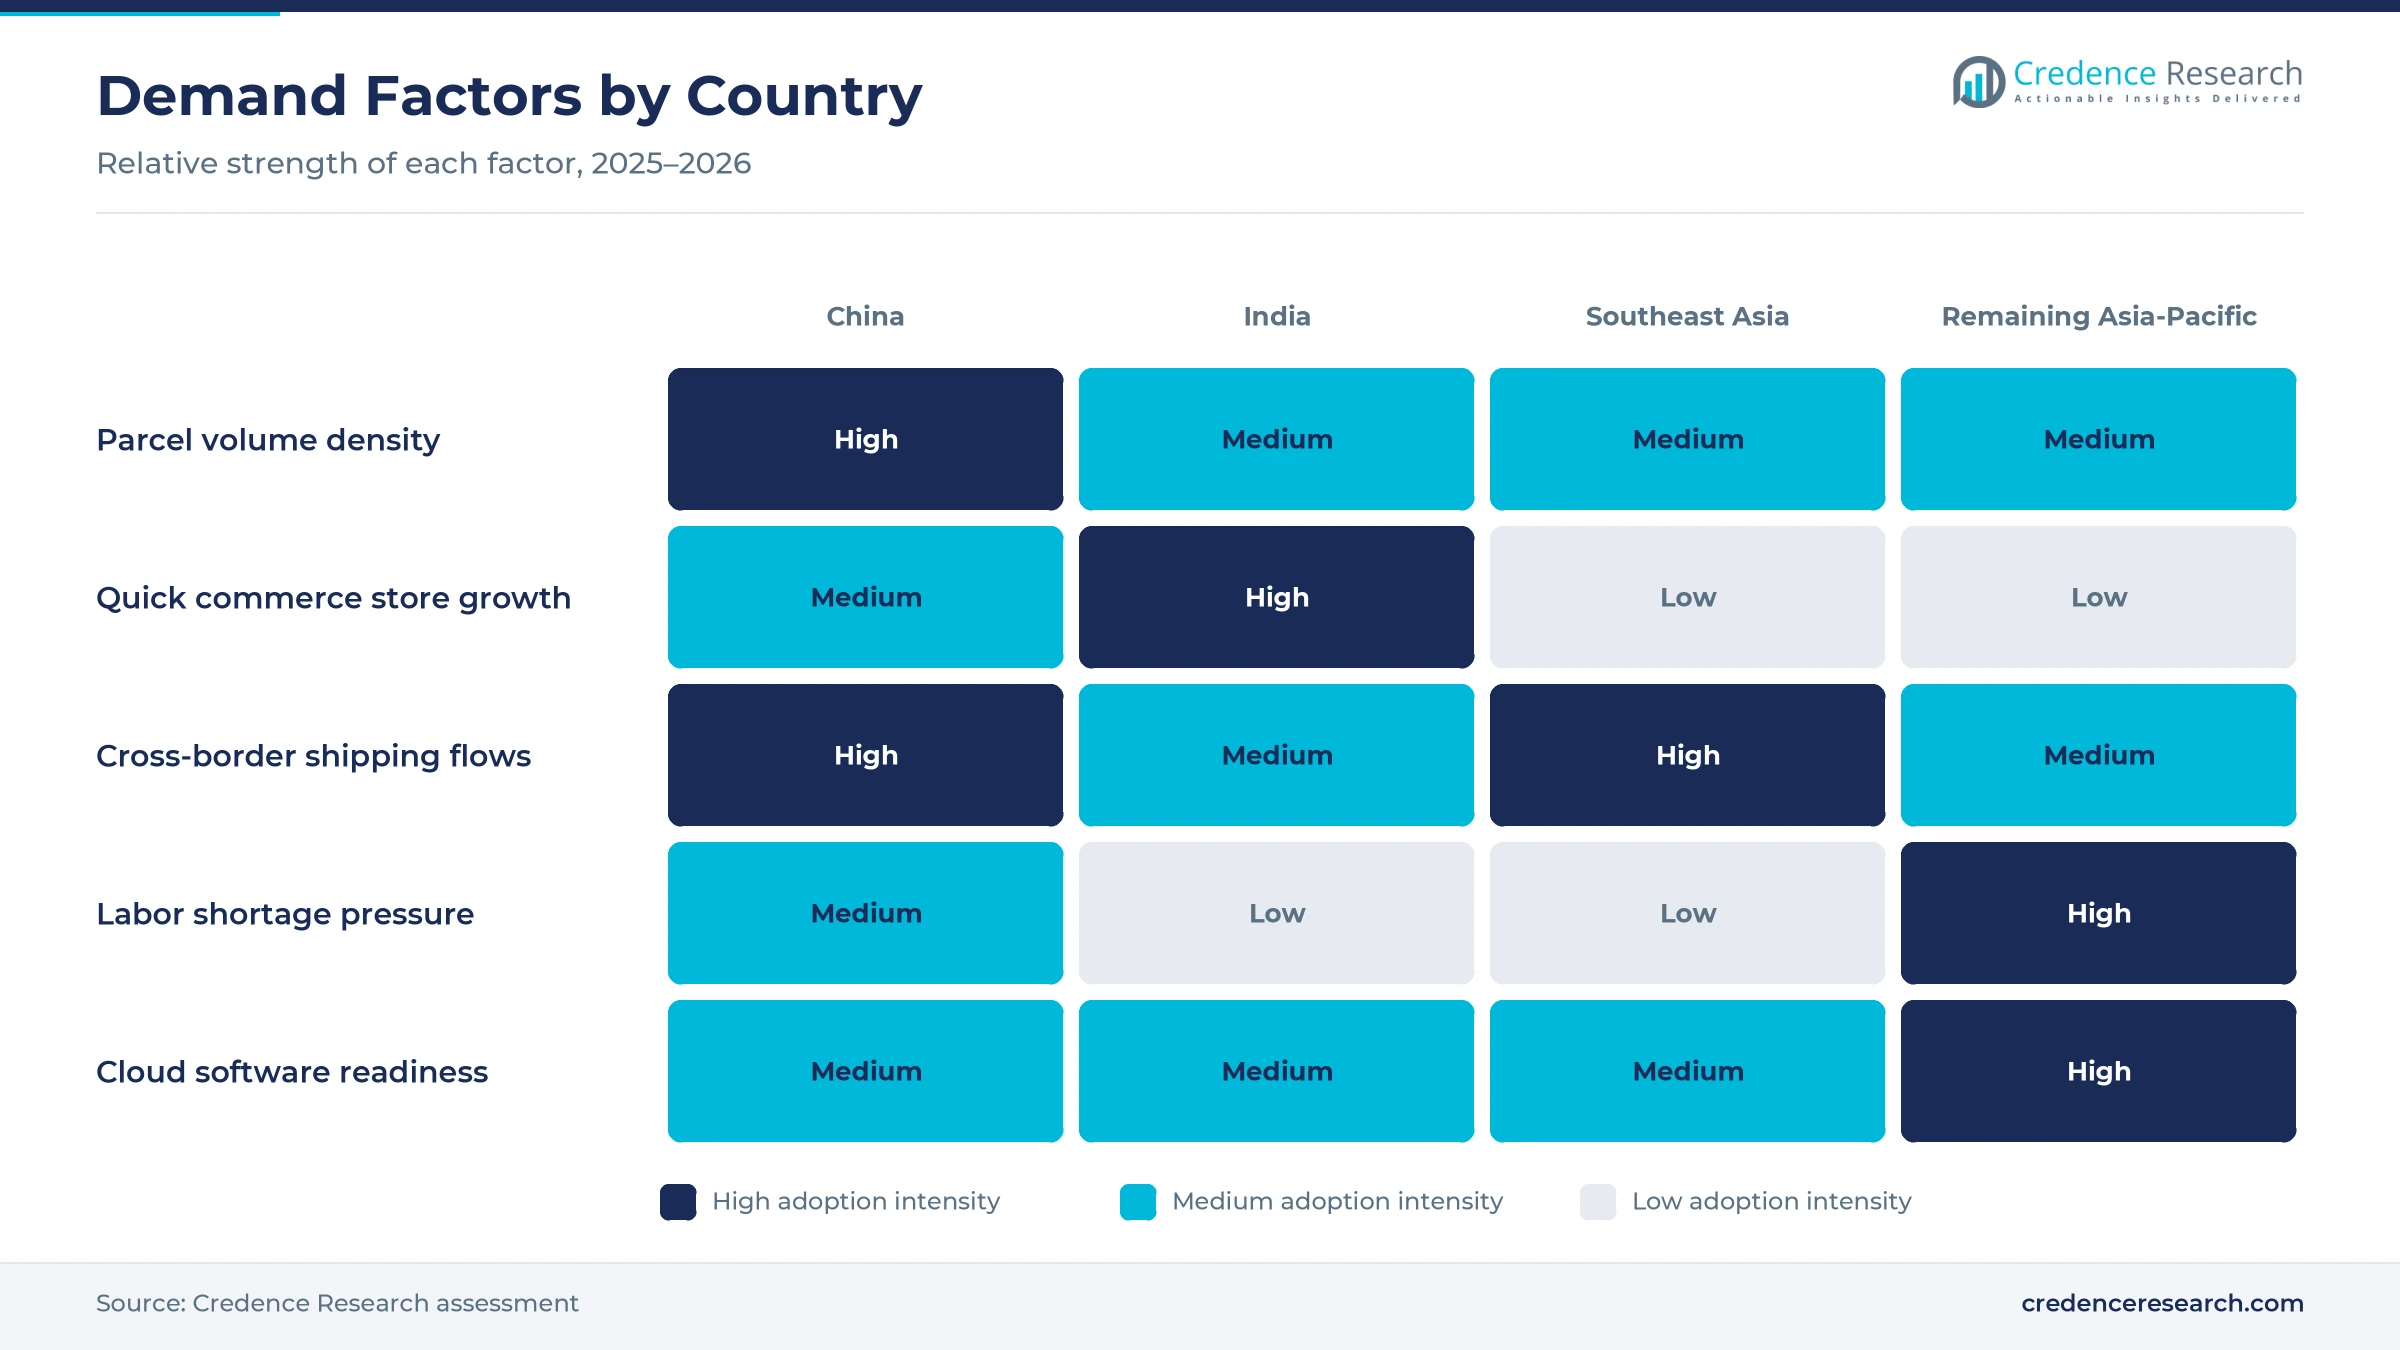
Order counts in the region are now so high that manual planning breaks down in warehouses, sort centers and delivery hubs. China's express sector handled about 199 billion parcels in 2025, up 13.7% from 2024, according to the State Post Bureau as reported by China Daily. The same bureau expects about 214 billion parcels in 2026, roughly 8% more than in 2025. In India, UPI processed 24.07 billion payments in September 2026, according to NPCI data, which signals dense small-ticket buying online. Australians also spent A$82.6 billion online in 2025, up 13.9%, across 9.8 million households, according to Australia Post. As a result, domestic forward fulfillment holds a 55.0% share of 2025 value.
Why are enterprises modernizing fulfillment systems now?
Retailers and parcel firms are replacing older servers and manual processes with cloud warehouse and order tools that connect to many sales channels. Genuine Parts Company went live with Manhattan Active Warehouse Management at its Brisbane distribution center in April 2026, after more than 1,400 user acceptance test scenarios and training for over 300 staff. Ninja Van signed for the Anchanto warehouse system in Manila in December 2025 to support B2C and B2B fulfillment in the Philippines. Swap Asia also went live on SAP Extended Warehouse Management in Malaysia in two waves, in November 2025 and February 2026. In turn, warehouse management systems anchor fulfillment software, which holds a 38.0% share of 2025 value.
How does cross-border workflow digitization add demand?
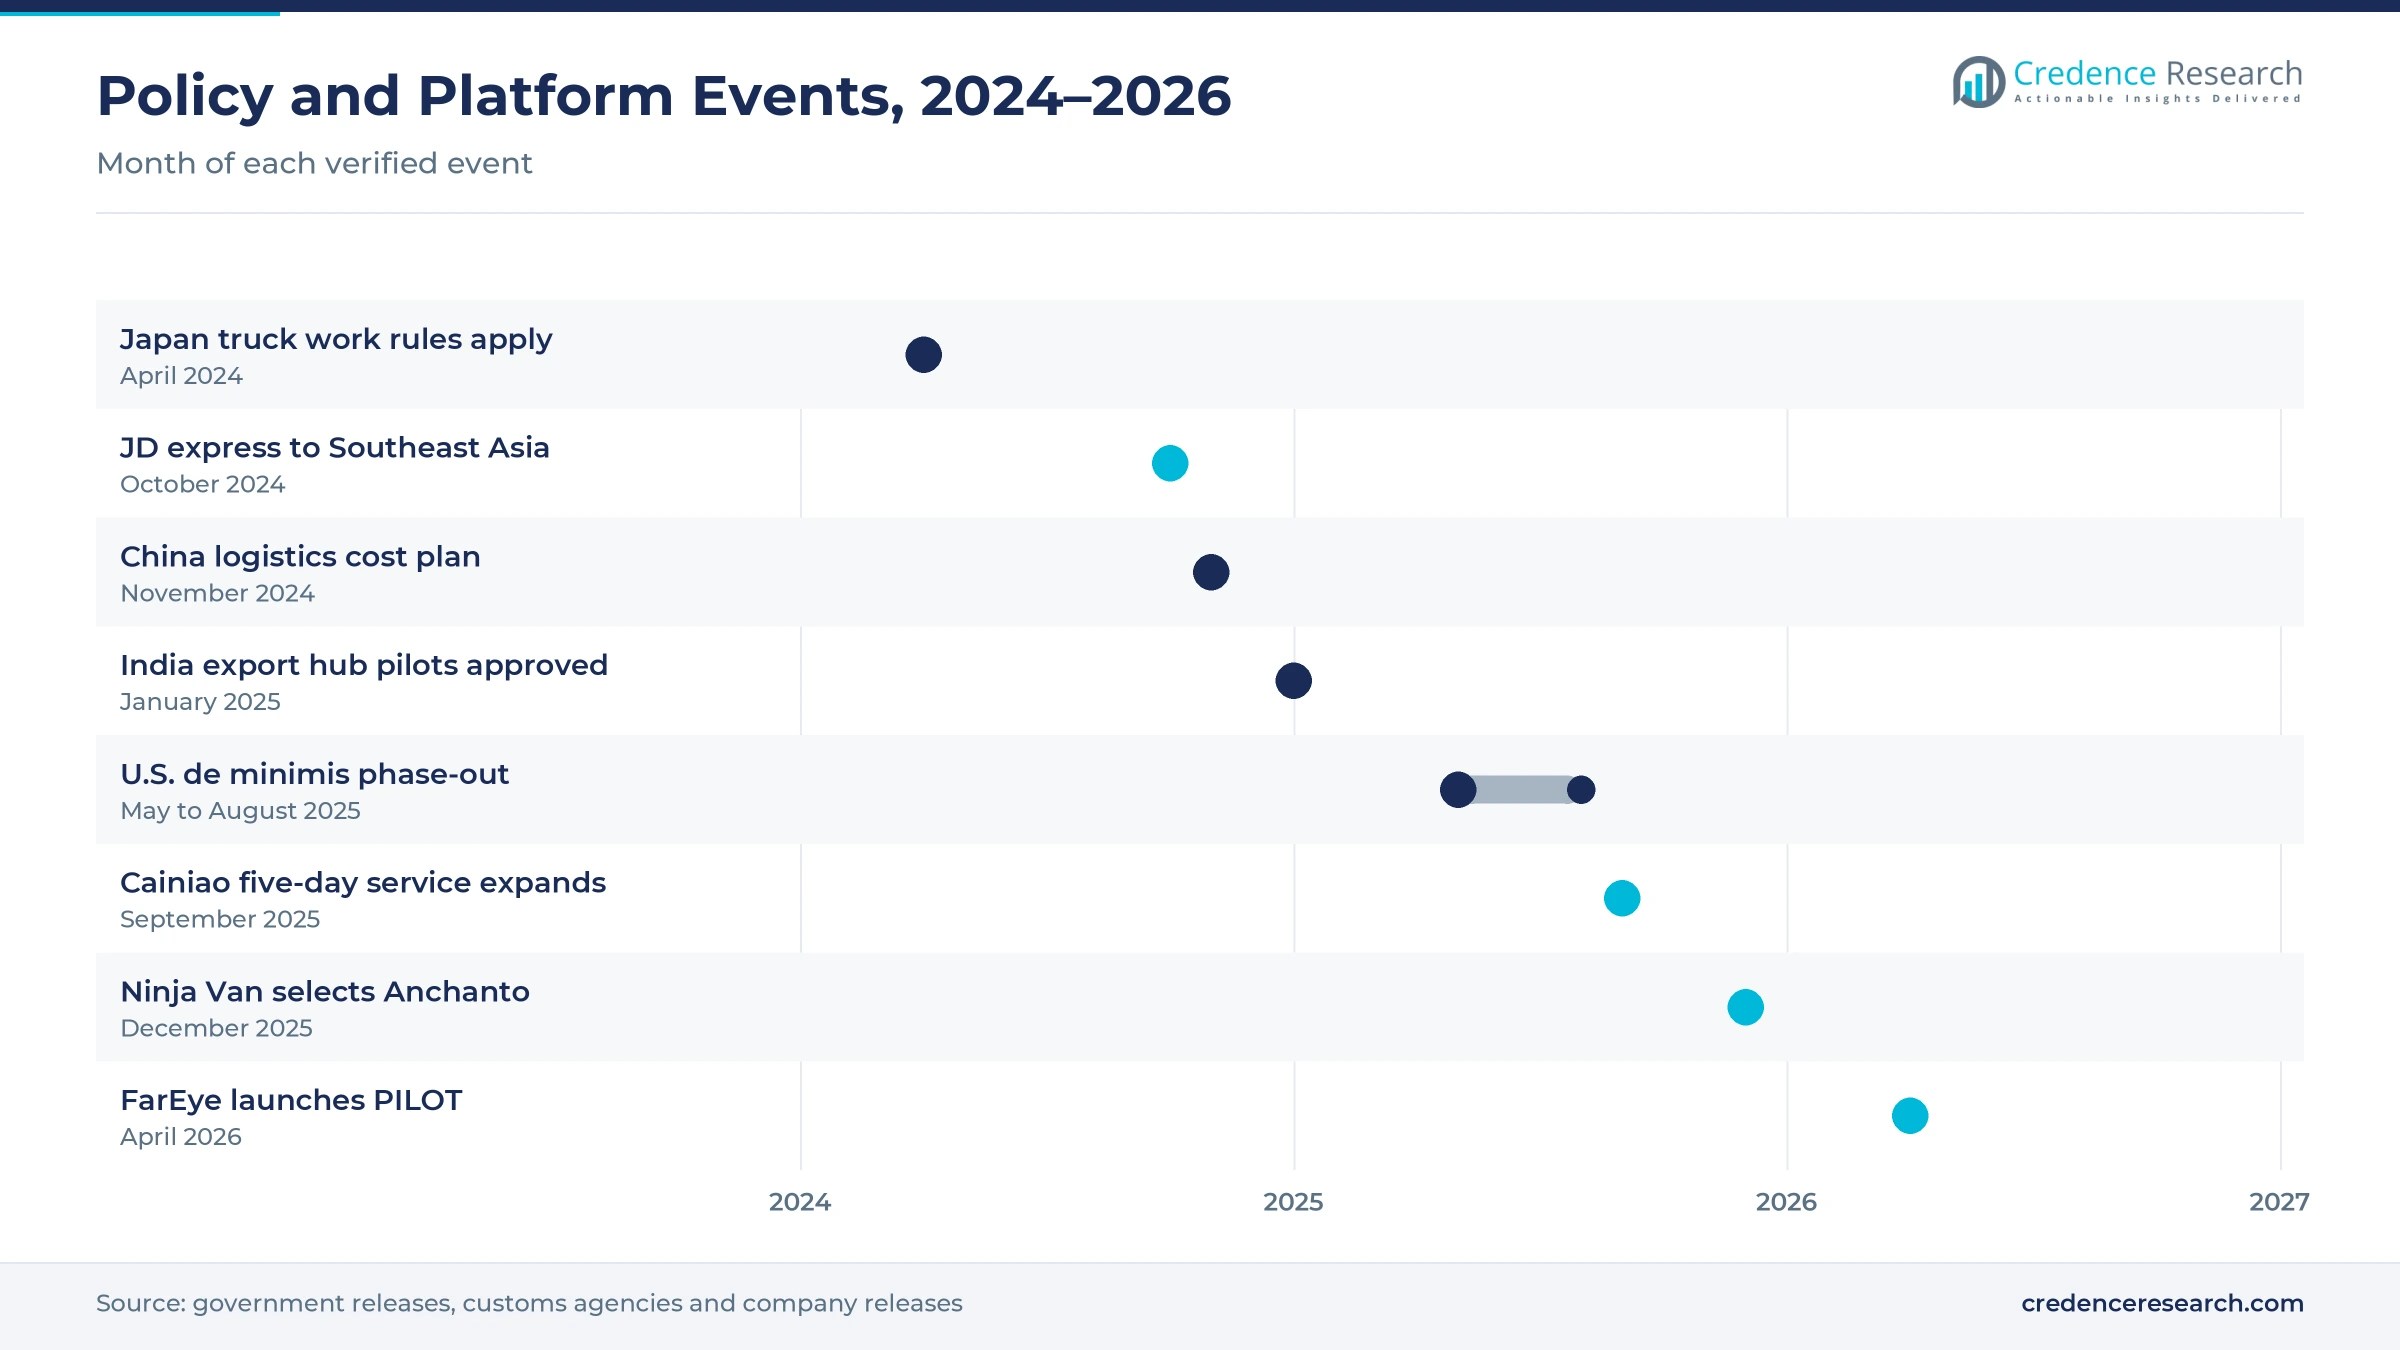
Sellers that ship abroad need customs data, duty calculation and carrier booking in one workflow, which pushes them toward cross-border platforms. China's cross-border online trade reached 2.84 trillion yuan in 2025, up 4.8%, and exports through overseas warehouses rose 3.3-fold in the first half of 2026, according to customs data. Cainiao extended its five-day cross-border delivery product to Vietnam, Singapore and the Philippines on Sept. 11, 2025. India also approved five firms to pilot e-commerce export hubs with self-sealing and simpler return rules in January 2025. Overseas rules tightened too, as U.S. Customs and Border Protection collected over USD 1 billion in duties on more than 246 million low-cost shipments after the de minimis exemption was phased out.
Why do driver shortages and cost targets favor automation?
Labor limits and national cost targets push operators to plan trucks and routes with software rather than by hand. Japan applied work-style reform rules to truck drivers from April 2024, and the transport ministry estimates a capacity shortfall of 14% in fiscal 2024 and 34% in fiscal 2030, according to MLIT. China issued an action plan on Nov. 27, 2024, to cut logistics costs to about 13.5% of GDP by 2027, according to the State Council. The ratio stood at 14.1% in the first three quarters of 2024, and the plan promotes automated warehouses, drones and unmanned vehicles. As a result, transportation management systems and route planning tools become core purchases for shippers in Japan and China.
Agentic dispatch, dark stores and unmanned delivery advance
How is the shift to agentic AI changing dispatch work?
Vendors now sell AI agents that plan, execute and fix delivery work with limited human input, rather than reports that planners must read. FarEye launched PILOT on April 23, 2026, which coordinates 11 specialized AI agents across planning, execution and control. FarEye said the tool builds next-day and same-day routes in under 15 minutes and flags bad addresses and overweight orders before dispatch. Blue Yonder unveiled an upgraded warehouse management system with agentic AI and unified labor and automation controls at the start of the fourth quarter of 2025. Blue Yonder also formed a commerce and returns business unit in the third quarter of 2025. In turn, intelligence and visibility tools grow at 14.50% a year, the fastest solution rate.
Why is the rise of dark stores lifting rapid delivery tools?
Quick commerce chains in India deliver groceries and household goods from small urban stores, and each store needs slotting, picking and rider dispatch software. Blinkit grew from 1,544 stores in June 2025 to 2,443 stores in June 2026, according to Business Today. Flipkart Minutes ran more than 1,000 micro-fulfillment centers across 130 cities as of June 2026, with a target of 1,500 by year-end. Amazon also runs more than 1,000 such centers across 100 Indian cities. These networks also hold far larger product ranges than before, with close to 80,000 items per Blinkit store in Delhi-NCR. As a result, rapid delivery grows at 15.16% a year, the fastest application rate.
Where is the next opening for subscription vendors?
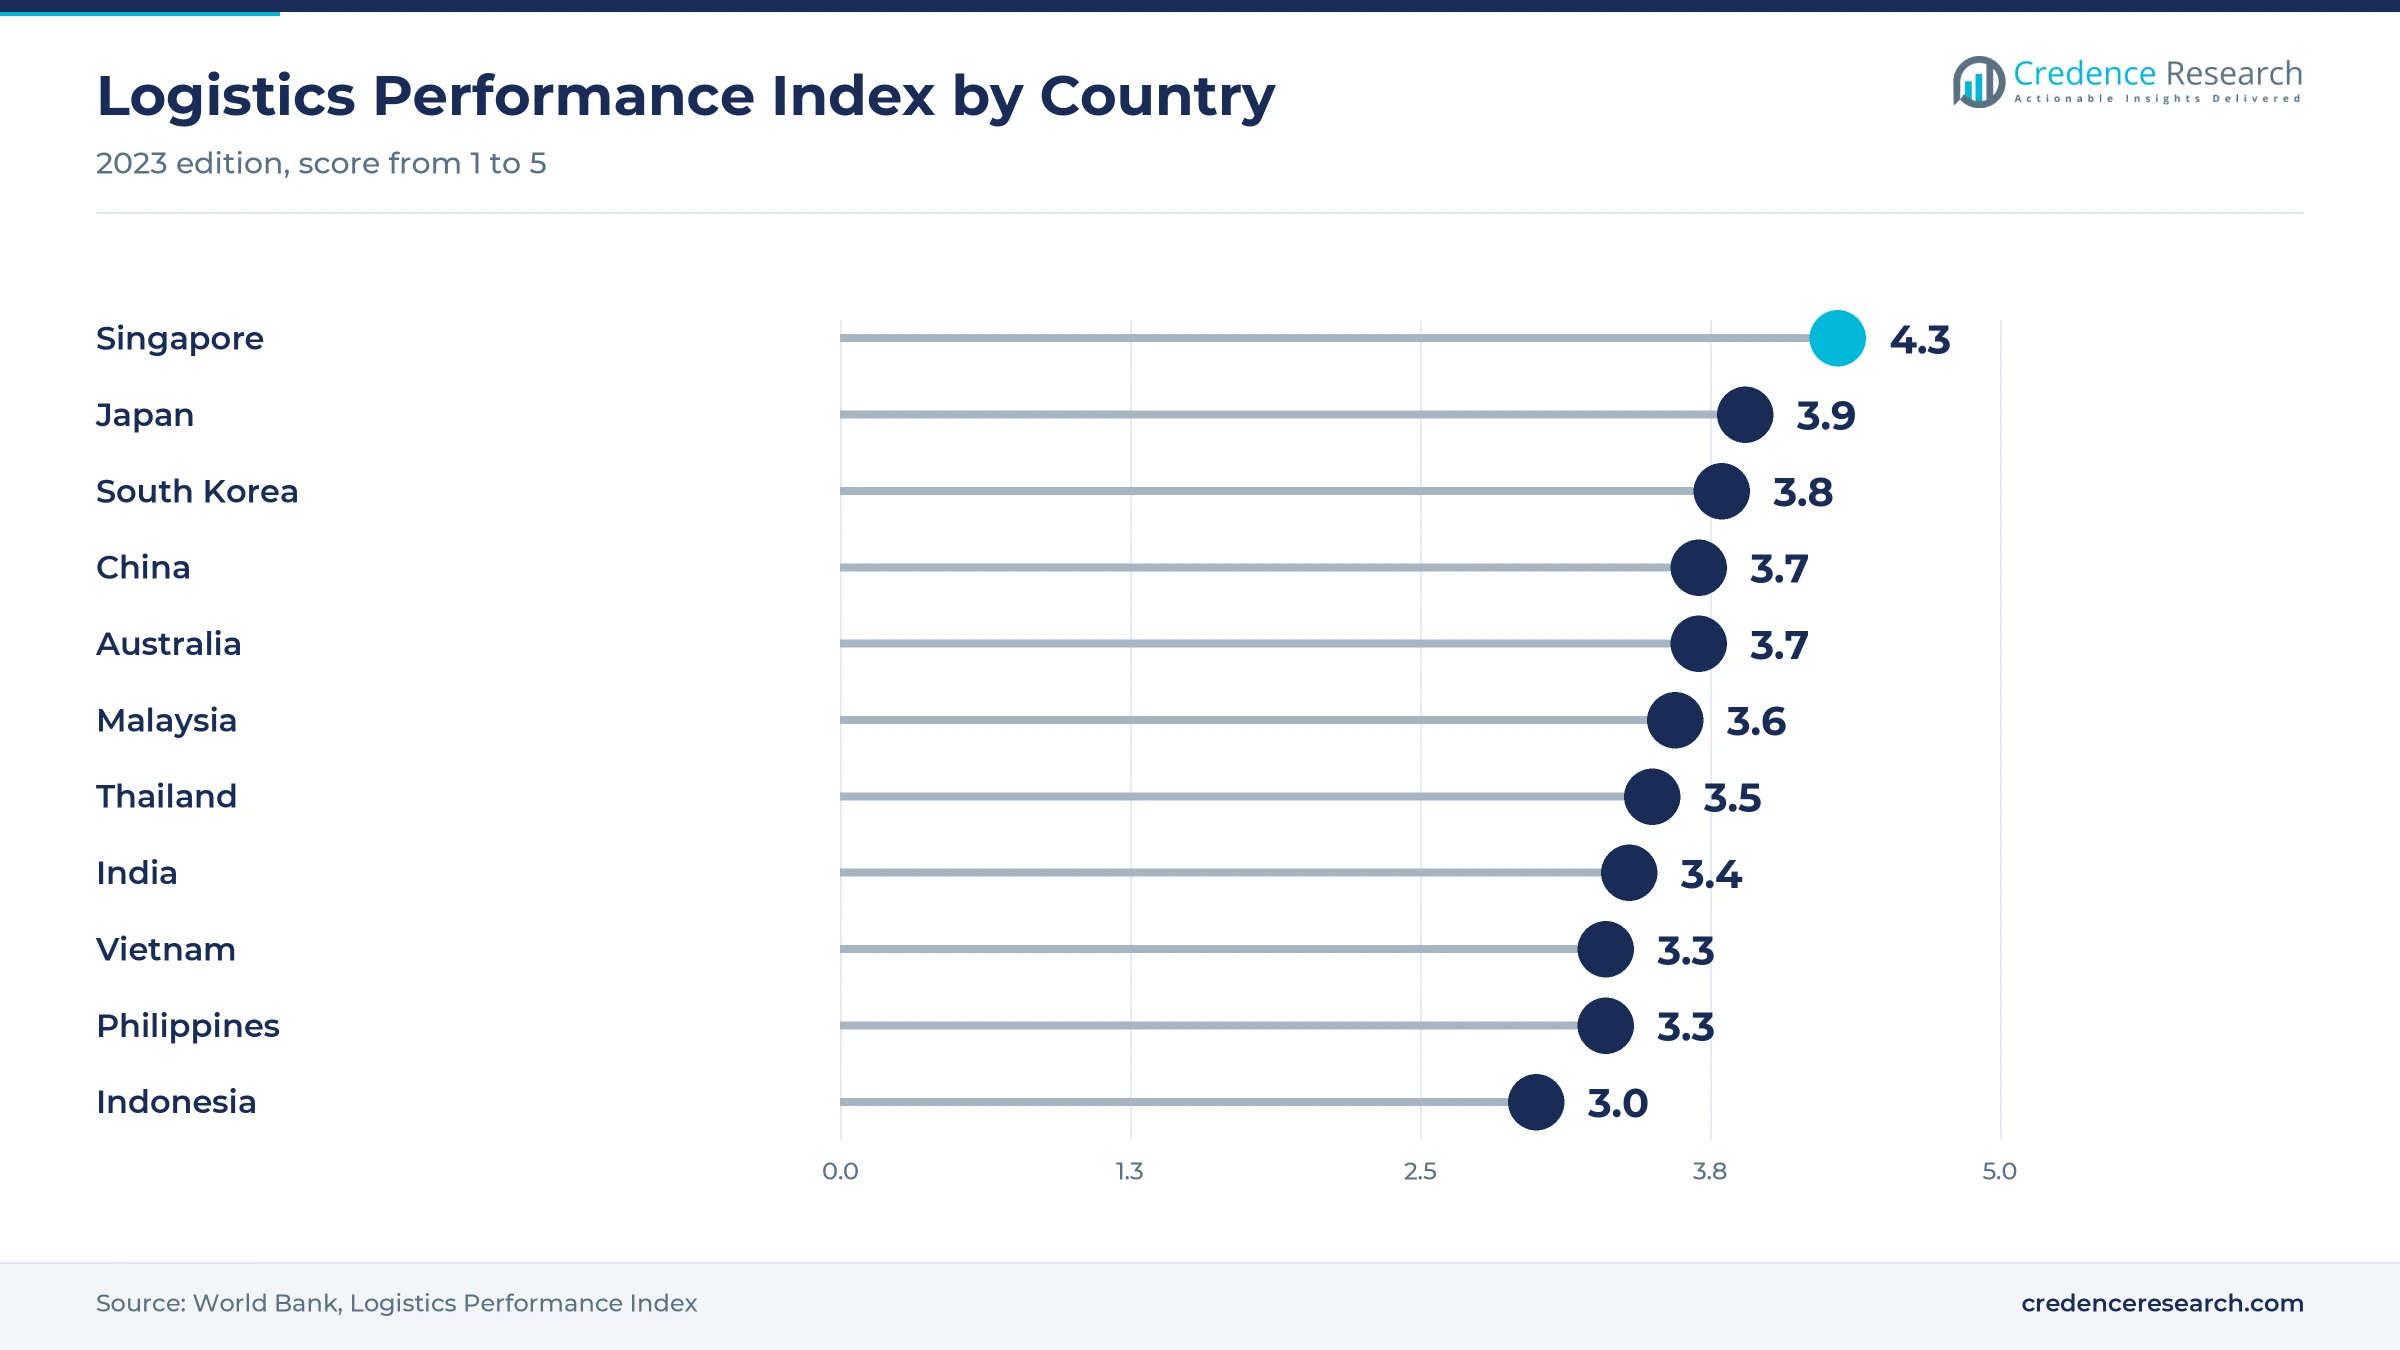
Many Southeast Asian sellers and parcel firms still run warehouses on spreadsheets, which leaves room for low-cost cloud tools. Logistics quality varies widely, as the World Bank Logistics Performance Index scored Singapore at 4.3 and Indonesia at 3.0 in its latest edition. Shippit works with more than 4,000 retailers across Australia, New Zealand, Singapore and Malaysia through more than 100 carriers. Anchanto offers more than 200 integrations with marketplaces, webstores and carriers and keeps local teams in the Philippines and 10 other countries. Malaysia also recorded RM937.5 billion in e-commerce revenue in the first nine months of 2025, up 1.9%, according to its statistics department. As a result, Southeast Asia grows at 14.99% a year.
Is unmanned delivery an opening for control software?
Drones and autonomous vans need fleet control, routing and handover software, which creates a new layer of demand for last-mile tools in China. More than 450 delivery drones operated across China in 2025, handling nearly 4 million parcels a year, according to State Post Bureau figures reported by Asia News Network. JD Logistics runs nearly 100 autonomous vehicles on 121 overnight routes in Shenzhen and said operating cost per vehicle fell about 20%. China's 2024 cost plan also promotes unmanned vehicles, drones and automated warehouses at national level. These fleets extend last-mile delivery networks into overnight hours across Chinese cities. In turn, transport execution tools gain new uses as fleets add automated vans and drones.
Carrier sprawl, data rules and trade shifts raise barriers
How does carrier fragmentation raise integration costs?
Shippers in the region work with dozens of national posts, express firms and local riders, each with its own label format and tracking feed. AfterShip alone connects to more than 1,000 carriers, which shows how many feeds a regional seller may need. Every new carrier or marketplace adds connectors that must be tested and maintained over time. As a result, mid-sized sellers face long setup periods and higher fees before software pays back. Vendors respond with prebuilt carrier libraries, open APIs and partner integrators that share the cost of each connector.
Why do data rules complicate cloud rollouts?
Countries such as China, India, Indonesia and Vietnam set rules on where personal and shipment data may be stored and how it may leave the country. Cloud vendors must run local data centers or local partners to serve these buyers. In turn, a single regional platform often becomes several country instances with separate contracts. Large vendors respond with local hosting regions, while buyers adopt hybrid deployment for sensitive customer records.
How do price-sensitive sellers slow paid adoption?
Many marketplace sellers in South and Southeast Asia are small firms that ship modest order volumes at thin margins. Many rely on free tools supplied by marketplaces and parcel firms instead of buying their own systems. As a result, vendors struggle to convert trial users into paying subscribers in these markets. Vendors respond with usage-based plans, bundled shipping rates and marketplace partnerships that place software inside the seller portal.
Why do trade policy shifts unsettle cross-border plans?
Cross-border sellers depend on duty thresholds, customs filings and import rules that can change within months. The United States ended duty-free treatment for low-value parcels from China and Hong Kong in May 2025 and for all countries in August 2025. As a result, sellers had to rework pricing, routing and data filings at short notice. Platforms respond with duty calculators, bonded overseas warehouses and faster customs data updates for their users.
China holds half of value while India grows fastest
| Country | Value, 2025 (USD billion) | Share, 2025 | CAGR, 2026–2035 |
|---|---|---|---|
| China | 2.50 | 50.2% | 13.29% |
| Remaining Asia-Pacific | 1.44 | 29.0% | 13.09% |
| Southeast Asia | 0.53 | 10.7% | 14.99% |
| India | 0.50 | 10.1% | 15.49% |
Why does China hold half of regional value?
China held a 50.2% share of 2025 value and grows at 13.29% a year, because it runs the largest parcel network in the world and hosts platform owners such as Cainiao and JD Logistics. The express sector handled about 199 billion parcels in 2025, and customs data show cross-border online trade of 2.84 trillion yuan in the same year. The national plan to cut logistics costs to about 13.5% of GDP by 2027 also favors automated warehouses.
How does India become the fastest-growing country?
India held a 10.1% share of 2025 value and grows fastest at 15.49% a year, because quick commerce and digital payments expand online buying beyond the largest metros. Blinkit reached 2,443 stores by June 2026, and UPI processed 24.07 billion payments in September 2026. The government ULIP data platform passed 1 billion API transactions in March 2025, according to Indian Chemical News, which gives shippers shared tracking data to build on.
What drives cloud software uptake in Southeast Asia?
Southeast Asia held a 10.7% share of 2025 value and grows at 14.99% a year, because marketplace sellers and parcel firms are adopting cloud warehouse tools. JD Logistics runs nine overseas warehouses in Malaysia, Thailand, Singapore, Vietnam and Indonesia, and Cainiao added Vietnam, Singapore and the Philippines to its five-day service in 2025. Ninja Van also chose the Anchanto warehouse system for the Philippines.
Why do mature markets add steady upgrade demand?
The remaining Asia-Pacific markets held a 29.0% share of 2025 value and grow at 13.09% a year, because Japan, Australia and South Korea already run mature systems. Japan's transport ministry estimated a 14% truck capacity shortfall for fiscal 2024, which pushes shippers toward route and load planning tools. Australia adds demand from upgrades such as the Manhattan system at Genuine Parts Company in Brisbane.
Network launches and system go-lives, 2024 to 2026
| Development | Status and market relevance |
|---|---|
| In October 2024, JD Logistics extended international express delivery to seven Southeast Asian countries. | Adds cross-border parcel lanes from China to the region |
| In September 2025, Cainiao extended its five-day cross-border delivery product to Vietnam, Singapore and the Philippines. | Widens fast cross-border service in Southeast Asia |
| In December 2025, Ninja Van signed for the Anchanto warehouse system for its Philippine operations. | Moves a major parcel firm to cloud warehouse control |
| In April 2026, Manhattan Associates and Genuine Parts Company went live with a cloud warehouse system in Brisbane. | Shows enterprise migration from older systems in Australia |
| In April 2026, FarEye launched PILOT, an agentic AI dispatcher for last-mile delivery. | Brings AI agents into route planning and exception handling |
Cloud warehouse control, AI dispatch and tracking APIs
- Cloud warehouse control runs receiving, slotting, picking and packing on shared servers, which lets sellers add sites without buying new hardware.
- AI dispatch agents plan routes, book delivery slots and fix exceptions on their own, which cuts the planner time each hub needs.
- Tracking and returns APIs connect a seller to hundreds of carriers through one link, and AfterShip connects to more than 1,000 carriers.
- Customs data platforms prepare duty, tax and product filings for each parcel, which lets sellers adjust quickly when border rules change.
Need a Custom Version of This Report?
Tailor the scope, geography, or segments to your exact requirements.
- Custom geography or segment scope
- Direct access to our analyst team
Platform networks compete with cloud software specialists
Competition combines logistics platform owners from China with global enterprise software vendors and regional cloud specialists. Cainiao and JD Logistics bundle their own warehouses, cross-border lanes and software, and JD Logistics runs more than 130 bonded, direct mail and overseas warehouses across 23 countries and regions. SAP and Manhattan Associates sell warehouse systems to large shippers, with recent go-lives in Malaysia and Australia. Blue Yonder adds agentic AI to warehouse and returns tools and counts 7-Eleven Philippines among its customers. FarEye competes in last-mile dispatch, AfterShip in tracking and returns, and Anchanto and Shippit in cloud tools for mid-sized sellers in Southeast Asia and Australia. Companies compete on carrier coverage, speed of setup and local support rather than on license price alone, and partnerships with parcel firms often decide which platform a seller adopts.
Which platform owners and software vendors lead the region?
| Company | Type | Role in the market |
|---|---|---|
| Cainiao | Platform owner | Runs cross-border lanes; five-day service in Vietnam, Singapore, Philippines |
| JD Logistics | Platform owner | Nine overseas warehouses in Southeast Asia; autonomous delivery in Shenzhen |
| SAP | Enterprise software | Extended Warehouse Management live at Swap Asia in Malaysia |
| Manhattan Associates | Enterprise software | Cloud warehouse system live at Genuine Parts in Brisbane |
| Blue Yonder | Enterprise software | Agentic AI warehouse tools; 7-Eleven Philippines among customers |
| FarEye | Delivery software | Launched PILOT agentic AI dispatcher in April 2026 |
| AfterShip | Tracking and returns | Connects to more than 1,000 carriers; offices across Asia |
| Anchanto | Cloud fulfillment | Warehouse system chosen by Ninja Van in the Philippines |
| Shippit | Shipping software | Serves more than 4,000 retailers in Australia, New Zealand, Singapore, Malaysia |
Credence Research view on regional delivery software
Credence Research's view is that Asia-Pacific demand for delivery software will grow quickly because parcel volumes, border rules and dark store networks all need more automated control. Fulfillment systems remain the largest solution type, while visibility tools and rapid delivery uses grow fastest. China keeps about half of regional value, and India grows fastest among the named countries. However, carrier fragmentation, local data rules and price-sensitive sellers will slow paid adoption in smaller markets. Vendors that pair wide carrier coverage with local hosting and usage-based pricing should gain share fastest.
How the regional delivery software estimate was built
The report uses 2025 as the base year on a calendar basis, and market values come from the Credence Research model. That model combines parcel volume statistics, online spending data, logistics performance indicators and product and customer information disclosed by companies. Segment splits, 2025 country shares and country growth rates are Credence Research estimates. Sources used are official statistics, government releases, company releases, news reports and company websites, and no interviews or surveys were used.
Rapid delivery and border data carry demand to 2035
The Asia-Pacific e-commerce logistics technology market is expected to reach USD 18.31 billion by 2035, a 13.66% CAGR during 2026–2035, as parcel density and border data needs widen software use. Growth should stay strong through 2028 while large shippers move warehouses to the cloud and quick commerce chains add stores. After that, AI dispatch and visibility services will carry more growth as warehouse systems mature. Faster growth in Southeast Asian marketplaces would raise this outlook, while tighter trade rules would lower it. Vendors with local hosting and broad carrier links are expected to gain the most.
Frequently Asked Questions
How big is the Asia-Pacific e-commerce logistics technology market?
Which solution type leads regional demand?
Which country leads the regional market?
Why does rapid delivery grow fastest among applications?
How do cross-border rules affect software demand?
Which deployment model leads the market?
Who are the leading companies in the region?
What are the main challenges for buyers?
Table of Content
Chapter 1 Market Segmentation
- 1.1 Segmentation Framework
- 1.1.1 Product and Service Classification
- 1.1.2 Application and End-Use Classification
- 1.1.3 Technology and Solution Classification
- 1.1.4 Customer and Distribution Channel Classification
- 1.1.5 Geographic Segmentation
- 1.1.6 Market Segment Definitions and Boundaries
- 1.2 By Solution Type
- 1.2.1 Fulfillment Systems
- 1.2.2 Transport Execution
- 1.2.3 Cross-Border Platforms
- 1.2.4 Intelligence and Visibility
- 1.3 By Application
- 1.3.1 Domestic Forward Fulfillment
- 1.3.2 Cross-Border Fulfillment
- 1.3.3 Rapid Delivery
- 1.3.4 Reverse Logistics
- 1.4 By End-Use Industry
- 1.4.1 General Merchandise Retail
- 1.4.2 Grocery and Quick Commerce
- 1.4.3 E-Commerce Logistics Services
- 1.4.4 Digital Marketplaces
- 1.5 By Deployment Model
- 1.5.1 Public Cloud SaaS
- 1.5.2 Private Cloud
- 1.5.3 On-Premises
- 1.5.4 Hybrid Deployment
- 1.6 By Country
- 1.6.1 China
- 1.6.2 India
- 1.6.3 Southeast Asia
- 1.6.4 Remaining Asia-Pacific
Chapter 2 Introduction
- 2.1 Report Objectives and Scope
- 2.2 Product Definition and Industry Terminology
- 2.3 Market Inclusions and Exclusions
- 2.4 Research Process
- 2.4.1 Primary Research and Expert Interviews
- 2.4.2 Secondary Research and Source Review
- 2.4.3 Top-Down and Bottom-Up Estimation
- 2.4.4 Data Triangulation and Verification
- 2.5 Market Size Measurement Basis
- 2.5.1 2025: USD 4.98 billion → 2035: USD 18.31 billion
- 2.6 Historical and Forecast Reference Periods
- 2.6.1 Historical Period: 2018-2025
- 2.6.2 Base Year: 2025
- 2.6.3 Forecast Period: 2025-2035
- 2.7 Research Assumptions and Limitations
Chapter 3 Executive Summary
- 3.1 Market Snapshot and Key Findings
- 3.2 Base-Year Market Size, 2025
- 3.3 Forecast Market Size, 2035
- 3.4 Revenue and Volume Growth Outlook
- 3.5 Key Demand and Supply Indicators
- 3.6 Leading Market Segments
- 3.7 Fastest-Growing Market Opportunities
- 3.8 Regional Performance Highlights
- 3.9 Technology and Industry Transformation
- 3.10 Competitive Landscape Summary
- 3.11 Analyst View and Strategic Implications
Chapter 4 Asia-Pacific E-Commerce Logistics Technology Market Trends and Developments
- 4.1 Historical Industry Development, 2018-2025
- 4.2 Recent Market Trends and Developments
- 4.3 Demand and Customer Behavior Trends
- 4.4 Technology and Product Innovation
- 4.5 Artificial Intelligence, Automation and Digitalization
- 4.6 Local Manufacturing and Supply Chain Realignment
- 4.7 Industry Partnerships, Mergers and Acquisitions
- 4.8 Sustainability and Circular Economy Developments
- 4.9 Government and Private Sector Investment Trends
- 4.10 Emerging Business Models and Commercialization
- 4.11 Industry Developments and Announcements
Chapter 5 Asia-Pacific E-Commerce Logistics Technology Market Supply and Demand Analysis
- 5.1 Demand Trend and Consumption Analysis, 2018-2025
- 5.2 Demand Forecast, 2025-2035
- 5.3 Supply Chain Structure and Procurement Trends
- 5.4 Supply-Demand Gap and Bottlenecks
- 5.5 Import Dependence and Sourcing Structure
- 5.6 Regional Supply and Demand Concentration
Chapter 6 Asia-Pacific E-Commerce Logistics Technology Market Pricing Analysis
- 6.1 Pricing Structure and Measurement
- 6.2 Historical Pricing Trends, 2018-2025
- 6.3 Pricing Outlook, 2025-2035
- 6.4 Pricing by Product and Market Segment
- 6.5 Geographic Pricing Differences
- 6.6 Key Input, Energy, Labor and Logistics Costs
- 6.7 Contract Pricing and Purchasing Models
- 6.8 Pricing Sensitivity and Competitive Positioning
- 6.9 Price, Margin and Profitability Implications
Chapter 7 Asia-Pacific E-Commerce Logistics Technology Market Dynamics
- 7.1 Market Growth Drivers
- 7.1.1 Demand-Side Drivers
- 7.1.2 Technology and Innovation Drivers
- 7.1.3 Infrastructure and Investment Drivers
- 7.1.4 Regulatory and Policy Drivers
- 7.2 Market Restraints
- 7.2.1 Cost and Affordability Constraints
- 7.2.2 Technology and Adoption Barriers
- 7.2.3 Supply Chain and Operational Constraints
- 7.3 Market Challenges
- 7.3.1 Competitive Pressure and Margin Erosion
- 7.3.2 Skills, Infrastructure and Implementation Gaps
- 7.4 Emerging Market Opportunities
- 7.5 Market Dynamics Impact and Time-Horizon Assessment
Chapter 8 Asia-Pacific E-Commerce Logistics Technology Value Chain Analysis
- 8.1 Industry Value Chain Overview
- 8.2 Upstream Suppliers and Critical Inputs
- 8.3 Technology and Component Providers
- 8.4 Manufacturing or Service Delivery
- 8.5 Distribution, Channel Partners and Integrators
- 8.6 Downstream Applications and End Users
- 8.7 Value Addition and Profit Pools
- 8.8 Vertical Integration and Outsourcing
- 8.9 Supplier Concentration and Risk
- 8.10 Supply Chain Localization and Resilience
Chapter 9 Asia-Pacific E-Commerce Logistics Technology Market Regulations and Policies
- 9.1 Relevant Laws, Standards and Compliance Frameworks
- 9.2 Product, Service, Safety and Quality Requirements
- 9.3 Government Policies, Incentives and Subsidies
- 9.4 Imports, Exports and Trade Barriers
- 9.5 Public Procurement and Local Content Requirements
- 9.6 Data Protection, AI and Cybersecurity Compliance
- 9.7 Upcoming Policy Changes and Market Implications
Chapter 10 Asia-Pacific E-Commerce Logistics Technology Market Hotspots and Opportunities
- 10.1 Market Opportunity Mapping and Growth Hotspots
- 10.2 High-Growth Applications and Customer Groups
- 10.3 Underserved Markets and White-Space Opportunities
- 10.4 Emerging Technology and Product Opportunities
- 10.5 New Capacity and Investment Hotspots
- 10.6 Market Entry and Expansion Opportunities
- 10.7 Distribution and Partnership Opportunities
- 10.8 Near-Term and Long-Term Commercial Potential
- 10.9 Opportunity Attractiveness and Execution Risks
Chapter 11 Asia-Pacific E-Commerce Logistics Technology Market Outlook, 2025-2035
- 11.1 Market Size and Analysis
- 11.1.1 Revenue (Market Measurement: 2025: USD 4.98 billion → 2035: USD 18.31 billion)
- 11.1.2 Historical Market Size, 2018-2025
- 11.1.3 Base-Year Market Size, 2025
- 11.2 Market Forecast, 2025-2035
- 11.2.1 Revenue Forecast to 2035
- 11.2.2 CAGR and Year-on-Year Growth
- 11.2.3 Incremental Revenue Opportunity
- 11.3 Forecast Assumptions and Scenario Analysis
- 11.3.1 Base-Case Forecast
- 11.3.2 Optimistic and Conservative Scenarios
- 11.3.3 Technology, Pricing and Policy Sensitivities
- 11.4 Market Attractiveness and Growth Outlook
Chapter 12 Asia-Pacific E-Commerce Logistics Technology Market Segmentation and Outlook
- 12.1 Segmentation Summary and Market Shares, 2025
- 12.2 Largest and Fastest-Growing Segments
- 12.3 By Solution Type - Market Size and Forecast, 2025-2035
- 12.3.1 Segment Definition and Scope
- 12.3.2 Historical Market Size, 2018-2025
- 12.3.3 Revenue Forecast, 2025-2035
- 12.3.4 Base-Year Market Share, 2025
- 12.3.5 Segment CAGR and Growth Drivers
- 12.3.6 Subsegment Market Size and Forecast
- 12.3.6.1 Fulfillment Systems
- 12.3.6.2 Transport Execution
- 12.3.6.3 Cross-Border Platforms
- 12.3.6.4 Intelligence and Visibility
- 12.3.7 Subsegment Pricing and Adoption Trends
- 12.3.8 Leading Suppliers and Competition
- 12.3.9 Regional Demand and Opportunities
- 12.4 By Application - Market Size and Forecast, 2025-2035
- 12.4.1 Segment Definition and Scope
- 12.4.2 Historical Market Size, 2018-2025
- 12.4.3 Revenue Forecast, 2025-2035
- 12.4.4 Base-Year Market Share, 2025
- 12.4.5 Segment CAGR and Growth Drivers
- 12.4.6 Subsegment Market Size and Forecast
- 12.4.6.1 Domestic Forward Fulfillment
- 12.4.6.2 Cross-Border Fulfillment
- 12.4.6.3 Rapid Delivery
- 12.4.6.4 Reverse Logistics
- 12.4.7 Subsegment Pricing and Adoption Trends
- 12.4.8 Leading Suppliers and Competition
- 12.4.9 Regional Demand and Opportunities
- 12.5 By End-Use Industry - Market Size and Forecast, 2025-2035
- 12.5.1 Segment Definition and Scope
- 12.5.2 Historical Market Size, 2018-2025
- 12.5.3 Revenue Forecast, 2025-2035
- 12.5.4 Base-Year Market Share, 2025
- 12.5.5 Segment CAGR and Growth Drivers
- 12.5.6 Subsegment Market Size and Forecast
- 12.5.6.1 General Merchandise Retail
- 12.5.6.2 Grocery and Quick Commerce
- 12.5.6.3 E-Commerce Logistics Services
- 12.5.6.4 Digital Marketplaces
- 12.5.7 Subsegment Pricing and Adoption Trends
- 12.5.8 Leading Suppliers and Competition
- 12.5.9 Regional Demand and Opportunities
- 12.6 By Deployment Model - Market Size and Forecast, 2025-2035
- 12.6.1 Segment Definition and Scope
- 12.6.2 Historical Market Size, 2018-2025
- 12.6.3 Revenue Forecast, 2025-2035
- 12.6.4 Base-Year Market Share, 2025
- 12.6.5 Segment CAGR and Growth Drivers
- 12.6.6 Subsegment Market Size and Forecast
- 12.6.6.1 Public Cloud SaaS
- 12.6.6.2 Private Cloud
- 12.6.6.3 On-Premises
- 12.6.6.4 Hybrid Deployment
- 12.6.7 Subsegment Pricing and Adoption Trends
- 12.6.8 Leading Suppliers and Competition
- 12.6.9 Regional Demand and Opportunities
- 12.7 By Country - Market Size and Forecast, 2025-2035
- 12.7.1 Segment Definition and Scope
- 12.7.2 Historical Market Size, 2018-2025
- 12.7.3 Revenue Forecast, 2025-2035
- 12.7.4 Base-Year Market Share, 2025
- 12.7.5 Segment CAGR and Growth Drivers
- 12.7.6 Subsegment Market Size and Forecast
- 12.7.6.1 China
- 12.7.6.2 India
- 12.7.6.3 Southeast Asia
- 12.7.6.4 Remaining Asia-Pacific
- 12.7.7 Subsegment Pricing and Adoption Trends
- 12.7.8 Leading Suppliers and Competition
- 12.7.9 Regional Demand and Opportunities
- 12.8 Segment Growth Comparison
- 12.9 Segment Attractiveness and Priority Matrix
Chapter 13 Asia-Pacific E-Commerce Logistics Technology End-Use and Application Market Outlook
- 13.1 End-Use Industry and Customer Demand Structure
- 13.2 Leading Applications and Customer Groups
- 13.3 End-Use Market Size, Share and Forecast
- 13.4 Major End-Use Industry Deep Dives
- 13.4.1 Customer Requirements and Use Cases
- 13.4.2 Demand and Replacement Cycles
- 13.4.3 Technical and Regulatory Considerations
- 13.4.4 Purchasing and Procurement Models
- 13.4.5 Leading Vendors and Distribution Channels
- 13.4.6 Forecast and Commercial Opportunities
- 13.5 Emerging Applications and Cross-Segment Demand
- 13.6 End-Use Industry Investment Priorities
Chapter 14 Asia-Pacific E-Commerce Logistics Technology Geographic Market Outlook, 2025-2035
- 14.1 Regional Market Size and Country-Level Shares, 2025
- 14.2 Country Market Size Comparison, 2025
- 14.3 Country Market Forecasts, 2025-2035
- 14.4 Subregional Industrial and Demand Clusters
- 14.5 Intra-Regional Pricing and Cost Differences
- 14.6 Cross-Border Trade and Supply Networks
- 14.7 Regional Supply and Demand Balances
- 14.8 Country Opportunity Comparison and Prioritization
Note: Every listed country is covered on the structure shown under the first country.
Chapter 15 Asia-Pacific E-Commerce Logistics Technology Technology, Innovation and Sustainability Outlook
- 15.1 Technology Landscape and Maturity
- 15.2 Product, Process and Service Innovation
- 15.3 AI, Automation and Digital Tools in the Industry
- 15.4 Technology Adoption and Performance Benchmarking
- 15.5 Innovation Pipeline and R&D Investment
- 15.6 Patent and Intellectual Property Trends
- 15.7 Energy Efficiency and Resource Management
- 15.8 Sustainability, Recycling and Circularity
- 15.9 Technology Roadmap, 2025-2035
- 15.10 Risks of Obsolescence and Technology Substitution
Chapter 16 Asia-Pacific E-Commerce Logistics Technology Market Key Strategic Imperatives
- 16.1 Growth and Market Entry Priorities
- 16.2 High-Return Products and Segments
- 16.3 Pricing, Profitability and Cost Optimization
- 16.4 Technology Investment and Product Differentiation
- 16.5 Supply Chain Localization and Resilience
- 16.6 Distribution and Customer Acquisition
- 16.7 Partnership, Acquisition and Capacity Strategy
- 16.8 Regional Expansion Priorities
- 16.9 Short-, Medium- and Long-Term Actions
Chapter 17 Competition Outlook
- 17.1 Industry Competition Characteristics
- 17.2 Market Structure and Concentration
- 17.3 Market Share and Competitive Positioning, 2025
- 17.4 Company-Wise Revenue and Product Benchmarking
- 17.5 Production and Service Capacity Benchmarking
- 17.6 Technology, Pricing and Differentiation
- 17.7 Regional Footprint and Distribution Strength
- 17.8 Mergers, Acquisitions and Strategic Alliances
- 17.9 New Entrants and Competitive Threats
- 17.10 Porter's Five Forces and Industry Attractiveness
- 17.11 Competitive Outlook, 2025-2035
Chapter 18 Company Profiles
- 18.1 Company Coverage and Selection Criteria
- 18.2 Cainiao
- 18.2.1 Business Description
- 18.2.2 Company Ownership and Geographic Presence
- 18.2.3 Product and Service Portfolio
- 18.2.4 Manufacturing and Operating Footprint
- 18.2.5 Financial Performance and Investment
- 18.2.6 Market Share and Competitive Position
- 18.2.7 Technology and Innovation Capabilities
- 18.2.8 Strategic Alliances or Partnerships
- 18.2.9 Recent Developments
- 18.2.10 Growth Strategy and Outlook
- 18.3 JD Logistics
- 18.4 SAP
- 18.5 Blue Yonder
- 18.6 Manhattan Associates
- 18.7 AfterShip
- 18.8 FarEye
- 18.9 Anchanto
- 18.10 Shippit
- 18.11 Other Relevant Market Participants
Note: Every listed company is profiled on the structure shown under the first company. The company list is preliminary and may change based on research findings, market developments, data availability and client requirements.
Chapter 19 Disclaimer
- 19.1 Research and Forecast Disclaimer
- 19.2 Data Source and Estimation Limitations
Note: The depth of individual sections depends on data availability for this market. Volume, capacity, trade and other unit-based metrics are included where applicable.

