
Digital payments, cloud build-out and AI policy lift demand
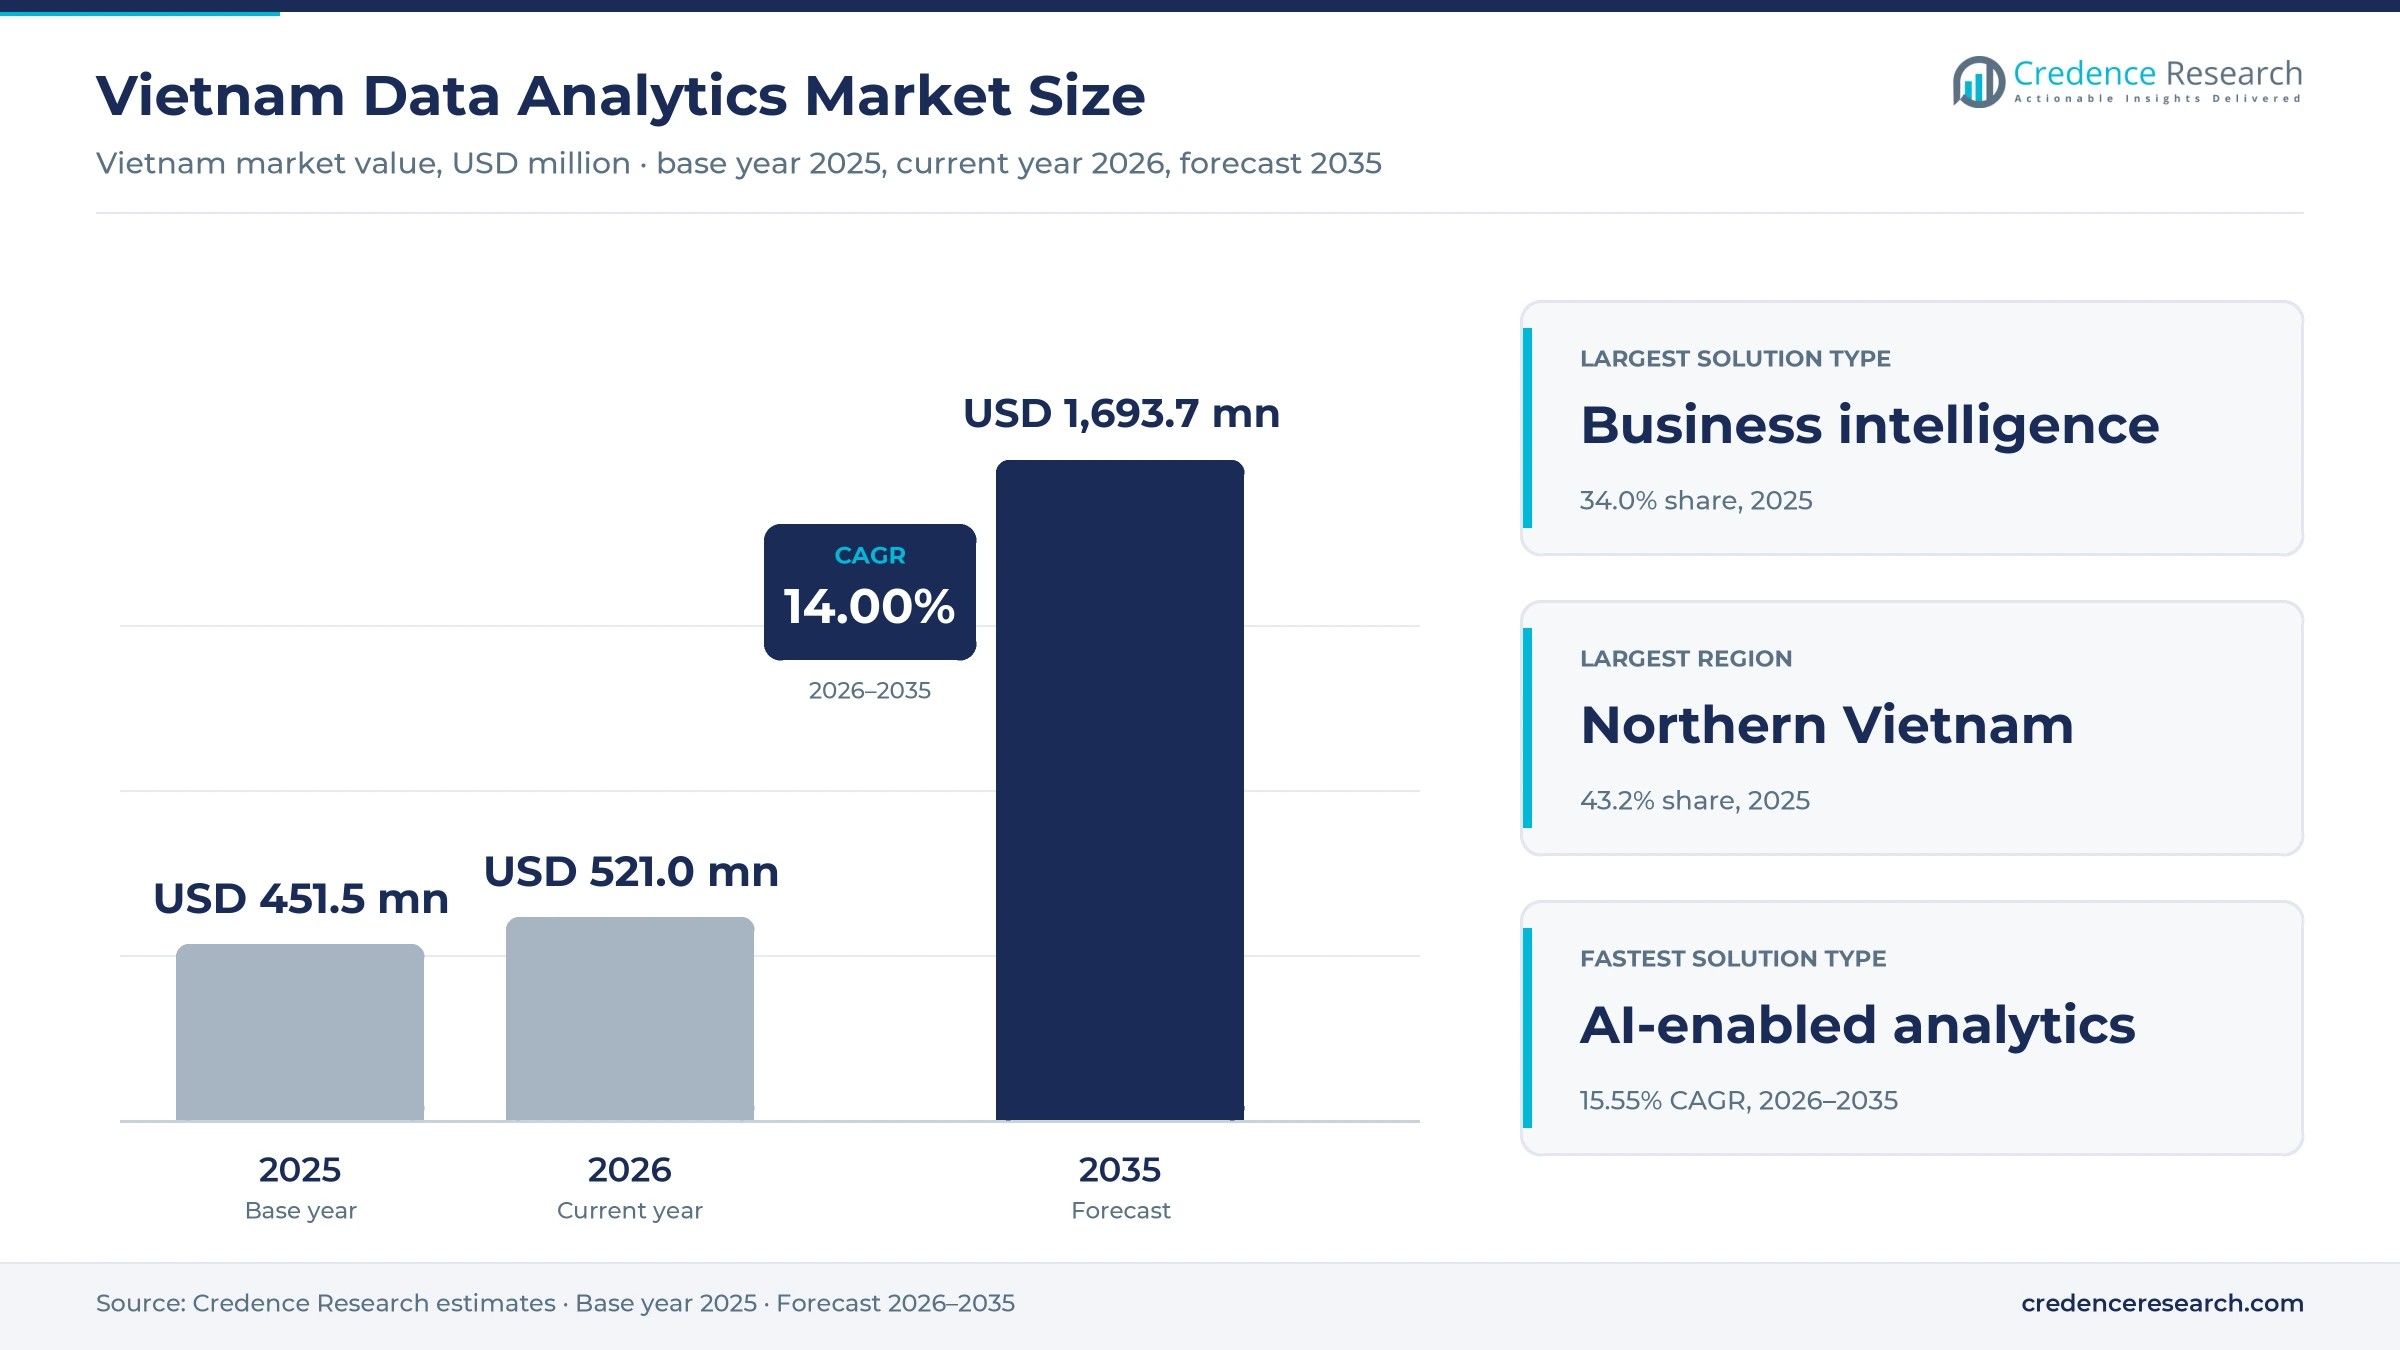
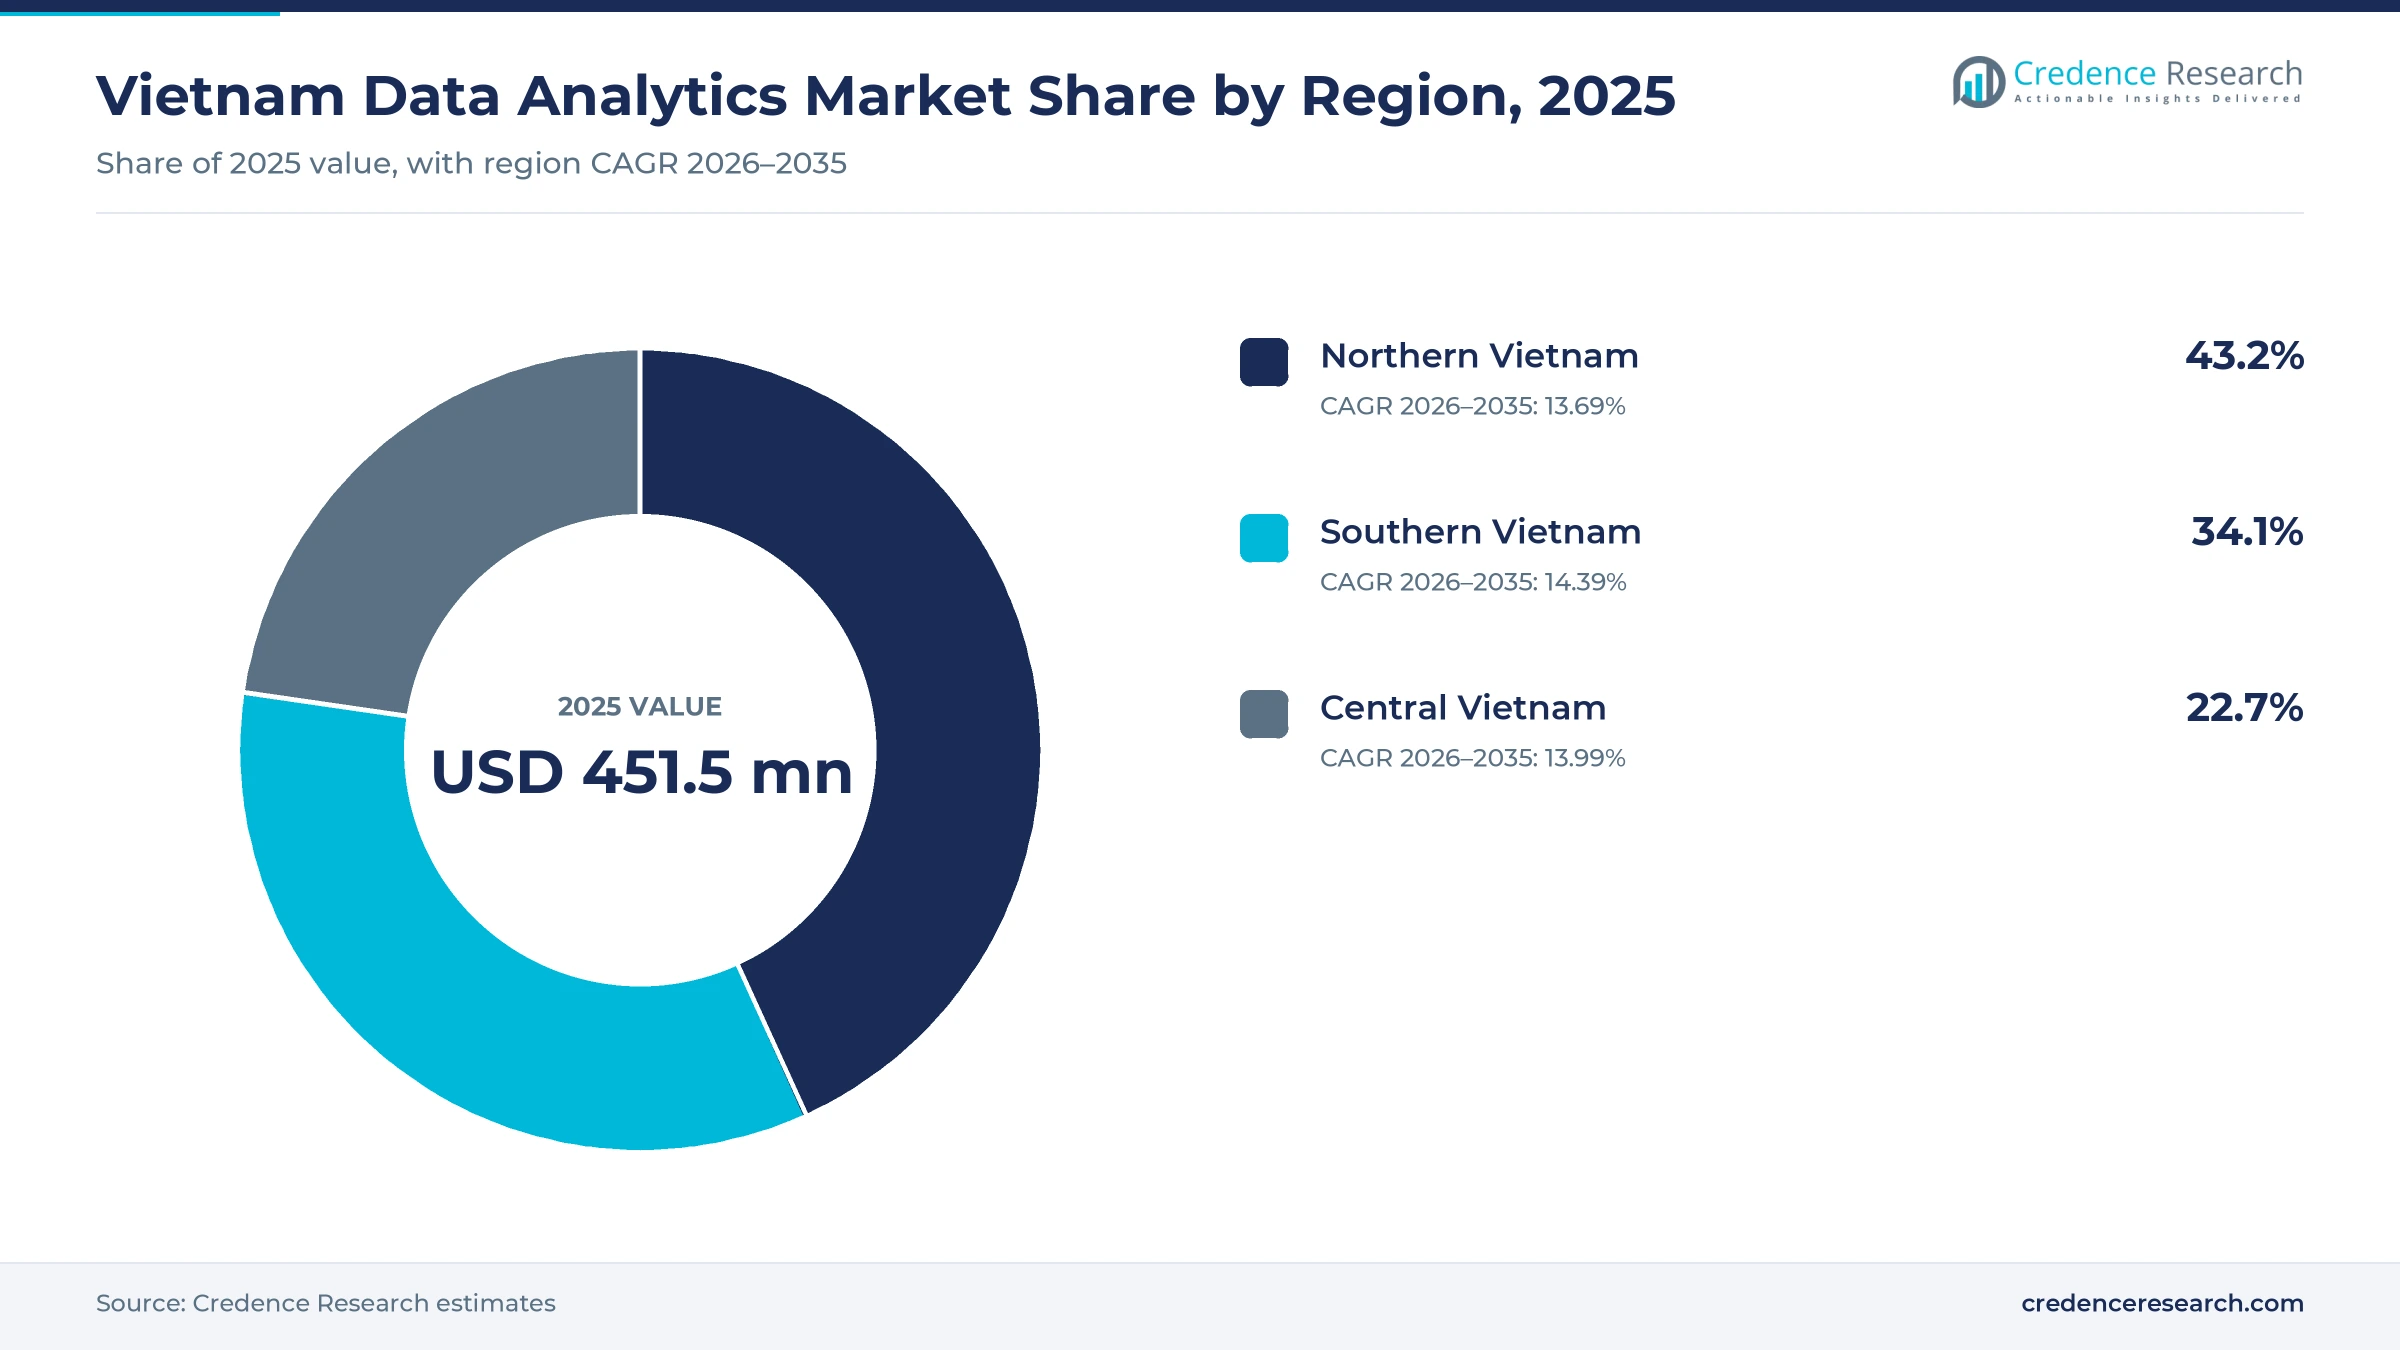
The Vietnam data analytics market was valued at USD 451.5 million in 2025 and is projected to increase from USD 521.0 million in 2026 to USD 1.69 billion by 2035, registering a CAGR of 14.00% during 2026–2035. Demand comes from banks, retailers, manufacturers and public agencies that buy dashboards, data platforms, integration services and AI models to turn rising transaction volumes into decisions. Northern Vietnam held the largest regional share, 43.2% in 2025, because Hanoi concentrates central ministries, state-owned enterprises and the head offices of large banks and technology groups. Southern Vietnam is the fastest-growing region at 14.39% a year, as new large data centers in Ho Chi Minh City add cloud and AI capacity. In turn, the Law on Data took effect on July 1, 2025, giving companies and agencies a clearer legal basis for sharing and processing data at national scale.
Which data analytics spending does the estimate cover?
The estimate measures the value of data analytics software, platforms and related services bought by organizations in Vietnam, including business intelligence and visualization tools, advanced analytics platforms, data engineering and integration, and AI-enabled analytics. It covers public cloud, private cloud, on-premises and hybrid deployments sold through subscription, consumption, perpetual and project-based contracts.
The estimate excludes general enterprise resource planning licenses, raw data center colocation, telecom connectivity and hardware sold without analytics software. The value chain runs from global platform vendors and local system integrators through cloud providers and consultants to banks, retailers, factories and public agencies that run reports, forecasts and AI models.
Vietnam Data Analytics Market Insights
- The Vietnam data analytics market was valued at USD 451.5 million in 2025 and is projected to reach USD 1.69 billion by 2035, registering a CAGR of 14.00% during 2026–2035.
- Northern Vietnam held a 43.2% share of 2025 value, because Hanoi concentrates ministries, state-owned groups and large bank head offices.
- Banking and financial services led with a 36.0% share of 2025 value, because banks process the largest volumes of digital transactions.
- QR code payment volume rose 106.7% in the first 11 months of 2024, according to State Bank of Vietnam data, creating new transaction records to analyze.
- AI-enabled analytics grows fastest at 15.55% a year during 2026–2035, as local AI factories and new laws support model deployment.
Dashboards lead while AI-enabled tools grow fastest
Why do dashboards still hold the most value?
Based on solution type, the market is categorized into business intelligence and visualization, advanced analytics platforms, data engineering and integration, and AI-enabled analytics. Business Intelligence and Visualization led with a 34.0% share of 2025 value, because most firms start with reporting and dashboards. AI-Enabled Analytics grows fastest at 15.55% a year, as companies add forecasting, assistants and language models.
How are buyers moving workloads to the cloud?
Based on deployment model, the market is categorized into public cloud, private cloud, on-premises and hybrid deployment. On-Premises led with a 34.0% share of 2025 value, because banks and agencies keep sensitive records in their own facilities. Public Cloud grows fastest at 14.96% a year, as new local data centers and AI factories offer domestic hosting.
Which industries spend the most on insight tools?
Based on end-use industry, the market is categorized into banking and financial services, retail and digital commerce, manufacturing and logistics, and government and public services. Banking and Financial Services led with a 36.0% share of 2025 value, because banks run risk, fraud and customer models. Retail and Digital Commerce grows fastest at 14.50% a year, as online sellers track prices, stock and campaigns.
How does company size shape spending?
Based on enterprise size, the market is categorized into large enterprises, medium enterprises and small enterprises. Large Enterprises led with a 62.0% share of 2025 value, because banks, telecom groups and state-owned firms run the largest platforms. Small Enterprises grow fastest at 14.97% a year, as low-cost cloud subscriptions bring dashboards within reach of smaller firms.
| Segment Group | Leading Sub-segment | Share, 2025 | Fastest-growing Sub-segment | CAGR, 2026–2035 |
|---|---|---|---|---|
| By Solution Type | Business Intelligence and Visualization | 34.0% | AI-Enabled Analytics | 15.55% |
| By Deployment Model | On-Premises | 34.0% | Public Cloud | 14.96% |
| By End-Use Industry | Banking and Financial Services | 36.0% | Retail and Digital Commerce | 14.50% |
| By Enterprise Size | Large Enterprises | 62.0% | Small Enterprises | 14.97% |
Request a Free Sample
Fill in your details and we'll send you a free sample report.
- Sample data tables & charts
- Research methodology
Transaction growth, new capacity and policy push adoption
How does digital transaction growth create demand?
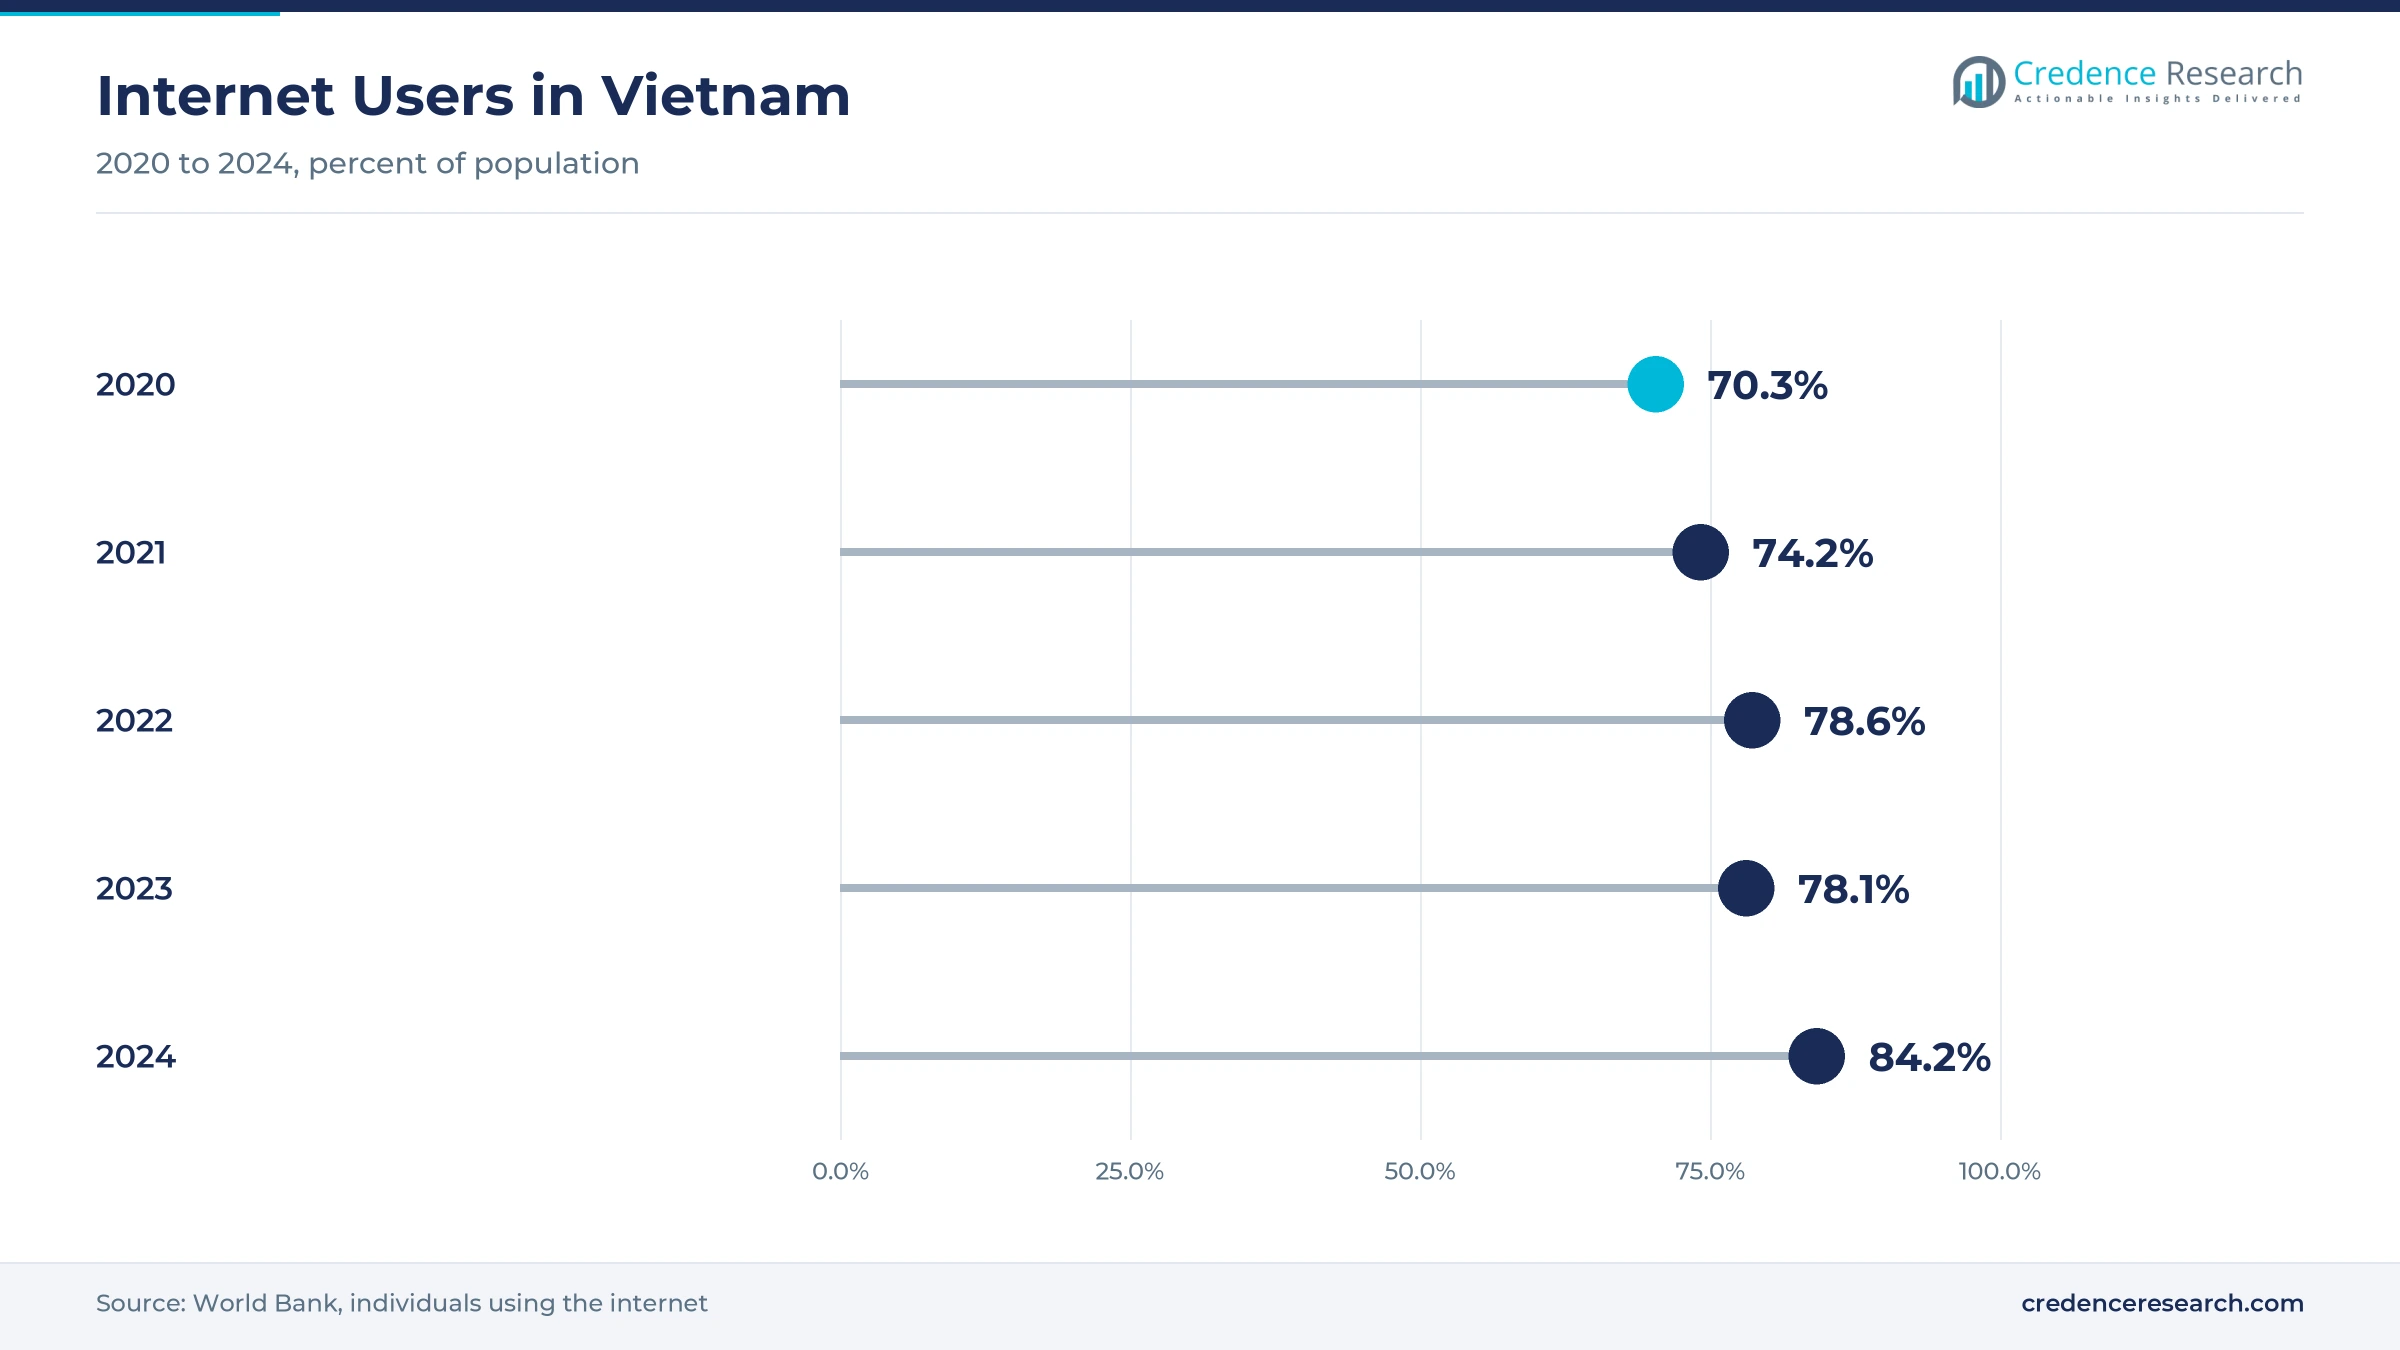
The expansion of digital transaction data creates demand for analytics, because every card, QR and mobile payment leaves a record that banks and sellers can study. Non-cash payment volume rose 56.8% and value rose 33.7% in the first 11 months of 2024, according to State Bank of Vietnam data. QR code payment volume more than doubled, rising 106.7%, while mobile banking volume grew 54.5%. Internet users reached 84.2% of the population in 2024, up from 70.3% in 2020, according to the World Bank. As a result, banking and financial services hold 36.0% of 2025 value, because lenders need fraud, credit and customer models.
Why does cloud and infrastructure build-out widen access?
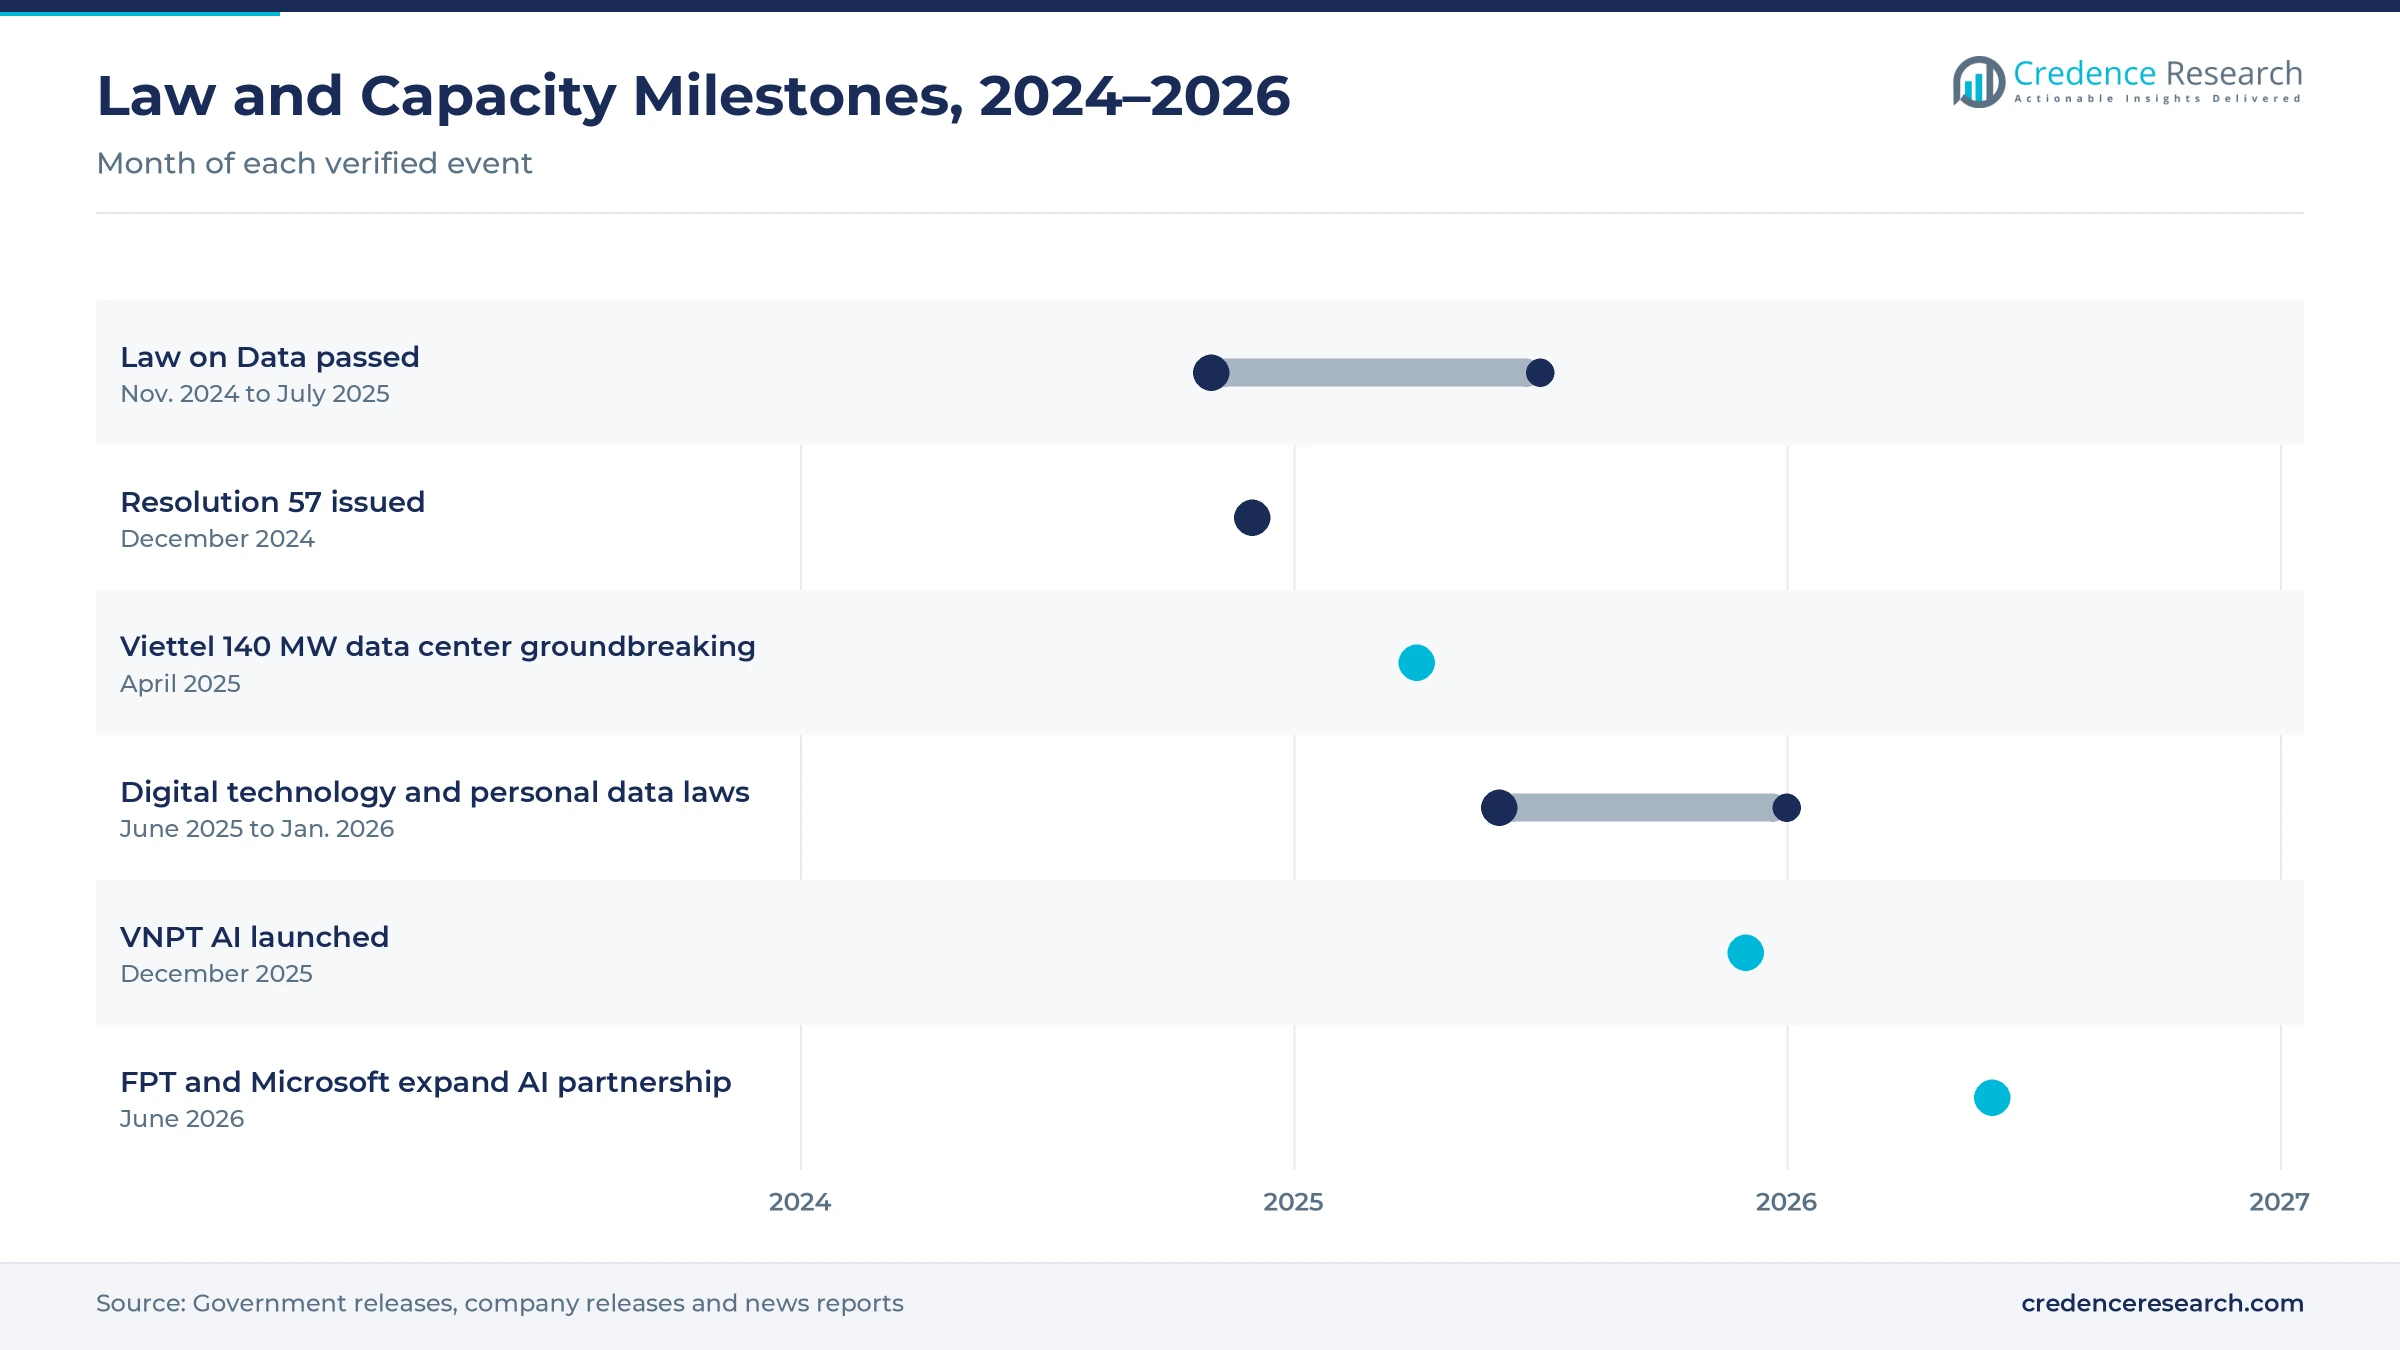
The cloud and data infrastructure build-out widens access to analytics, because firms can now rent large computing capacity inside the country. Viettel broke ground on a data center with up to 140 MW of designed power and about 10,000 racks in Ho Chi Minh City on April 23, 2025, to support large AI models. CMC received approval in June 2025 for a project worth more than USD 250 million at Saigon Hi-Tech Park, starting with 30 MW and expandable to 120 MW. FPT said its first local AI factory runs thousands of NVIDIA H100 chips, with services from January 2025, according to FPT. In turn, public cloud grows at 14.96% a year as colocation and hosting capacity expands.
How do national digital policies push adoption?
National digital transformation and AI policy push adoption, because ministries, state-owned firms and banks must meet clear digital targets. The Politburo issued Resolution 57 on Dec. 22, 2024, setting research and development spending at 2% of GDP and a cashless payment rate of 80% by 2030, according to VnEconomy. The same resolution calls for regional data centers and completion of the National Data Center. The Law on Data, passed on Nov. 30, 2024, took effect on July 1, 2025, and set rules for national databases and data sharing platforms. As a result, government and public services hold a sizable share of 2025 value, as agencies build shared registers and dashboards.
Why do AI industry incentives speed up model use?
AI industry incentives speed up model use, because tax breaks and cost support lower the price of building and running analytics teams. The National Assembly approved the Law on Digital Technology Industry on June 14, 2025, with 441 of 445 delegates in favor, and it took effect on Jan. 1, 2026, according to the Government News. Domestic startups can receive support covering 50% of the cost of acquiring advanced technologies and developing prototypes. Skilled digital professionals are exempt from personal income tax for their first five years working in the country. In turn, AI-enabled analytics grows at 15.55% a year, as firms add artificial intelligence to forecasting and service.
Privacy rules and sovereign AI platforms reshape buying
How is the shift to privacy by design changing projects?
The shift to privacy by design is changing analytics projects, because new rules raise the cost of misusing customer records. The National Assembly passed the Personal Data Protection Law on June 26, 2025, and it entered into force on Jan. 1, 2026. Fines for unlawful cross-border transfers can reach 5% of the violator's prior-year revenue or VND 3 billion, whichever is higher. Selling or buying personal data can draw fines of 10 times the sale revenue, while Decree 13/2023 on personal data stays in force until a new decree replaces it. As a result, buyers favor data engineering and integration tools that track consent, lineage and access across every pipeline.
Why is the rise of sovereign AI platforms notable?
The rise of sovereign AI platforms is notable, because local groups now offer models and computing that keep records inside the country. VNPT launched VNPT AI on Dec. 18, 2025, with more than 200 specialists in artificial intelligence and data science. FPT said all records in its first local AI factory are stored and processed within the country, using servers with eight H100 chips each. CMC plans its Saigon Hi-Tech Park facility as a hub for AI-as-a-service, cloud and big data services, starting at 30 MW. In turn, banks and agencies that avoid offshore hosting can adopt AI training sets and models with local support.
Can AI copilots open a new wave of enterprise demand?
AI copilots offer an opening for new enterprise demand, because staff can query reports and code pipelines in plain language. FPT and Microsoft expanded their AI partnership in June 2026 to speed up enterprise AI adoption across ASEAN, Japan and South Korea. FPT said it has about 30,000 AI-augmented engineers and aims to give up to 20,000 developers agentic tools over three years. Microsoft ASEAN said the country is entering a pivotal phase of AI adoption, as organizations scale beyond pilots. As a result, medium and small enterprises can adopt business intelligence and assistants faster, and small firms grow at 14.97% a year.
Is there room to grow with the digital economy target?
The national digital economy target offers room to grow, because a larger online economy creates more records that firms must analyze. The digital economy contributed an estimated 18.3% of GDP in 2024, and the government set a target of 20.5% for 2025. Resolution 57 sets a goal of at least 30% of GDP by 2030, together with online public service use above 80%. These goals push agencies, retailers and factories to track customers, stock and services in real time. In turn, retail and digital commerce grows fastest at 14.50% a year, as online sellers analyze prices, campaigns and delivery performance across the country.
Skills gaps, legacy systems and compliance slow projects
How do skills gaps slow analytics projects?
Skills gaps slow analytics projects, because many firms lack engineers who can build pipelines, models and governance rules. As a result, projects stall after dashboards are delivered and advanced use cases wait for scarce staff. Vendors respond with managed services, training programs and low-code tools, which let business teams build reports without deep coding. This barrier is easing as universities and IT firms train more specialists each year.
Why do legacy systems raise integration costs?
Legacy systems raise integration costs, because banks, factories and agencies store records in older core platforms with different formats. In turn, buyers spend much of each budget on cleaning and connecting records before any analysis can begin. Integrators respond with prebuilt connectors, migration tools and phased cloud moves, which lower risk and shorten timelines. This pressure favors vendors with strong local delivery teams and sector templates.
How do compliance duties lengthen buying cycles?
Compliance duties lengthen buying cycles, because new personal data rules require consent records, impact assessments and approval for some cross-border transfers. As a result, buyers add legal reviews before signing cloud and AI contracts, which delays projects. Vendors respond with local hosting, audit logs and consent tools that simplify approval. This risk is strongest for multinational platforms that process records outside the country.
Why does price sensitivity limit smaller buyers?
Price sensitivity limits smaller buyers, because many small and medium firms run on thin margins and see analytics as optional. In turn, they delay subscriptions or use spreadsheets and free tools for basic reports. Vendors respond with consumption-based pricing, bundled cloud credits and starter packages, which lower entry costs. This constraint keeps large enterprises dominant in value while smaller firms adopt step by step.
The north leads while the south grows fastest
| Region | Value, 2025 (USD million) | Share, 2025 | CAGR, 2026–2035 |
|---|---|---|---|
| Northern Vietnam | 195.0 | 43.2% | 13.69% |
| Southern Vietnam | 154.0 | 34.1% | 14.39% |
| Central Vietnam | 102.5 | 22.7% | 13.99% |
Why does Northern Vietnam hold the top share?
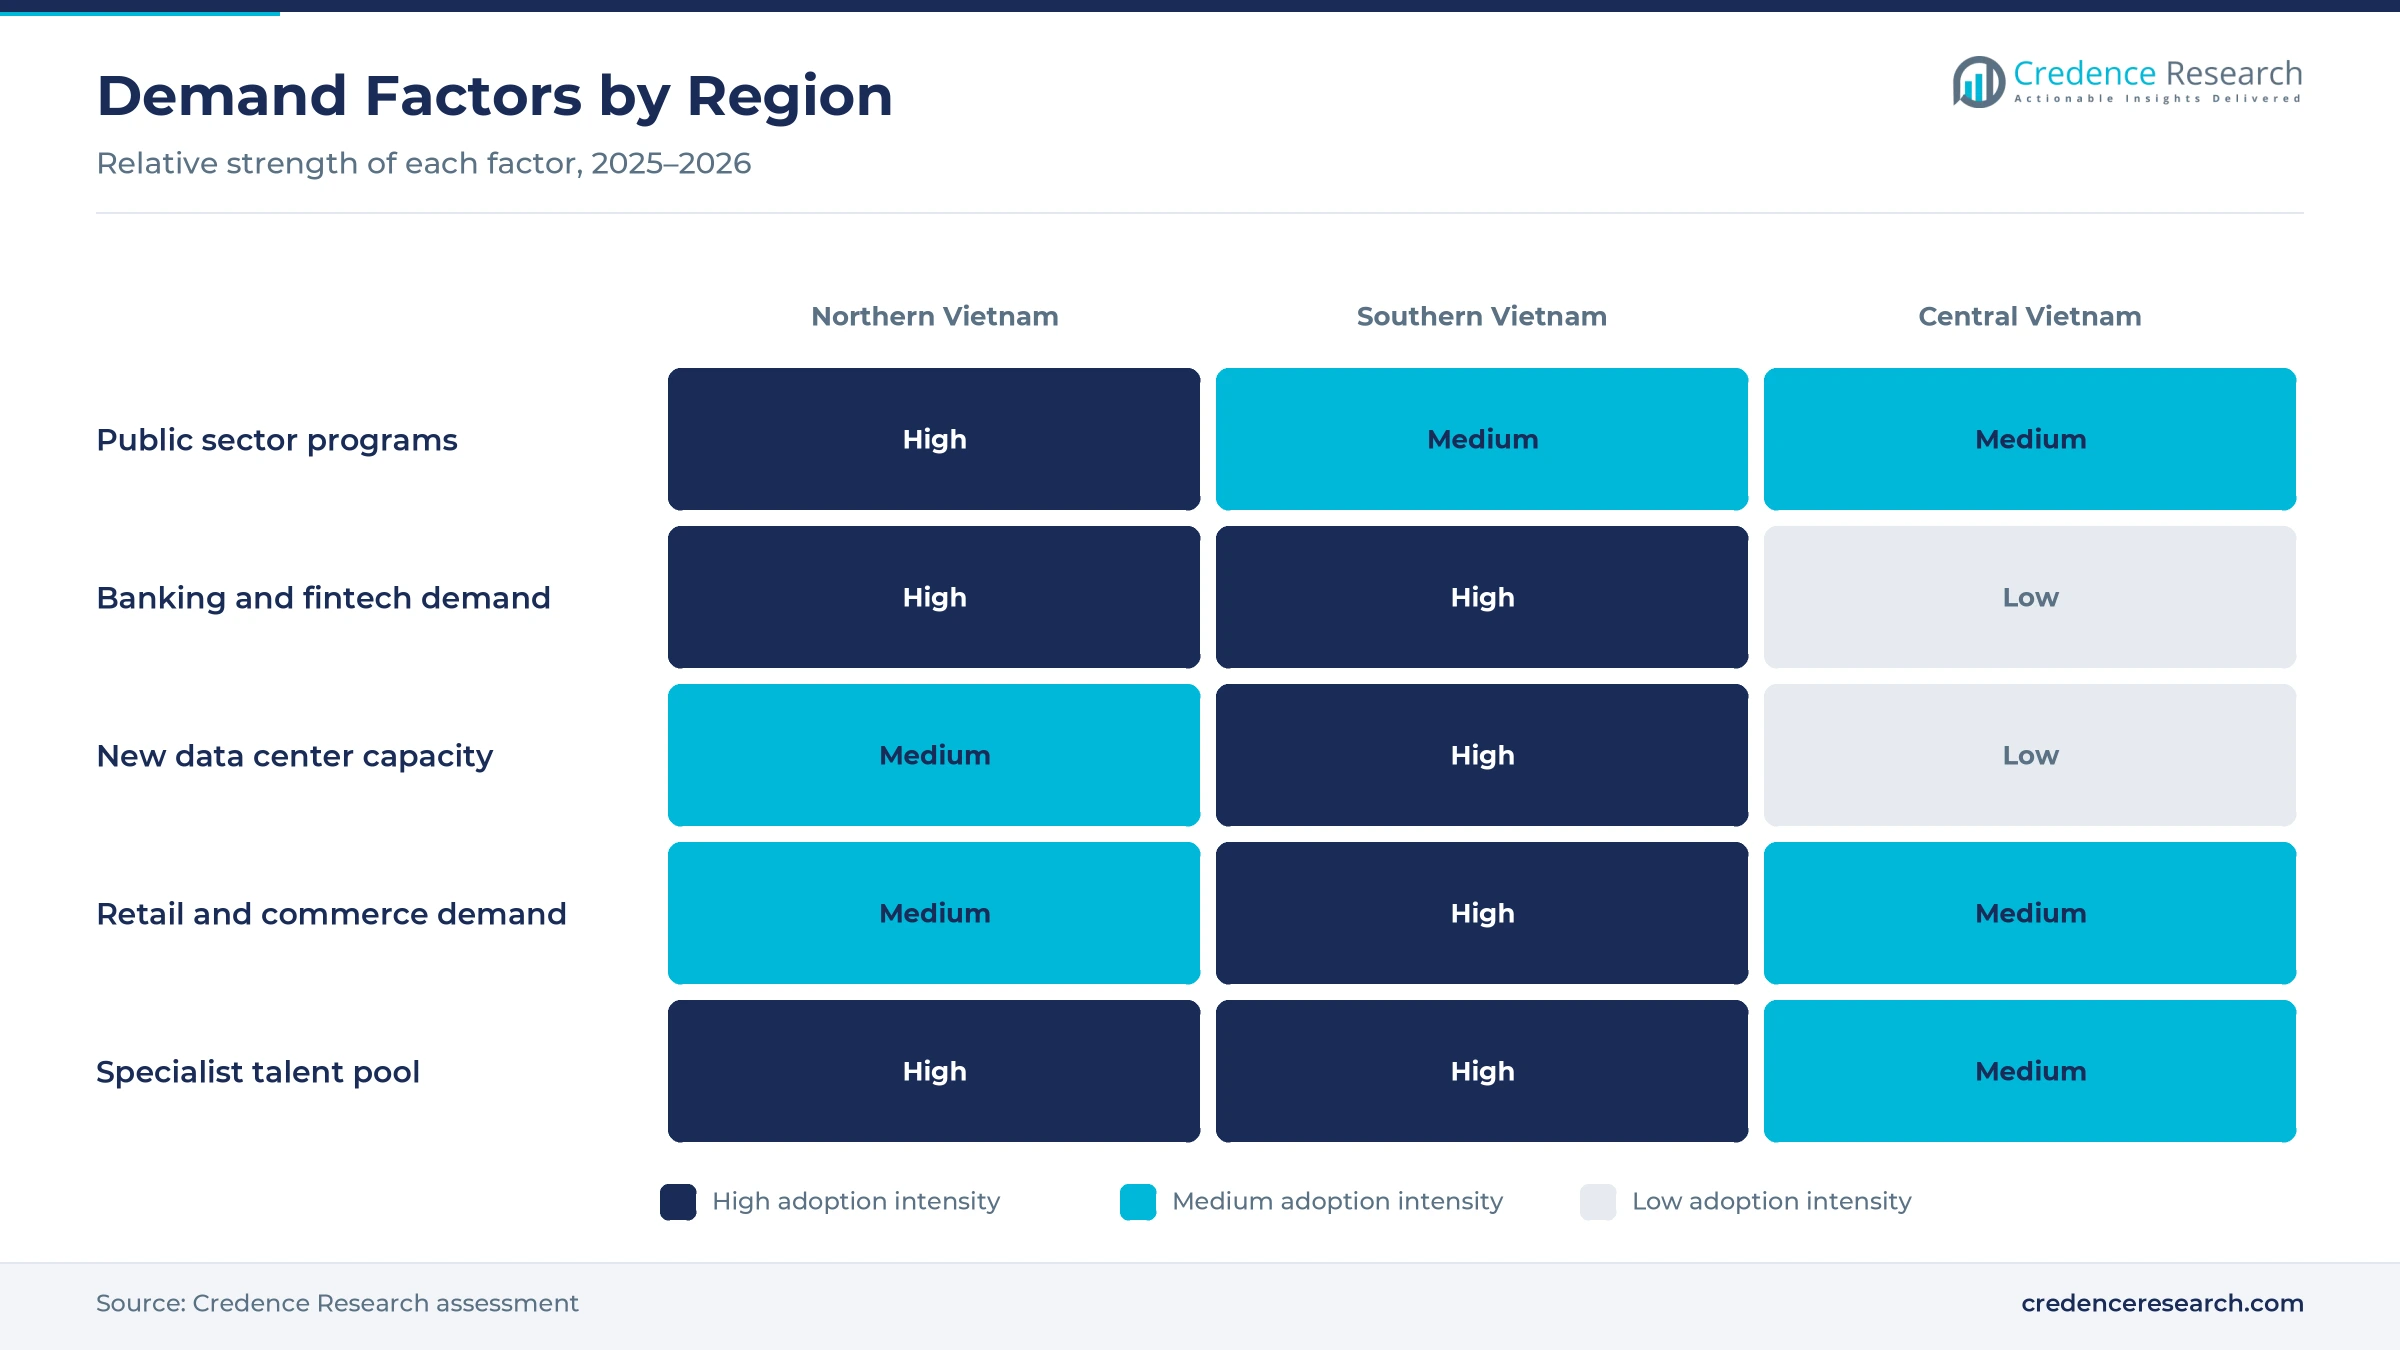
Northern Vietnam held a 43.2% share of 2025 value and grows at 13.69% a year, because Hanoi concentrates central ministries, state-owned groups and large bank head offices. National programs under Resolution 57 and the Law on Data are run from the capital, which drives public sector platform spending. As a result, the north leads in government projects, national databases and large banking analytics programs.
How is Southern Vietnam becoming the fastest-growing zone?
Southern Vietnam held a 34.1% share of 2025 value and grows fastest at 14.39% a year, because Ho Chi Minh City hosts many retailers, fintech firms and manufacturers. Viettel broke ground on a 140 MW data center in the city in April 2025, and CMC won approval for a 30 MW to 120 MW site at Saigon Hi-Tech Park in June 2025. In turn, the south gains local cloud and AI capacity for commercial buyers.
Why is central Vietnam adopting cloud tools?
Central Vietnam held 22.7% of 2025 value and grows at 13.99% a year, because Da Nang and nearby provinces are digitizing public services, tourism and logistics. Resolution 57 targets much wider online public service use by 2030, which pushes provincial agencies to adopt dashboards and shared registers. As a result, the region adds steady demand from local government, ports and hospitality firms that use geospatial mapping and reporting tools.
Laws, AI factories and capacity projects since 2024
| Development | Status and market relevance |
|---|---|
| In November 2024, the National Assembly passed the Law on Data, which took effect on July 1, 2025. | Sets rules for national databases and data sharing |
| In December 2024, the Politburo issued Resolution 57 on science, technology, innovation and digital transformation. | Targets a digital economy of at least 30% of GDP by 2030 |
| In April 2025, Viettel broke ground on a data center with up to 140 MW of designed power in Ho Chi Minh City. | Adds local capacity for AI and cloud workloads |
| In June 2025, the National Assembly approved the Law on Digital Technology Industry and passed the Personal Data Protection Law. | Both laws took effect on Jan. 1, 2026 |
| In December 2025, VNPT launched VNPT AI with more than 200 AI and data science specialists. | Expands domestic AI model development |
Pipelines, cloud warehouses and AI models shape delivery
- Data pipelines collect and clean records from core banking, commerce and factory systems, which gives every report a single trusted source.
- Cloud warehouses store large volumes of records at low cost and scale on demand, which lets firms run heavy queries without buying servers.
- AI models forecast demand, detect fraud and answer questions in plain language, which extends analysis to staff without coding skills.
- Governance tools track consent, lineage and access rights, which helps buyers comply with the new personal data law.
Need a Custom Version of This Report?
Tailor the scope, geography, or segments to your exact requirements.
- Custom geography or segment scope
- Direct access to our analyst team
Local IT groups and global vendors compete on delivery
Competition combines local IT groups, telecom operators and global software vendors. FPT competes through its local AI factory, which runs thousands of NVIDIA H100 chips, and through an expanded AI partnership with Microsoft. Viettel competes through large data center projects, including a 140 MW site in Ho Chi Minh City designed for AI models. VNPT competes through VNPT AI, a subsidiary launched in December 2025 with more than 200 specialists. CMC competes through CMC Cloud, its C.OpenAI services and a new data center at Saigon Hi-Tech Park. Global vendors such as IBM, Microsoft, SAP, Oracle and SAS supply platforms that local integrators deploy for banks and manufacturers. Rivals compete on local hosting, sector expertise, price, delivery speed and compliance with new data rules.
Which companies serve Vietnamese analytics buyers?
| Company | Type | Role in the market |
|---|---|---|
| FPT Corporation | Local IT group | Runs a local AI factory with NVIDIA H100 chips |
| Viettel Solutions | Telecom-backed integrator | Builds a 140 MW data center for AI workloads |
| VNPT-IT | Telecom-backed integrator | Develops AI models through the VNPT AI subsidiary |
| CMC Corporation | Local IT group | Builds a data center for AI, cloud and big data services |
| Microsoft Vietnam | Global platform vendor | Expands AI work with FPT for enterprise adoption |
Credence Research view on Vietnamese enterprise insight
Credence Research's view is that Vietnamese data analytics spending will grow quickly because digital payments, local cloud capacity and national data laws create both the records and the rules for analysis. Business intelligence and on-premises deployment remain the largest pools, while AI-enabled tools, public cloud and small firms add the fastest growth. Local AI factories and new data centers will lower the cost of model use. Vendors with local hosting, sector templates and strong compliance tools should gain the most, while skills gaps and legacy systems test slower adopters.
Payment, policy and capacity records behind the model
The report uses 2025 as the base year on a calendar basis, and market values come from the Credence Research model. That model combines official internet and payment statistics, government policy documents, laws and company releases. Segment splits and regional growth rates are Credence Research estimates, while regional shares follow the client-provided split. Sources used are official statistics, central bank data, government releases, company releases and news reports, and no interviews or surveys were used.
Cloud deployment and AI tools carry growth to 2035
The Vietnam data analytics market is expected to reach USD 1.69 billion by 2035, a 14.00% CAGR during 2026–2035, as banks, sellers and agencies turn rising digital records into daily decisions. Growth should be strongest in AI-enabled tools, public cloud deployment, small firms and Southern Vietnam, because these areas gain most from new capacity and lower entry costs. Privacy rules will favor local hosting and governance tools, while skills gaps and legacy systems could slow some projects.
Frequently Asked Questions
How big is the Vietnam data analytics market?
Which solution type leads Vietnamese analytics spending?
Which region leads the Vietnamese market?
How fast are digital payments growing in Vietnam?
Which deployment model is growing fastest?
Which laws shape analytics projects in Vietnam?
Who are the leading companies in the Vietnamese market?
What are the main challenges for analytics vendors?
Table of Content
Chapter 1 Market Segmentation
- 1.1 Segmentation Framework
- 1.1.1 Product and Service Classification
- 1.1.2 Application and End-Use Classification
- 1.1.3 Technology and Solution Classification
- 1.1.4 Customer and Distribution Channel Classification
- 1.1.5 Geographic Segmentation
- 1.1.6 Market Segment Definitions and Boundaries
- 1.2 By Solution Type
- 1.2.1 Business Intelligence and Visualization
- 1.2.2 Advanced Analytics Platforms
- 1.2.3 Data Engineering and Integration
- 1.2.4 AI-Enabled Analytics
- 1.3 By Deployment Model
- 1.3.1 Public Cloud
- 1.3.2 Private Cloud
- 1.3.3 On-Premises
- 1.3.4 Hybrid Deployment
- 1.4 By End-Use Industry
- 1.4.1 Banking and Financial Services
- 1.4.2 Retail and Digital Commerce
- 1.4.3 Manufacturing and Logistics
- 1.4.4 Government and Public Services
- 1.5 By Enterprise Size
- 1.5.1 Large Enterprises
- 1.5.2 Medium Enterprises
- 1.5.3 Small Enterprises
Chapter 2 Introduction
- 2.1 Report Objectives and Scope
- 2.2 Product Definition and Industry Terminology
- 2.3 Market Inclusions and Exclusions
- 2.4 Research Process
- 2.4.1 Primary Research and Expert Interviews
- 2.4.2 Secondary Research and Source Review
- 2.4.3 Top-Down and Bottom-Up Estimation
- 2.4.4 Data Triangulation and Verification
- 2.5 Market Size Measurement Basis
- 2.5.1 2025: USD 451.5 million → 2035: USD 1.69 billion
- 2.6 Historical and Forecast Reference Periods
- 2.6.1 Historical Period: 2018-2025
- 2.6.2 Base Year: 2025
- 2.6.3 Forecast Period: 2025-2035
- 2.7 Research Assumptions and Limitations
Chapter 3 Executive Summary
- 3.1 Market Snapshot and Key Findings
- 3.2 Base-Year Market Size, 2025
- 3.3 Forecast Market Size, 2035
- 3.4 Revenue and Volume Growth Outlook
- 3.5 Key Demand and Supply Indicators
- 3.6 Leading Market Segments
- 3.7 Fastest-Growing Market Opportunities
- 3.8 Regional Performance Highlights
- 3.9 Technology and Industry Transformation
- 3.10 Competitive Landscape Summary
- 3.11 Analyst View and Strategic Implications
Chapter 4 Vietnam Data Analytics Market Trends and Developments
- 4.1 Historical Industry Development, 2018-2025
- 4.2 Recent Market Trends and Developments
- 4.3 Demand and Customer Behavior Trends
- 4.4 Technology and Product Innovation
- 4.5 Artificial Intelligence, Automation and Digitalization
- 4.6 Local Manufacturing and Supply Chain Realignment
- 4.7 Industry Partnerships, Mergers and Acquisitions
- 4.8 Sustainability and Circular Economy Developments
- 4.9 Government and Private Sector Investment Trends
- 4.10 Emerging Business Models and Commercialization
- 4.11 Industry Developments and Announcements
Chapter 5 Vietnam Data Analytics Market Supply and Demand Analysis
- 5.1 Demand Trend and Consumption Analysis, 2018-2025
- 5.2 Demand Forecast, 2025-2035
- 5.3 Supply Chain Structure and Procurement Trends
- 5.4 Supply-Demand Gap and Bottlenecks
- 5.5 Import Dependence and Sourcing Structure
- 5.6 Regional Supply and Demand Concentration
Chapter 6 Vietnam Data Analytics Market Pricing Analysis
- 6.1 Pricing Structure and Measurement
- 6.2 Historical Pricing Trends, 2018-2025
- 6.3 Pricing Outlook, 2025-2035
- 6.4 Pricing by Product and Market Segment
- 6.5 Geographic Pricing Differences
- 6.6 Key Input, Energy, Labor and Logistics Costs
- 6.7 Contract Pricing and Purchasing Models
- 6.8 Pricing Sensitivity and Competitive Positioning
- 6.9 Price, Margin and Profitability Implications
Chapter 7 Vietnam Data Analytics Market Dynamics
- 7.1 Market Growth Drivers
- 7.1.1 Demand-Side Drivers
- 7.1.2 Technology and Innovation Drivers
- 7.1.3 Infrastructure and Investment Drivers
- 7.1.4 Regulatory and Policy Drivers
- 7.2 Market Restraints
- 7.2.1 Cost and Affordability Constraints
- 7.2.2 Technology and Adoption Barriers
- 7.2.3 Supply Chain and Operational Constraints
- 7.3 Market Challenges
- 7.3.1 Competitive Pressure and Margin Erosion
- 7.3.2 Skills, Infrastructure and Implementation Gaps
- 7.4 Emerging Market Opportunities
- 7.5 Market Dynamics Impact and Time-Horizon Assessment
Chapter 8 Vietnam Data Analytics Value Chain Analysis
- 8.1 Industry Value Chain Overview
- 8.2 Upstream Suppliers and Critical Inputs
- 8.3 Technology and Component Providers
- 8.4 Manufacturing or Service Delivery
- 8.5 Distribution, Channel Partners and Integrators
- 8.6 Downstream Applications and End Users
- 8.7 Value Addition and Profit Pools
- 8.8 Vertical Integration and Outsourcing
- 8.9 Supplier Concentration and Risk
- 8.10 Supply Chain Localization and Resilience
Chapter 9 Vietnam Data Analytics Market Regulations and Policies
- 9.1 Relevant Laws, Standards and Compliance Frameworks
- 9.2 Product, Service, Safety and Quality Requirements
- 9.3 Government Policies, Incentives and Subsidies
- 9.4 Imports, Exports and Trade Barriers
- 9.5 Public Procurement and Local Content Requirements
- 9.6 Data Protection, AI and Cybersecurity Compliance
- 9.7 Upcoming Policy Changes and Market Implications
Chapter 10 Vietnam Data Analytics Market Hotspots and Opportunities
- 10.1 Market Opportunity Mapping and Growth Hotspots
- 10.2 High-Growth Applications and Customer Groups
- 10.3 Underserved Markets and White-Space Opportunities
- 10.4 Emerging Technology and Product Opportunities
- 10.5 New Capacity and Investment Hotspots
- 10.6 Market Entry and Expansion Opportunities
- 10.7 Distribution and Partnership Opportunities
- 10.8 Near-Term and Long-Term Commercial Potential
- 10.9 Opportunity Attractiveness and Execution Risks
Chapter 11 Vietnam Data Analytics Market Outlook, 2025-2035
- 11.1 Market Size and Analysis
- 11.1.1 Revenue (Market Measurement: 2025: USD 451.5 million → 2035: USD 1.69 billion)
- 11.1.2 Historical Market Size, 2018-2025
- 11.1.3 Base-Year Market Size, 2025
- 11.2 Market Forecast, 2025-2035
- 11.2.1 Revenue Forecast to 2035
- 11.2.2 CAGR and Year-on-Year Growth
- 11.2.3 Incremental Revenue Opportunity
- 11.3 Forecast Assumptions and Scenario Analysis
- 11.3.1 Base-Case Forecast
- 11.3.2 Optimistic and Conservative Scenarios
- 11.3.3 Technology, Pricing and Policy Sensitivities
- 11.4 Market Attractiveness and Growth Outlook
Chapter 12 Vietnam Data Analytics Market Segmentation and Outlook
- 12.1 Segmentation Summary and Market Shares, 2025
- 12.2 Largest and Fastest-Growing Segments
- 12.3 By Solution Type - Market Size and Forecast, 2025-2035
- 12.3.1 Segment Definition and Scope
- 12.3.2 Historical Market Size, 2018-2025
- 12.3.3 Revenue Forecast, 2025-2035
- 12.3.4 Base-Year Market Share, 2025
- 12.3.5 Segment CAGR and Growth Drivers
- 12.3.6 Subsegment Market Size and Forecast
- 12.3.6.1 Business Intelligence and Visualization
- 12.3.6.2 Advanced Analytics Platforms
- 12.3.6.3 Data Engineering and Integration
- 12.3.6.4 AI-Enabled Analytics
- 12.3.7 Subsegment Pricing and Adoption Trends
- 12.3.8 Leading Suppliers and Competition
- 12.3.9 Regional Demand and Opportunities
- 12.4 By Deployment Model - Market Size and Forecast, 2025-2035
- 12.4.1 Segment Definition and Scope
- 12.4.2 Historical Market Size, 2018-2025
- 12.4.3 Revenue Forecast, 2025-2035
- 12.4.4 Base-Year Market Share, 2025
- 12.4.5 Segment CAGR and Growth Drivers
- 12.4.6 Subsegment Market Size and Forecast
- 12.4.6.1 Public Cloud
- 12.4.6.2 Private Cloud
- 12.4.6.3 On-Premises
- 12.4.6.4 Hybrid Deployment
- 12.4.7 Subsegment Pricing and Adoption Trends
- 12.4.8 Leading Suppliers and Competition
- 12.4.9 Regional Demand and Opportunities
- 12.5 By End-Use Industry - Market Size and Forecast, 2025-2035
- 12.5.1 Segment Definition and Scope
- 12.5.2 Historical Market Size, 2018-2025
- 12.5.3 Revenue Forecast, 2025-2035
- 12.5.4 Base-Year Market Share, 2025
- 12.5.5 Segment CAGR and Growth Drivers
- 12.5.6 Subsegment Market Size and Forecast
- 12.5.6.1 Banking and Financial Services
- 12.5.6.2 Retail and Digital Commerce
- 12.5.6.3 Manufacturing and Logistics
- 12.5.6.4 Government and Public Services
- 12.5.7 Subsegment Pricing and Adoption Trends
- 12.5.8 Leading Suppliers and Competition
- 12.5.9 Regional Demand and Opportunities
- 12.6 By Enterprise Size - Market Size and Forecast, 2025-2035
- 12.6.1 Segment Definition and Scope
- 12.6.2 Historical Market Size, 2018-2025
- 12.6.3 Revenue Forecast, 2025-2035
- 12.6.4 Base-Year Market Share, 2025
- 12.6.5 Segment CAGR and Growth Drivers
- 12.6.6 Subsegment Market Size and Forecast
- 12.6.6.1 Large Enterprises
- 12.6.6.2 Medium Enterprises
- 12.6.6.3 Small Enterprises
- 12.6.7 Subsegment Pricing and Adoption Trends
- 12.6.8 Leading Suppliers and Competition
- 12.6.9 Regional Demand and Opportunities
- 12.7 Segment Growth Comparison
- 12.8 Segment Attractiveness and Priority Matrix
Chapter 13 Vietnam Data Analytics End-Use and Application Market Outlook
- 13.1 End-Use Industry and Customer Demand Structure
- 13.2 Leading Applications and Customer Groups
- 13.3 End-Use Market Size, Share and Forecast
- 13.4 Major End-Use Industry Deep Dives
- 13.4.1 Customer Requirements and Use Cases
- 13.4.2 Demand and Replacement Cycles
- 13.4.3 Technical and Regulatory Considerations
- 13.4.4 Purchasing and Procurement Models
- 13.4.5 Leading Vendors and Distribution Channels
- 13.4.6 Forecast and Commercial Opportunities
- 13.5 Emerging Applications and Cross-Segment Demand
- 13.6 End-Use Industry Investment Priorities
Chapter 14 Vietnam Data Analytics Geographic Market Outlook, 2025-2035
- 14.1 Domestic Market Distribution and Demand Clusters
- 14.2 State- or Province-Wise Market Size and Forecast, 2025-2035
- 14.3 City and Metropolitan Market Outlook
- 14.4 Industrial, Manufacturing and Commercial Clusters
- 14.5 Geographic Concentration of Key End Users
- 14.6 Local Pricing and Purchasing Differences
- 14.7 Domestic Production Facilities and Capacity Map
- 14.8 Local Infrastructure and Project Pipeline
- 14.9 State-Level Policy and Incentive Differences
- 14.10 Subnational Investment Hotspots and Opportunities
- 14.11 Distribution and Logistics Networks
- 14.12 Domestic Competitive Footprint
Chapter 15 Vietnam Data Analytics Technology, Innovation and Sustainability Outlook
- 15.1 Technology Landscape and Maturity
- 15.2 Product, Process and Service Innovation
- 15.3 AI, Automation and Digital Tools in the Industry
- 15.4 Technology Adoption and Performance Benchmarking
- 15.5 Innovation Pipeline and R&D Investment
- 15.6 Patent and Intellectual Property Trends
- 15.7 Energy Efficiency and Resource Management
- 15.8 Sustainability, Recycling and Circularity
- 15.9 Technology Roadmap, 2025-2035
- 15.10 Risks of Obsolescence and Technology Substitution
Chapter 16 Vietnam Data Analytics Market Key Strategic Imperatives
- 16.1 Growth and Market Entry Priorities
- 16.2 High-Return Products and Segments
- 16.3 Pricing, Profitability and Cost Optimization
- 16.4 Technology Investment and Product Differentiation
- 16.5 Supply Chain Localization and Resilience
- 16.6 Distribution and Customer Acquisition
- 16.7 Partnership, Acquisition and Capacity Strategy
- 16.8 Regional Expansion Priorities
- 16.9 Short-, Medium- and Long-Term Actions
Chapter 17 Competition Outlook
- 17.1 Industry Competition Characteristics
- 17.2 Market Structure and Concentration
- 17.3 Market Share and Competitive Positioning, 2025
- 17.4 Company-Wise Revenue and Product Benchmarking
- 17.5 Production and Service Capacity Benchmarking
- 17.6 Technology, Pricing and Differentiation
- 17.7 Regional Footprint and Distribution Strength
- 17.8 Mergers, Acquisitions and Strategic Alliances
- 17.9 New Entrants and Competitive Threats
- 17.10 Porter's Five Forces and Industry Attractiveness
- 17.11 Competitive Outlook, 2025-2035
Chapter 18 Company Profiles
- 18.1 Company Coverage and Selection Criteria
- 18.2 FPT Corporation
- 18.2.1 Business Description
- 18.2.2 Company Ownership and Geographic Presence
- 18.2.3 Product and Service Portfolio
- 18.2.4 Manufacturing and Operating Footprint
- 18.2.5 Financial Performance and Investment
- 18.2.6 Market Share and Competitive Position
- 18.2.7 Technology and Innovation Capabilities
- 18.2.8 Strategic Alliances or Partnerships
- 18.2.9 Recent Developments
- 18.2.10 Growth Strategy and Outlook
- 18.3 Viettel Solutions
- 18.4 VNPT-IT
- 18.5 CMC Corporation
- 18.6 IBM Vietnam
- 18.7 Microsoft Vietnam
- 18.8 SAP Vietnam
- 18.9 Oracle Vietnam
- 18.10 SAS Vietnam
- 18.11 KMS Technology
- 18.12 Other Relevant Market Participants
Note: Every listed company is profiled on the structure shown under the first company. The company list is preliminary and may change based on research findings, market developments, data availability and client requirements.
Chapter 19 Disclaimer
- 19.1 Research and Forecast Disclaimer
- 19.2 Data Source and Estimation Limitations
Note: The depth of individual sections depends on data availability for this market. Volume, capacity, trade and other unit-based metrics are included where applicable.

