
Selling in social apps turns posting tools into operations
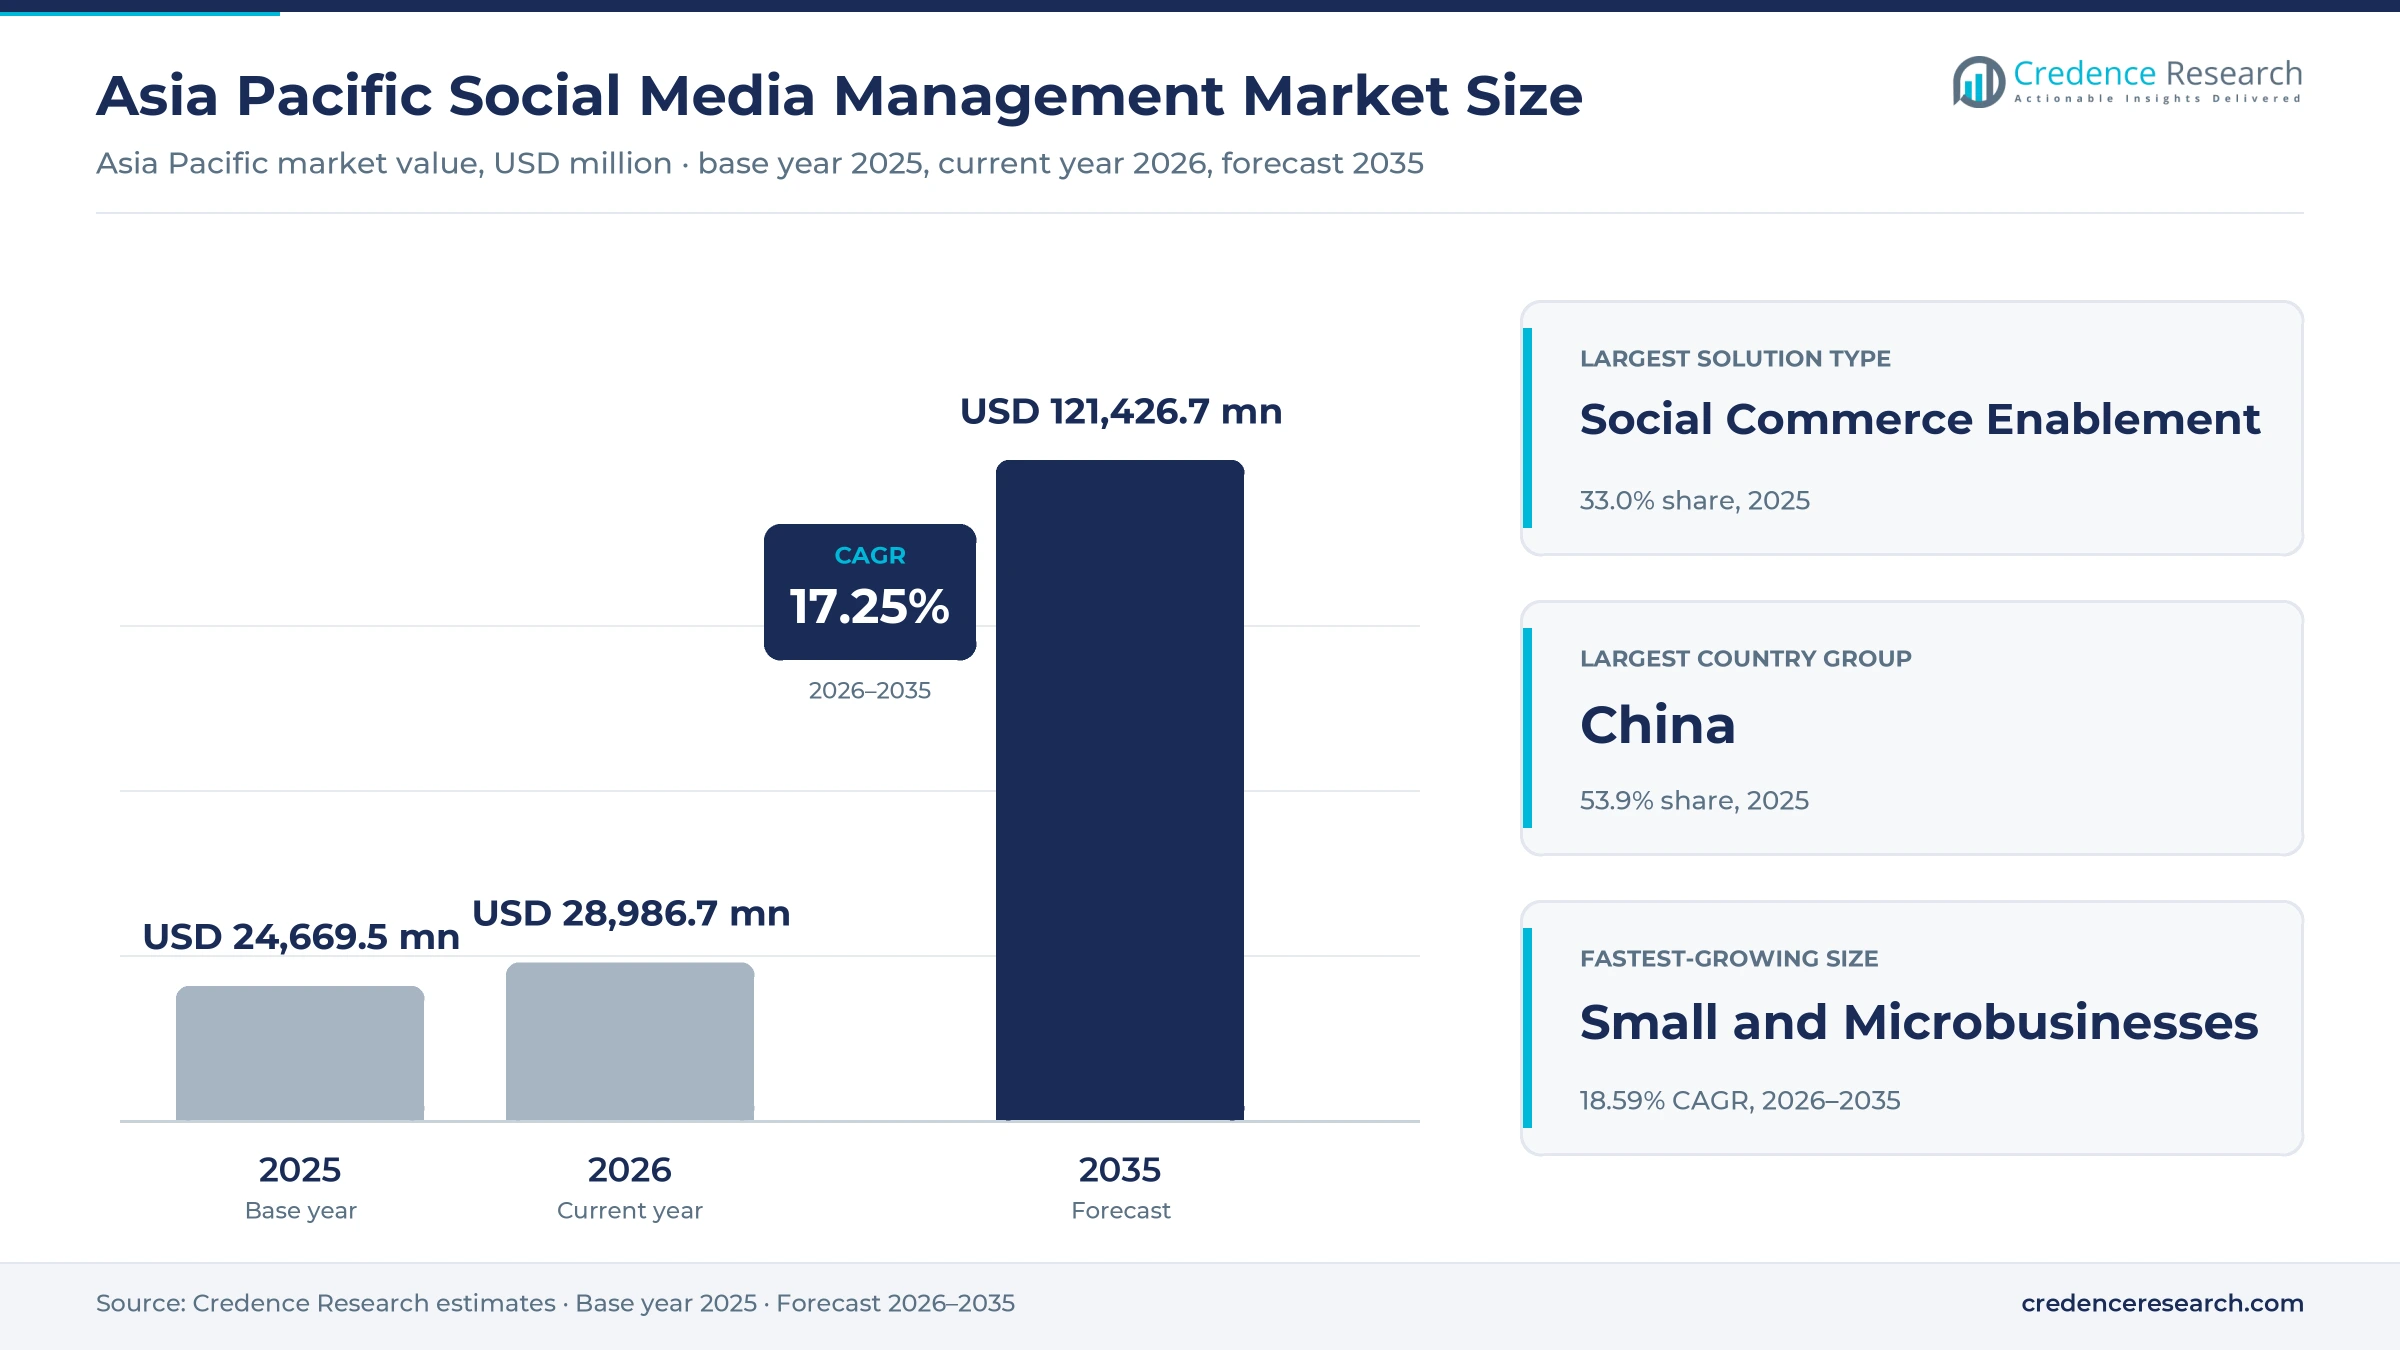
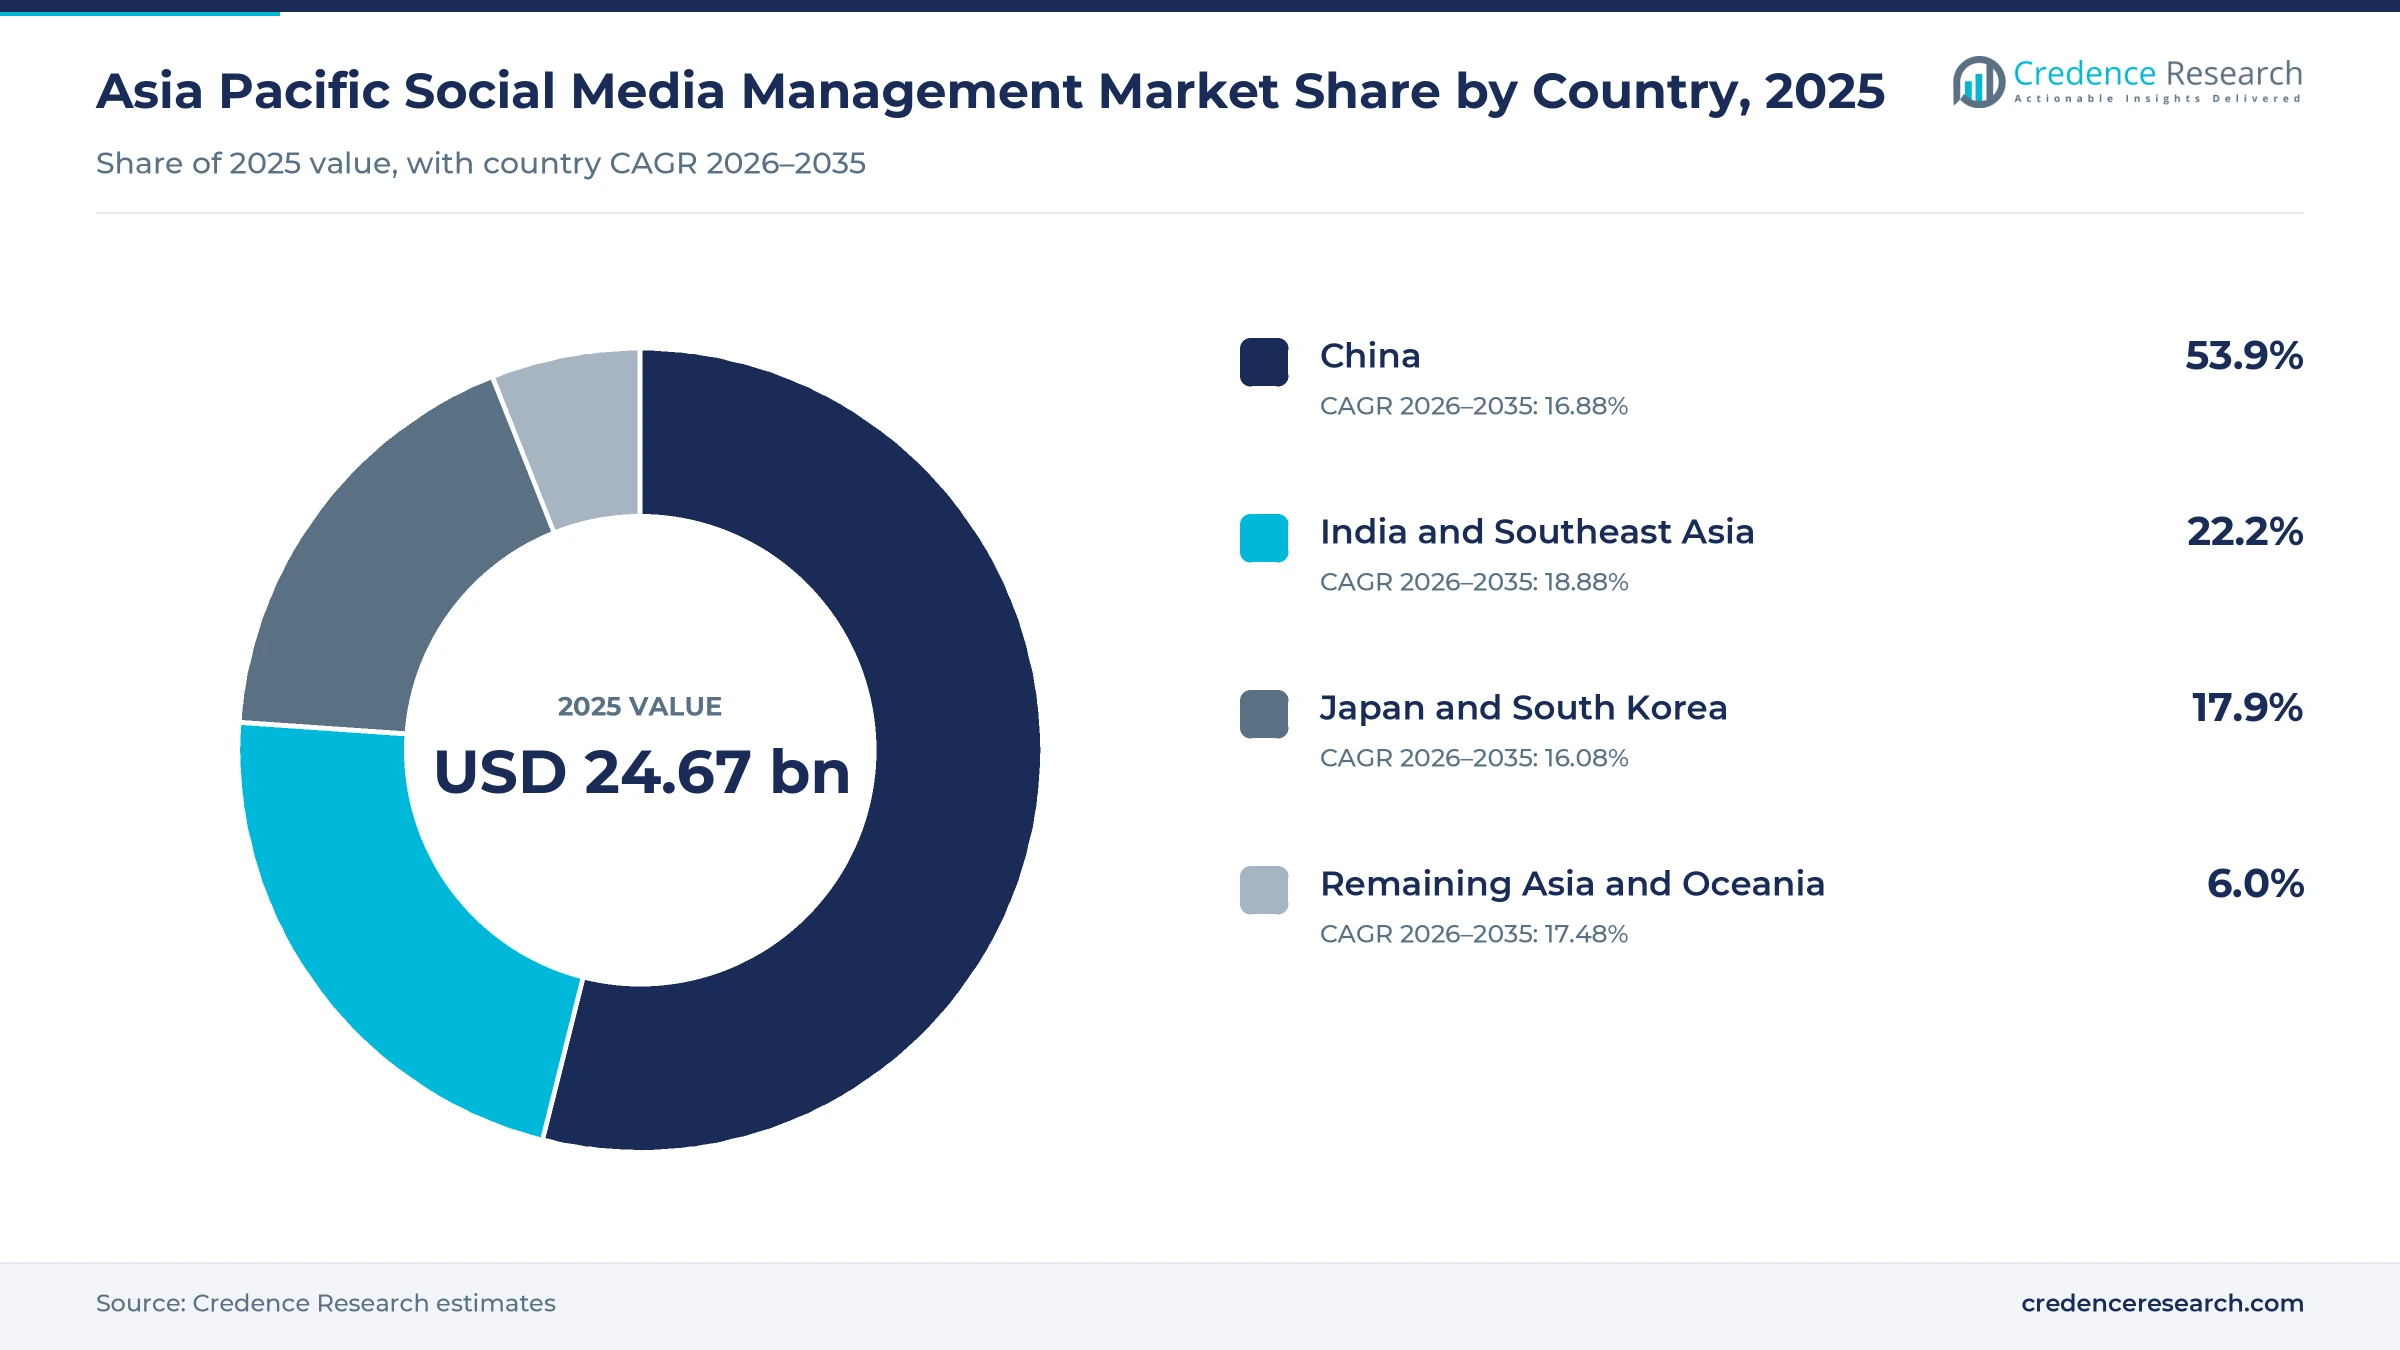
The Asia Pacific social media management market was valued at USD 24.67 billion in 2025 and is projected to increase from USD 28.99 billion in 2026 to USD 121.43 billion by 2035, registering a CAGR of 17.25% during 2026–2035. Demand comes from brands, retailers, agencies and public bodies that buy software and services to publish, listen, answer customers and sell across many social and messaging apps at once. China held the largest country-group share, 53.9% in 2025, because short video, livestream selling and in-app stores are already part of everyday retail there. India and Southeast Asia is the fastest-growing area at 18.88% a year, as millions of newly registered small firms start selling through chat and video apps. In turn, new rules on AI content labels, age limits and personal data are pushing buyers toward approval workflows and audit trails, which raises the value of each seat.
Which tools, services and buyers does the estimate count?
The estimate measures spending across Asia Pacific on software and services that organizations use to run their presence on social and messaging platforms. It covers commerce enablement, listening and analytics, publishing and governance tools, and the professional and managed services that set up or operate them for brands, retailers, agencies and public bodies.
The estimate excludes paid advertising bought on the platforms, payments to creators and the platforms' own revenue from users. The value chain runs from platform interfaces through software vendors and local partners to in-house teams and agencies in China, Japan and South Korea, India and Southeast Asia, and the remaining markets of Asia and Oceania.
Asia Pacific Social Media Management Market Insights
- The Asia Pacific social media management market was valued at USD 24.67 billion in 2025 and is projected to reach USD 121.43 billion by 2035, at a 17.25% CAGR during 2026–2035.
- China held a 53.9% share of 2025 value, because short video, chat and livestream selling already reach most of its 1.123 billion internet users.
- Social commerce enablement led solution types with a 33.0% share of 2025 value, as brands manage product feeds and orders inside social apps.
- China's rules on labeling AI-generated content took effect on Sept. 1, 2025, adding a compliance step to every brand post that uses synthetic media.
- Small and microbusinesses grow fastest among enterprise sizes at 18.59% a year during 2026–2035, as formal registration brings them onto paid tools.
Commerce tools lead while intelligence and small firms gain
Why does commerce enablement hold the most value?
Based on solution type, the market is categorized into social commerce enablement, social intelligence, social operations and governance, and professional and managed services. Social Commerce Enablement led with a 33.0% share of 2025 value, because brands in China and Southeast Asia sell directly through video and chat apps. Social Intelligence grows fastest at 18.13% a year, as AI summaries of comments and reviews become standard inside paid plans.
Which uses are drawing new budget fastest?
Based on application, the market is categorized into marketing execution, customer engagement, commerce operations and governance and risk. Marketing Execution led with a 38.0% share of 2025 value, because scheduling and publishing remain the first task most teams pay to automate. Commerce Operations grows fastest at 18.11% a year, as order questions, stock updates and returns move into social inboxes.
How quickly are small firms adopting paid tools?
Based on enterprise size, the market is categorized into enterprise organizations, midmarket organizations and small and microbusinesses. Enterprise Organizations led with a 49.0% share of 2025 value, because large brands run many accounts, languages and approval layers at once. Small and Microbusinesses grow fastest at 18.59% a year, as registered small sellers in India and Indonesia move from free apps to low-cost subscriptions.
Why does public cloud dominate deployment choices?
Based on deployment model, the market is categorized into public cloud, private and hybrid cloud, on-premise and service-delivered. Public Cloud led with a 58.0% share of 2025 value, because platform interfaces change often and vendors push updates centrally. Public Cloud grows fastest at 17.71% a year, as more software makers host data inside the region to meet local data rules.
| Segment Group | Leading Sub-segment | Share, 2025 | Fastest-growing Sub-segment | CAGR, 2026–2035 |
|---|---|---|---|---|
| By Solution Type | Social Commerce Enablement | 33.0% | Social Intelligence | 18.13% |
| By Application | Marketing Execution | 38.0% | Commerce Operations | 18.11% |
| By Enterprise Size | Enterprise Organizations | 49.0% | Small and Microbusinesses | 18.59% |
| By Deployment Model | Public Cloud | 58.0% | Public Cloud | 17.71% |
Request a Free Sample
Fill in your details and we'll send you a free sample report.
- Sample data tables & charts
- Research methodology
Shoppable feeds, formal small firms and stricter workflows
How does commerce inside social apps lift tool spending?
Selling inside social and video apps turns account management into a daily operations task, which raises what brands spend on software. China counted 1.068 billion short video users and 976 million online shoppers in June 2025, according to the China Internet Network Information Center. National online retail sales reached 15,972.2 billion yuan in 2025, up 8.6%, and physical goods sold online made up 26.1% of all retail sales, according to the National Bureau of Statistics of China. In Indonesia, TikTok took a 75% stake in Tokopedia and folded TikTok Shop into it by February 2024. As a result, Social Commerce Enablement kept a 33.0% share of 2025 value.
Why does small-business formalization widen the buyer base?
Small firms that register formally start to keep records, advertise and sell online, which makes them buyers of paid tools rather than free apps. India counted more than 7.30 crore enterprises on its Udyam registration portal and Udyam Assist Platform as of Dec. 17, 2025, according to the Ministry of Micro, Small and Medium Enterprises. Of that total, 2.92 crore informal micro firms joined through the assist platform launched in January 2023. Meta said in July 2025 that WhatsApp serves over 200 million monthly active businesses, many of them in India. Consequently, small and microbusinesses grow fastest at 18.59% a year.
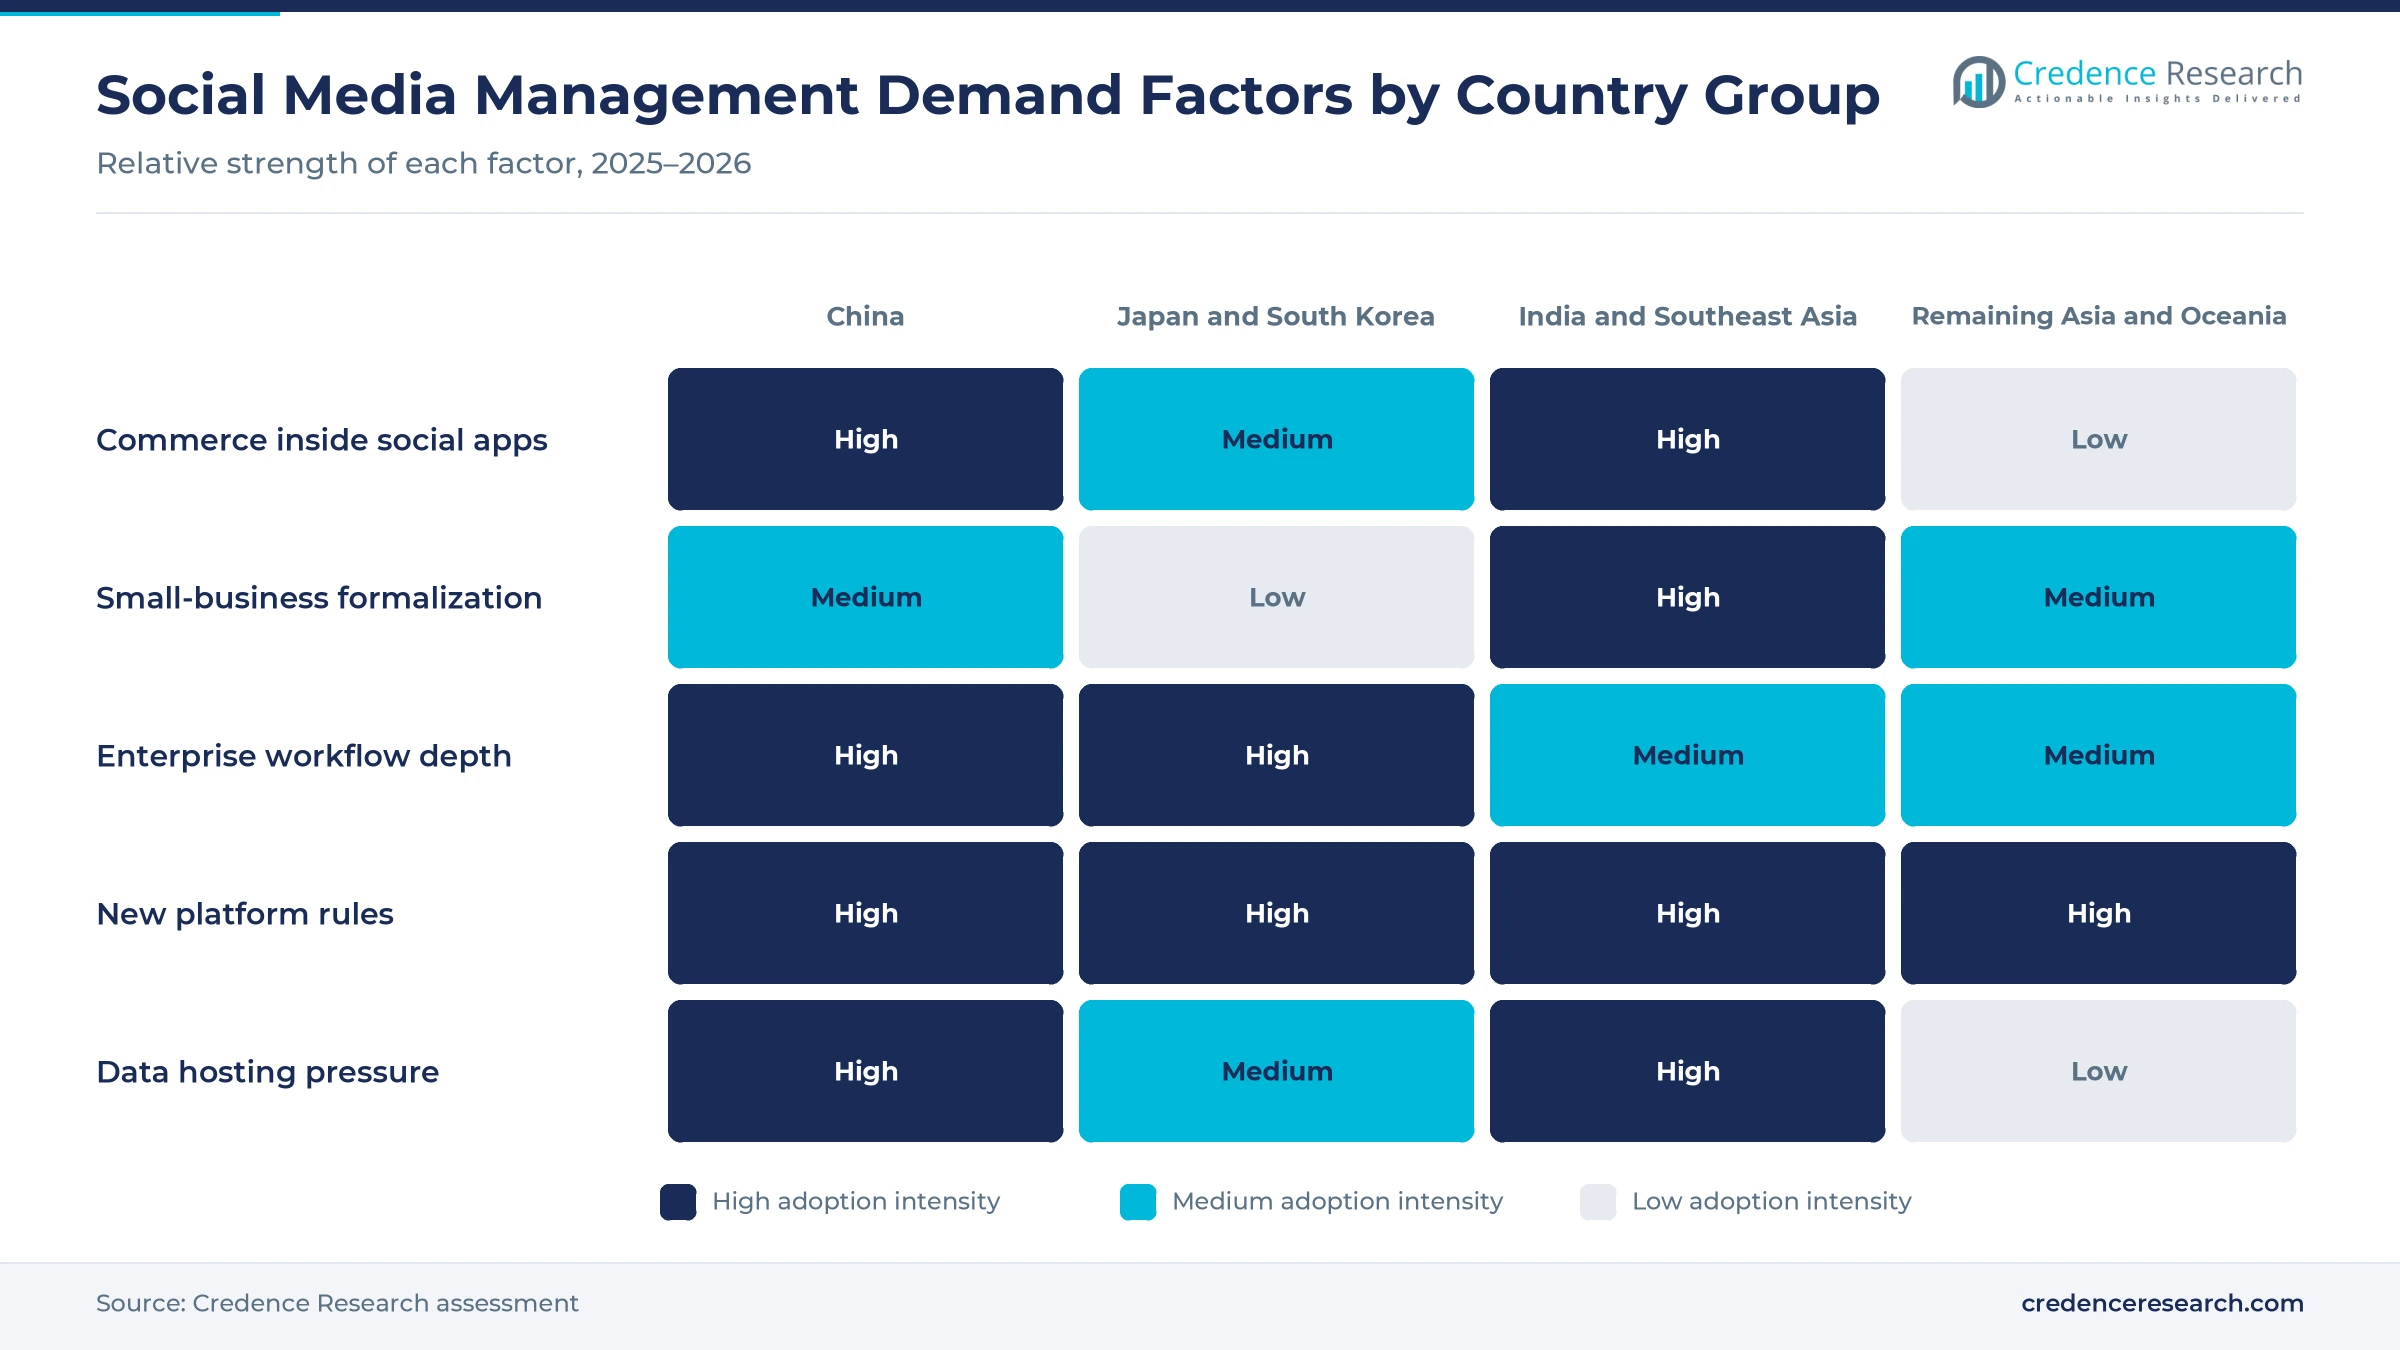
How do professional enterprise workflows raise seat value?
Large brands now run dozens of accounts across several languages and markets, so they pay for approval chains, shared inboxes and audit logs rather than simple scheduling. Sprinklr opened a Gurgaon office in May 2023 as a global research and development hub, its ninth Asia Pacific location, and planned to add more than 400 engineers there by that summer. Meta released one ads manager for Facebook, Instagram and WhatsApp in July 2025, which pushes teams to plan paid and organic work together. India's internet subscribers reached 1,028.61 million at the end of 2025, according to the Telecom Regulatory Authority of India. Because large brands need these controls across many accounts and markets, Enterprise Organizations held a 49.0% share of 2025 value.
What role do new platform rules play in demand?
Governments across the region now set duties for platforms and the brands that use them, which turns governance into a budget line of its own. Japan designated YouTube, LINE services, Facebook, Instagram, Threads, TikTok and X as large platforms with removal-request duties on April 30, 2025, according to the Ministry of Internal Affairs and Communications. Malaysia's class license for social media services with at least eight million users took effect on Jan. 1, 2025. Vietnam has required verified social accounts since Dec. 25, 2024, under Decree 147. In turn, governance and risk tools win new budget, because brands must show how they handle complaints, removal requests and verified accounts.
AI labels, messaging sales and age rules reshape buying
Why are AI content labels reshaping publishing workflows?
Brands increasingly use generated images, voice and video in posts, and regulators now want that content marked clearly for viewers. The Cyberspace Administration of China and three other agencies issued measures on March 7, 2025, requiring labels on AI-generated and synthetic content, effective Sept. 1, 2025. Platforms that spread content must check those labels, which means brand teams need tagging steps before posts go live. China also had 1.093 billion instant messaging users in June 2025, so labeled content reaches a very large audience. As a result, Social Intelligence grows fastest at 18.13% a year, as tools that track content origin gain ground.
How is messaging becoming the main sales channel?
Customers in India and Southeast Asia increasingly ask questions, compare prices and pay inside chat rather than on a website. Meta added AI business assistants, voice and video calls and a single ads manager to WhatsApp Business at its Conversations event in July 2025. Vietnam requires livestreamers to verify accounts with a personal identification number under Decree 147, which formalizes selling through live video across the country. In turn, vendors are linking social inboxes with conversational AI agents that answer order questions, track deliveries and handle returns automatically. Consequently, Commerce Operations grows fastest at 18.11% a year among applications.
Australia's age rule opens new compliance work for brands
New age limits create a clear opening for tools that help brands check who they target and how they report. From Dec. 10, 2025, people under 16 may not hold accounts on platforms including TikTok, Snapchat, Instagram, Facebook, YouTube, X and Twitch, according to the eSafety Commissioner. Platforms carry the legal duty, yet brands that run youth campaigns must now review audiences, creators, competitions and promotions with more care. Agencies that book influencer marketing platforms also need clear records showing that creators and their audiences meet the rule. As a result, Remaining Asia and Oceania grows at 17.48% a year through 2035.
Where does India's data consent rule open new work?
India's personal data rules create an opening for vendors that can record consent and handle breach steps inside social campaigns. The government notified the Digital Personal Data Protection Rules on Nov. 14, 2025, with an 18-month window for phased compliance, according to the Press Information Bureau. Penalties reach ₹250 crore for weak security safeguards and ₹200 crore for failing to report a breach. Lead forms, contests and chat sign-ups on social apps all collect personal data, so brands need consent records. Consequently, consent and audit features are becoming standard in Indian plans, while Public Cloud keeps a 58.0% share as vendors add hosting inside the country.
Fragmented platforms and fast-changing national rules
How does platform fragmentation raise integration costs?
Each country in the region favors different apps, so one vendor must connect to many interfaces that change without notice. Japan's list of large platforms alone spans services from Google, LY Corporation, Meta, TikTok and X. As a result, vendors spend heavily on connectors before they can sell in a new market. Suppliers respond by partnering with local resellers and by focusing on the apps that carry most commerce.
Why do shifting national rules slow product planning?
Rules on content, age, identity and data change country by country, which makes one regional product hard to keep compliant. Indonesia's Trade Regulation No. 31 of 2023 barred social media from hosting buying and selling transactions, which forced sellers to change channels quickly. In turn, vendors must rebuild workflows whenever a rule changes. Suppliers respond with country settings and legal review built into their release cycles.
Can vendors win price-sensitive small sellers?
Small sellers want low monthly prices, yet they expect many of the same features that large brands use. Many still rely on free business accounts inside chat and video apps, which limits what paid tools can charge. Consequently, vendors face long trial periods and high churn among micro firms. Suppliers respond with free trials, local-currency plans and bundles with accounting or customer experience platforms that small firms already use.
What risks surround data residency and hosting?
Data rules in China, India and Vietnam push vendors to keep some records inside each country, which raises hosting costs for every new market. India's data rules require consent managers to be companies based in India, which shows how local presence matters. As a result, small vendors may struggle to cover the cost of local hosting. Suppliers respond by using regional cloud zones and partners that already hold local data centers.
China leads as India and Southeast Asia grow fastest
| Country | Value, 2025 (USD billion) | Share, 2025 | CAGR, 2026–2035 |
|---|---|---|---|
| China | 13.30 | 53.9% | 16.88% |
| India and Southeast Asia | 5.48 | 22.2% | 18.88% |
| Japan and South Korea | 4.42 | 17.9% | 16.08% |
| Remaining Asia and Oceania | 1.48 | 6.0% | 17.48% |
Social selling at scale keeps China ahead
China held a 53.9% share of 2025 value and grows at 16.88% a year. The country had 1.123 billion internet users in June 2025, a 79.7% penetration rate, and 95.1% of them watched short video. Online sales of physical goods made up 26.1% of 2025 retail sales, so brand teams manage stores, livestreams and service inside the same apps. Because AI content labels became mandatory in September 2025, governance tools are being added to commerce workflows.
Why do India and Southeast Asia grow fastest?
India and Southeast Asia held a 22.2% share of 2025 value and grows fastest at 18.88% a year. India had 1,028.61 million internet subscribers at the end of 2025, including 434.27 million in rural areas, and more than 7.30 crore registered small firms. Indonesia's merged Tokopedia and TikTok Shop business shows how commerce and video now overlap. As a result, small sellers and agencies are moving onto paid tools for chat, catalogs and mobile commerce solutions.
Platform duties shape demand in Japan and South Korea
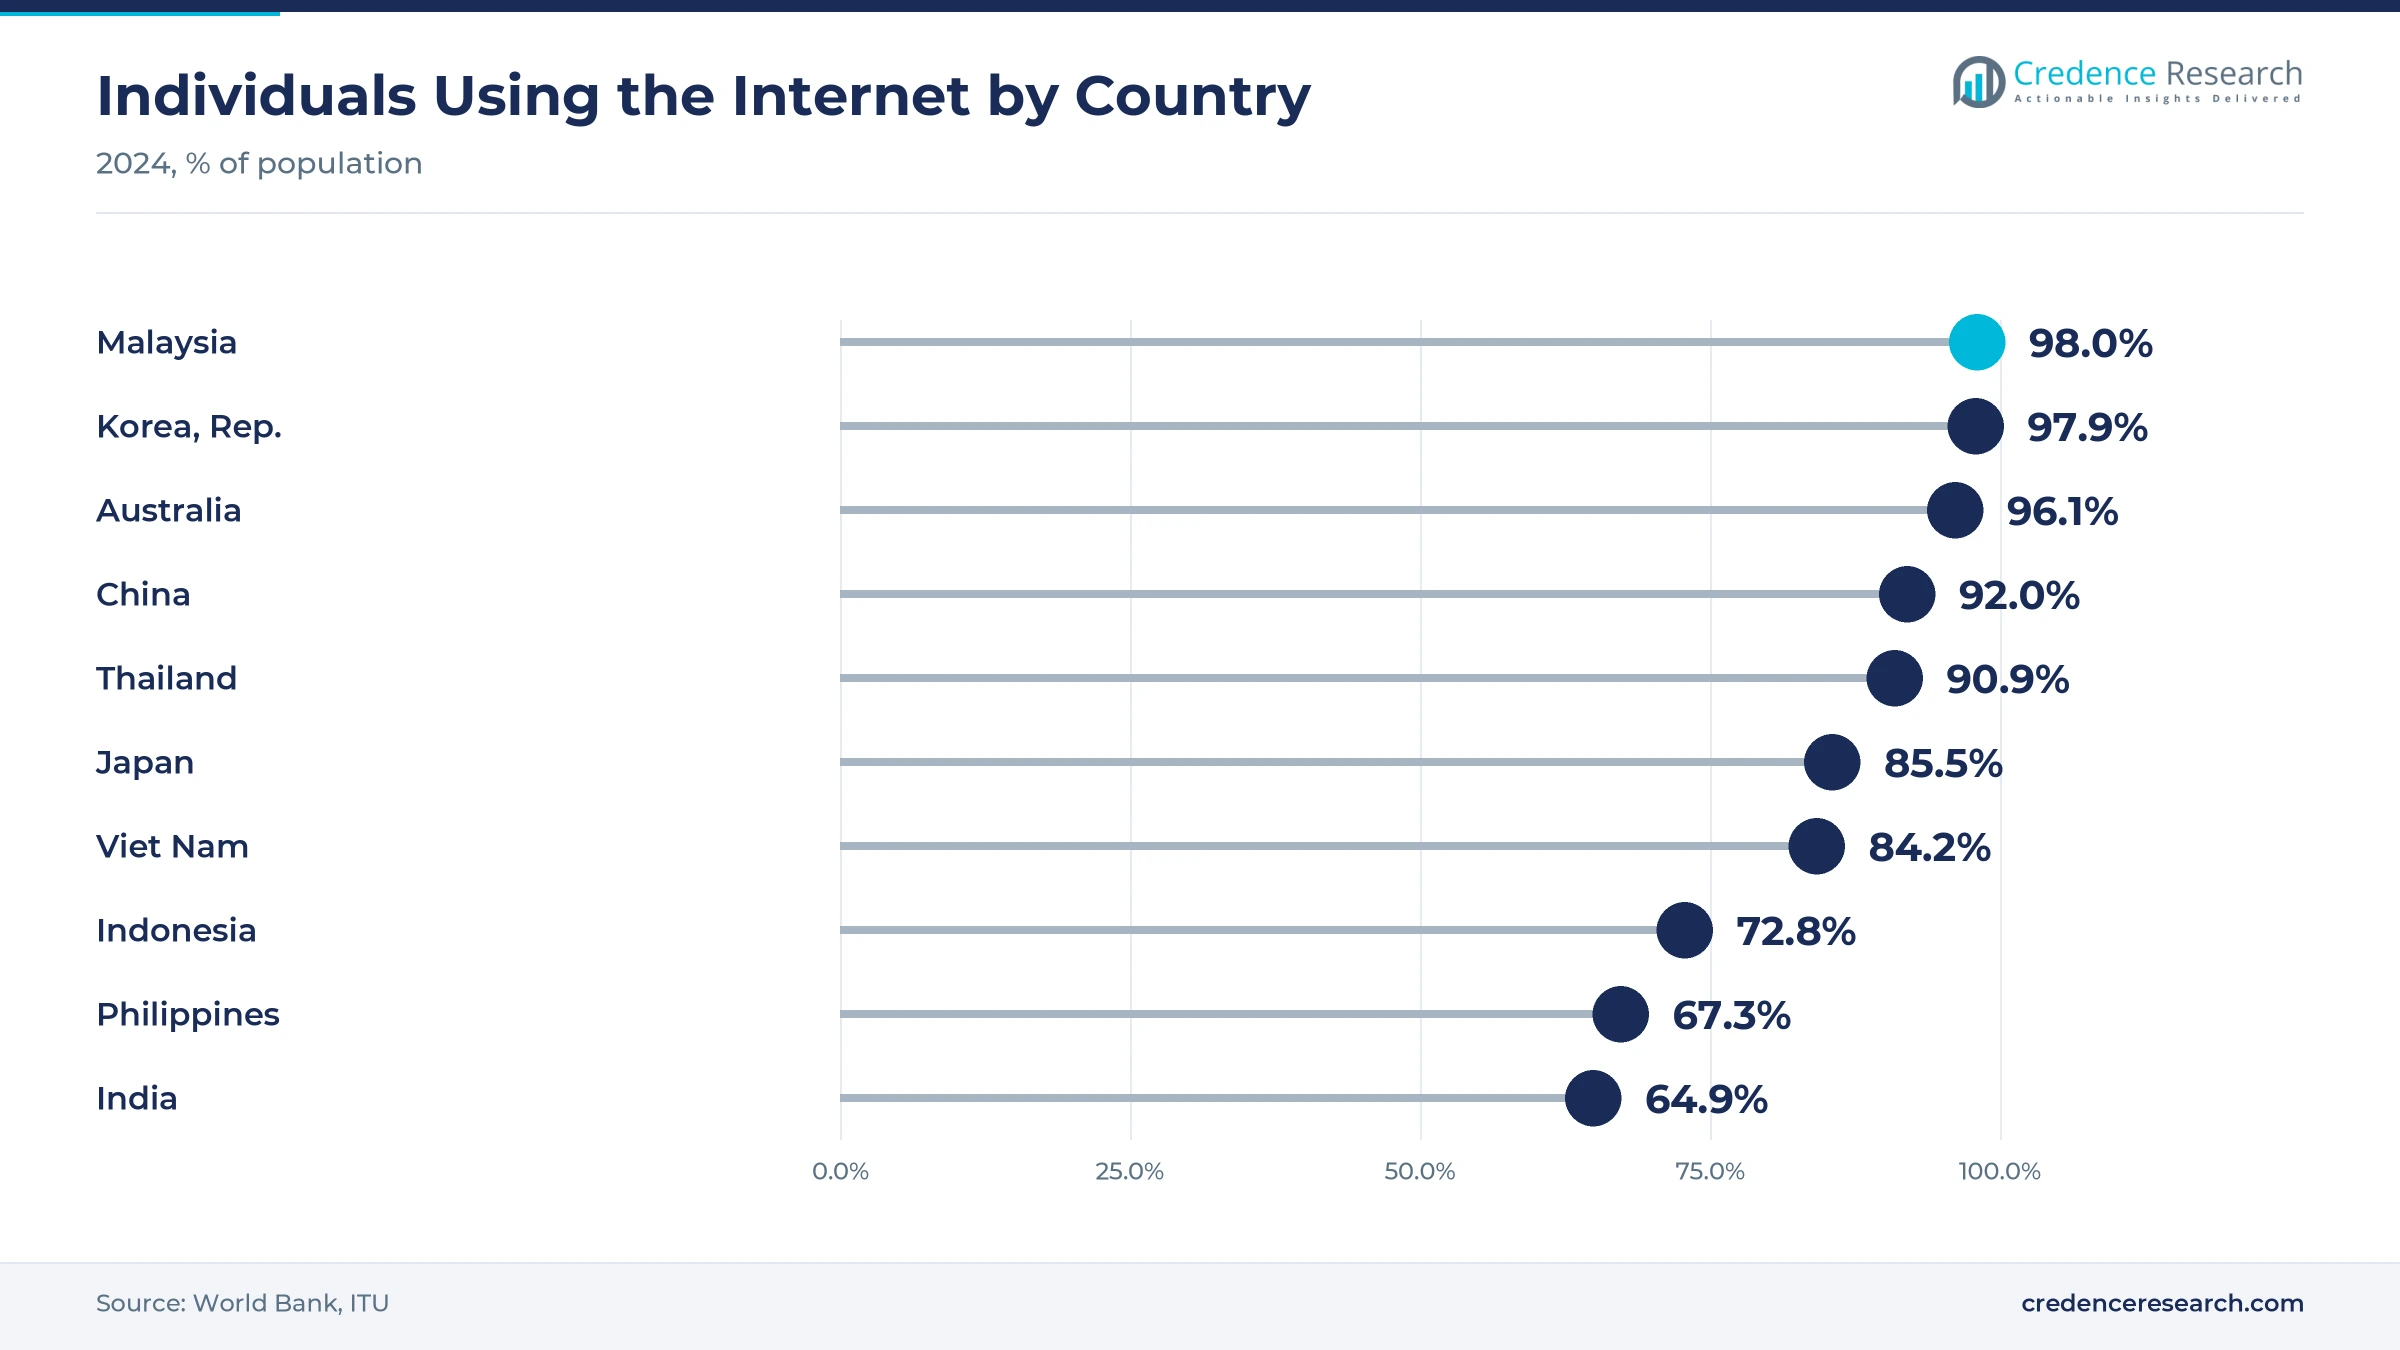
Japan and South Korea held a 17.9% share of 2025 value and grows at 16.08% a year. Japan designated large platforms, including LINE services run by LY Corporation, under its Information Distribution Platform Act on April 30, 2025. Internet use reached about 98% of people in South Korea and 86% in Japan in 2024, according to World Bank data. In turn, demand here favors listening, approval and reporting tools over basic scheduling.
Age rules and licenses lift Oceania and other markets
Remaining Asia and Oceania held a 6.0% share of 2025 value and grows at 17.48% a year. Australia's minimum age rule for platforms took effect on Dec. 10, 2025, and about 96% of Australians used the internet in 2024. Malaysia began licensing large social media services on Jan. 1, 2025. Because these rules raise reporting needs, brands and agencies in smaller markets pay for governance features earlier than their size alone would suggest.
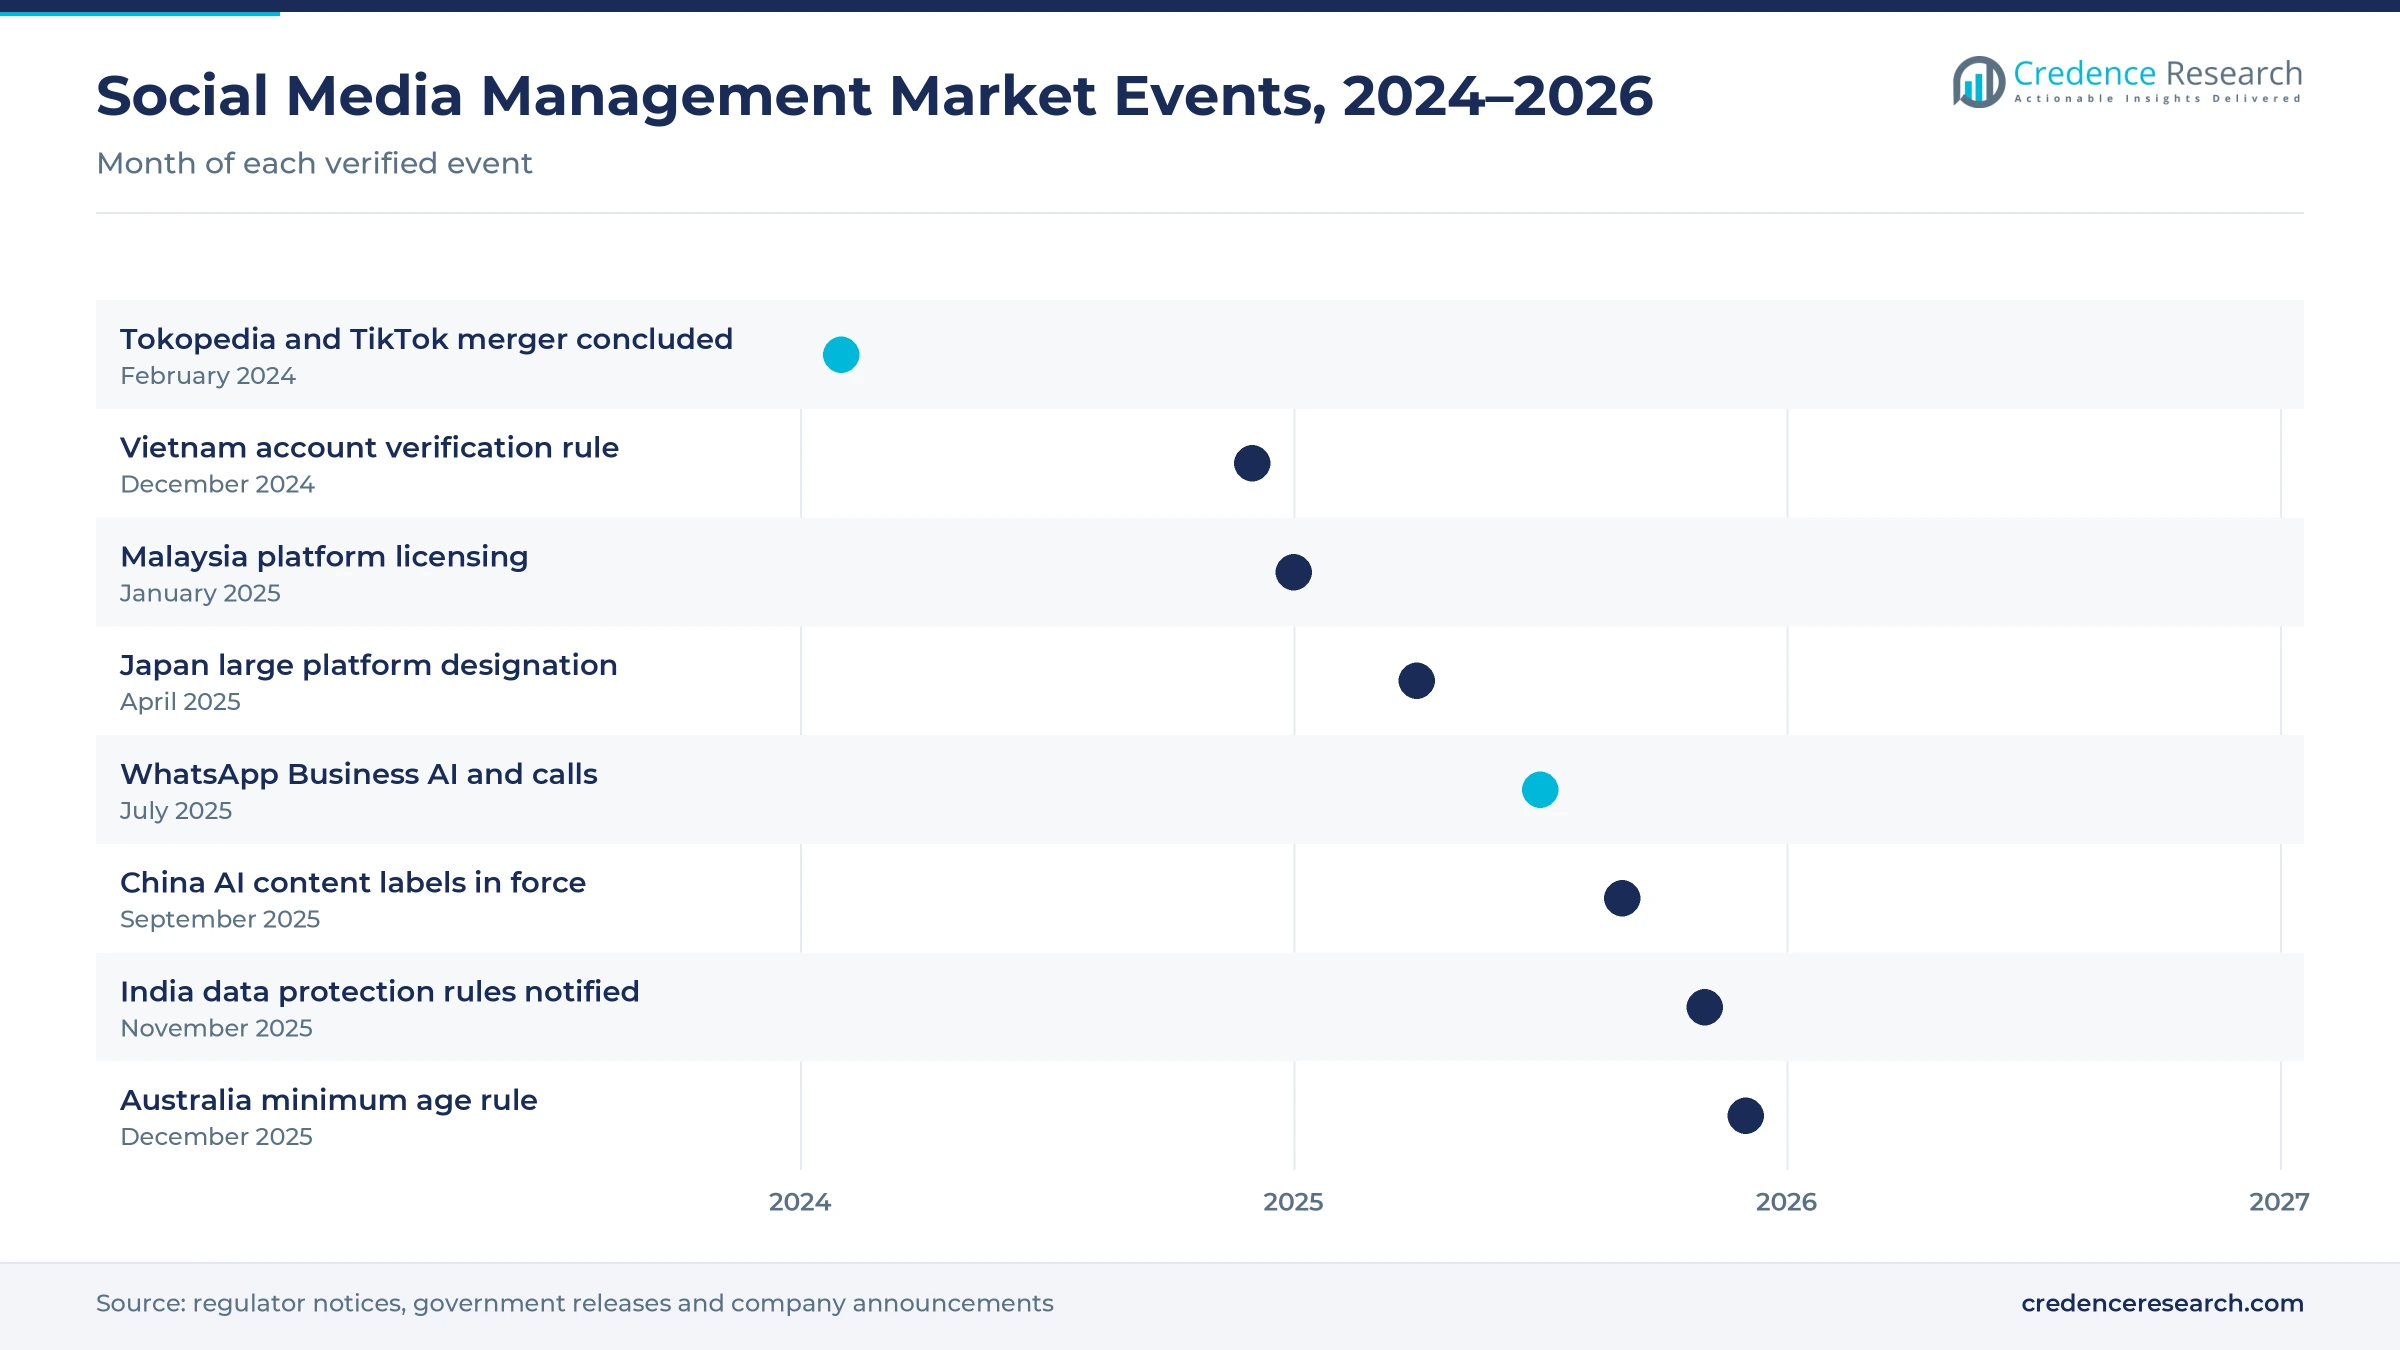
Platform rules and commerce deals across 2024–2026
| Development | Status and market relevance |
|---|---|
| In February 2024, Tokopedia confirmed it had concluded its merger with TikTok, which holds a 75% stake and folded TikTok Shop into it. | Ties video and commerce together in Indonesia |
| In April 2025, Japan designated YouTube, LINE services, Facebook, Instagram, Threads, TikTok and X as large platforms. | Adds removal-request duties in Japan |
| In July 2025, Meta added AI business assistants, calls and a single ads manager to WhatsApp Business. | Moves sales and service into messaging |
| In September 2025, China's measures requiring labels on AI-generated and synthetic content took effect. | Adds labeling steps to brand publishing |
| In November 2025, India notified the Digital Personal Data Protection Rules with an 18-month compliance window. | Raises consent and breach-handling needs |
Listening, publishing and commerce layers set price tiers
- Publishing and approval layers schedule posts across many accounts and route drafts through legal and brand review, which large firms need first.
- Listening and analytics layers track mentions, comments and reviews across apps and languages, then summarize trends with AI models.
- Unified inbox layers pull comments and chat messages into one queue, so service teams can answer customers across channels.
- Commerce connectors link product catalogs, orders and stock data with social stores and chat apps, which matters most in China and Southeast Asia.
Need a Custom Version of This Report?
Tailor the scope, geography, or segments to your exact requirements.
- Custom geography or segment scope
- Direct access to our analyst team
Global suites and local software makers compete on fit
Competition runs between global suites, regional teams and local software makers that price for small firms. Sprinklr runs its Gurgaon research and development hub as one of nine Asia Pacific locations. Hootsuite moved its Asia Pacific headquarters from Singapore to Sydney in 2019, which shows its focus on Australian buyers. Sprout Social appointed a Singapore-based head of Asia Pacific marketing in June 2022 to widen its customer base. Meltwater launched its Enterprise Intelligence Suite in the region in 2023 and named new Singapore-based leaders. Zoho Social is built by Chennai-based Zoho and offers small businesses and agencies a 15-day free trial. Vendors compete on platform coverage, local language support, data hosting and partner networks rather than price alone.
Which software makers lead regional buying?
| Company | Type | Role in the market |
|---|---|---|
| Sprinklr | Enterprise suite | Gurgaon research and development hub in India |
| Hootsuite | Publishing and listening suite | Asia Pacific headquarters in Sydney since 2019 |
| Sprout Social | Publishing and analytics suite | Singapore-based Asia Pacific marketing lead named in June 2022 |
| Meltwater | Listening and intelligence suite | Enterprise Intelligence Suite launched in the region in 2023 |
| Zoho Social | Small-business suite | Built by Chennai-based Zoho with a 15-day free trial |
Credence Research sees governance joining commerce spend
Credence Research's view is that Asia Pacific social media management spending will grow far faster than general software through 2035, because selling and service now happen inside social apps. Commerce enablement should keep the largest share, while social intelligence, commerce operations and small businesses add value fastest. China will stay the largest country group, although India and Southeast Asia gains share as registered small firms adopt paid tools. However, shifting national rules will reward vendors that build governance and local hosting into their products.
Account counts, seat prices and service fees drive the model
The report uses 2025 as the base year and 2035 as the forecast year. Market values come from the Credence Research model, which combines active business accounts, paid seats, average subscription prices and service fees by country group. Country-group growth rates and the splits by solution type, application, enterprise size and deployment model are Credence Research estimates, while 2025 country-group shares follow the study's regional base. Sources used are official statistics, regulator notices, government releases, company announcements and trade press, and no interviews or surveys were used.
Commerce and compliance shape regional spending to 2035
The Asia Pacific social media management market is expected to reach USD 121.43 billion by 2035, a 17.25% CAGR during 2026–2035, as commerce and compliance move into the same tools. Spending is projected to rise from USD 28.99 billion in 2026 as AI labels, data consent rules and messaging sales add new tasks for brand teams. Growth should be strongest in social intelligence, commerce operations, small businesses and India and Southeast Asia, while China keeps the largest share. In contrast, fragmented platforms and frequent rule changes could slow adoption in some markets.
Frequently Asked Questions
How big is the Asia Pacific social media management market?
Which country group leads demand?
Which country group grows fastest?
Which solution type holds the largest share?
Which enterprise size grows fastest?
How are new rules changing buyer needs?
Who are the leading companies in this market?
What are the main risks to growth?
Table of Content
Chapter 1 Market Segmentation
- 1.1 Segmentation Framework
- 1.1.1 Product and Service Classification
- 1.1.2 Application and End-Use Classification
- 1.1.3 Technology and Solution Classification
- 1.1.4 Customer and Distribution Channel Classification
- 1.1.5 Geographic Segmentation
- 1.1.6 Market Segment Definitions and Boundaries
- 1.2 By Solution Type
- 1.2.1 Social Commerce Enablement
- 1.2.2 Social Intelligence
- 1.2.3 Social Operations and Governance
- 1.2.4 Professional and Managed Services
- 1.3 By Application
- 1.3.1 Marketing Execution
- 1.3.2 Customer Engagement
- 1.3.3 Commerce Operations
- 1.3.4 Governance and Risk
- 1.4 By Enterprise Size
- 1.4.1 Enterprise Organizations
- 1.4.2 Midmarket Organizations
- 1.4.3 Small and Microbusinesses
- 1.5 By Deployment Model
- 1.5.1 Public Cloud
- 1.5.2 Private and Hybrid Cloud
- 1.5.3 On-Premise
- 1.5.4 Service-Delivered
- 1.6 By Country
- 1.6.1 China
- 1.6.2 Japan and South Korea
- 1.6.3 India and Southeast Asia
- 1.6.4 Remaining Asia and Oceania
Chapter 2 Introduction
- 2.1 Report Objectives and Scope
- 2.2 Product Definition and Industry Terminology
- 2.3 Market Inclusions and Exclusions
- 2.4 Research Process
- 2.4.1 Primary Research and Expert Interviews
- 2.4.2 Secondary Research and Source Review
- 2.4.3 Top-Down and Bottom-Up Estimation
- 2.4.4 Data Triangulation and Verification
- 2.5 Market Size Measurement Basis
- 2.5.1 2025: USD 24.67 billion → 2035: USD 121.43 billion
- 2.6 Historical and Forecast Reference Periods
- 2.6.1 Historical Period: 2018-2025
- 2.6.2 Base Year: 2025
- 2.6.3 Forecast Period: 2025-2035
- 2.7 Research Assumptions and Limitations
Chapter 3 Executive Summary
- 3.1 Market Snapshot and Key Findings
- 3.2 Base-Year Market Size, 2025
- 3.3 Forecast Market Size, 2035
- 3.4 Revenue and Volume Growth Outlook
- 3.5 Key Demand and Supply Indicators
- 3.6 Leading Market Segments
- 3.7 Fastest-Growing Market Opportunities
- 3.8 Regional Performance Highlights
- 3.9 Technology and Industry Transformation
- 3.10 Competitive Landscape Summary
- 3.11 Analyst View and Strategic Implications
Chapter 4 Asia Pacific Social Media Management Market Trends and Developments
- 4.1 Historical Industry Development, 2018-2025
- 4.2 Recent Market Trends and Developments
- 4.3 Demand and Customer Behavior Trends
- 4.4 Technology and Product Innovation
- 4.5 Artificial Intelligence, Automation and Digitalization
- 4.6 Local Manufacturing and Supply Chain Realignment
- 4.7 Industry Partnerships, Mergers and Acquisitions
- 4.8 Sustainability and Circular Economy Developments
- 4.9 Government and Private Sector Investment Trends
- 4.10 Emerging Business Models and Commercialization
- 4.11 Industry Developments and Announcements
Chapter 5 Asia Pacific Social Media Management Market Supply and Demand Analysis
- 5.1 Demand Trend and Consumption Analysis, 2018-2025
- 5.2 Demand Forecast, 2025-2035
- 5.3 Supply Chain Structure and Procurement Trends
- 5.4 Supply-Demand Gap and Bottlenecks
- 5.5 Import Dependence and Sourcing Structure
- 5.6 Regional Supply and Demand Concentration
Chapter 6 Asia Pacific Social Media Management Market Pricing Analysis
- 6.1 Pricing Structure and Measurement
- 6.2 Historical Pricing Trends, 2018-2025
- 6.3 Pricing Outlook, 2025-2035
- 6.4 Pricing by Product and Market Segment
- 6.5 Geographic Pricing Differences
- 6.6 Key Input, Energy, Labor and Logistics Costs
- 6.7 Contract Pricing and Purchasing Models
- 6.8 Pricing Sensitivity and Competitive Positioning
- 6.9 Price, Margin and Profitability Implications
Chapter 7 Asia Pacific Social Media Management Market Dynamics
- 7.1 Market Growth Drivers
- 7.1.1 Demand-Side Drivers
- 7.1.2 Technology and Innovation Drivers
- 7.1.3 Infrastructure and Investment Drivers
- 7.1.4 Regulatory and Policy Drivers
- 7.2 Market Restraints
- 7.2.1 Cost and Affordability Constraints
- 7.2.2 Technology and Adoption Barriers
- 7.2.3 Supply Chain and Operational Constraints
- 7.3 Market Challenges
- 7.3.1 Competitive Pressure and Margin Erosion
- 7.3.2 Skills, Infrastructure and Implementation Gaps
- 7.4 Emerging Market Opportunities
- 7.5 Market Dynamics Impact and Time-Horizon Assessment
Chapter 8 Asia Pacific Social Media Management Value Chain Analysis
- 8.1 Industry Value Chain Overview
- 8.2 Upstream Suppliers and Critical Inputs
- 8.3 Technology and Component Providers
- 8.4 Manufacturing or Service Delivery
- 8.5 Distribution, Channel Partners and Integrators
- 8.6 Downstream Applications and End Users
- 8.7 Value Addition and Profit Pools
- 8.8 Vertical Integration and Outsourcing
- 8.9 Supplier Concentration and Risk
- 8.10 Supply Chain Localization and Resilience
Chapter 9 Asia Pacific Social Media Management Market Regulations and Policies
- 9.1 Relevant Laws, Standards and Compliance Frameworks
- 9.2 Product, Service, Safety and Quality Requirements
- 9.3 Government Policies, Incentives and Subsidies
- 9.4 Imports, Exports and Trade Barriers
- 9.5 Public Procurement and Local Content Requirements
- 9.6 Data Protection, AI and Cybersecurity Compliance
- 9.7 Upcoming Policy Changes and Market Implications
Chapter 10 Asia Pacific Social Media Management Market Hotspots and Opportunities
- 10.1 Market Opportunity Mapping and Growth Hotspots
- 10.2 High-Growth Applications and Customer Groups
- 10.3 Underserved Markets and White-Space Opportunities
- 10.4 Emerging Technology and Product Opportunities
- 10.5 New Capacity and Investment Hotspots
- 10.6 Market Entry and Expansion Opportunities
- 10.7 Distribution and Partnership Opportunities
- 10.8 Near-Term and Long-Term Commercial Potential
- 10.9 Opportunity Attractiveness and Execution Risks
Chapter 11 Asia Pacific Social Media Management Market Outlook, 2025-2035
- 11.1 Market Size and Analysis
- 11.1.1 Revenue (Market Measurement: 2025: USD 24.67 billion → 2035: USD 121.43 billion)
- 11.1.2 Historical Market Size, 2018-2025
- 11.1.3 Base-Year Market Size, 2025
- 11.2 Market Forecast, 2025-2035
- 11.2.1 Revenue Forecast to 2035
- 11.2.2 CAGR and Year-on-Year Growth
- 11.2.3 Incremental Revenue Opportunity
- 11.3 Forecast Assumptions and Scenario Analysis
- 11.3.1 Base-Case Forecast
- 11.3.2 Optimistic and Conservative Scenarios
- 11.3.3 Technology, Pricing and Policy Sensitivities
- 11.4 Market Attractiveness and Growth Outlook
Chapter 12 Asia Pacific Social Media Management Market Segmentation and Outlook
- 12.1 Segmentation Summary and Market Shares, 2025
- 12.2 Largest and Fastest-Growing Segments
- 12.3 By Solution Type - Market Size and Forecast, 2025-2035
- 12.3.1 Segment Definition and Scope
- 12.3.2 Historical Market Size, 2018-2025
- 12.3.3 Revenue Forecast, 2025-2035
- 12.3.4 Base-Year Market Share, 2025
- 12.3.5 Segment CAGR and Growth Drivers
- 12.3.6 Subsegment Market Size and Forecast
- 12.3.6.1 Social Commerce Enablement
- 12.3.6.2 Social Intelligence
- 12.3.6.3 Social Operations and Governance
- 12.3.6.4 Professional and Managed Services
- 12.3.7 Subsegment Pricing and Adoption Trends
- 12.3.8 Leading Suppliers and Competition
- 12.3.9 Regional Demand and Opportunities
- 12.4 By Application - Market Size and Forecast, 2025-2035
- 12.4.1 Segment Definition and Scope
- 12.4.2 Historical Market Size, 2018-2025
- 12.4.3 Revenue Forecast, 2025-2035
- 12.4.4 Base-Year Market Share, 2025
- 12.4.5 Segment CAGR and Growth Drivers
- 12.4.6 Subsegment Market Size and Forecast
- 12.4.6.1 Marketing Execution
- 12.4.6.2 Customer Engagement
- 12.4.6.3 Commerce Operations
- 12.4.6.4 Governance and Risk
- 12.4.7 Subsegment Pricing and Adoption Trends
- 12.4.8 Leading Suppliers and Competition
- 12.4.9 Regional Demand and Opportunities
- 12.5 By Enterprise Size - Market Size and Forecast, 2025-2035
- 12.5.1 Segment Definition and Scope
- 12.5.2 Historical Market Size, 2018-2025
- 12.5.3 Revenue Forecast, 2025-2035
- 12.5.4 Base-Year Market Share, 2025
- 12.5.5 Segment CAGR and Growth Drivers
- 12.5.6 Subsegment Market Size and Forecast
- 12.5.6.1 Enterprise Organizations
- 12.5.6.2 Midmarket Organizations
- 12.5.6.3 Small and Microbusinesses
- 12.5.7 Subsegment Pricing and Adoption Trends
- 12.5.8 Leading Suppliers and Competition
- 12.5.9 Regional Demand and Opportunities
- 12.6 By Deployment Model - Market Size and Forecast, 2025-2035
- 12.6.1 Segment Definition and Scope
- 12.6.2 Historical Market Size, 2018-2025
- 12.6.3 Revenue Forecast, 2025-2035
- 12.6.4 Base-Year Market Share, 2025
- 12.6.5 Segment CAGR and Growth Drivers
- 12.6.6 Subsegment Market Size and Forecast
- 12.6.6.1 Public Cloud
- 12.6.6.2 Private and Hybrid Cloud
- 12.6.6.3 On-Premise
- 12.6.6.4 Service-Delivered
- 12.6.7 Subsegment Pricing and Adoption Trends
- 12.6.8 Leading Suppliers and Competition
- 12.6.9 Regional Demand and Opportunities
- 12.7 By Country - Market Size and Forecast, 2025-2035
- 12.7.1 Segment Definition and Scope
- 12.7.2 Historical Market Size, 2018-2025
- 12.7.3 Revenue Forecast, 2025-2035
- 12.7.4 Base-Year Market Share, 2025
- 12.7.5 Segment CAGR and Growth Drivers
- 12.7.6 Subsegment Market Size and Forecast
- 12.7.6.1 China
- 12.7.6.2 Japan and South Korea
- 12.7.6.3 India and Southeast Asia
- 12.7.6.4 Remaining Asia and Oceania
- 12.7.7 Subsegment Pricing and Adoption Trends
- 12.7.8 Leading Suppliers and Competition
- 12.7.9 Regional Demand and Opportunities
- 12.8 Segment Growth Comparison
- 12.9 Segment Attractiveness and Priority Matrix
Chapter 13 Asia Pacific Social Media Management End-Use and Application Market Outlook
- 13.1 End-Use Industry and Customer Demand Structure
- 13.2 Leading Applications and Customer Groups
- 13.3 End-Use Market Size, Share and Forecast
- 13.4 Major End-Use Industry Deep Dives
- 13.4.1 Customer Requirements and Use Cases
- 13.4.2 Demand and Replacement Cycles
- 13.4.3 Technical and Regulatory Considerations
- 13.4.4 Purchasing and Procurement Models
- 13.4.5 Leading Vendors and Distribution Channels
- 13.4.6 Forecast and Commercial Opportunities
- 13.5 Emerging Applications and Cross-Segment Demand
- 13.6 End-Use Industry Investment Priorities
Chapter 14 Asia Pacific Social Media Management Geographic Market Outlook, 2025-2035
- 14.1 Regional Market Size and Country-Level Shares, 2025
- 14.2 Country Market Size Comparison, 2025
- 14.3 Country Market Forecasts, 2025-2035
- 14.4 Subregional Industrial and Demand Clusters
- 14.5 Intra-Regional Pricing and Cost Differences
- 14.6 Cross-Border Trade and Supply Networks
- 14.7 Regional Supply and Demand Balances
- 14.8 Country Opportunity Comparison and Prioritization
Note: Every listed country is covered on the structure shown under the first country.
Chapter 15 Asia Pacific Social Media Management Technology, Innovation and Sustainability Outlook
- 15.1 Technology Landscape and Maturity
- 15.2 Product, Process and Service Innovation
- 15.3 AI, Automation and Digital Tools in the Industry
- 15.4 Technology Adoption and Performance Benchmarking
- 15.5 Innovation Pipeline and R&D Investment
- 15.6 Patent and Intellectual Property Trends
- 15.7 Energy Efficiency and Resource Management
- 15.8 Sustainability, Recycling and Circularity
- 15.9 Technology Roadmap, 2025-2035
- 15.10 Risks of Obsolescence and Technology Substitution
Chapter 16 Asia Pacific Social Media Management Market Key Strategic Imperatives
- 16.1 Growth and Market Entry Priorities
- 16.2 High-Return Products and Segments
- 16.3 Pricing, Profitability and Cost Optimization
- 16.4 Technology Investment and Product Differentiation
- 16.5 Supply Chain Localization and Resilience
- 16.6 Distribution and Customer Acquisition
- 16.7 Partnership, Acquisition and Capacity Strategy
- 16.8 Regional Expansion Priorities
- 16.9 Short-, Medium- and Long-Term Actions
Chapter 17 Competition Outlook
- 17.1 Industry Competition Characteristics
- 17.2 Market Structure and Concentration
- 17.3 Market Share and Competitive Positioning, 2025
- 17.4 Company-Wise Revenue and Product Benchmarking
- 17.5 Production and Service Capacity Benchmarking
- 17.6 Technology, Pricing and Differentiation
- 17.7 Regional Footprint and Distribution Strength
- 17.8 Mergers, Acquisitions and Strategic Alliances
- 17.9 New Entrants and Competitive Threats
- 17.10 Porter's Five Forces and Industry Attractiveness
- 17.11 Competitive Outlook, 2025-2035
Chapter 18 Company Profiles
- 18.1 Company Coverage and Selection Criteria
- 18.2 Hootsuite
- 18.2.1 Business Description
- 18.2.2 Company Ownership and Geographic Presence
- 18.2.3 Product and Service Portfolio
- 18.2.4 Manufacturing and Operating Footprint
- 18.2.5 Financial Performance and Investment
- 18.2.6 Market Share and Competitive Position
- 18.2.7 Technology and Innovation Capabilities
- 18.2.8 Strategic Alliances or Partnerships
- 18.2.9 Recent Developments
- 18.2.10 Growth Strategy and Outlook
- 18.3 Sprinklr
- 18.4 Sprout Social
- 18.5 Meltwater
- 18.6 Zoho Social
- 18.7 Other Relevant Market Participants
Note: Every listed company is profiled on the structure shown under the first company. The company list is preliminary and may change based on research findings, market developments, data availability and client requirements.
Chapter 19 Disclaimer
- 19.1 Research and Forecast Disclaimer
- 19.2 Data Source and Estimation Limitations
Note: The depth of individual sections depends on data availability for this market. Volume, capacity, trade and other unit-based metrics are included where applicable.

