
Microcredentials turn badges into a verified skills record
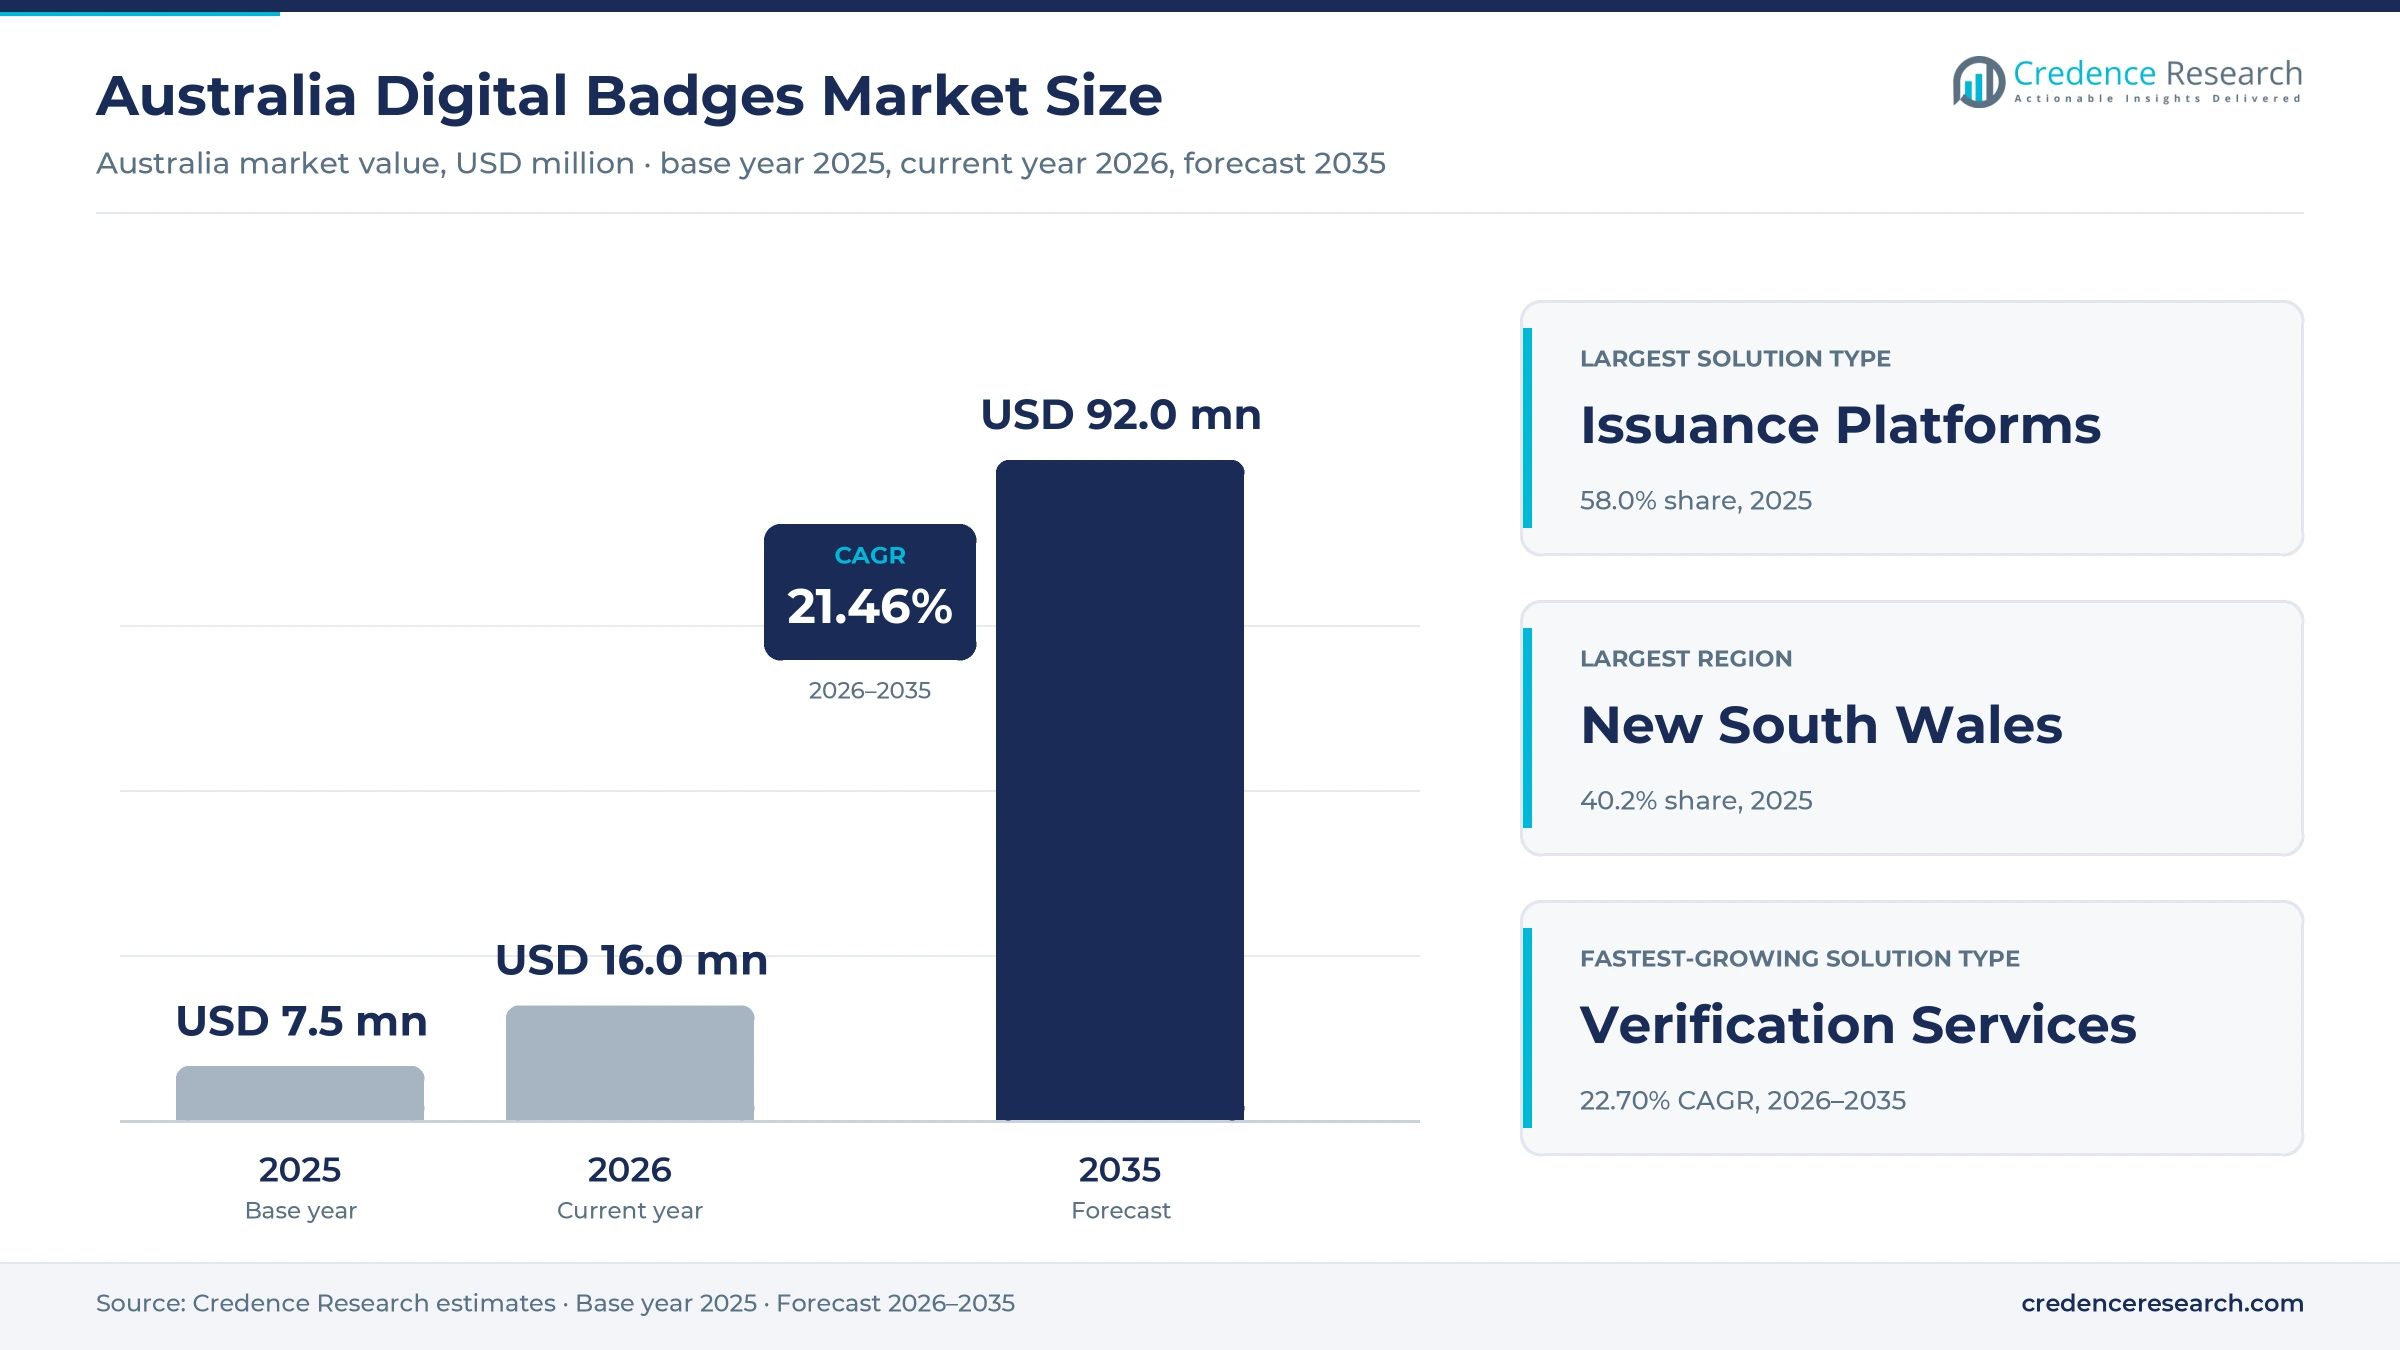
The Australia digital badges market was valued at USD 7.50 million in 2025 and is projected to increase from USD 16.0 million in 2026 to USD 92.0 million by 2035, registering a CAGR of 21.46% during 2026–2035. Demand comes from universities, TAFEs, professional bodies and employers that issue verifiable digital records for short courses, member status and workplace skills, as funded microcredential programs spread across tertiary education. New South Wales held the largest regional share, 40.2% in 2025, because the state hosts the largest group of universities, professional associations and corporate head offices that buy issuance platforms. Queensland is the fastest-growing region at 21.84% a year, as TAFE Queensland and the state's universities scale automated credential awards for short courses. The Open Badges 3.0 standard, released in May 2024 as a verifiable credential format, has also pushed issuers to upgrade platforms so that badges can be checked and carried across systems.
Which badge spending does the estimate count?
The estimate measures what Australian organizations spend on issuing, hosting and verifying digital badges and related digital credentials. It covers platform subscriptions, usage-based issuance fees, verification services and the setup, integration and design projects that connect badge platforms to learning and member systems.
The estimate excludes course tuition, the cost of assessment and paper certificate printing. The value chain runs from standards bodies and badge platform vendors, through integrators and learning platforms that automate awards, to universities, training providers, professional bodies and employers that issue badges to learners, members and staff.
Australia Digital Badges Market Insights
- The Australia digital badges market was valued at USD 7.50 million in 2025 and is projected to reach USD 92.0 million by 2035, registering a CAGR of 21.46% during 2026–2035.
- New South Wales held a 40.2% share of 2025 value, because the state concentrates universities, professional associations and corporate head offices that issue badges.
- Issuance platforms led with a 58.0% share of 2025 value, because subscription platforms carry most issuer spending on design, awarding and hosting.
- Engineers Australia issued the 100 millionth unique credential on the Credly network on Dec. 18, 2024, for its Global Engineering Talent Program.
- Verification services grow fastest at 22.70% a year during 2026–2035, as employers and admissions offices check verifiable credentials instead of paper certificates.
Issuance platforms lead while verification grows fastest
Why do issuance platforms hold the largest share?
Based on solution type, the market is categorized into issuance platforms, verification services and implementation services. Issuance Platforms led with a 58.0% share of 2025 value, because universities, TAFEs and professional bodies pay recurring fees to design, award and host badges at scale. Verification Services grow fastest at 22.70% a year, as employers and admissions offices start to check verifiable credential data during hiring and course entry.
Which issuers spend the most on badges?
Based on customer type, the market is categorized into corporate enterprises, professional and public bodies, higher education providers and VET providers. Corporate Enterprises led with a 34.0% share of 2025 value, because employers badge internal training, vendor skills and compliance programs for large workforces. Corporate Enterprises also grow fastest at 22.24% a year, as firms tie badges to skills records and internal mobility.
How do workforce skills badges lead applications?
Based on application, the market is categorized into workforce skills recognition, professional certification and academic achievement. Workforce Skills Recognition led with a 41.0% share of 2025 value, because employers and training providers award many short skill badges to the same workers each year. Workforce Skills Recognition also grows fastest at 22.23% a year, as stand-alone VET subjects and corporate learning programs keep producing new badge awards.
Why does multi-tenant cloud dominate deployment?
Based on deployment model, the market is categorized into multi-tenant cloud, dedicated cloud and on-premise deployment. Multi-Tenant Cloud led with a 71.0% share of 2025 value, because most issuers buy shared software subscriptions that bundle hosting, verification pages and social sharing. Multi-Tenant Cloud also grows fastest at 21.76% a year, as smaller training providers and associations adopt badging without in-house servers.
| Segment Group | Leading Sub-segment | Share, 2025 | Fastest-growing Sub-segment | CAGR, 2026–2035 |
|---|---|---|---|---|
| By Solution Type | Issuance Platforms | 58.0% | Verification Services | 22.70% |
| By Customer Type | Corporate Enterprises | 34.0% | Corporate Enterprises | 22.24% |
| By Application | Workforce Skills Recognition | 41.0% | Workforce Skills Recognition | 22.23% |
| By Deployment Model | Multi-Tenant Cloud | 71.0% | Multi-Tenant Cloud | 21.76% |
Request a Free Sample
Fill in your details and we'll send you a free sample report.
- Sample data tables & charts
- Research methodology
Funded microcredentials and repeat recognition lift demand
How does funded microcredential procurement lift badge spending?
Government funding has turned microcredentials into a procurement line for universities, and each funded course needs a way to issue and record its outcome. The Commonwealth's A$18.5 million Microcredentials Pilot in Higher Education funds courses in education, health, IT, engineering and sciences, with delivery funding running from 2024 to 2026 for up to 4,000 students. The Minister for Education said Round 2 gave more than A$10.7 million to 25 providers for 48 courses, bringing the pilot to 76 courses. Funded courses must also be listed on the MicroCred Seeker website, which pushes providers toward consistent digital records. As a result, issuance platforms held a 58.0% share of 2025 value.
Why do portable evidence and interoperability raise demand?
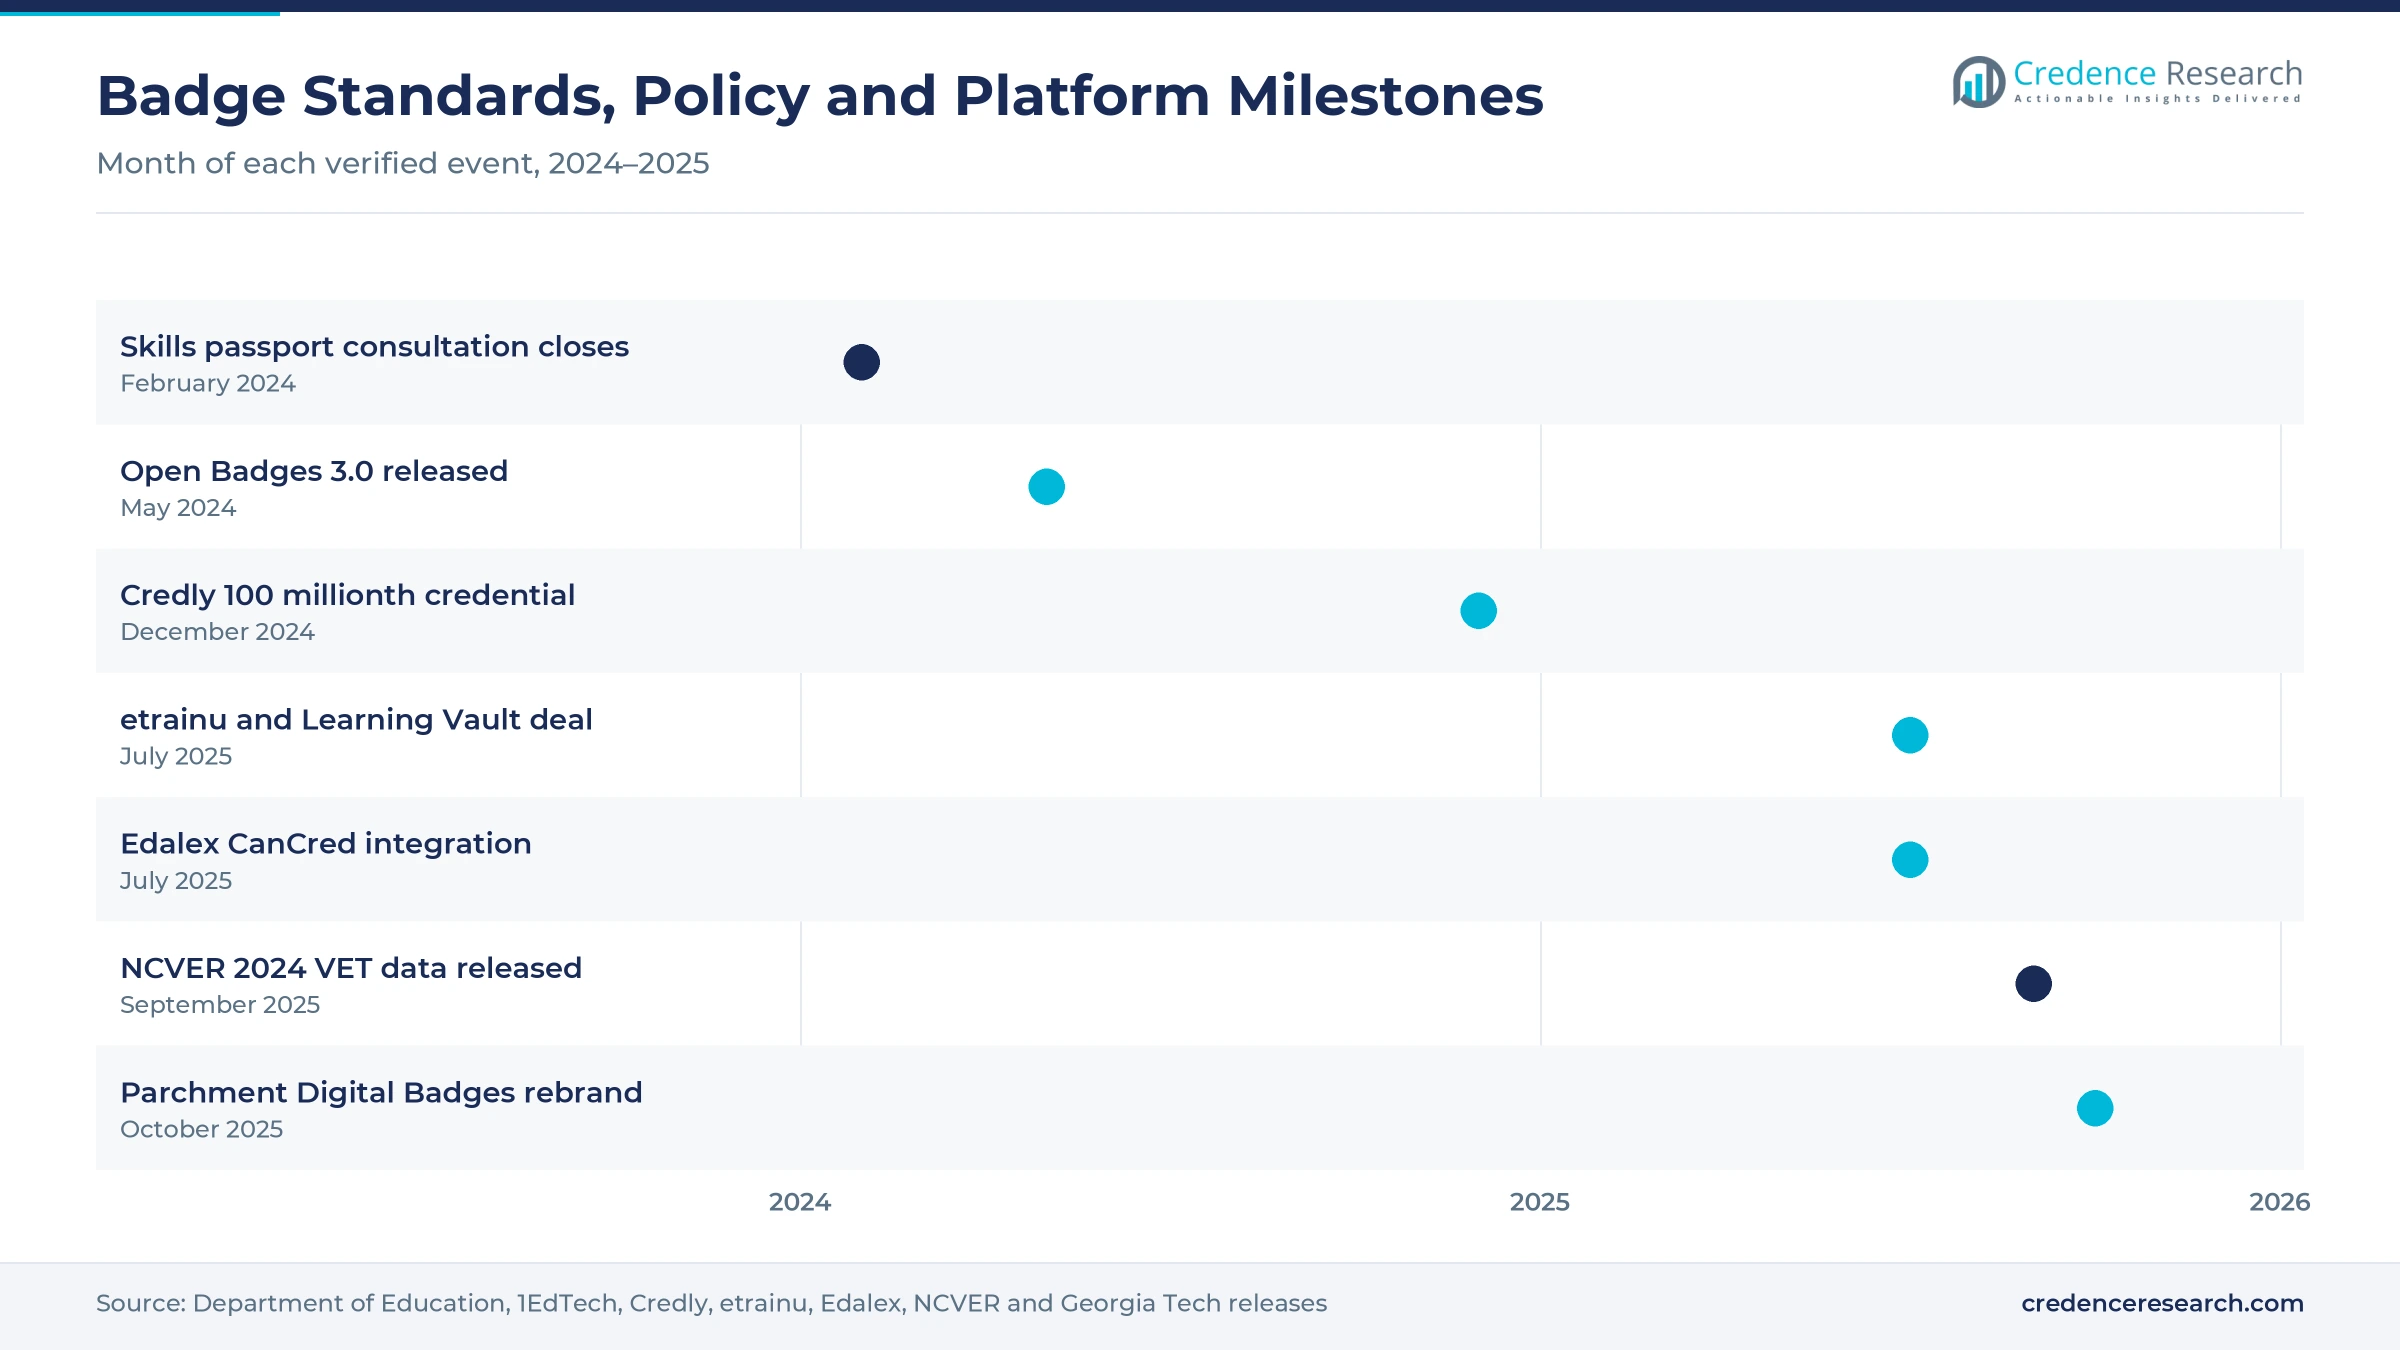
Issuers now want badges that carry evidence and can be checked in any system, which favors platforms that support open standards. The 1EdTech consortium released Open Badges 3.0 on May 29, 2024, as a W3C verifiable credential format that embeds criteria, evidence, issue date and a verifiable recipient reference. The Universities Admissions Centre was named among its early adopters. Learning Vault says it was the first Australian provider to meet W3C and Open Badges 3.0 standards, while Edalex added a CanCred integration in July 2025 that embeds personalized evidence records in badges. In turn, verification services grow fastest at 22.70% a year during 2026–2035.
How does repeat workforce recognition widen the badge base?
Professional bodies and employers issue badges again and again as members renew status and finish new courses, which creates recurring platform volume. Engineers Australia issued the 100 millionth unique credential on the Credly network on Dec. 18, 2024, and the body has more than 130,000 members. Engineers Australia also issues Chartered, EngExec and National Engineering Register badges through Credly, according to a September 2023 notice. CPA Australia awards a Credly badge for each of its five micro-credentials, which run from 4 to 20 hours of study. As a result, workforce skills recognition led with a 41.0% share of 2025 value.
Why do short VET subjects create more badge awards?
Australian learners increasingly take single subjects rather than full qualifications, and each short unit needs a record that employers can read. About 5.1 million students took nationally recognized training in 2024, up 1.8% from 2023, according to NCVER, the national vocational training statistics body. About 3.6 million of them, or 69.9%, took stand-alone subjects, and those enrolments have risen 35.9% since 2019. TAFE Queensland issued more than 36,000 credentials to over 24,500 learners by the end of 2024. In turn, Queensland held a 24.7% share of 2025 value and grows fastest among the regions, because its TAFE awards each completed unit automatically.
Wallets, LMS suites and a skills passport reshape badging
How is the shift to credential wallets changing badge design?
Learners now expect to store badges in phone wallets and job profiles, and issuers are redesigning badges as portable records rather than images. Training provider etrainu partnered with Learning Vault in July 2025, so learners receive verifiable badges in its Skills Passport and can store them in Apple or Google wallets. Etrainu, founded in 2007, has more than 2 million learners, mostly in health and sports, which gives the platform a large base of repeat awards for employer-funded skills training. WorldSkills Australia also runs a badging program with Learning Vault for competition medals, long-service awards and training milestones. As a result, multi-tenant cloud platforms held a 71.0% share of 2025 value.
Why is the rise of LMS-linked badging reshaping buying?
Institutions prefer badges that are awarded automatically inside the learning system they already run, which ties badge purchases to platform contracts. Instructure bought Concentric Sky, the maker of Badgr, in April 2022 and bundled its tools as Canvas Credentials. Canvas Credentials became Parchment Digital Badges on Oct. 31, 2025, as part of Instructure's Parchment Award suite. TAFE Queensland uses Canvas Credentials as its badging agent, with Edalex's Credentialate linking it to D2L Brightspace, and more than 65,000 learners are enrolled in its micro-credentials. In turn, buyers increasingly choose badge tools in the same contract cycle as their learning management systems.
Can a national skills passport open a new growth lane?
A federal skills record would give employers one place to check qualifications, and badge platforms could supply much of the verified data behind it. The Commonwealth committed A$9.1 million for a business case and consultation on a National Skills Passport, according to a joint release from the Treasurer, the Education Minister and the Skills Minister. The passport could combine VET and higher education qualifications in one digital record for workers. Consultation opened in September 2023 and closed on Feb. 18, 2024, with learners, unions, employers and governments taking part. As a result, issuers that already hold standards-based records could feed a national passport, which widens demand for credential management software.
Is stacking short credentials into degrees a growth opening?
Universities that let short credentials count toward degrees give learners a reason to collect and share badges over many years. Deakin University's Professional Practice credentials use five levels from Foundation to Expert that are aligned with the Australian Qualifications Framework. OpenLearning's OpenCreds framework covers stackable courses of 2.5 to 150 hours that can lead to credit in a formal qualification, which gives learners a path from one badge to the next. OpenLearning had 2.73 million registered learners and courses from 167 education providers when it integrated Accredible credentials in April 2021. In turn, higher education providers can sell badged online professional upskilling to employers.
Employer trust, platform sprawl and budgets slow adoption
How does uneven employer trust slow badge adoption?
Many employers still read a degree or license more easily than a badge, which limits the hiring value of short credentials. As a result, learners may not claim or share badges when they see little career benefit, and issuers then question platform renewals. Professional bodies respond by tying badges to registration status, assessment and qualification levels. CPA Australia, for example, assesses each of its micro-credentials with a webcam-monitored online exam that corresponds to an Australian Qualifications Framework level.
Why does platform sprawl create friction for learners?
Universities, TAFEs, associations and employers often use different badge platforms, so one worker can hold credentials in several separate accounts. In turn, learners find it hard to present a single record, and employers must open several verification pages to check one applicant. Vendors respond with Open Badges exports, wallet storage and integrations between platforms. The Australian Trade Union Institute, for example, tells learners that badges from other platforms cannot currently be imported into Credly.
How do tight tertiary budgets limit platform spending?
Universities and TAFEs face cost pressure, and badge platforms compete with core teaching and student systems for limited technology budgets. As a result, many institutions start with small pilots that cover a few short courses rather than full programs. Vendors respond with usage-based pricing that charges per enrolment or per credential issued. The Department of Education set aside A$16.5 million of its pilot budget for delivery from 2023-24 to 2025-26, so institutions must show that badged courses attract paying learners once that funding ends.
Why do privacy and data controls add buying hurdles?
Badges hold names, assessment evidence and skills data, so issuers must check where platforms host records and who can view them. In turn, procurement takes longer for universities and public bodies that apply strict security and privacy reviews to cloud vendors. Vendors respond with privacy settings that let earners control what is public, plus dedicated cloud options for larger issuers. These reviews add cost and delay for smaller vendors that lack local hosting and security certifications.
New South Wales leads and Queensland grows fastest
| Region | Value, 2025 (USD million) | Share, 2025 | CAGR, 2026–2035 |
|---|---|---|---|
| New South Wales | 3.0 | 40.2% | 21.34% |
| Victoria | 2.2 | 29.9% | 21.24% |
| Queensland | 1.9 | 24.7% | 21.84% |
| Remaining States and Territories | 0.4 | 5.2% | 21.74% |
Why does the largest state lead badge spending?
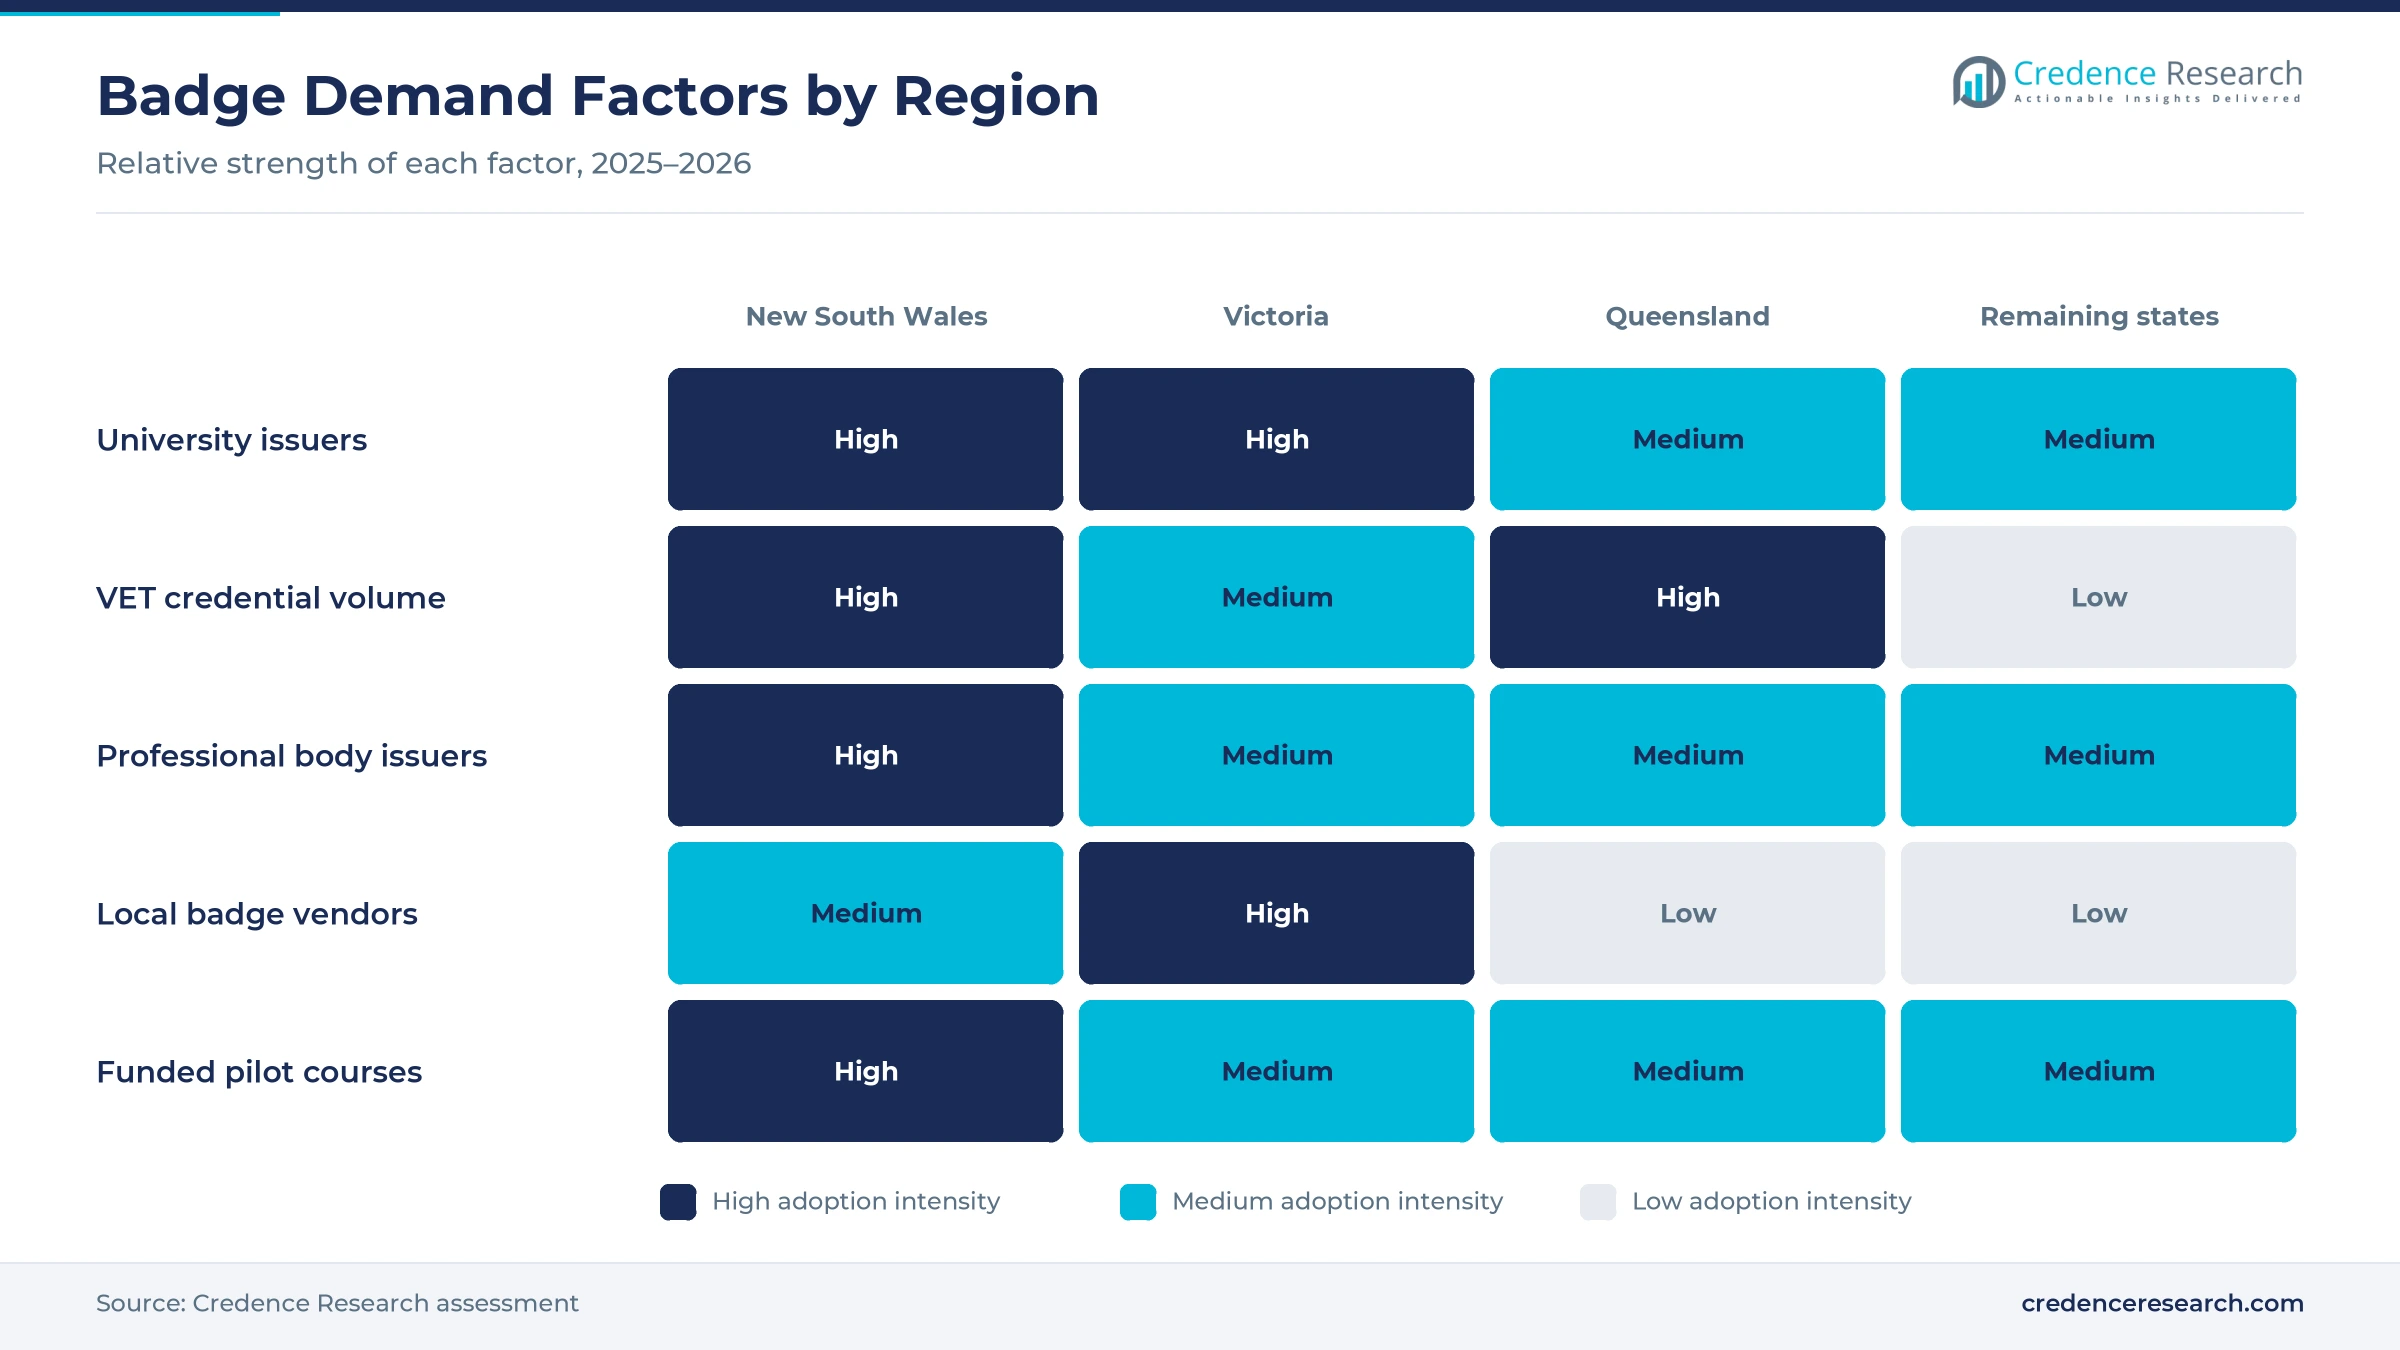
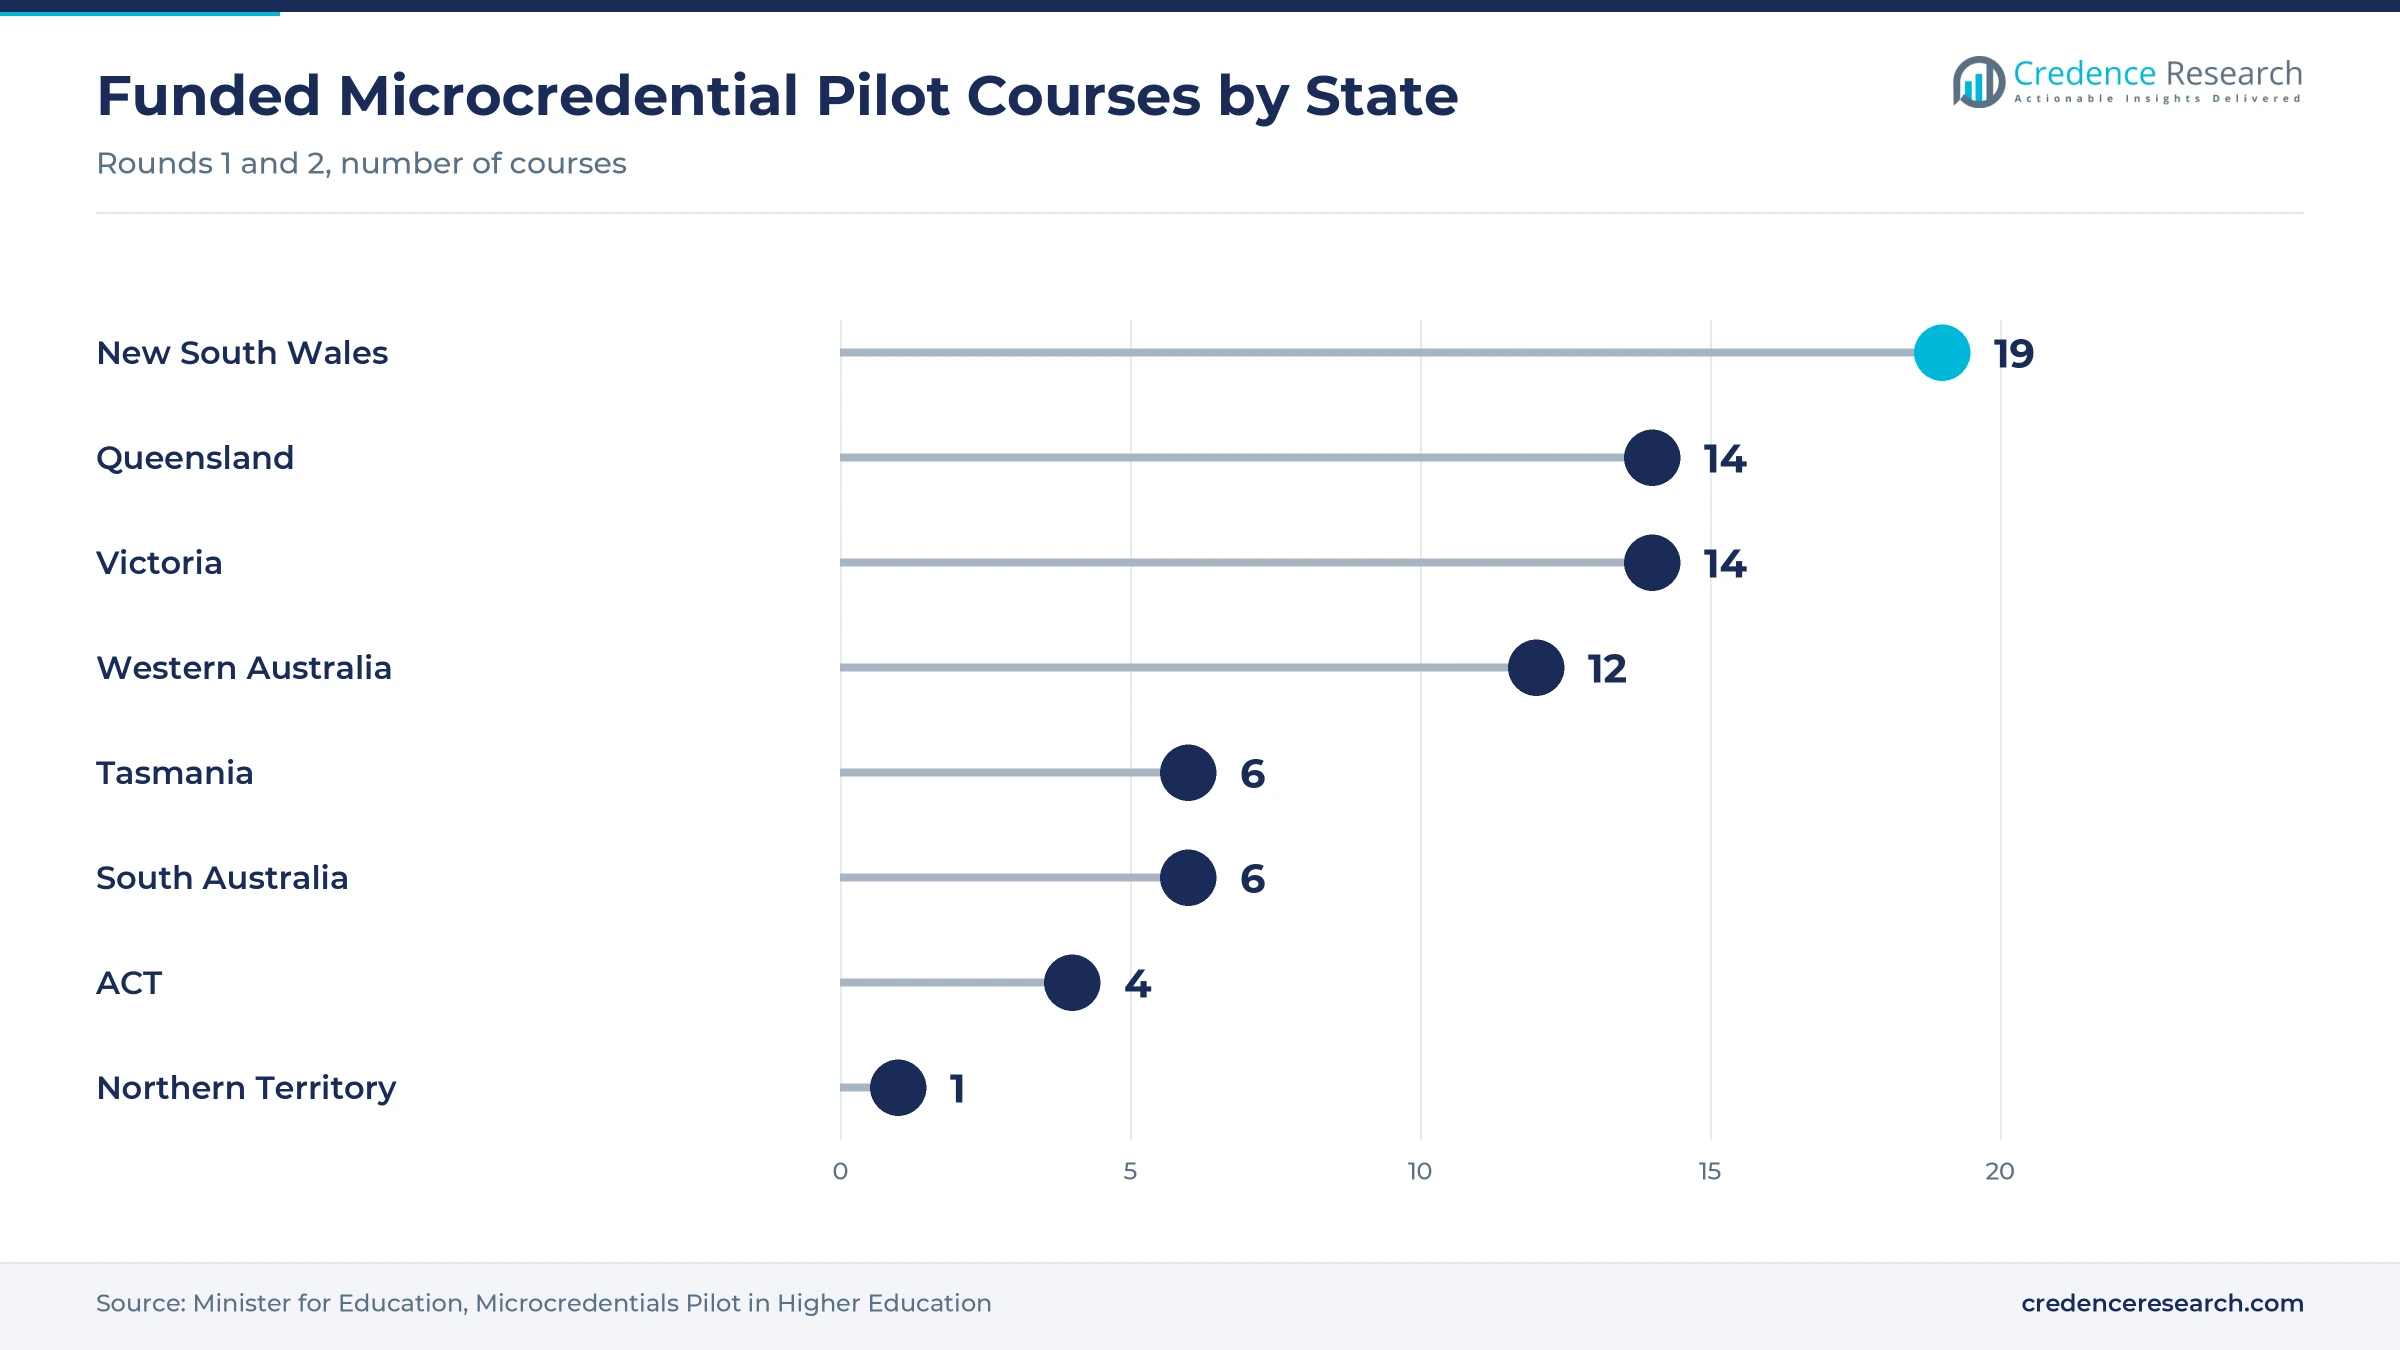
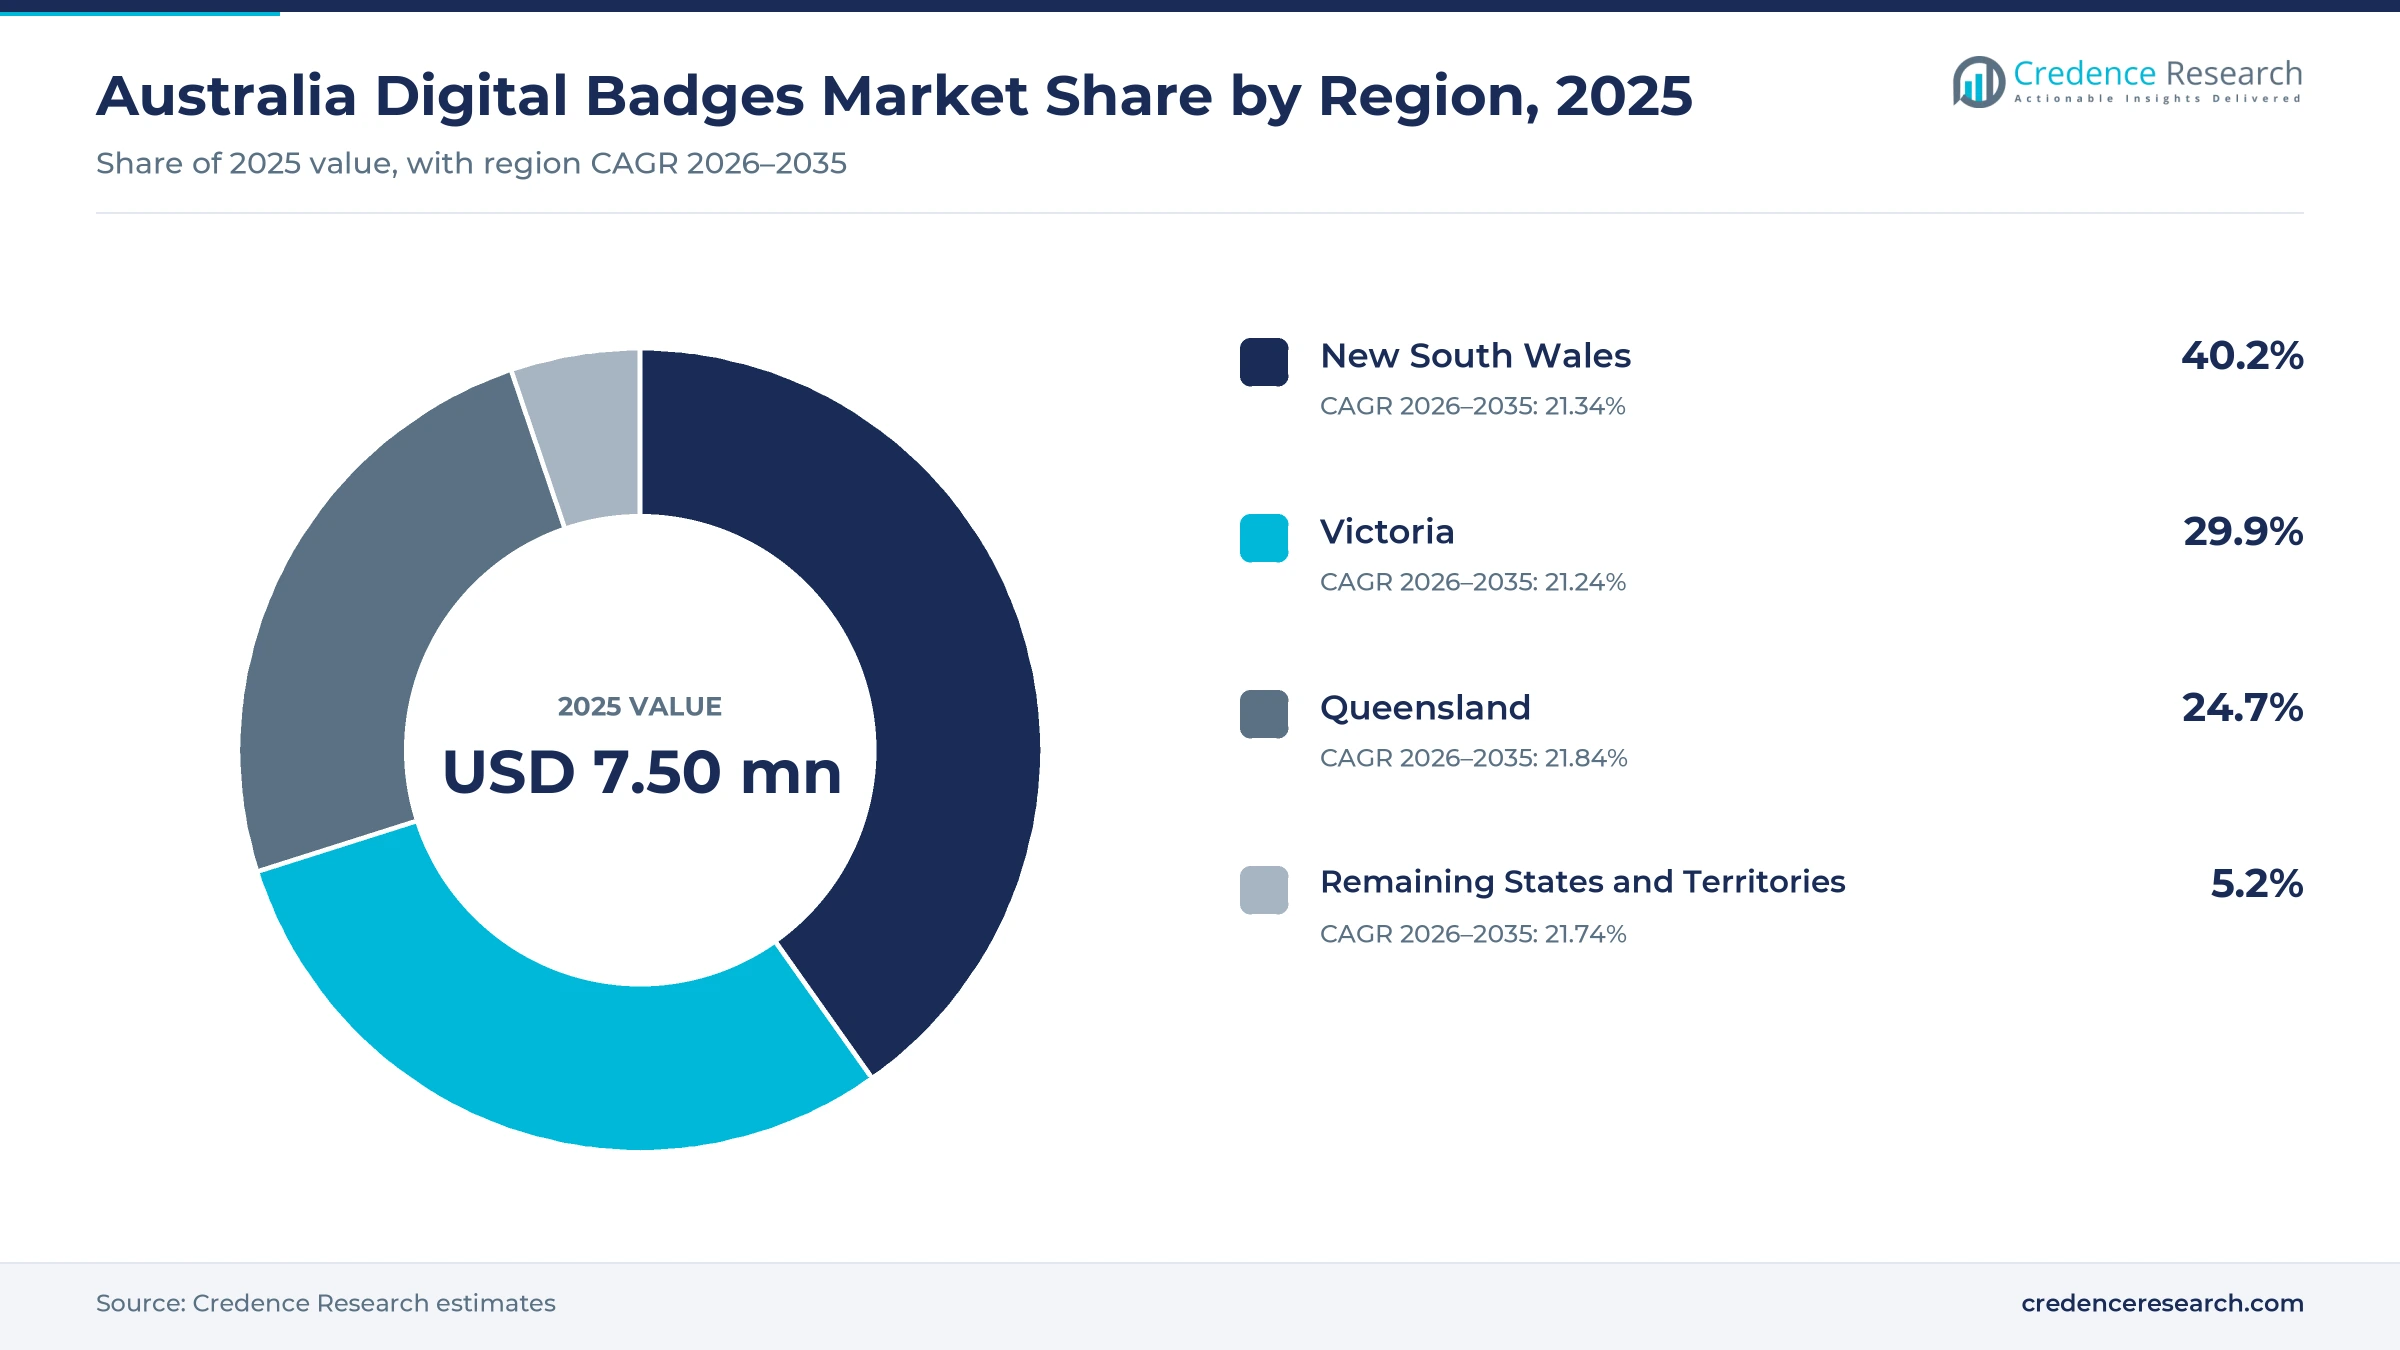
New South Wales held a 40.2% share of 2025 value and grows at 21.34% a year, because the state has the largest base of universities, associations and corporate head offices. New South Wales providers won 19 of the 76 courses funded under the federal microcredentials pilot, the most of any state. The University of Newcastle was among the first institutions to issue badges through the My eQuals platform. As a result, the state leads platform subscriptions for both academic and workforce badges.
How do Melbourne universities and vendors support demand?
Victoria held a 29.9% share of 2025 value and grows at 21.24% a year, because Melbourne hosts large universities and several local credential vendors. Victorian providers won 14 of the 76 pilot courses, while Monash University and Federation University issue badges through My eQuals. Deakin University runs Professional Practice credentials aligned with the qualifications framework, and Edalex announced its CanCred integration from Melbourne in July 2025. In turn, the state combines steady academic issuance with vendor and integration spending.
Why does Queensland lead growth in badge issuance?
Queensland held a 24.7% share of 2025 value and grows fastest at 21.84% a year, because TAFE Queensland runs a large automated micro-credential program across the state. The provider issued more than 36,000 credentials to over 24,500 learners by the end of 2024. Queensland providers also won 14 of the 76 pilot courses, and the University of Queensland, the University of Southern Queensland and the University of the Sunshine Coast issue badges through My eQuals. As a result, VET and university award volumes lift growth across the state.
How do the remaining states and territories add demand?
The remaining states and territories held a 5.2% share of 2025 value and grow at 21.74% a year, from a small base of issuers. Providers in Western Australia won 12 pilot courses, Tasmania and South Australia six each, the ACT four and the Northern Territory one. About 96.1% of Australians used the internet in 2024, according to the World Bank, which supports online badge delivery in remote areas. In turn, Canberra issuers such as the Australian National University add steady demand.
Standards, partnerships and rebrands since 2024
| Development | Status and market relevance |
|---|---|
| In May 2024, 1EdTech released Open Badges 3.0 as a W3C verifiable credential standard, naming the Universities Admissions Centre among early adopters. | Sets the format for portable badges |
| In December 2024, Engineers Australia issued the 100 millionth unique credential on the Credly network for its Global Engineering Talent Program. | Shows professional body badge scale |
| In July 2025, etrainu and Learning Vault partnered to deliver verifiable badges that learners can store in Apple or Google wallets. | Extends badges into workforce training |
| In July 2025, Edalex integrated Credentialate with Learning Agents' CanCred Factory to embed evidence records in Open Badges. | Adds evidence to issued credentials |
| In October 2025, Instructure renamed Canvas Credentials as Parchment Digital Badges within its Parchment Award suite. | Ties badging to credential suites |
Open standards and evidence records shape badge value
- Open Badges 3.0 packages each badge as a W3C verifiable credential with criteria, evidence and issue date, which lets any compliant system check it.
- Verification pages and metadata give employers a unique link that confirms who issued a badge and what assessment stands behind it.
- LMS integrations award badges automatically when learners finish units in Canvas, D2L Brightspace or Moodle, which cuts manual issuing work.
- Evidence records such as those built by Edalex's Credentialate attach samples of learner work to each badge, which raises its hiring value.
Need a Custom Version of This Report?
Tailor the scope, geography, or segments to your exact requirements.
- Custom geography or segment scope
- Direct access to our analyst team
Global badge platforms compete with local specialists
Competition combines global badge networks, learning platform owners and Australian credential specialists. Credly serves professional bodies such as Engineers Australia and CPA Australia, which issue member status and micro-credential badges on its network. Instructure supplies Canvas Credentials, now Parchment Digital Badges, which TAFE Queensland uses as its badging agent. Accredible issues credentials for ASFA Learning and is integrated into the OpenLearning platform. OpenLearning runs the OpenCreds framework and hosts microcredential courses for Australian providers, including a platform agreement with DeakinCo. Learning Vault serves WorldSkills Australia and etrainu, while Edalex links learning systems to badge platforms through Credentialate. Rivals compete on standards support, integrations, verification depth, analytics and pricing models that suit institutions of different sizes.
Which badge platforms serve Australian issuers?
| Company | Type | Role in the market |
|---|---|---|
| Credly | Global badge network | Badges for Engineers Australia and CPA Australia members |
| Instructure | Learning platform owner | Canvas Credentials badging agent for TAFE Queensland |
| Accredible | Credential platform | Credentials for ASFA Learning and OpenLearning courses |
| OpenLearning | Learning platform | OpenCreds framework and microcredential hosting |
| DeakinCo | University workforce arm | Workforce capability courses on OpenLearning |
| Learning Vault | Australian badge platform | Badges for WorldSkills Australia and etrainu learners |
| Edalex | Credential integrator | Credentialate evidence records for TAFE Queensland |
Credence Research view on Australian badge adoption
Credence Research's view is that Australian badge spending will shift from one-off pilots to recurring workforce records, because employers, professional bodies and VET providers award new badges every year. Issuance platforms keep the largest share, yet verification services gain the fastest growth as hiring teams check credential data directly. Open Badges 3.0 and a possible National Skills Passport should reward vendors that support open standards and evidence records. Platforms that integrate with learning systems and price by usage should gain the most issuers by 2035.
Education data, issuer releases and standards behind model
The report uses 2025 as the base year on a calendar basis, and market values come from the Credence Research model. That model draws on Department of Education program data, NCVER enrolment statistics, World Bank internet use data, issuer and vendor releases, and standards body publications. Segment splits and zone growth rates are Credence Research estimates, while zone shares follow the client's regional split. Sources used are government publications, statistics agency releases, company and association pages and international agency data, and no interviews or surveys were used.
Skills records and workforce badges carry growth to 2035
The Australia digital badges market is expected to reach USD 92.0 million by 2035, a 21.46% CAGR during 2026–2035, as issuers replace paper and PDF certificates with verifiable records for courses, member status and workplace skills. Growth should be strongest in verification services, corporate enterprises, workforce skills recognition and Queensland, because these areas gain most from repeat awards and automated issuance. Uneven employer trust and platform sprawl could slow some programs, while a national skills record could lift demand after 2030.
Frequently Asked Questions
How big is the Australia digital badges market?
Which solution type leads Australian badge spending?
Which region leads the market?
How does the federal microcredentials pilot affect badge demand?
How many Australians take stand-alone VET subjects?
What is Open Badges 3.0?
Who are the leading companies in the market?
What are the main challenges for badge platforms?
Table of Content
Chapter 1 Market Segmentation
- 1.1 Segmentation Framework
- 1.1.1 Product and Service Classification
- 1.1.2 Application and End-Use Classification
- 1.1.3 Technology and Solution Classification
- 1.1.4 Customer and Distribution Channel Classification
- 1.1.5 Geographic Segmentation
- 1.1.6 Market Segment Definitions and Boundaries
- 1.2 By Solution Type
- 1.2.1 Issuance Platforms
- 1.2.2 Verification Services
- 1.2.3 Implementation Services
- 1.3 By Customer Type
- 1.3.1 Corporate Enterprises
- 1.3.2 Professional and Public Bodies
- 1.3.3 Higher Education Providers
- 1.3.4 VET Providers
- 1.4 By Application
- 1.4.1 Workforce Skills Recognition
- 1.4.2 Professional Certification
- 1.4.3 Academic Achievement
- 1.5 By Deployment Model
- 1.5.1 Multi-Tenant Cloud
- 1.5.2 Dedicated Cloud
- 1.5.3 On-Premise Deployment
Chapter 2 Introduction
- 2.1 Report Objectives and Scope
- 2.2 Product Definition and Industry Terminology
- 2.3 Market Inclusions and Exclusions
- 2.4 Research Process
- 2.4.1 Primary Research and Expert Interviews
- 2.4.2 Secondary Research and Source Review
- 2.4.3 Top-Down and Bottom-Up Estimation
- 2.4.4 Data Triangulation and Verification
- 2.5 Market Size Measurement Basis
- 2.5.1 2025: USD 7.50 million → 2035: USD 92.0 million
- 2.6 Historical and Forecast Reference Periods
- 2.6.1 Historical Period: 2018-2025
- 2.6.2 Base Year: 2025
- 2.6.3 Forecast Period: 2025-2035
- 2.7 Research Assumptions and Limitations
Chapter 3 Executive Summary
- 3.1 Market Snapshot and Key Findings
- 3.2 Base-Year Market Size, 2025
- 3.3 Forecast Market Size, 2035
- 3.4 Revenue and Volume Growth Outlook
- 3.5 Key Demand and Supply Indicators
- 3.6 Leading Market Segments
- 3.7 Fastest-Growing Market Opportunities
- 3.8 Regional Performance Highlights
- 3.9 Technology and Industry Transformation
- 3.10 Competitive Landscape Summary
- 3.11 Analyst View and Strategic Implications
Chapter 4 Australia Digital Badges Market Trends and Developments
- 4.1 Historical Industry Development, 2018-2025
- 4.2 Recent Market Trends and Developments
- 4.3 Demand and Customer Behavior Trends
- 4.4 Technology and Product Innovation
- 4.5 Artificial Intelligence, Automation and Digitalization
- 4.6 Local Manufacturing and Supply Chain Realignment
- 4.7 Industry Partnerships, Mergers and Acquisitions
- 4.8 Sustainability and Circular Economy Developments
- 4.9 Government and Private Sector Investment Trends
- 4.10 Emerging Business Models and Commercialization
- 4.11 Industry Developments and Announcements
Chapter 5 Australia Digital Badges Market Supply and Demand Analysis
- 5.1 Demand Trend and Consumption Analysis, 2018-2025
- 5.2 Demand Forecast, 2025-2035
- 5.3 Supply Chain Structure and Procurement Trends
- 5.4 Supply-Demand Gap and Bottlenecks
- 5.5 Import Dependence and Sourcing Structure
- 5.6 Regional Supply and Demand Concentration
Chapter 6 Australia Digital Badges Market Pricing Analysis
- 6.1 Pricing Structure and Measurement
- 6.2 Historical Pricing Trends, 2018-2025
- 6.3 Pricing Outlook, 2025-2035
- 6.4 Pricing by Product and Market Segment
- 6.5 Geographic Pricing Differences
- 6.6 Key Input, Energy, Labor and Logistics Costs
- 6.7 Contract Pricing and Purchasing Models
- 6.8 Pricing Sensitivity and Competitive Positioning
- 6.9 Price, Margin and Profitability Implications
Chapter 7 Australia Digital Badges Market Dynamics
- 7.1 Market Growth Drivers
- 7.1.1 Demand-Side Drivers
- 7.1.2 Technology and Innovation Drivers
- 7.1.3 Infrastructure and Investment Drivers
- 7.1.4 Regulatory and Policy Drivers
- 7.2 Market Restraints
- 7.2.1 Cost and Affordability Constraints
- 7.2.2 Technology and Adoption Barriers
- 7.2.3 Supply Chain and Operational Constraints
- 7.3 Market Challenges
- 7.3.1 Competitive Pressure and Margin Erosion
- 7.3.2 Skills, Infrastructure and Implementation Gaps
- 7.4 Emerging Market Opportunities
- 7.5 Market Dynamics Impact and Time-Horizon Assessment
Chapter 8 Australia Digital Badges Value Chain Analysis
- 8.1 Industry Value Chain Overview
- 8.2 Upstream Suppliers and Critical Inputs
- 8.3 Technology and Component Providers
- 8.4 Manufacturing or Service Delivery
- 8.5 Distribution, Channel Partners and Integrators
- 8.6 Downstream Applications and End Users
- 8.7 Value Addition and Profit Pools
- 8.8 Vertical Integration and Outsourcing
- 8.9 Supplier Concentration and Risk
- 8.10 Supply Chain Localization and Resilience
Chapter 9 Australia Digital Badges Market Regulations and Policies
- 9.1 Relevant Laws, Standards and Compliance Frameworks
- 9.2 Product, Service, Safety and Quality Requirements
- 9.3 Government Policies, Incentives and Subsidies
- 9.4 Imports, Exports and Trade Barriers
- 9.5 Public Procurement and Local Content Requirements
- 9.6 Data Protection, AI and Cybersecurity Compliance
- 9.7 Upcoming Policy Changes and Market Implications
Chapter 10 Australia Digital Badges Market Hotspots and Opportunities
- 10.1 Market Opportunity Mapping and Growth Hotspots
- 10.2 High-Growth Applications and Customer Groups
- 10.3 Underserved Markets and White-Space Opportunities
- 10.4 Emerging Technology and Product Opportunities
- 10.5 New Capacity and Investment Hotspots
- 10.6 Market Entry and Expansion Opportunities
- 10.7 Distribution and Partnership Opportunities
- 10.8 Near-Term and Long-Term Commercial Potential
- 10.9 Opportunity Attractiveness and Execution Risks
Chapter 11 Australia Digital Badges Market Outlook, 2025-2035
- 11.1 Market Size and Analysis
- 11.1.1 Revenue (Market Measurement: 2025: USD 7.50 million → 2035: USD 92.0 million)
- 11.1.2 Historical Market Size, 2018-2025
- 11.1.3 Base-Year Market Size, 2025
- 11.2 Market Forecast, 2025-2035
- 11.2.1 Revenue Forecast to 2035
- 11.2.2 CAGR and Year-on-Year Growth
- 11.2.3 Incremental Revenue Opportunity
- 11.3 Forecast Assumptions and Scenario Analysis
- 11.3.1 Base-Case Forecast
- 11.3.2 Optimistic and Conservative Scenarios
- 11.3.3 Technology, Pricing and Policy Sensitivities
- 11.4 Market Attractiveness and Growth Outlook
Chapter 12 Australia Digital Badges Market Segmentation and Outlook
- 12.1 Segmentation Summary and Market Shares, 2025
- 12.2 Largest and Fastest-Growing Segments
- 12.3 By Solution Type - Market Size and Forecast, 2025-2035
- 12.3.1 Segment Definition and Scope
- 12.3.2 Historical Market Size, 2018-2025
- 12.3.3 Revenue Forecast, 2025-2035
- 12.3.4 Base-Year Market Share, 2025
- 12.3.5 Segment CAGR and Growth Drivers
- 12.3.6 Subsegment Market Size and Forecast
- 12.3.6.1 Issuance Platforms
- 12.3.6.2 Verification Services
- 12.3.6.3 Implementation Services
- 12.3.7 Subsegment Pricing and Adoption Trends
- 12.3.8 Leading Suppliers and Competition
- 12.3.9 Regional Demand and Opportunities
- 12.4 By Customer Type - Market Size and Forecast, 2025-2035
- 12.4.1 Segment Definition and Scope
- 12.4.2 Historical Market Size, 2018-2025
- 12.4.3 Revenue Forecast, 2025-2035
- 12.4.4 Base-Year Market Share, 2025
- 12.4.5 Segment CAGR and Growth Drivers
- 12.4.6 Subsegment Market Size and Forecast
- 12.4.6.1 Corporate Enterprises
- 12.4.6.2 Professional and Public Bodies
- 12.4.6.3 Higher Education Providers
- 12.4.6.4 VET Providers
- 12.4.7 Subsegment Pricing and Adoption Trends
- 12.4.8 Leading Suppliers and Competition
- 12.4.9 Regional Demand and Opportunities
- 12.5 By Application - Market Size and Forecast, 2025-2035
- 12.5.1 Segment Definition and Scope
- 12.5.2 Historical Market Size, 2018-2025
- 12.5.3 Revenue Forecast, 2025-2035
- 12.5.4 Base-Year Market Share, 2025
- 12.5.5 Segment CAGR and Growth Drivers
- 12.5.6 Subsegment Market Size and Forecast
- 12.5.6.1 Workforce Skills Recognition
- 12.5.6.2 Professional Certification
- 12.5.6.3 Academic Achievement
- 12.5.7 Subsegment Pricing and Adoption Trends
- 12.5.8 Leading Suppliers and Competition
- 12.5.9 Regional Demand and Opportunities
- 12.6 By Deployment Model - Market Size and Forecast, 2025-2035
- 12.6.1 Segment Definition and Scope
- 12.6.2 Historical Market Size, 2018-2025
- 12.6.3 Revenue Forecast, 2025-2035
- 12.6.4 Base-Year Market Share, 2025
- 12.6.5 Segment CAGR and Growth Drivers
- 12.6.6 Subsegment Market Size and Forecast
- 12.6.6.1 Multi-Tenant Cloud
- 12.6.6.2 Dedicated Cloud
- 12.6.6.3 On-Premise Deployment
- 12.6.7 Subsegment Pricing and Adoption Trends
- 12.6.8 Leading Suppliers and Competition
- 12.6.9 Regional Demand and Opportunities
- 12.7 Segment Growth Comparison
- 12.8 Segment Attractiveness and Priority Matrix
Chapter 13 Australia Digital Badges End-Use and Application Market Outlook
- 13.1 End-Use Industry and Customer Demand Structure
- 13.2 Leading Applications and Customer Groups
- 13.3 End-Use Market Size, Share and Forecast
- 13.4 Major End-Use Industry Deep Dives
- 13.4.1 Customer Requirements and Use Cases
- 13.4.2 Demand and Replacement Cycles
- 13.4.3 Technical and Regulatory Considerations
- 13.4.4 Purchasing and Procurement Models
- 13.4.5 Leading Vendors and Distribution Channels
- 13.4.6 Forecast and Commercial Opportunities
- 13.5 Emerging Applications and Cross-Segment Demand
- 13.6 End-Use Industry Investment Priorities
Chapter 14 Australia Digital Badges Geographic Market Outlook, 2025-2035
- 14.1 Domestic Market Distribution and Demand Clusters
- 14.2 State- or Province-Wise Market Size and Forecast, 2025-2035
- 14.3 City and Metropolitan Market Outlook
- 14.4 Industrial, Manufacturing and Commercial Clusters
- 14.5 Geographic Concentration of Key End Users
- 14.6 Local Pricing and Purchasing Differences
- 14.7 Domestic Production Facilities and Capacity Map
- 14.8 Local Infrastructure and Project Pipeline
- 14.9 State-Level Policy and Incentive Differences
- 14.10 Subnational Investment Hotspots and Opportunities
- 14.11 Distribution and Logistics Networks
- 14.12 Domestic Competitive Footprint
Chapter 15 Australia Digital Badges Technology, Innovation and Sustainability Outlook
- 15.1 Technology Landscape and Maturity
- 15.2 Product, Process and Service Innovation
- 15.3 AI, Automation and Digital Tools in the Industry
- 15.4 Technology Adoption and Performance Benchmarking
- 15.5 Innovation Pipeline and R&D Investment
- 15.6 Patent and Intellectual Property Trends
- 15.7 Energy Efficiency and Resource Management
- 15.8 Sustainability, Recycling and Circularity
- 15.9 Technology Roadmap, 2025-2035
- 15.10 Risks of Obsolescence and Technology Substitution
Chapter 16 Australia Digital Badges Market Key Strategic Imperatives
- 16.1 Growth and Market Entry Priorities
- 16.2 High-Return Products and Segments
- 16.3 Pricing, Profitability and Cost Optimization
- 16.4 Technology Investment and Product Differentiation
- 16.5 Supply Chain Localization and Resilience
- 16.6 Distribution and Customer Acquisition
- 16.7 Partnership, Acquisition and Capacity Strategy
- 16.8 Regional Expansion Priorities
- 16.9 Short-, Medium- and Long-Term Actions
Chapter 17 Competition Outlook
- 17.1 Industry Competition Characteristics
- 17.2 Market Structure and Concentration
- 17.3 Market Share and Competitive Positioning, 2025
- 17.4 Company-Wise Revenue and Product Benchmarking
- 17.5 Production and Service Capacity Benchmarking
- 17.6 Technology, Pricing and Differentiation
- 17.7 Regional Footprint and Distribution Strength
- 17.8 Mergers, Acquisitions and Strategic Alliances
- 17.9 New Entrants and Competitive Threats
- 17.10 Porter's Five Forces and Industry Attractiveness
- 17.11 Competitive Outlook, 2025-2035
Chapter 18 Company Profiles
- 18.1 Company Coverage and Selection Criteria
- 18.2 Credly
- 18.2.1 Business Description
- 18.2.2 Company Ownership and Geographic Presence
- 18.2.3 Product and Service Portfolio
- 18.2.4 Manufacturing and Operating Footprint
- 18.2.5 Financial Performance and Investment
- 18.2.6 Market Share and Competitive Position
- 18.2.7 Technology and Innovation Capabilities
- 18.2.8 Strategic Alliances or Partnerships
- 18.2.9 Recent Developments
- 18.2.10 Growth Strategy and Outlook
- 18.3 Instructure
- 18.4 Accredible
- 18.5 DeakinCo
- 18.6 OpenLearning
- 18.7 Learning Vault
- 18.8 Skillsoft
- 18.9 Certifier
- 18.10 Edalex
- 18.11 VO
- 18.12 Other Relevant Market Participants
Note: Every listed company is profiled on the structure shown under the first company. The company list is preliminary and may change based on research findings, market developments, data availability and client requirements.
Chapter 19 Disclaimer
- 19.1 Research and Forecast Disclaimer
- 19.2 Data Source and Estimation Limitations
Note: The depth of individual sections depends on data availability for this market. Volume, capacity, trade and other unit-based metrics are included where applicable.

