
Data center links and new intercity routes drive leasing
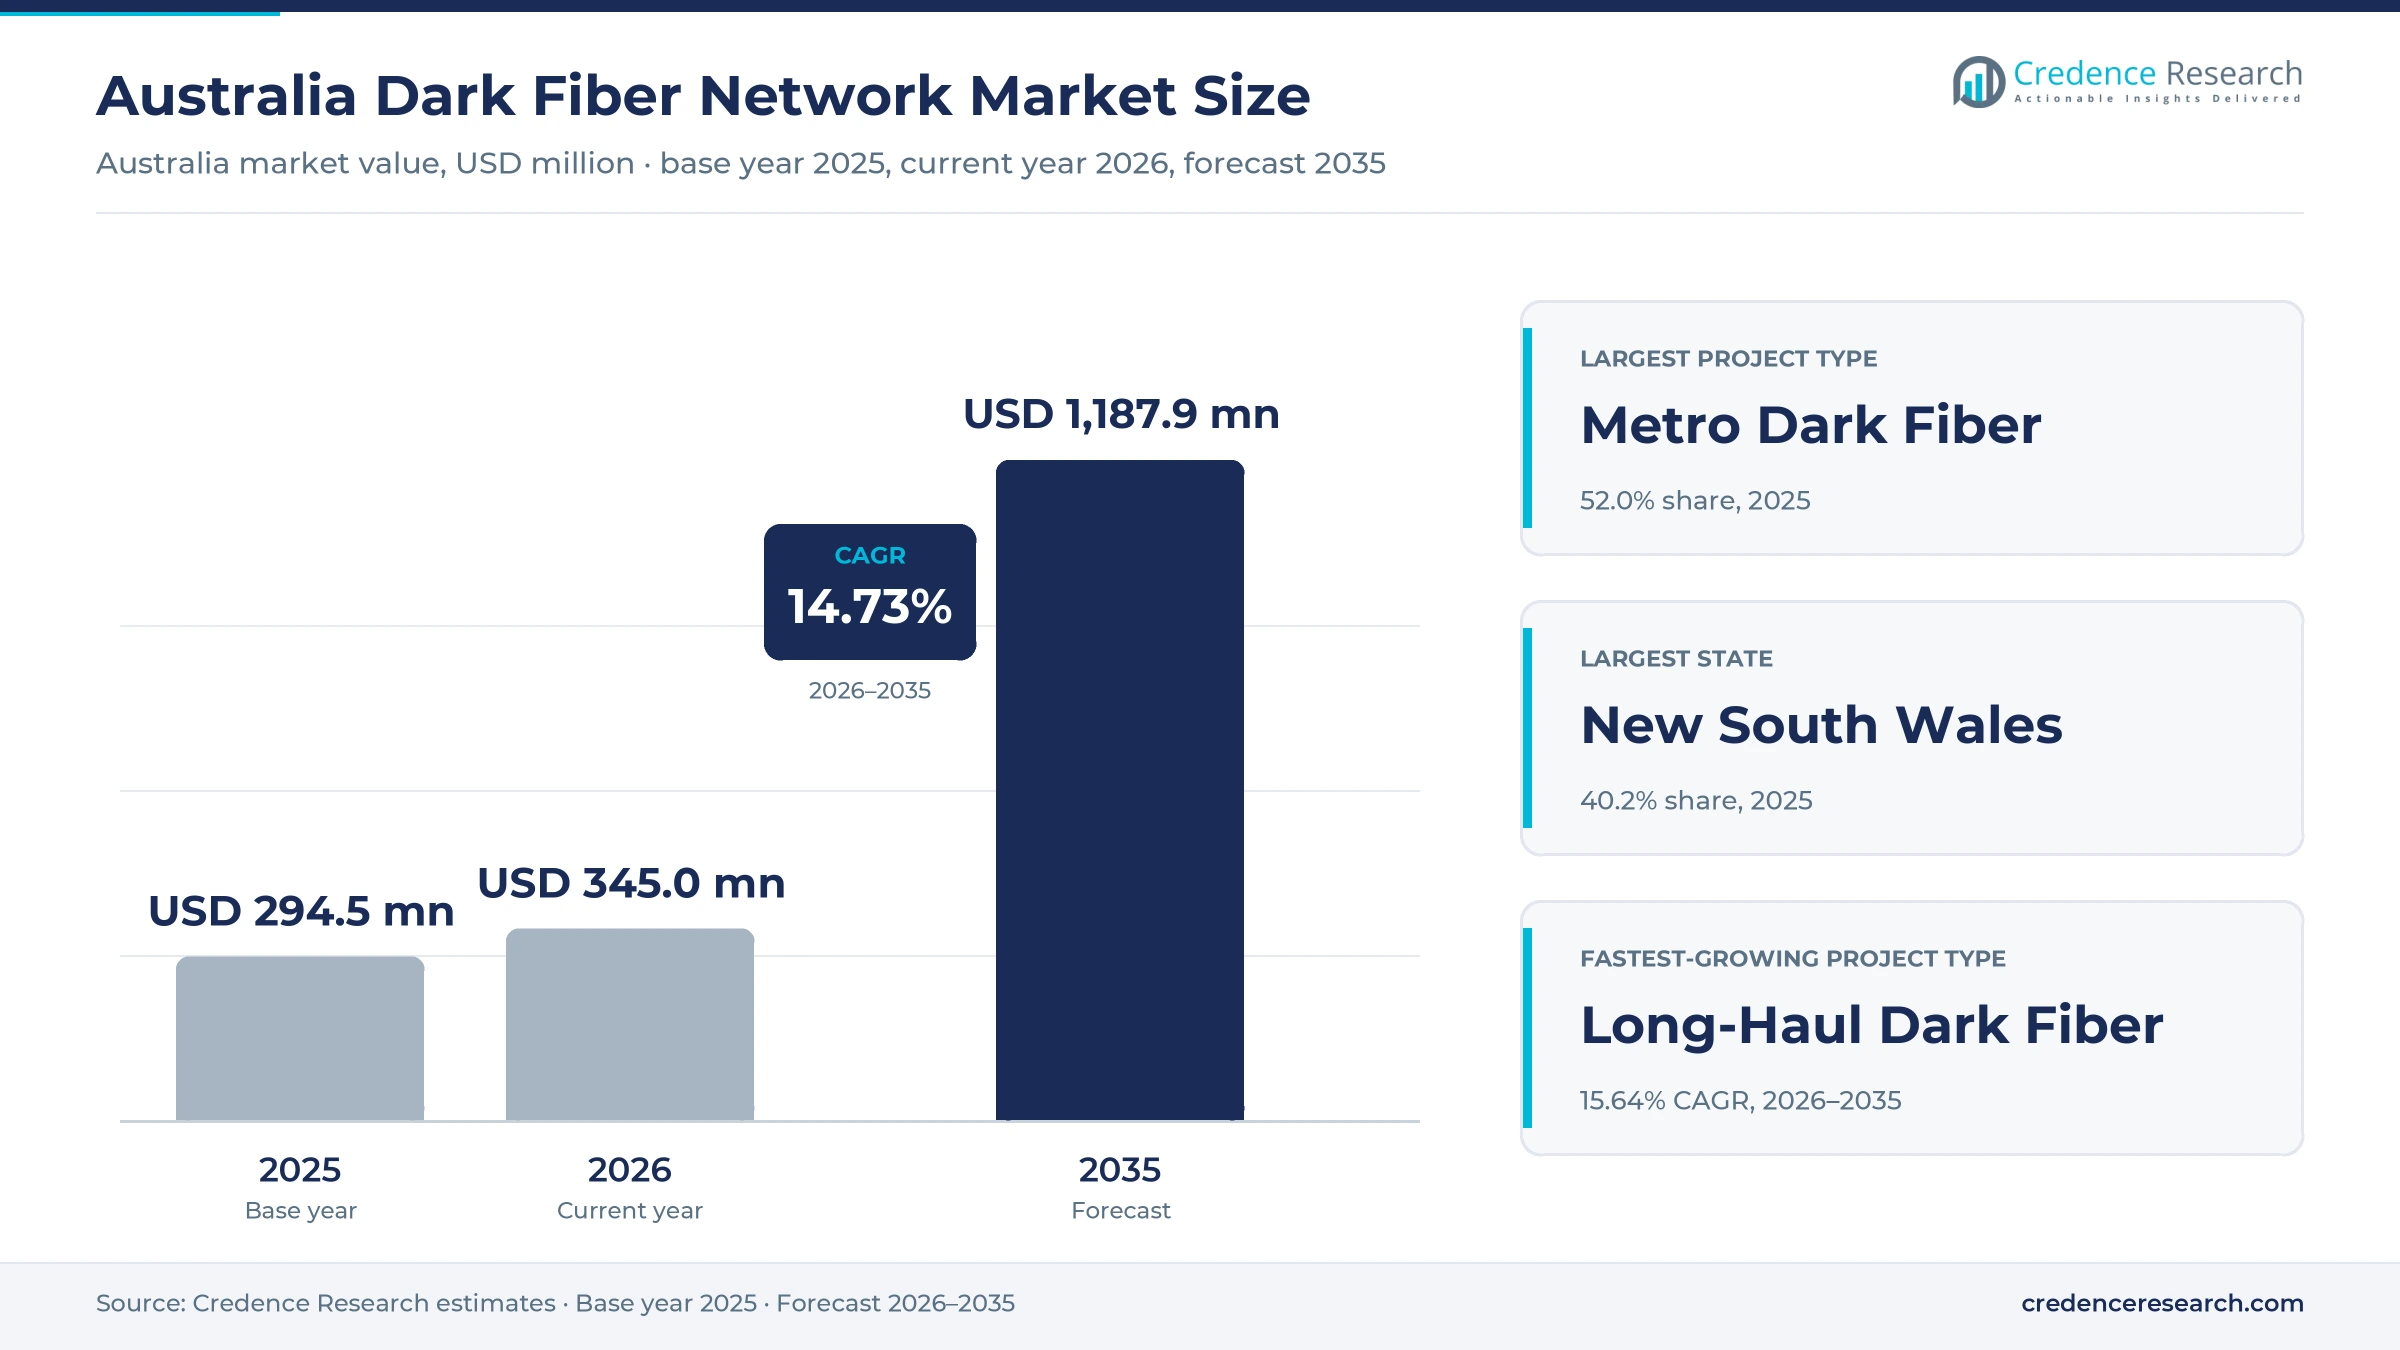
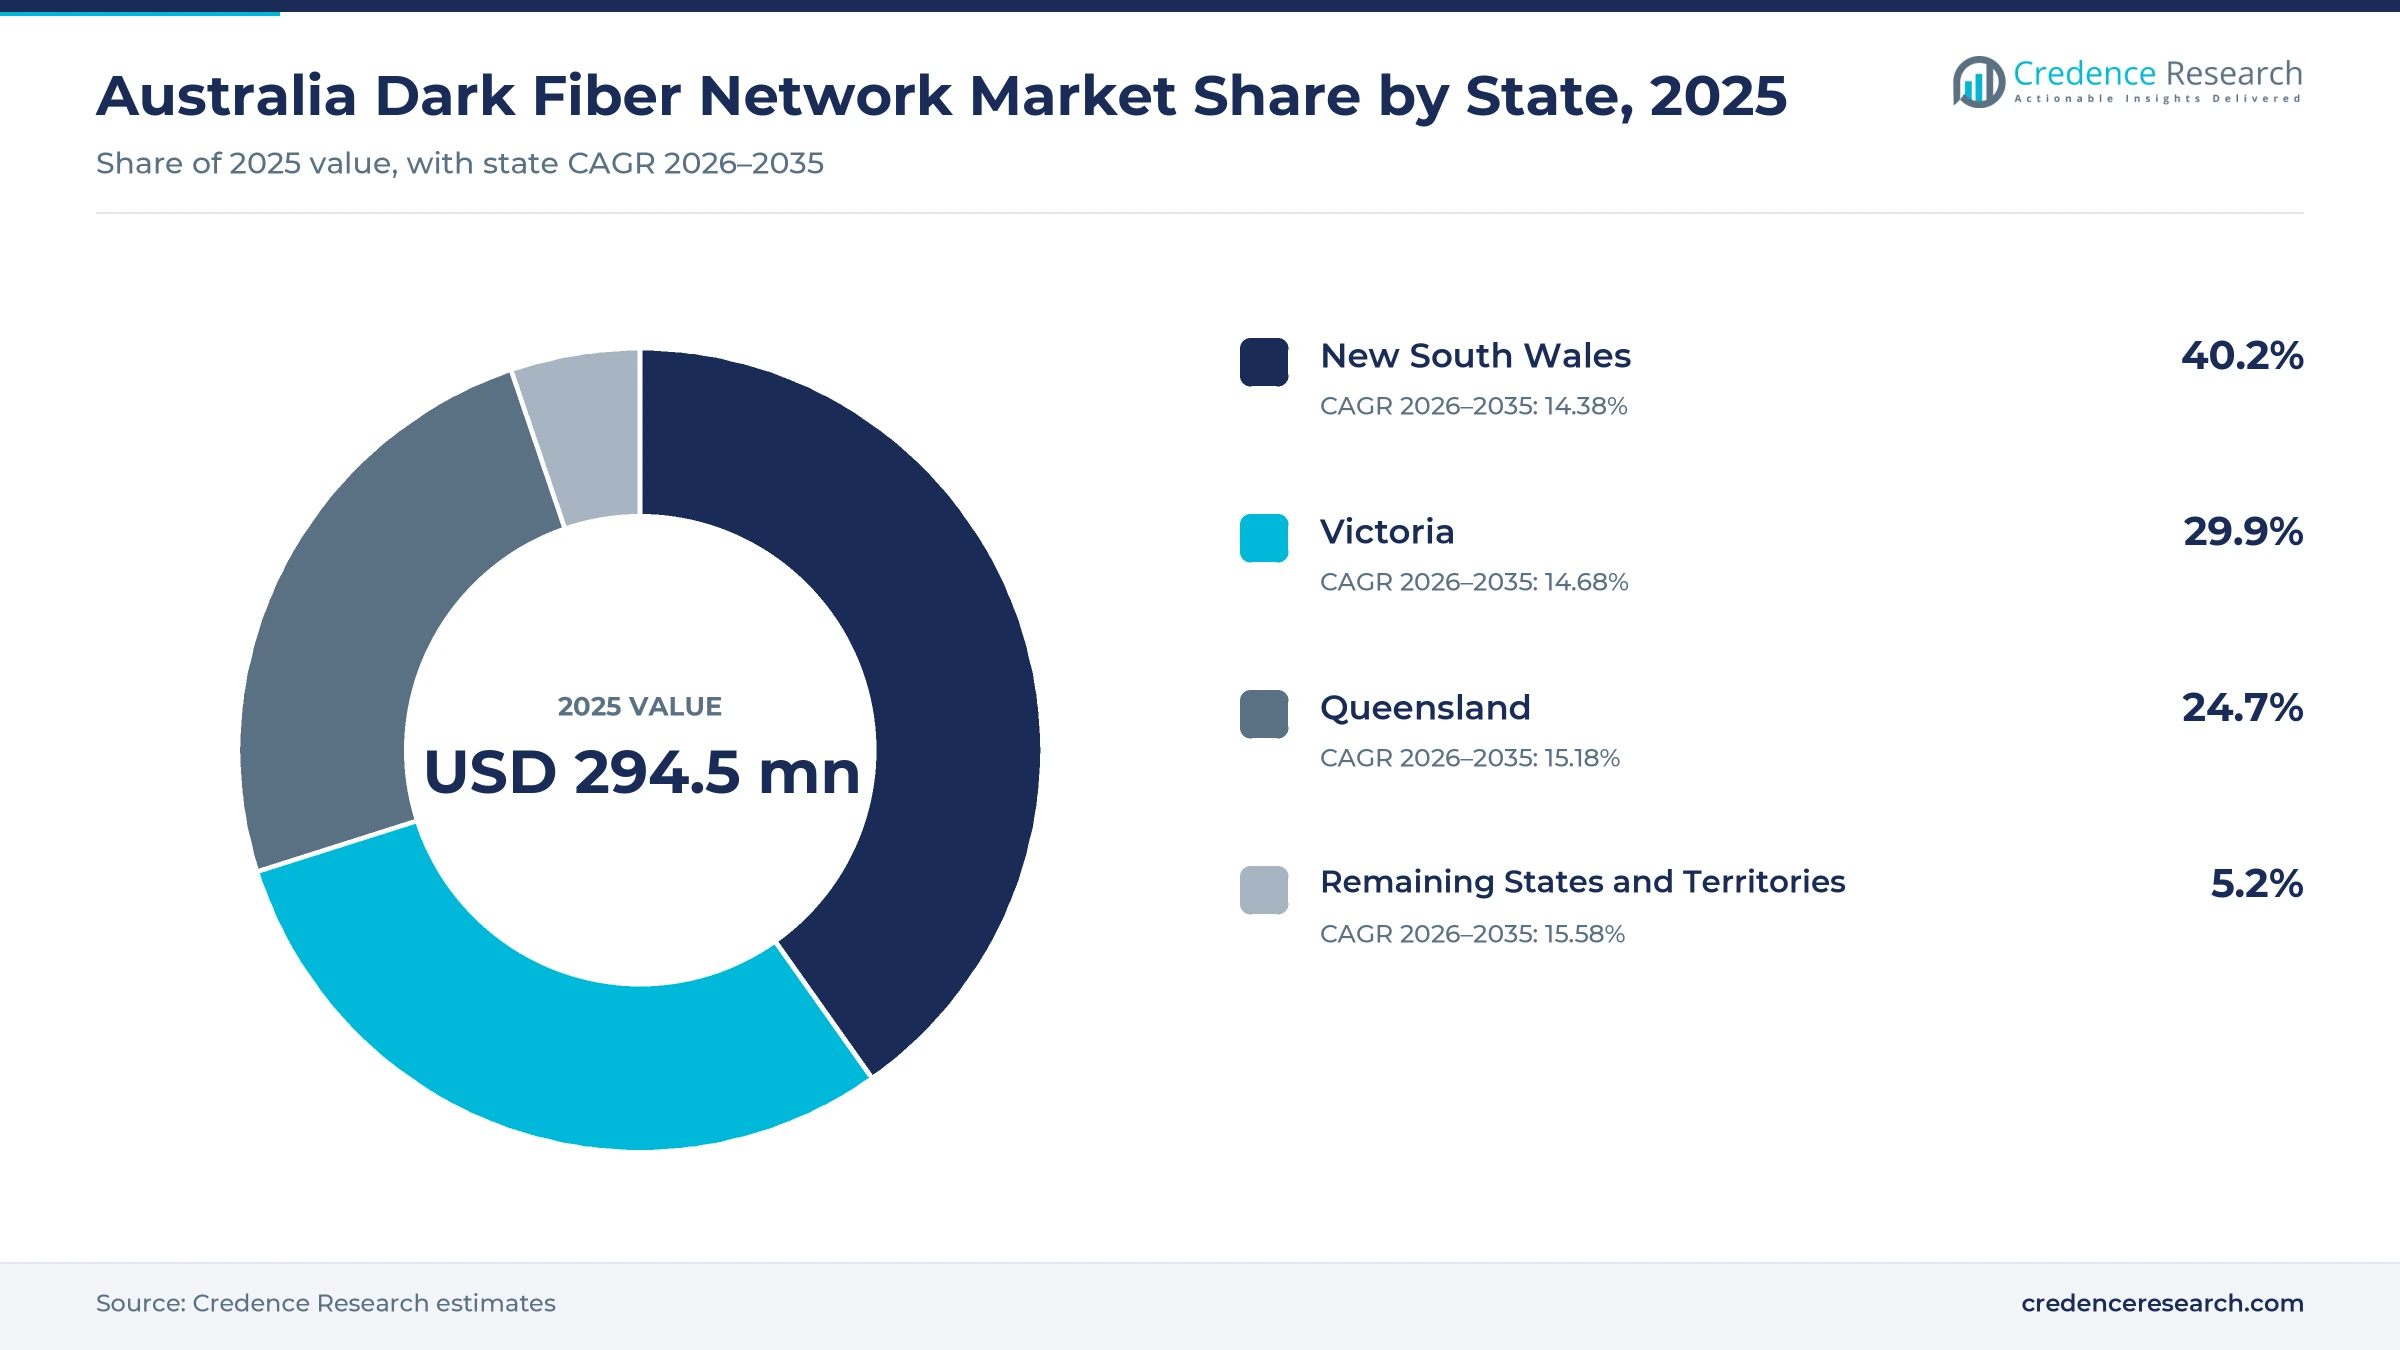
The Australia dark fiber network market was valued at USD 294.5 million in 2025 and is projected to increase from USD 345.0 million in 2026 to USD 1.19 billion by 2035, registering a CAGR of 14.73% during 2026–2035. Demand comes from telecom carriers, hyperscale cloud providers, data center operators, banks and government agencies that lease unlit fiber pairs and light them with their own optical equipment. New South Wales held the largest state share, 40.2% in 2025, because Sydney hosts the densest cluster of data centers, carrier exchanges and cloud regions in the country. Remaining States and Territories is the fastest-growing zone at 15.58% a year, as new long-haul routes reach Perth, the Pilbara, Adelaide and Darwin. At the same time, Telstra InfraCo opened the first route of its new intercity network between Sydney and Canberra on June 25, 2025, adding fresh long-haul capacity for lease.
Which fiber leases and rights does the estimate count?
The estimate counts the value of dark fiber supplied in Australia, meaning fiber pairs or cores that a provider leases or grants without lighting them, so the buyer installs and runs its own transmission equipment. It covers metro routes between data centers, exchanges and offices, long-haul routes between cities and regional centers, and fiber that links mobile base stations to core networks. Buyers pay through recurring monthly leases, indefeasible rights of use over 10 to 20 years, or build-to-suit contracts.
The estimate excludes lit services such as wavelengths, Ethernet and internet transit, retail broadband, subsea cable capacity and the in-building cabling of data centers. The value chain links cable makers, civil contractors and duct owners, network owners that hold the fiber, and the carriers, cloud providers, enterprises and agencies that light it.
Australia Dark Fiber Network Market Insights
- The Australia dark fiber network market was valued at USD 294.5 million in 2025 and is projected to reach USD 1.19 billion by 2035, registering a CAGR of 14.73% during 2026–2035.
- New South Wales held 40.2% of 2025 value, because Sydney concentrates data centers, cloud regions and carrier exchanges.
- Metro Dark Fiber led project types with a 52.0% share of 2025 value, because data center interconnection still drives most leasing.
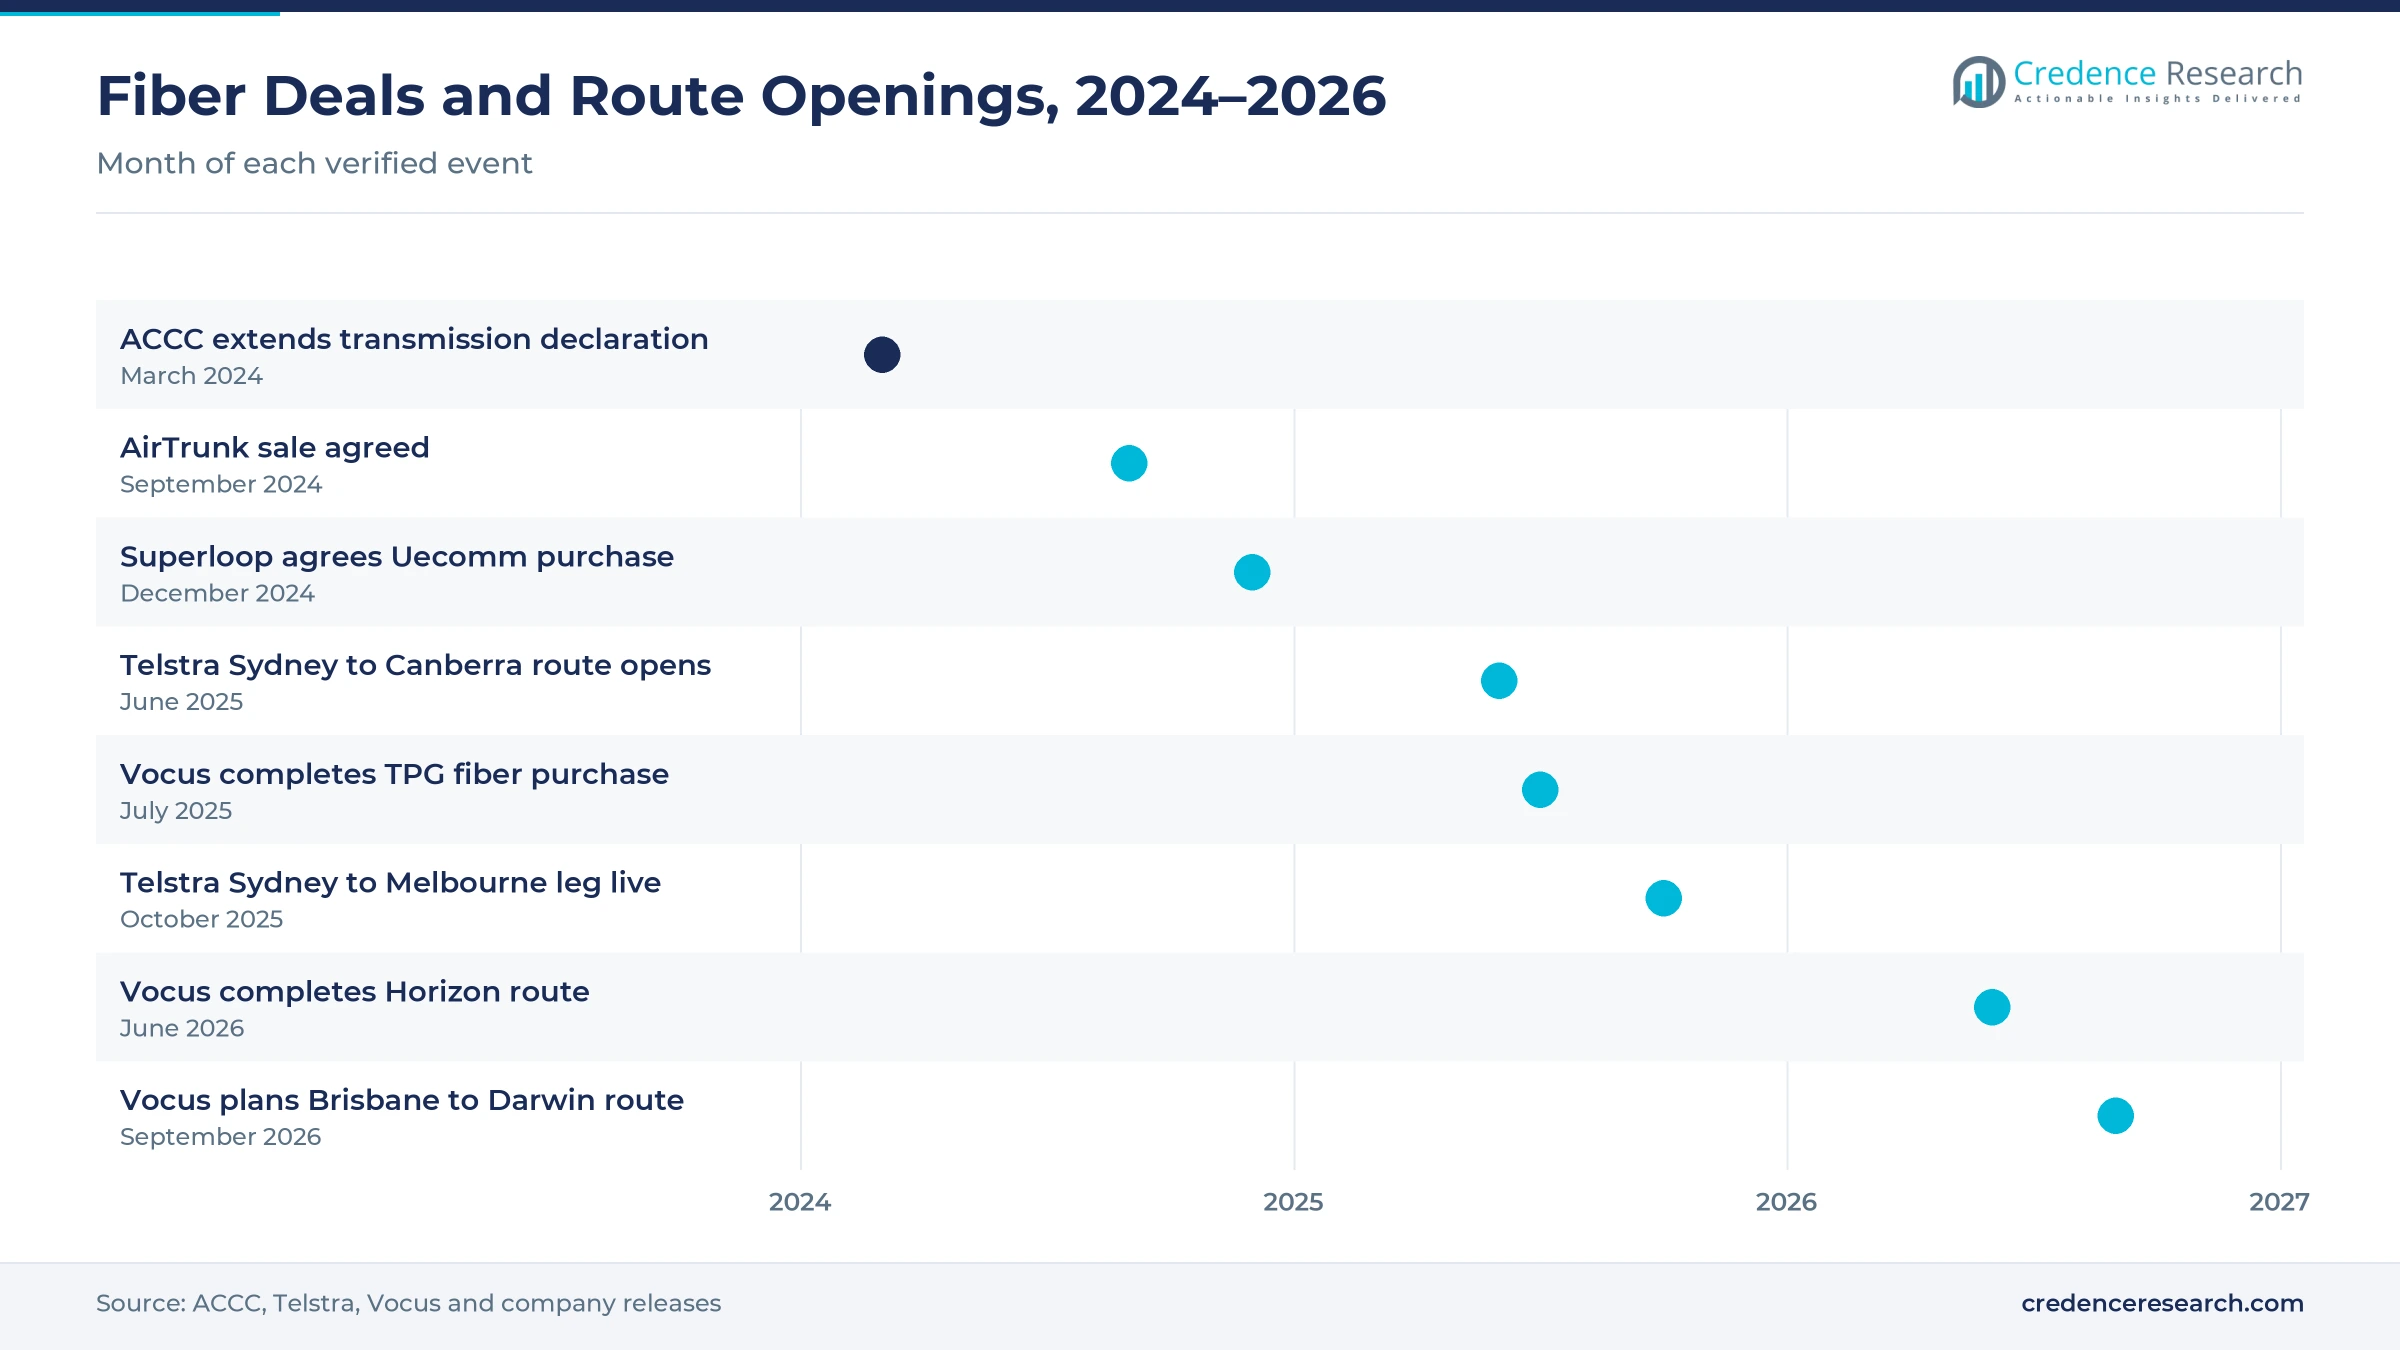
- Telstra InfraCo opened the first route of its intercity network between Sydney and Canberra on June 25, 2025, as part of a planned build of about 14,000 km.
- Vocus completed its purchase of TPG Telecom fiber assets on July 31, 2025, giving it more than 50,000 km of owned fiber and close to 20,000 connected buildings.
Metro routes lead while long-haul builds grow fastest
Why do metro routes hold the largest share?
Based on project type, the market is categorized into metro dark fiber, long-haul dark fiber and mobile backhaul dark fiber. Metro Dark Fiber led with a 52.0% share of 2025 value, because operators in Sydney and Melbourne lease many short, high-count routes between data centers and exchanges. Long-Haul Dark Fiber grows fastest at 15.64% a year, as new intercity cables between Sydney, Canberra, Melbourne, Perth and Darwin open capacity for lease.
Which buyers lease the most unlit fiber?
Based on end-use sector, the market is categorized into telecom operators, enterprises and data centers, and government and defense buyers. Telecom Operators led with a 47.0% share of 2025 value, because carriers lease fiber to reach exchanges, mobile sites and broadband interconnection points. Enterprises and Data Centres grows fastest at 15.57% a year, as cloud providers and colocation operators link new campuses across each metro area.
How do carrier and independent networks split the market?
Based on ownership model, the market is categorized into integrated carrier-owned networks, independent wholesale networks and utility-owned commercial networks. Integrated Carrier-Owned Networks led with a 58.0% share of 2025 value, because the largest carriers own most long-haul cable and duct. Independent Wholesale Networks grow fastest at 15.36% a year, as neutral operators sell flat-priced links between data centers.
Which contract structures do buyers prefer?
Based on contracting model, the market is categorized into recurring fiber leases, indefeasible rights of use and build-to-suit agreements. Recurring Fibre Leases led with a 49.0% share of 2025 value, because enterprises and smaller carriers prefer monthly payments over upfront capital. Build-to-Suit Agreements grow fastest at 15.61% a year, as hyperscale buyers ask for dedicated routes to new campuses.
| Segment Group | Leading Sub-segment | Share, 2025 | Fastest-growing Sub-segment | CAGR, 2026–2035 |
|---|---|---|---|---|
| By Project Type | Metro Dark Fiber | 52.0% | Long-Haul Dark Fiber | 15.64% |
| By End-Use Sector | Telecom Operators | 47.0% | Enterprises and Data Centres | 15.57% |
| By Ownership Model | Integrated Carrier-Owned Networks | 58.0% | Independent Wholesale Networks | 15.36% |
| By Contracting Model | Recurring Fibre Leases | 49.0% | Build-to-Suit Agreements | 15.61% |
Request a Free Sample
Fill in your details and we'll send you a free sample report.
- Sample data tables & charts
- Research methodology
Interconnection, intercity builds and reach lift demand
How does data center interconnection density lift leasing?
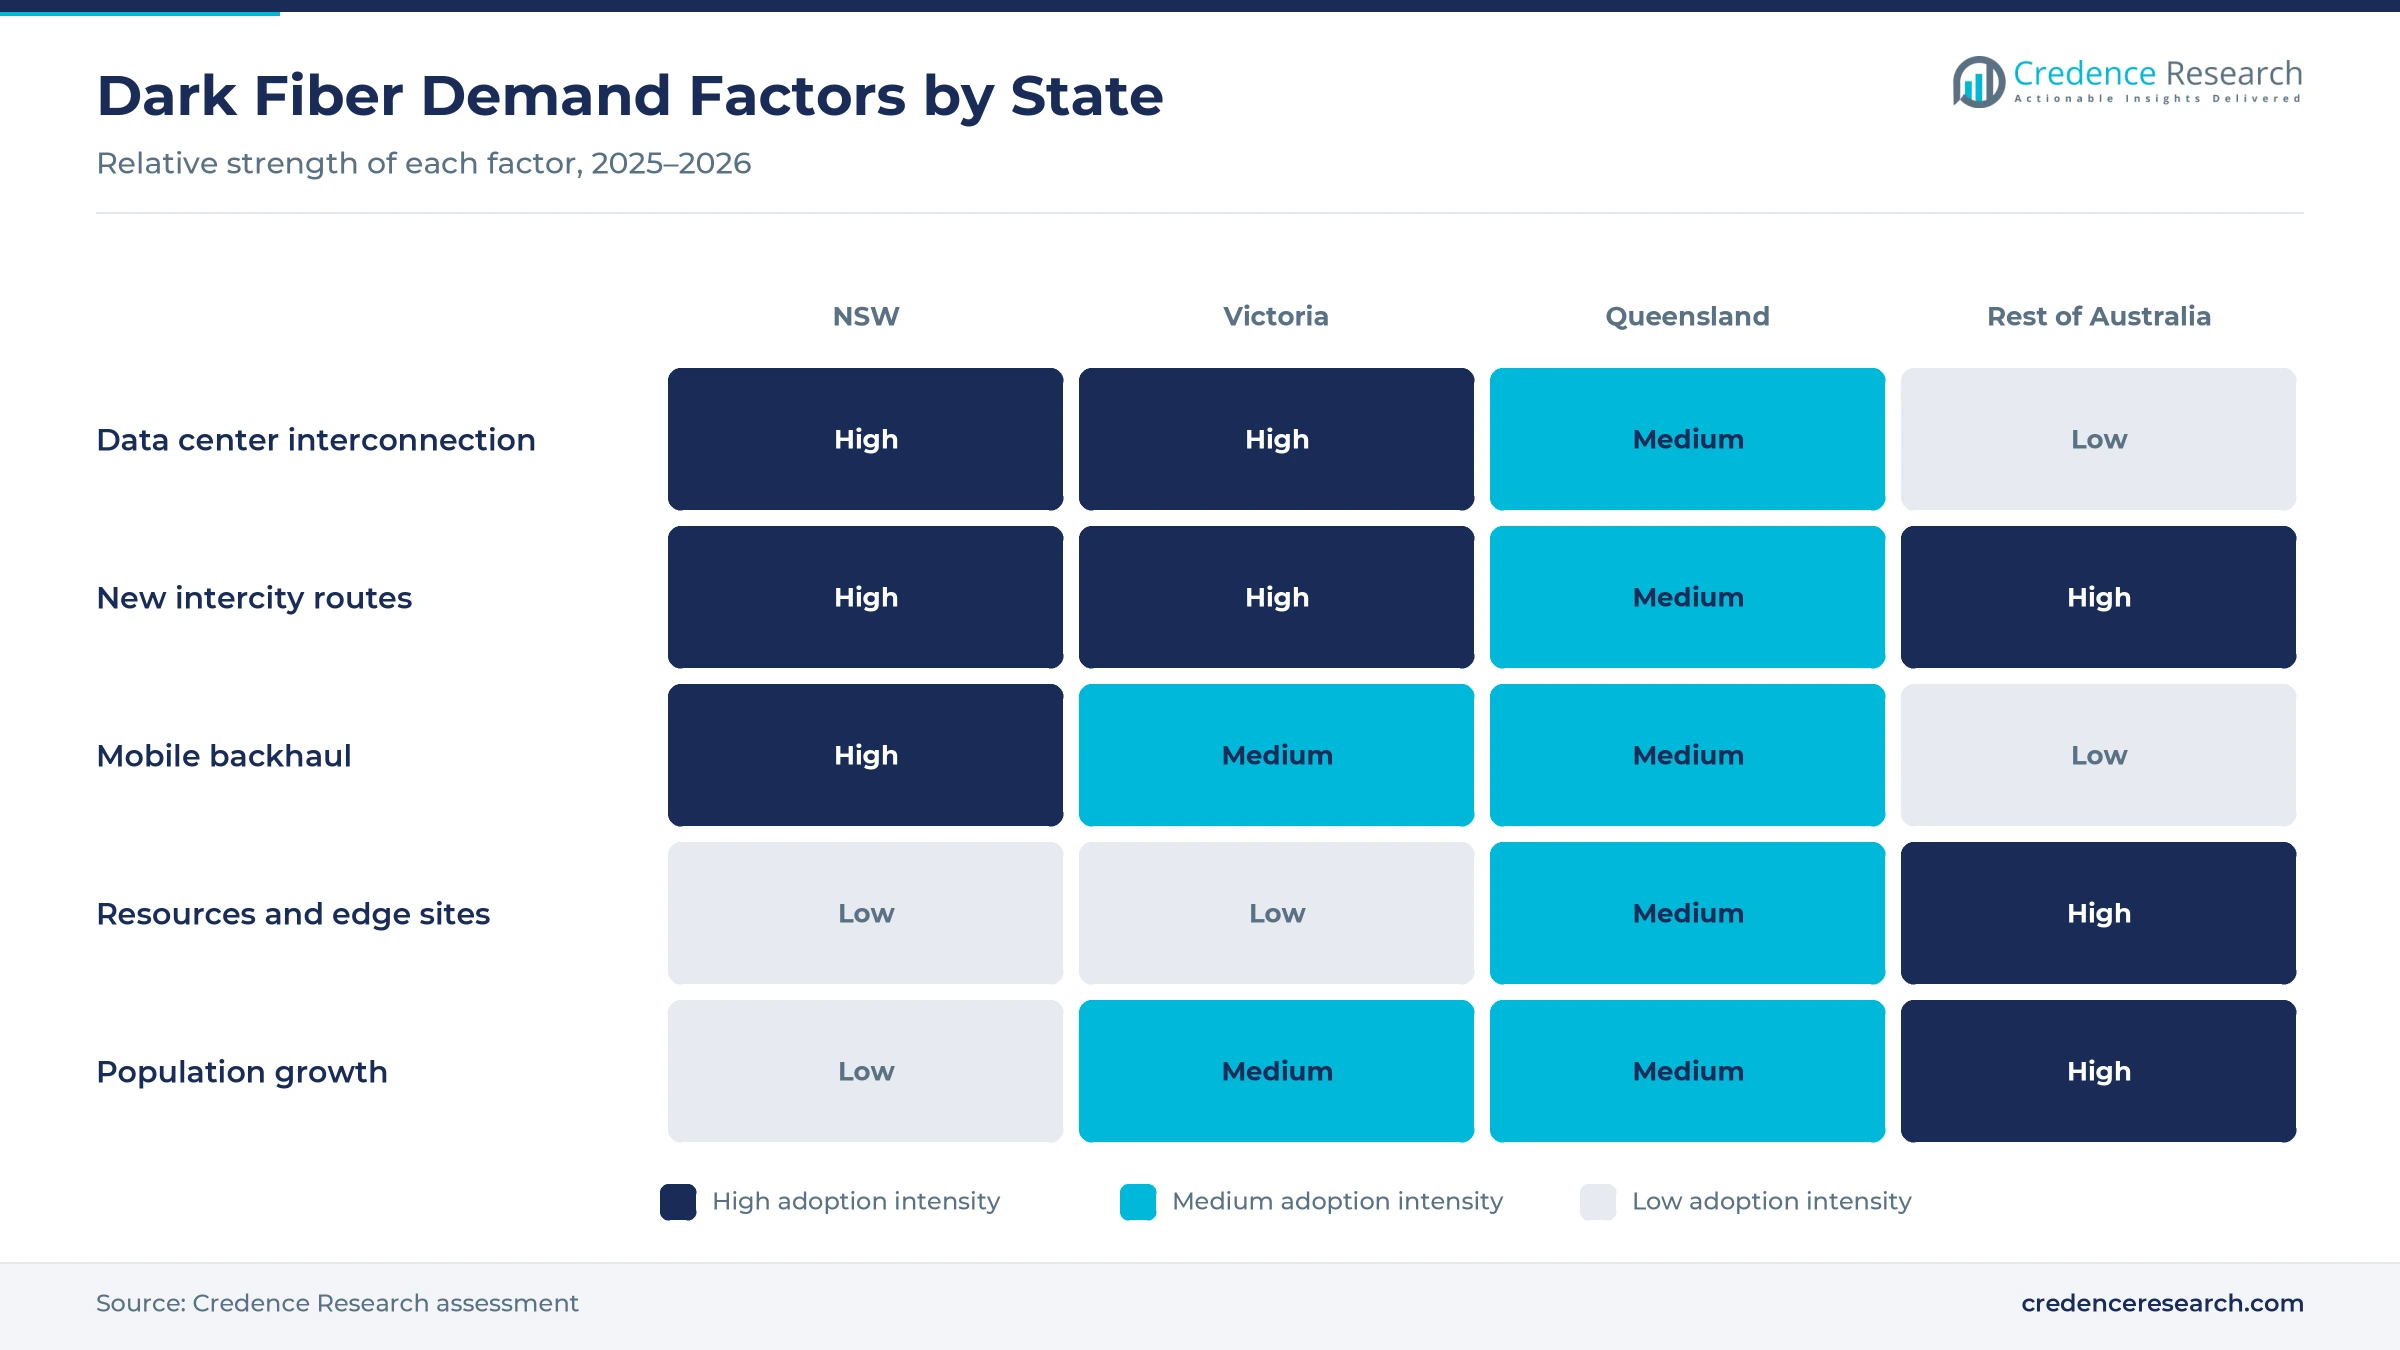
Dense clusters of data centers in Sydney and Melbourne need many short, diverse fiber routes between buildings, which makes interconnection the largest source of dark fiber demand. Australia had roughly 165 data centers using about 5 TWh of electricity a year, and New South Wales accounted for about two-thirds of that use, according to W.Media's summary of AEMO forecasts. AEMO expects data center use to reach about 34 TWh by 2035-36 under its central scenario. FibreconX completed a Sydney network linking 32 data centers in 2021, according to Tattarang. As a result, metro routes hold 52.0% of 2025 value.
Why does intercity infrastructure commercialization add capacity?
Carriers are building new long-haul cables between capital cities and selling the spare fiber, which turns once-scarce intercity capacity into a product that buyers can lease or own. Telstra InfraCo opened the first Sydney to Canberra route of its intercity network on June 25, 2025, according to Telstra. When complete, the network will run almost 14,000 km between mainland capitals, according to Telstra InfraCo. Its Sydney to Melbourne coastal leg of about 1,200 km followed in October 2025, according to Techpartner News. Vocus also plans a ducted Sydney to Melbourne route of up to 3,456 fiber pairs by 2029, according to ChannelNews. This is why long-haul dark fiber grows at 15.64% a year.
How does wholesale network reach widen the buyer base?
Wider wholesale networks let buyers reach more buildings and interconnection points from one provider, which lowers the cost of leasing fiber outside a few central sites. Vocus completed its purchase of TPG Telecom fiber assets on July 31, 2025, giving it more than 50,000 km of owned fiber and close to 20,000 connected buildings, according to Macquarie. Superloop agreed in December 2024 to buy Uecomm from Optus, adding more than 2,000 km of fiber and access to more than 1,900 buildings, according to iTWire. Telstra InfraCo also reaches 133 third-party data centers and all 121 broadband interconnection points. As a result, independent wholesale networks grow at 15.36% a year.
Why does 5G densification add backhaul fiber demand?
Mobile carriers keep adding 5G sites that need high-capacity links to core networks, which raises demand for fiber that connects towers and small cells. Telstra had 6,421 5G sites on Jan. 31, 2025, after adding 1,339 in a year, according to the ACCC Mobile Infrastructure Report. Optus had 4,939 5G sites after adding 901, while TPG ran 3,759 on its own network. Fixed demand also stays high, with about 36.5 broadband subscriptions per 100 people in 2024, according to the World Bank. For carriers, this means mobile backhaul dark fiber keeps a steady share of leasing through 2035.
Ducted corridors, automated ordering and edge sites rise
How is the shift to ducted high-count corridors changing builds?
Network owners now lay ducts with room for extra cables and very high fiber counts, which shifts long-haul economics toward selling many pairs on one route. Vocus said its Sydney to Melbourne route will carry up to 3,456 fiber pairs, compared with fewer than 200 pairs operating between the two cities, according to ChannelNews in July 2026. The same report said about 40% of Australia's data traffic travels that corridor. Vocus also plans a 4,000 km ducted route linking Brisbane, Townsville and Darwin by 2030, according to W.Media. Such capacity makes indefeasible rights of use on new corridors easier to sell to hyperscale buyers.
Why is the rise of automated ordering speeding up leasing?
Wholesale providers increasingly price and provision dark fiber through online platforms, which shortens buying cycles for data center links. FibreconX said its Fusion platform can set up connections between data centers within 40 seconds, according to Tattarang. 5G Networks offers one flat price for any two data centers in the same metro area and connectivity to more than 80 data centers, according to its product page. It also offers a five-year price guarantee and a dedicated ITU-T G.652 fiber pair for each customer. These features help independent wholesale networks win more short-term metro orders from enterprises and colocation buyers.
Can resources and edge sites open regional routes?
Mining regions and new edge data centers create demand for long routes outside capital cities, which opens room for fiber built along rail and resource corridors. Vocus completed its 2,000 km Horizon network from Perth to Port Hedland in June 2026, with capacity of up to 38 Tbps, according to W.Media. Fortescue provided land and rail corridors for the route, which connects to NEXTDC edge data centers in Newman and Port Hedland. NEXTDC opened its 1.5 MW PH1 site in Port Hedland in August 2023, according to Techpartner News. As a result, carriers and miners gain a second inland route for lease in the west.
Is there an opening in AI campus build-to-suit routes?
Large AI and cloud campuses need dedicated fiber routes sized to their own plans, which opens build-to-suit work for network owners. Blackstone and CPP Investments agreed in September 2024 to buy AirTrunk at an implied enterprise value of more than A$24 billion, and AirTrunk runs three Sydney sites and one in Melbourne, according to Information Age. Microsoft is the foundation partner on Telstra InfraCo's intercity network, according to Telstra. Telstra expects data demand to grow more than 30% a year to 2031. In turn, build-to-suit agreements grow at 15.61% a year as campuses near hyperscale capacity expand.
Build costs, distance and regulation slow expansion
How do civil build costs limit new routes?
Trenching, ducting and approvals make up most of the cost of a new fiber route, especially in dense city centers and under harbors. Aussie Broadband crews pulling fiber through the Sydney Harbour Tunnel could work only four hours on specific nights, according to Technology Decisions in November 2020. Telstra InfraCo laid about 1 km of fiber on the floor of Sydney Harbour after months of planning and approvals. For this reason, owners build in stages and sell pre-orders before committing capital to new routes.
Why do long distances weaken regional route economics?
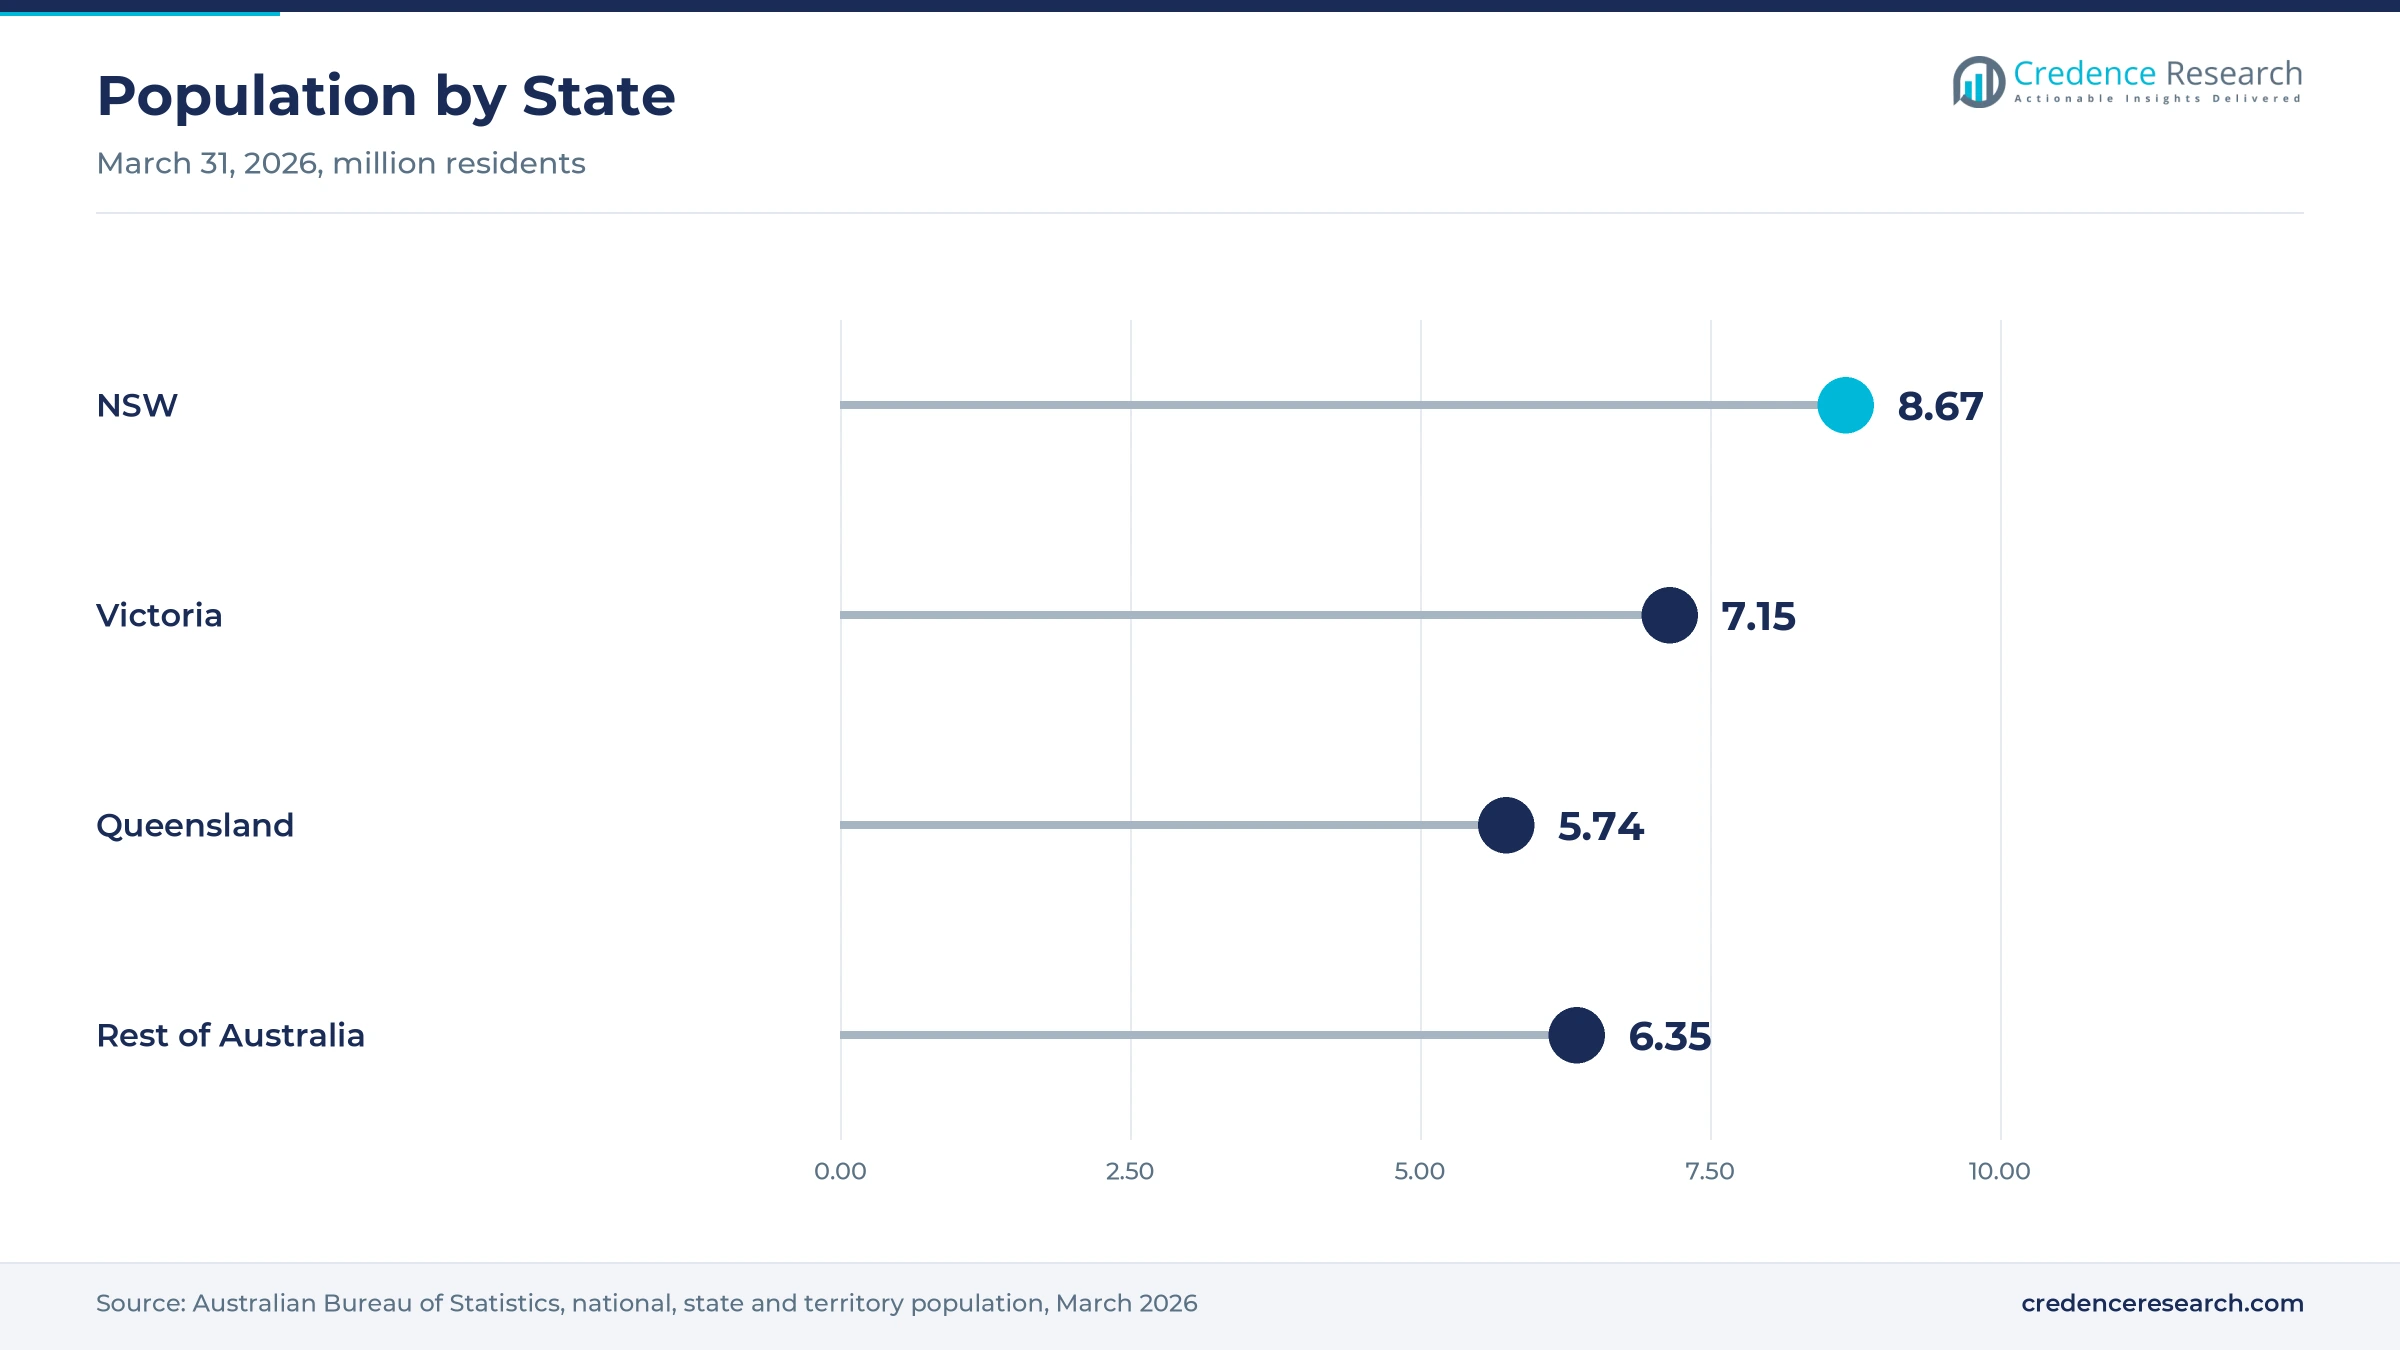
Australia's population sits mostly in a few coastal cities, so long routes across inland regions carry little traffic per kilometer. New South Wales, Victoria and Queensland held about 77% of the 27.9 million residents counted in March 2026, according to the Australian Bureau of Statistics. Routes such as Brisbane to Darwin take years to build, and Vocus expects that route to be ready only in 2030. In turn, owners need anchor tenants, such as cloud providers or miners, before building far from capital cities.
How does wholesale regulation shape pricing on thin routes?
The ACCC regulates wholesale transmission on routes where competition is weak, which caps pricing on many regional links. The regulator extended its domestic transmission capacity service declaration for five years in March 2024, while removing regulation in areas where competition is effective, according to iTWire. It said competition in regional and remote areas is often limited because transmission needs large upfront investment. As a result, owners must weigh regulated pricing when deciding whether to build competing regional routes.
Why does supplier concentration slow buyer switching?
A few large owners hold most long-haul cable and duct, which leaves buyers with limited choice on many routes outside the main corridors. Vocus and Telstra InfraCo each run national networks, and Vocus added TPG Telecom fiber assets in July 2025. Telstra InfraCo's wider network includes about 250,000 km of fiber, according to Telstra. For buyers, this means enterprises and smaller carriers often accept long contracts on regional routes, while metro buyers can switch between several independent providers.
Sydney leads as Queensland and the west grow fastest
| State | Value, 2025 (USD million) | Share, 2025 | CAGR, 2026–2035 |
|---|---|---|---|
| New South Wales | 118.4 | 40.2% | 14.38% |
| Victoria | 88.1 | 29.9% | 14.68% |
| Queensland | 72.7 | 24.7% | 15.18% |
| Remaining States and Territories | 15.3 | 5.2% | 15.58% |
Why does New South Wales lead unlit fiber leasing?
New South Wales held 40.2% of 2025 value and grows at 14.38% a year, because Sydney hosts most of the country's data center load, cloud regions and carrier exchanges. The state accounted for 66% of data center electricity use in the national grid, according to AEMO figures reported by W.Media. Aussie Broadband linked three Equinix sites in Alexandria and two NEXTDC sites in Macquarie Park to its Sydney network, according to Technology Decisions. Sydney therefore remains the largest market for internet data center interconnection.
How do Melbourne campuses support Victorian demand?
Victoria held 29.9% of 2025 value and grows at 14.68% a year, because Melbourne is the second-largest data center market and the southern end of the busiest intercity corridor. Victoria accounted for 30% of data center electricity use in the national grid, according to AEMO figures reported by W.Media. Telstra InfraCo opened its Sydney to Melbourne coastal leg in October 2025, and Vocus plans a second ducted route for 2029. The Victorian population also grew 1.6% in the year to March 2026, which adds metro network load.
Why does Queensland add strong long-haul demand?
Queensland held 24.7% of 2025 value and grows at 15.18% a year, because Brisbane gains new data centers and northern routes toward Darwin. Vocus plans a 4,000 km route linking Brisbane, Townsville and Darwin with up to 3,456 fiber cores, according to W.Media. Aussie Broadband laid more than 236 km of fiber in Queensland and connected 14 of 22 broadband interconnection points and four Brisbane data centers, according to the company. The state population grew 1.6% in the year to March 2026.
How do western and northern routes lift smaller states?
Remaining States and Territories held 5.2% of 2025 value and grows fastest at 15.58% a year, because new long-haul routes connect Perth, the Pilbara, Adelaide and Darwin. Vocus completed its Horizon route from Perth to Port Hedland in June 2026, and Telstra InfraCo plans to reach every mainland capital by the end of fiscal 2027. Western Australia's population grew 2.1% in the year to March 2026, the fastest of any state. In Adelaide, Aussie Broadband built about 112 km of fiber with YourDC.
Acquisitions and route openings mark 2024 to 2026
| Development | Status and market relevance |
|---|---|
| In December 2024, Superloop agreed to buy Uecomm from Optus for A$17.5 million, adding more than 2,000 km of metro fiber. | Expanded independent metro reach |
| In June 2025, Telstra InfraCo opened the Sydney to Canberra route of its intercity network for dark fiber orders. | First new intercity capacity |
| In July 2025, Vocus completed its purchase of TPG Telecom fiber assets, reaching more than 50,000 km of owned fiber. | Consolidated national wholesale fiber |
| In October 2025, Telstra InfraCo activated its Sydney to Melbourne coastal leg of about 1,200 km. | Linked the two largest metros |
| In June 2026, Vocus completed its 2,000 km Horizon route from Perth to Port Hedland with Fortescue. | Opened western resources capacity |
Fiber design and optics shape wholesale capacity
- High-count ribbon cables pack hundreds or thousands of fibers into one sheath, which lets owners sell many pairs on a single trench.
- Ducted corridor design leaves spare conduit along each route, which lets owners pull new cables later without fresh civil works.
- Coherent optical transceivers carry many terabits over one fiber pair, which lets buyers raise capacity by upgrading equipment at each end.
- Automated provisioning platforms quote and assign fiber pairs online, which lets data center buyers order metro links in minutes.
Need a Custom Version of This Report?
Tailor the scope, geography, or segments to your exact requirements.
- Custom geography or segment scope
- Direct access to our analyst team
Carriers and independent wholesalers compete on reach
Competition combines national carriers that own long-haul cable with independent wholesalers that focus on metro data center routes. Telstra InfraCo is building about 14,000 km of intercity fiber with Microsoft as a foundation partner, while Vocus added TPG Telecom fiber assets in July 2025 and completed its Horizon route in June 2026. Superloop expanded in Sydney, Melbourne and Brisbane through its Uecomm purchase from Optus. FibreconX runs a dedicated duct network for data center links in Sydney and other capitals, and 5G Networks sells flat-priced metro links between data centers. Nexthop sells wholesale dark fiber over its own network, while Aussie Broadband built fiber to broadband interconnection points and data centers in several states. Rivals compete on route diversity, fiber counts, building reach, pricing and ordering speed.
Which providers shape Australian unlit fiber supply?
| Company | Type | Role in the market |
|---|---|---|
| Telstra InfraCo | Infrastructure arm of a national carrier | Building an intercity network of about 14,000 km |
| Vocus Group | National wholesale carrier | Added TPG Telecom fiber assets and completed the Horizon route |
| Superloop | Wholesale and retail carrier | Bought Uecomm metro fiber in Sydney, Melbourne and Brisbane |
| Optus Networks | National carrier | Sold its Uecomm fiber business to Superloop |
| FibreconX | Independent dark fiber wholesaler | Runs a data center duct network with automated ordering |
| 5G Networks | Data network provider | Sells flat-priced dark fiber between more than 80 data centers |
| Nexthop | Independent carrier | Sells wholesale dark fiber over its own network |
| Aussie Broadband | Carrier and broadband provider | Built fiber to interconnection points and data centers |
Credence Research view on Australian unlit capacity
Credence Research's view is that dark fiber leasing in Australia will keep rising because data center load, intercity builds and 5G backhaul all need more fiber pairs than existing routes can supply. Metro routes remain the largest pool, yet growth increasingly comes from long-haul corridors, enterprise and data center buyers, and build-to-suit contracts for new campuses. Owners that combine ducted corridors, high fiber counts and wide building reach should gain share as buyers seek diverse routes. Long-haul dark fiber, the fastest-growing project type, is likely to narrow the gap with metro routes before 2035.
How the unlit fiber leasing estimate was built
The report uses 2025 as the base year on a calendar basis, and market values come from the Credence Research model. That model combines network build announcements, data center load forecasts, mobile site counts, population data and company releases. State growth rates and segment splits are Credence Research estimates built from data center electricity shares, state population growth and the long-haul build pipeline, while state shares follow the source sheet. Sources used are regulator, statistical agency, international organization, trade press and company publications, and no interviews or surveys were used.
Intercity corridors and AI campuses lift demand to 2035
The Australia dark fiber network market is expected to reach USD 1.19 billion by 2035, a 14.73% CAGR during 2026–2035, as new intercity corridors, AI campuses and 5G densification keep fiber leasing rising. Growth should be strongest in long-haul routes, enterprise and data center buyers, build-to-suit agreements and the smaller states and territories. Short-reach multimode cabling inside data center campuses will also grow as operators add halls, although it sits outside this estimate. Global demand for unlit optical capacity keeps owners investing in new routes.
Frequently Asked Questions
How big is the Australia dark fiber network market?
Which project type leads the market?
Which state leads the market?
What is Telstra InfraCo building?
How did the Vocus and TPG Telecom deal change supply?
How fast is mobile site deployment growing?
Who are the leading companies in the market?
What are the main challenges for the market?
Table of Content
Chapter 1 Market Segmentation
- 1.1 Segmentation Framework
- 1.1.1 Product and Service Classification
- 1.1.2 Application and End-Use Classification
- 1.1.3 Technology and Solution Classification
- 1.1.4 Customer and Distribution Channel Classification
- 1.1.5 Geographic Segmentation
- 1.1.6 Market Segment Definitions and Boundaries
- 1.2 By Project Type
- 1.2.1 Metro Dark Fiber
- 1.2.2 Long-Haul Dark Fiber
- 1.2.3 Mobile Backhaul Dark Fiber
- 1.3 By End-Use Sector
- 1.3.1 Telecom Operators
- 1.3.2 Enterprises and Data Centres
- 1.3.3 Government and Defence
- 1.4 By Ownership Model
- 1.4.1 Integrated Carrier-Owned Networks
- 1.4.2 Independent Wholesale Networks
- 1.4.3 Utility-Owned Commercial Networks
- 1.5 By Contracting Model
- 1.5.1 Recurring Fibre Leases
- 1.5.2 Indefeasible Rights of Use
- 1.5.3 Build-to-Suit Agreements
- 1.6 By State
- 1.6.1 New South Wales
- 1.6.2 Victoria
- 1.6.3 Queensland
- 1.6.4 Remaining States and Territories
Chapter 2 Introduction
- 2.1 Report Objectives and Scope
- 2.2 Product Definition and Industry Terminology
- 2.3 Market Inclusions and Exclusions
- 2.4 Research Process
- 2.4.1 Primary Research and Expert Interviews
- 2.4.2 Secondary Research and Source Review
- 2.4.3 Top-Down and Bottom-Up Estimation
- 2.4.4 Data Triangulation and Verification
- 2.5 Market Size Measurement Basis
- 2.5.1 2025: USD 294.5 million → 2035: USD 1.19 billion
- 2.6 Historical and Forecast Reference Periods
- 2.6.1 Historical Period: 2018-2025
- 2.6.2 Base Year: 2025
- 2.6.3 Forecast Period: 2025-2035
- 2.7 Research Assumptions and Limitations
Chapter 3 Executive Summary
- 3.1 Market Snapshot and Key Findings
- 3.2 Base-Year Market Size, 2025
- 3.3 Forecast Market Size, 2035
- 3.4 Revenue and Volume Growth Outlook
- 3.5 Key Demand and Supply Indicators
- 3.6 Leading Market Segments
- 3.7 Fastest-Growing Market Opportunities
- 3.8 Regional Performance Highlights
- 3.9 Technology and Industry Transformation
- 3.10 Competitive Landscape Summary
- 3.11 Analyst View and Strategic Implications
Chapter 4 Australia Dark Fiber Network Market Trends and Developments
- 4.1 Historical Industry Development, 2018-2025
- 4.2 Recent Market Trends and Developments
- 4.3 Demand and Customer Behavior Trends
- 4.4 Technology and Product Innovation
- 4.5 Artificial Intelligence, Automation and Digitalization
- 4.6 Local Manufacturing and Supply Chain Realignment
- 4.7 Industry Partnerships, Mergers and Acquisitions
- 4.8 Sustainability and Circular Economy Developments
- 4.9 Government and Private Sector Investment Trends
- 4.10 Emerging Business Models and Commercialization
- 4.11 Industry Developments and Announcements
Chapter 5 Australia Dark Fiber Network Market Production, Supply and Demand Analysis
- 5.1 Demand Trend and Consumption Analysis, 2018-2025
- 5.2 Demand Forecast, 2025-2035
- 5.3 Production and Output Trend, 2018-2025
- 5.4 Production and Output Forecast, 2025-2035
- 5.5 Installed Capacity and Capacity Utilization
- 5.6 Company-Wise Production Plants and Statistics
- 5.6.1 Installed Production Capacity
- 5.6.2 Actual Production
- 5.6.3 Planned Capacity and Expansion Targets
- 5.7 Supply Chain Structure and Procurement Trends
- 5.8 Supply-Demand Gap and Bottlenecks
- 5.9 Import Dependence and Sourcing Structure
- 5.10 Contract Manufacturing and Outsourcing
- 5.11 Regional Supply and Demand Concentration
Chapter 6 Australia Dark Fiber Network Market Pricing Analysis
- 6.1 Pricing Structure and Measurement
- 6.2 Historical Pricing Trends, 2018-2025
- 6.3 Pricing Outlook, 2025-2035
- 6.4 Average Selling Price and Unit Economics
- 6.5 Pricing by Product and Market Segment
- 6.6 Geographic Pricing Differences
- 6.7 Key Input, Energy, Labor and Logistics Costs
- 6.8 Contract Pricing and Purchasing Models
- 6.9 Pricing Sensitivity and Competitive Positioning
- 6.10 Price, Margin and Profitability Implications
Chapter 7 Australia Dark Fiber Network Market Dynamics
- 7.1 Market Growth Drivers
- 7.1.1 Demand-Side Drivers
- 7.1.2 Technology and Innovation Drivers
- 7.1.3 Infrastructure and Investment Drivers
- 7.1.4 Regulatory and Policy Drivers
- 7.2 Market Restraints
- 7.2.1 Cost and Affordability Constraints
- 7.2.2 Technology and Adoption Barriers
- 7.2.3 Supply Chain and Operational Constraints
- 7.3 Market Challenges
- 7.3.1 Competitive Pressure and Margin Erosion
- 7.3.2 Skills, Infrastructure and Implementation Gaps
- 7.4 Emerging Market Opportunities
- 7.5 Market Dynamics Impact and Time-Horizon Assessment
Chapter 8 Australia Dark Fiber Network Value Chain Analysis
- 8.1 Industry Value Chain Overview
- 8.2 Upstream Suppliers and Critical Inputs
- 8.3 Technology and Component Providers
- 8.4 Manufacturing or Service Delivery
- 8.5 Distribution, Channel Partners and Integrators
- 8.6 Downstream Applications and End Users
- 8.7 Value Addition and Profit Pools
- 8.8 Vertical Integration and Outsourcing
- 8.9 Supplier Concentration and Risk
- 8.10 Supply Chain Localization and Resilience
Chapter 9 Australia Dark Fiber Network Market Regulations and Policies
- 9.1 Relevant Laws, Standards and Compliance Frameworks
- 9.2 Product, Service, Safety and Quality Requirements
- 9.3 Government Policies, Incentives and Subsidies
- 9.4 Imports, Exports and Trade Barriers
- 9.5 Public Procurement and Local Content Requirements
- 9.6 Environmental and Sustainability Compliance
- 9.7 Data Protection, AI and Cybersecurity Compliance
- 9.8 Upcoming Policy Changes and Market Implications
Chapter 10 Australia Dark Fiber Network Market Hotspots and Opportunities
- 10.1 Market Opportunity Mapping and Growth Hotspots
- 10.2 High-Growth Applications and Customer Groups
- 10.3 Underserved Markets and White-Space Opportunities
- 10.4 Emerging Technology and Product Opportunities
- 10.5 New Capacity and Investment Hotspots
- 10.6 Market Entry and Expansion Opportunities
- 10.7 Distribution and Partnership Opportunities
- 10.8 Near-Term and Long-Term Commercial Potential
- 10.9 Opportunity Attractiveness and Execution Risks
Chapter 11 Australia Dark Fiber Network Market Outlook, 2025-2035
- 11.1 Market Size and Analysis
- 11.1.1 Revenue (Market Measurement: 2025: USD 294.5 million → 2035: USD 1.19 billion)
- 11.1.2 Market Volume and Quantity Sold
- 11.1.3 Historical Market Size, 2018-2025
- 11.1.4 Base-Year Market Size, 2025
- 11.2 Market Forecast, 2025-2035
- 11.2.1 Revenue Forecast to 2035
- 11.2.2 Volume Forecast to 2035
- 11.2.3 CAGR and Year-on-Year Growth
- 11.2.4 Incremental Revenue Opportunity
- 11.3 Forecast Assumptions and Scenario Analysis
- 11.3.1 Base-Case Forecast
- 11.3.2 Optimistic and Conservative Scenarios
- 11.3.3 Technology, Pricing and Policy Sensitivities
- 11.4 Market Attractiveness and Growth Outlook
Chapter 12 Australia Dark Fiber Network Market Segmentation and Outlook
- 12.1 Segmentation Summary and Market Shares, 2025
- 12.2 Largest and Fastest-Growing Segments
- 12.3 By Project Type - Market Size and Forecast, 2025-2035
- 12.3.1 Segment Definition and Scope
- 12.3.2 Historical Market Size, 2018-2025
- 12.3.3 Revenue Forecast, 2025-2035
- 12.3.4 Volume Forecast, 2025-2035
- 12.3.5 Base-Year Market Share, 2025
- 12.3.6 Segment CAGR and Growth Drivers
- 12.3.7 Subsegment Market Size and Forecast
- 12.3.7.1 Metro Dark Fiber
- 12.3.7.2 Long-Haul Dark Fiber
- 12.3.7.3 Mobile Backhaul Dark Fiber
- 12.3.8 Subsegment Pricing and Adoption Trends
- 12.3.9 Leading Suppliers and Competition
- 12.3.10 Regional Demand and Opportunities
- 12.4 By End-Use Sector - Market Size and Forecast, 2025-2035
- 12.4.1 Segment Definition and Scope
- 12.4.2 Historical Market Size, 2018-2025
- 12.4.3 Revenue Forecast, 2025-2035
- 12.4.4 Volume Forecast, 2025-2035
- 12.4.5 Base-Year Market Share, 2025
- 12.4.6 Segment CAGR and Growth Drivers
- 12.4.7 Subsegment Market Size and Forecast
- 12.4.7.1 Telecom Operators
- 12.4.7.2 Enterprises and Data Centres
- 12.4.7.3 Government and Defence
- 12.4.8 Subsegment Pricing and Adoption Trends
- 12.4.9 Leading Suppliers and Competition
- 12.4.10 Regional Demand and Opportunities
- 12.5 By Ownership Model - Market Size and Forecast, 2025-2035
- 12.5.1 Segment Definition and Scope
- 12.5.2 Historical Market Size, 2018-2025
- 12.5.3 Revenue Forecast, 2025-2035
- 12.5.4 Volume Forecast, 2025-2035
- 12.5.5 Base-Year Market Share, 2025
- 12.5.6 Segment CAGR and Growth Drivers
- 12.5.7 Subsegment Market Size and Forecast
- 12.5.7.1 Integrated Carrier-Owned Networks
- 12.5.7.2 Independent Wholesale Networks
- 12.5.7.3 Utility-Owned Commercial Networks
- 12.5.8 Subsegment Pricing and Adoption Trends
- 12.5.9 Leading Suppliers and Competition
- 12.5.10 Regional Demand and Opportunities
- 12.6 By Contracting Model - Market Size and Forecast, 2025-2035
- 12.6.1 Segment Definition and Scope
- 12.6.2 Historical Market Size, 2018-2025
- 12.6.3 Revenue Forecast, 2025-2035
- 12.6.4 Volume Forecast, 2025-2035
- 12.6.5 Base-Year Market Share, 2025
- 12.6.6 Segment CAGR and Growth Drivers
- 12.6.7 Subsegment Market Size and Forecast
- 12.6.7.1 Recurring Fibre Leases
- 12.6.7.2 Indefeasible Rights of Use
- 12.6.7.3 Build-to-Suit Agreements
- 12.6.8 Subsegment Pricing and Adoption Trends
- 12.6.9 Leading Suppliers and Competition
- 12.6.10 Regional Demand and Opportunities
- 12.7 By State - Market Size and Forecast, 2025-2035
- 12.7.1 Segment Definition and Scope
- 12.7.2 Historical Market Size, 2018-2025
- 12.7.3 Revenue Forecast, 2025-2035
- 12.7.4 Volume Forecast, 2025-2035
- 12.7.5 Base-Year Market Share, 2025
- 12.7.6 Segment CAGR and Growth Drivers
- 12.7.7 Subsegment Market Size and Forecast
- 12.7.7.1 New South Wales
- 12.7.7.2 Victoria
- 12.7.7.3 Queensland
- 12.7.7.4 Remaining States and Territories
- 12.7.8 Subsegment Pricing and Adoption Trends
- 12.7.9 Leading Suppliers and Competition
- 12.7.10 Regional Demand and Opportunities
- 12.8 Segment Growth Comparison
- 12.9 Segment Attractiveness and Priority Matrix
Chapter 13 Australia Dark Fiber Network End-Use and Application Market Outlook
- 13.1 End-Use Industry and Customer Demand Structure
- 13.2 Leading Applications and Customer Groups
- 13.3 End-Use Market Size, Share and Forecast
- 13.4 Major End-Use Industry Deep Dives
- 13.4.1 Customer Requirements and Use Cases
- 13.4.2 Demand and Replacement Cycles
- 13.4.3 Technical and Regulatory Considerations
- 13.4.4 Purchasing and Procurement Models
- 13.4.5 Leading Vendors and Distribution Channels
- 13.4.6 Forecast and Commercial Opportunities
- 13.5 Emerging Applications and Cross-Segment Demand
- 13.6 End-Use Industry Investment Priorities
Chapter 14 Australia Dark Fiber Network Geographic Market Outlook, 2025-2035
- 14.1 Domestic Market Distribution and Demand Clusters
- 14.2 State- or Province-Wise Market Size and Forecast, 2025-2035
- 14.3 City and Metropolitan Market Outlook
- 14.4 Industrial, Manufacturing and Commercial Clusters
- 14.5 Geographic Concentration of Key End Users
- 14.6 Local Pricing and Purchasing Differences
- 14.7 Domestic Production Facilities and Capacity Map
- 14.8 Local Infrastructure and Project Pipeline
- 14.9 State-Level Policy and Incentive Differences
- 14.10 Subnational Investment Hotspots and Opportunities
- 14.11 Distribution and Logistics Networks
- 14.12 Domestic Competitive Footprint
Chapter 15 Australia Dark Fiber Network Technology, Innovation and Sustainability Outlook
- 15.1 Technology Landscape and Maturity
- 15.2 Product, Process and Service Innovation
- 15.3 AI, Automation and Digital Tools in the Industry
- 15.4 Technology Adoption and Performance Benchmarking
- 15.5 Innovation Pipeline and R&D Investment
- 15.6 Patent and Intellectual Property Trends
- 15.7 Energy Efficiency and Resource Management
- 15.8 Sustainability, Recycling and Circularity
- 15.9 Technology Roadmap, 2025-2035
- 15.10 Risks of Obsolescence and Technology Substitution
Chapter 16 Australia Dark Fiber Network Market Key Strategic Imperatives
- 16.1 Growth and Market Entry Priorities
- 16.2 High-Return Products and Segments
- 16.3 Pricing, Profitability and Cost Optimization
- 16.4 Technology Investment and Product Differentiation
- 16.5 Supply Chain Localization and Resilience
- 16.6 Distribution and Customer Acquisition
- 16.7 Partnership, Acquisition and Capacity Strategy
- 16.8 Regional Expansion Priorities
- 16.9 Short-, Medium- and Long-Term Actions
Chapter 17 Competition Outlook
- 17.1 Industry Competition Characteristics
- 17.2 Market Structure and Concentration
- 17.3 Market Share and Competitive Positioning, 2025
- 17.4 Company-Wise Revenue and Product Benchmarking
- 17.5 Production and Service Capacity Benchmarking
- 17.6 Technology, Pricing and Differentiation
- 17.7 Regional Footprint and Distribution Strength
- 17.8 Mergers, Acquisitions and Strategic Alliances
- 17.9 New Entrants and Competitive Threats
- 17.10 Porter's Five Forces and Industry Attractiveness
- 17.11 Competitive Outlook, 2025-2035
Chapter 18 Company Profiles
- 18.1 Company Coverage and Selection Criteria
- 18.2 Telstra InfraCo
- 18.2.1 Business Description
- 18.2.2 Company Ownership and Geographic Presence
- 18.2.3 Product and Service Portfolio
- 18.2.4 Manufacturing and Operating Footprint
- 18.2.5 Production Capacity and Expansion Plans
- 18.2.6 Financial Performance and Investment
- 18.2.7 Market Share and Competitive Position
- 18.2.8 Technology and Innovation Capabilities
- 18.2.9 Strategic Alliances or Partnerships
- 18.2.10 Recent Developments
- 18.2.11 Growth Strategy and Outlook
- 18.3 Vocus Group
- 18.4 Optus Networks
- 18.5 Superloop
- 18.6 5G Networks
- 18.7 Nexthop
- 18.8 FibreconX
- 18.9 Aussie Broadband
- 18.10 Uecomm
- 18.11 PIPE Networks
- 18.12 Other Relevant Market Participants
Note: Every listed company is profiled on the structure shown under the first company. The company list is preliminary and may change based on research findings, market developments, data availability and client requirements.
Chapter 19 Disclaimer
- 19.1 Research and Forecast Disclaimer
- 19.2 Data Source and Estimation Limitations
Note: The depth of individual sections depends on data availability for this market. Volume, capacity, trade and other unit-based metrics are included where applicable.

