
Builders and asset owners link models to live site data
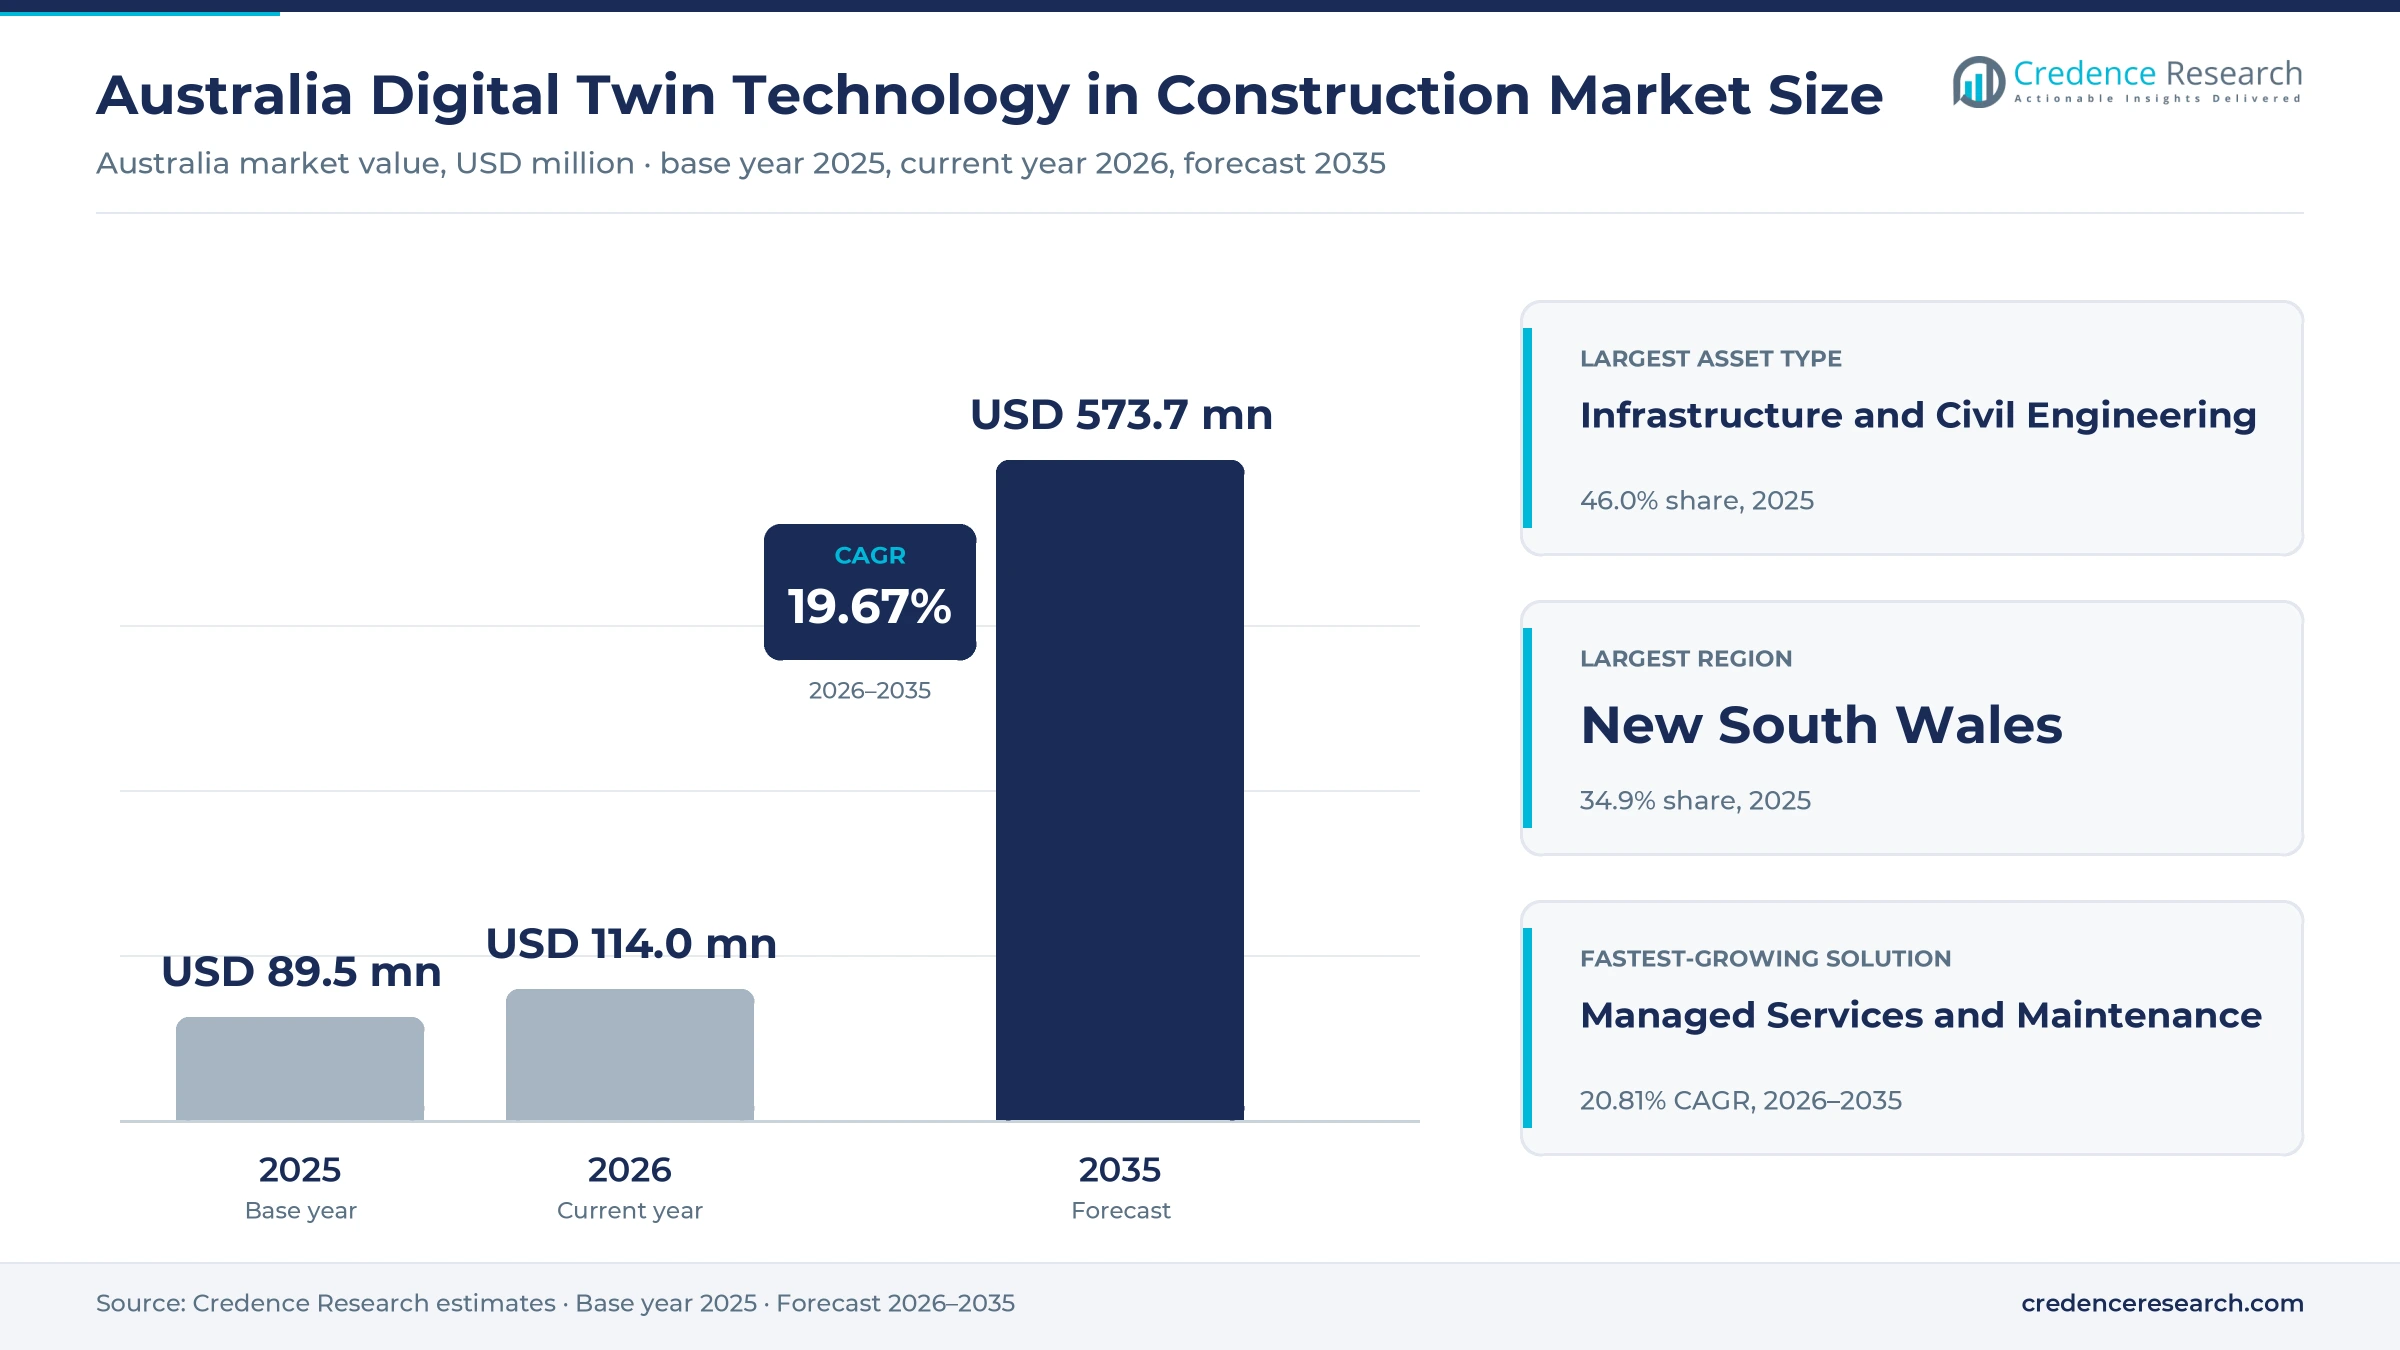
The Australia digital twin technology in construction market was valued at USD 89.5 million in 2025 and is projected to increase from USD 114.0 million in 2026 to USD 573.7 million by 2035, registering a CAGR of 19.67% during 2026–2035. Demand comes from contractors, state agencies, utilities and property owners that link design models, site scans and sensor feeds so that project information survives from design through handover into operations. New South Wales held the largest regional share, 34.9% in 2025, because Sydney carries the heaviest load of road, rail and water projects run on federated models. Queensland is the fastest-growing region at 20.26% a year, as the state prepares 17 new and upgraded venues for the Brisbane 2032 Games. Vendors have also added AI to their project platforms, and Bentley Systems announced AI-powered search for ProjectWise in October 2025.
Which project twin spending does the estimate count?
The estimate measures what Australian builders, engineers and asset owners spend on software, services and connected hardware that keep a live digital model of a construction asset. It covers platform licenses and subscriptions, integration and modeling services, site sensors and middleware, and managed support used during execution, commissioning and the operating life of the asset.
The estimate excludes general office software, standalone drafting tools bought without a connected data environment, and survey equipment sold for one-off measurement work. The value chain runs from global design software vendors and cloud providers, through engineering consultancies and integrators that federate the models, to contractors and public owners that use them on site and in operations.
Australia Digital Twin Technology in Construction Market Insights
- The Australia digital twin technology in construction market was valued at USD 89.5 million in 2025 and is projected to reach USD 573.7 million by 2035, registering a CAGR of 19.67% during 2026–2035.
- New South Wales held a 34.9% share of 2025 value, because Sydney road, rail and water owners already require federated models on major projects.
- Infrastructure and civil engineering led with a 46.0% share of 2025 value, as transport made up A$129 billion of the national public pipeline.
- Infrastructure Australia counted a shortage of about 141,000 public works staff in October 2025, which pushes contractors toward tools that save design and coordination hours.
- Managed services and maintenance grow fastest at 20.81% a year during 2026–2035, as public owners outsource the upkeep of twins after handover.
Civil works and software platforms lead 2025 spending
Why do software platforms hold the largest share?
Based on solution type, the market is categorized into software licences and SaaS platforms, professional services and systems integration, dedicated IoT hardware and middleware, and managed services and maintenance. Software Licences and SaaS Platforms led with a 42.0% share of 2025 value, because every project twin runs on a licensed or subscribed platform. Managed Services and Maintenance grow fastest at 20.81% a year, as owners pay partners to keep twins current once contractors leave the site.
How do civil works and buildings split spending?
Based on construction asset type, the market is categorized into infrastructure and civil engineering, commercial and public buildings, high-density residential buildings and industrial and logistics buildings. Infrastructure and Civil Engineering led with a 46.0% share of 2025 value, because road, rail and water owners set strict model rules. High-Density Residential Buildings grow fastest at 20.52% a year, while warehouses and data center build programs add steady industrial work.
Which project stages carry the most spending?
Based on application, the market is categorized into construction execution, commissioning and handover, and asset lifecycle operations. Construction Execution led with a 44.0% share of 2025 value, because clash checks, 4D staging and progress tracking pay back during building work. Asset Lifecycle Operations grow fastest at 20.38% a year, as owners such as Sydney Water move project models into their operating systems.
Which buyers fund most project twins?
Based on customer type, the market is categorized into major contractors, government and public asset owners, property developers and real estate investment trusts, and specialist contractors and engineering consultants. Major Contractors led with a 36.0% share of 2025 value, because tier one builders run the largest coordination programs. Government and Public Asset Owners grow fastest at 20.03% a year, as state agencies fund statewide spatial twins and asset information handover rules.
| Segment Group | Leading Sub-segment | Share, 2025 | Fastest-growing Sub-segment | CAGR, 2026–2035 |
|---|---|---|---|---|
| By Solution Type | Software Licences and SaaS Platforms | 42.0% | Managed Services and Maintenance | 20.81% |
| By Construction Asset Type | Infrastructure and Civil Engineering | 46.0% | High-Density Residential Buildings | 20.52% |
| By Application | Construction Execution | 44.0% | Asset Lifecycle Operations | 20.38% |
| By Customer Type | Major Contractors | 36.0% | Government and Public Asset Owners | 20.03% |
Request a Free Sample
Fill in your details and we'll send you a free sample report.
- Sample data tables & charts
- Research methodology
Pipeline size, energy rules and local platforms lift demand
How does a record public pipeline lift twin demand?
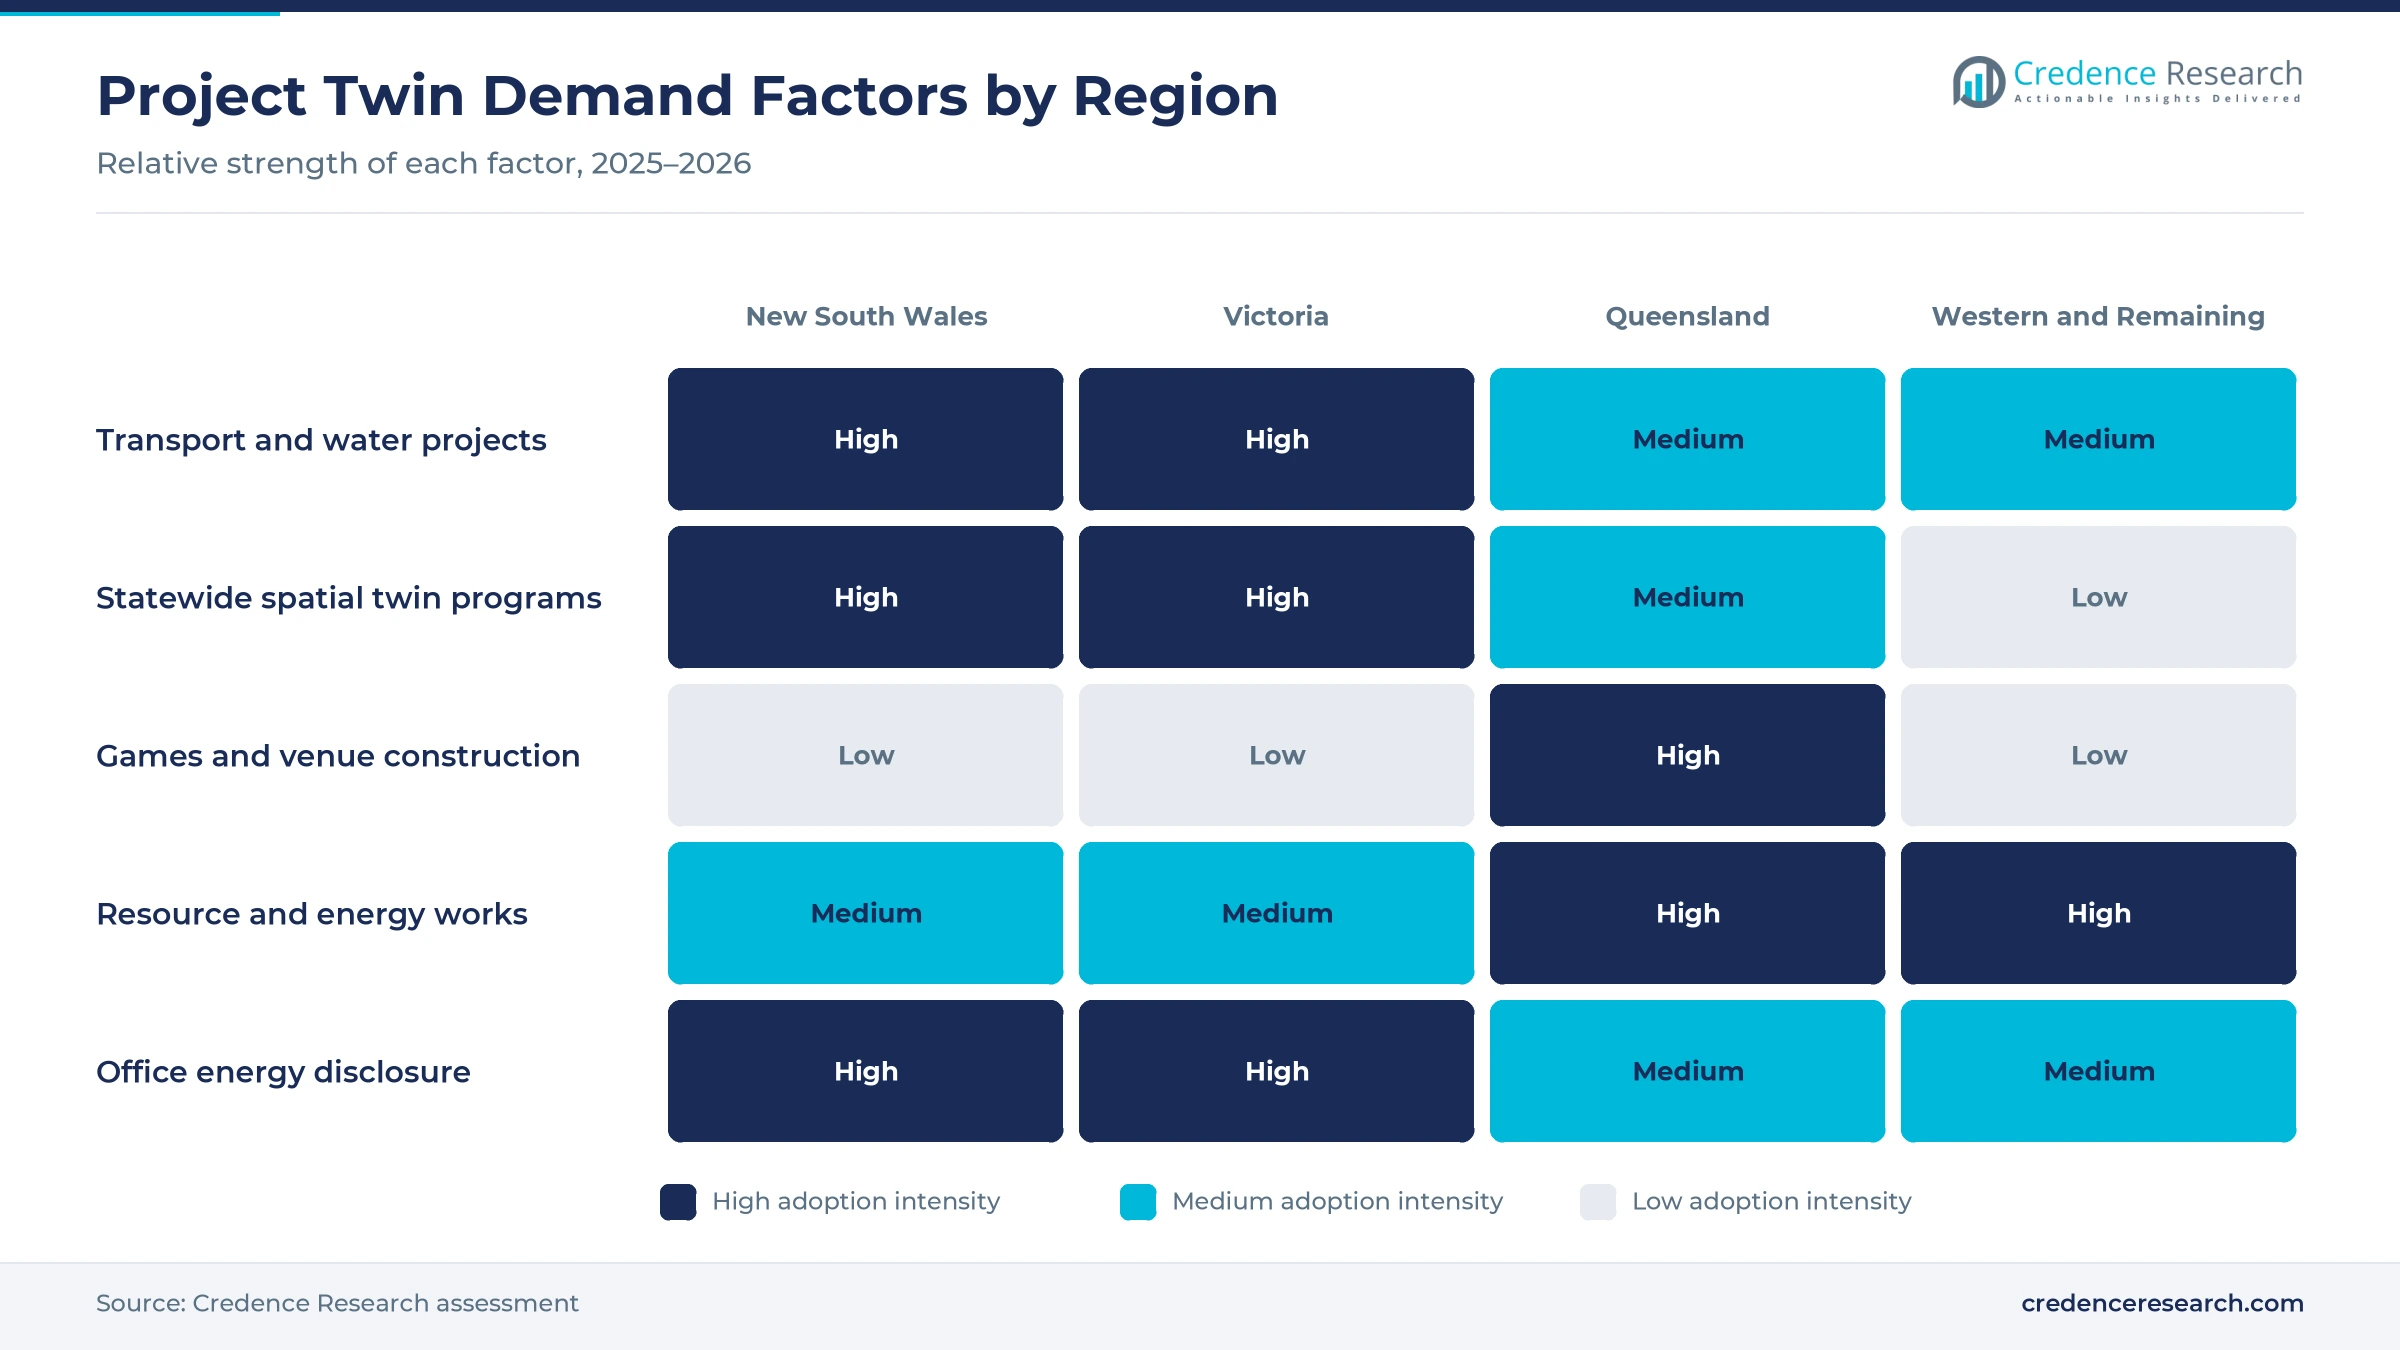
A larger public works pipeline raises demand for twins that carry design, build and asset data from one phase to the next without rework. The Infrastructure Australia 2025 market capacity report put the five-year Major Public Infrastructure Pipeline at A$242 billion, up 14% from A$213 billion a year earlier. Transport projects made up A$129 billion, or 53% of that pipeline, and these owners already ask for federated models. Sydney Water has staged its own rollout over 10 years, turning project information models into asset information models handed over for operations. As a result, infrastructure and civil engineering held 46.0% of 2025 value, the largest asset share.
Why do energy disclosure rules lift operations twins?
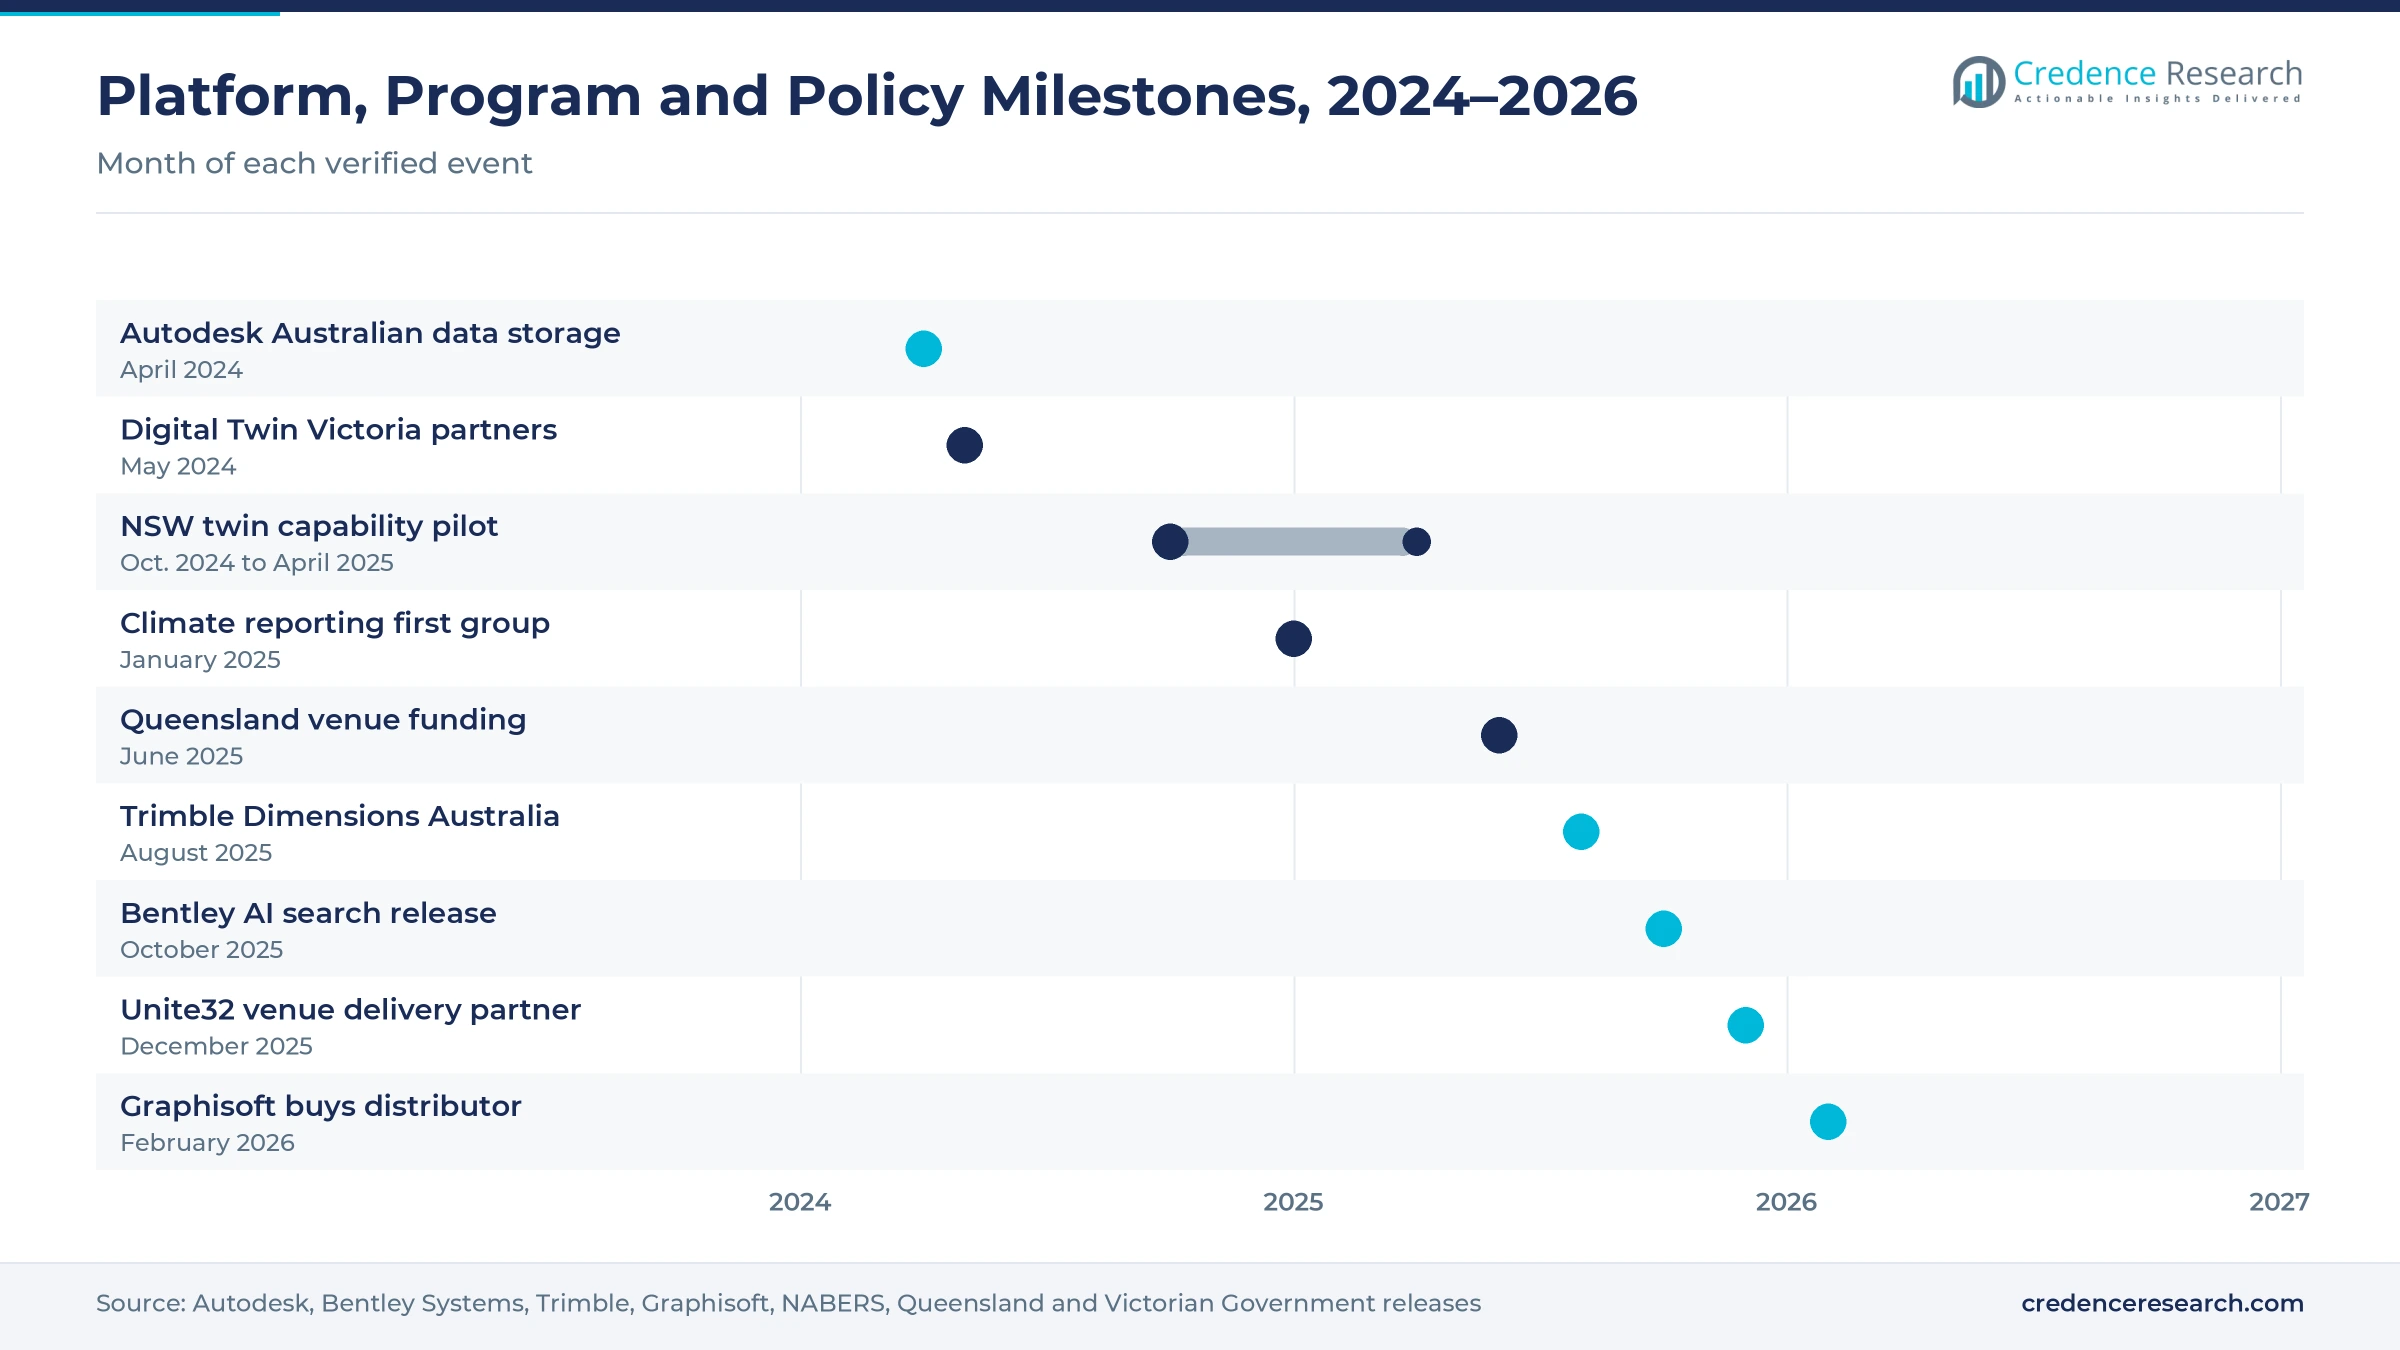
Building owners now need measured energy and asset performance data for disclosure, which favors twins that link sensors and meters to building models. The NABERS program said on Oct. 17, 2025, that the average energy intensity of rated office buildings has fallen 44% since 2011, saving users A$2.23 billion on energy bills. The Property Council welcomed a roadmap on Oct. 14, 2025, to widen mandatory disclosure beyond office space of more than 1,000 square meters, which must already disclose ratings on sale or lease. Mandatory climate reporting also began for the first group of large entities in financial years starting on or after Jan. 1, 2025, according to the Australian Securities and Investments Commission. In turn, asset lifecycle operations grow at 20.38% a year, the fastest application rate.
How do local hosting and partners widen platform uptake?
Global vendors have made their platforms easier to buy and host in Australia, which lowers the barrier for agencies and contractors with data residency rules. Autodesk added an Australian data storage option for selected Autodesk Construction Cloud products in April 2024, and engineering firm GHD welcomed the change. Graphisoft, part of the Nemetschek Group, acquired its Australian distributor from Central Innovation on Feb. 25, 2026, to sell directly in the Pacific region. Trimble also launched Dimensions Australia in Brisbane in August 2025, a user conference with more than 50 sessions that trains engineering and construction staff on its platforms. As a result, software licences and SaaS platforms held 42.0% of 2025 value.
Why do worker shortages push builders toward project twins?
Contractors face a deep shortage of engineers and trades, so they buy tools that cut design and coordination hours per project. Infrastructure Australia estimated a shortage of about 141,000 workers on public works in October 2025 and expects it to exceed 300,000 in mid-2027. The same report found that 64% of building and construction firms invested in digital tools such as building information modeling, AI and robotics in the past year. On the Warringah Freeway upgrade in Sydney, Bentley Systems reported that a federated iTwin model resolved more than 2,000 design clashes and saved 324,000 work hours. In turn, major contractors held 36.0% of 2025 value, the largest customer share.
Statewide twins, AI search and Games venues gain ground
How are statewide spatial twins changing projects?
State governments are building shared spatial twins, which give contractors a common base of terrain, property and utility data before design starts. NSW Spatial Services paid a Telstra-led consortium that included Bentley Systems A$1.86 million to build the beta state spatial digital twin. Its capability uplift pilot then trained 187 government, council, emergency and survey staff between October 2024 and April 2025. Victoria committed A$35.2 million over three years to Digital Twin Victoria, and in May 2024 it added a Veris-led consortium that includes Hexagon as a development partner. This public base helps government and public asset owners grow at 20.03% a year, the fastest customer rate.
Why is the rise of AI search reshaping project data work?
Vendors are adding AI to common data environments, which lets project teams find answers across thousands of files without opening each one. Bentley Systems announced AI-powered search with generated summaries for ProjectWise on Oct. 15, 2025, alongside Bentley Infrastructure Cloud Connect, which ingests more than 50 file formats. The same release added iTwin Capture reality modeling to Cesium ion, producing AI-annotated 3D views from site imagery. Infrastructure Australia also noted that, worldwide, AI-skills job postings in construction rose 21% in 2024, while tech roles made up 7% of construction postings. These tools lift demand for platforms that sit beside project management software on large sites.
How do Brisbane 2032 venues open new twin work?
The Brisbane 2032 venue program gives vendors a fixed-deadline portfolio where owners want one model from design to operations. The Queensland Government set a A$7.1 billion funding envelope for the venue program in its June 24, 2025, budget, including a new main stadium at Victoria Park. The Games authority then appointed Unite32, an AECOM and Laing O'Rourke joint venture, in December 2025 to oversee 17 new and upgraded venues from the Gold Coast to Cairns. Queensland had already allocated preliminary 2023-24 budget funding to investigate a South East Queensland digital twin for land and infrastructure planning. Queensland owners therefore add venue and transport twin programs faster than owners in any other zone.
Why do housing and transmission programs offer new openings?
Social housing and grid programs create large repeat portfolios where owners gain from standard twins across many similar assets. Infrastructure Australia reported that social and affordable housing in the public pipeline rose to A$28 billion from A$17 billion, while transmission rose to A$15 billion from A$4 billion. About 87.7% of Australians lived in urban areas in 2025, according to the World Bank, which keeps pressure on dense apartment and transit corridors. Buildings also made up 62% of the A$1.14 trillion total construction pipeline. As a result, high-density residential buildings grow at 20.52% a year, the fastest asset rate, beside wider residential and commercial building work.
Skills gaps and uneven subcontractor uptake slow rollouts
How do skills gaps limit twin rollouts?
Twins need modelers, data managers and engineers who understand both design files and asset systems, and these staff are scarce across the country. About 60% of firms surveyed by Infrastructure Australia cited labor and skills as a significant threat to delivery. As a result, contractors often limit twins to the largest projects and lean on vendor partners for setup. Vendors respond with training programs, templates and managed services that reduce the in-house skill load.
Why does uneven subcontractor uptake break data chains?
Subcontractors deliver 41% of infrastructure construction work, according to Infrastructure Australia, yet many small firms still run their site records on paper and spreadsheets. The same report found that 26% of building and construction firms made no digital investment in the past year. In turn, data from site trades often reaches the twin late or incomplete. Principal contractors respond with simple mobile capture tools and model requirements written into subcontracts.
How do handover and format gaps slow operations use?
Many owners receive models at handover that do not match the asset registers and maintenance systems they run every day. Sydney Water staged its rollout over 10 years, spending the first five years building asset information models before moving them into its operating environment. As a result, twins built for construction often stop being updated after completion. Owners respond with asset information requirements, open standards and integrators that map model data into operating systems.
Why does uneven project timing affect vendor revenue?
Twin spending follows project awards, so delays and shifts in public works timing can push contracts back by quarters. Engineering construction work done fell 4.7% in the June quarter of 2026, according to the Australian Bureau of Statistics. Infrastructure Australia also moved the expected investment peak to 2027, a year later than it projected before. Vendors respond with subscription models and owner-side operations work that does not depend on new construction starts.
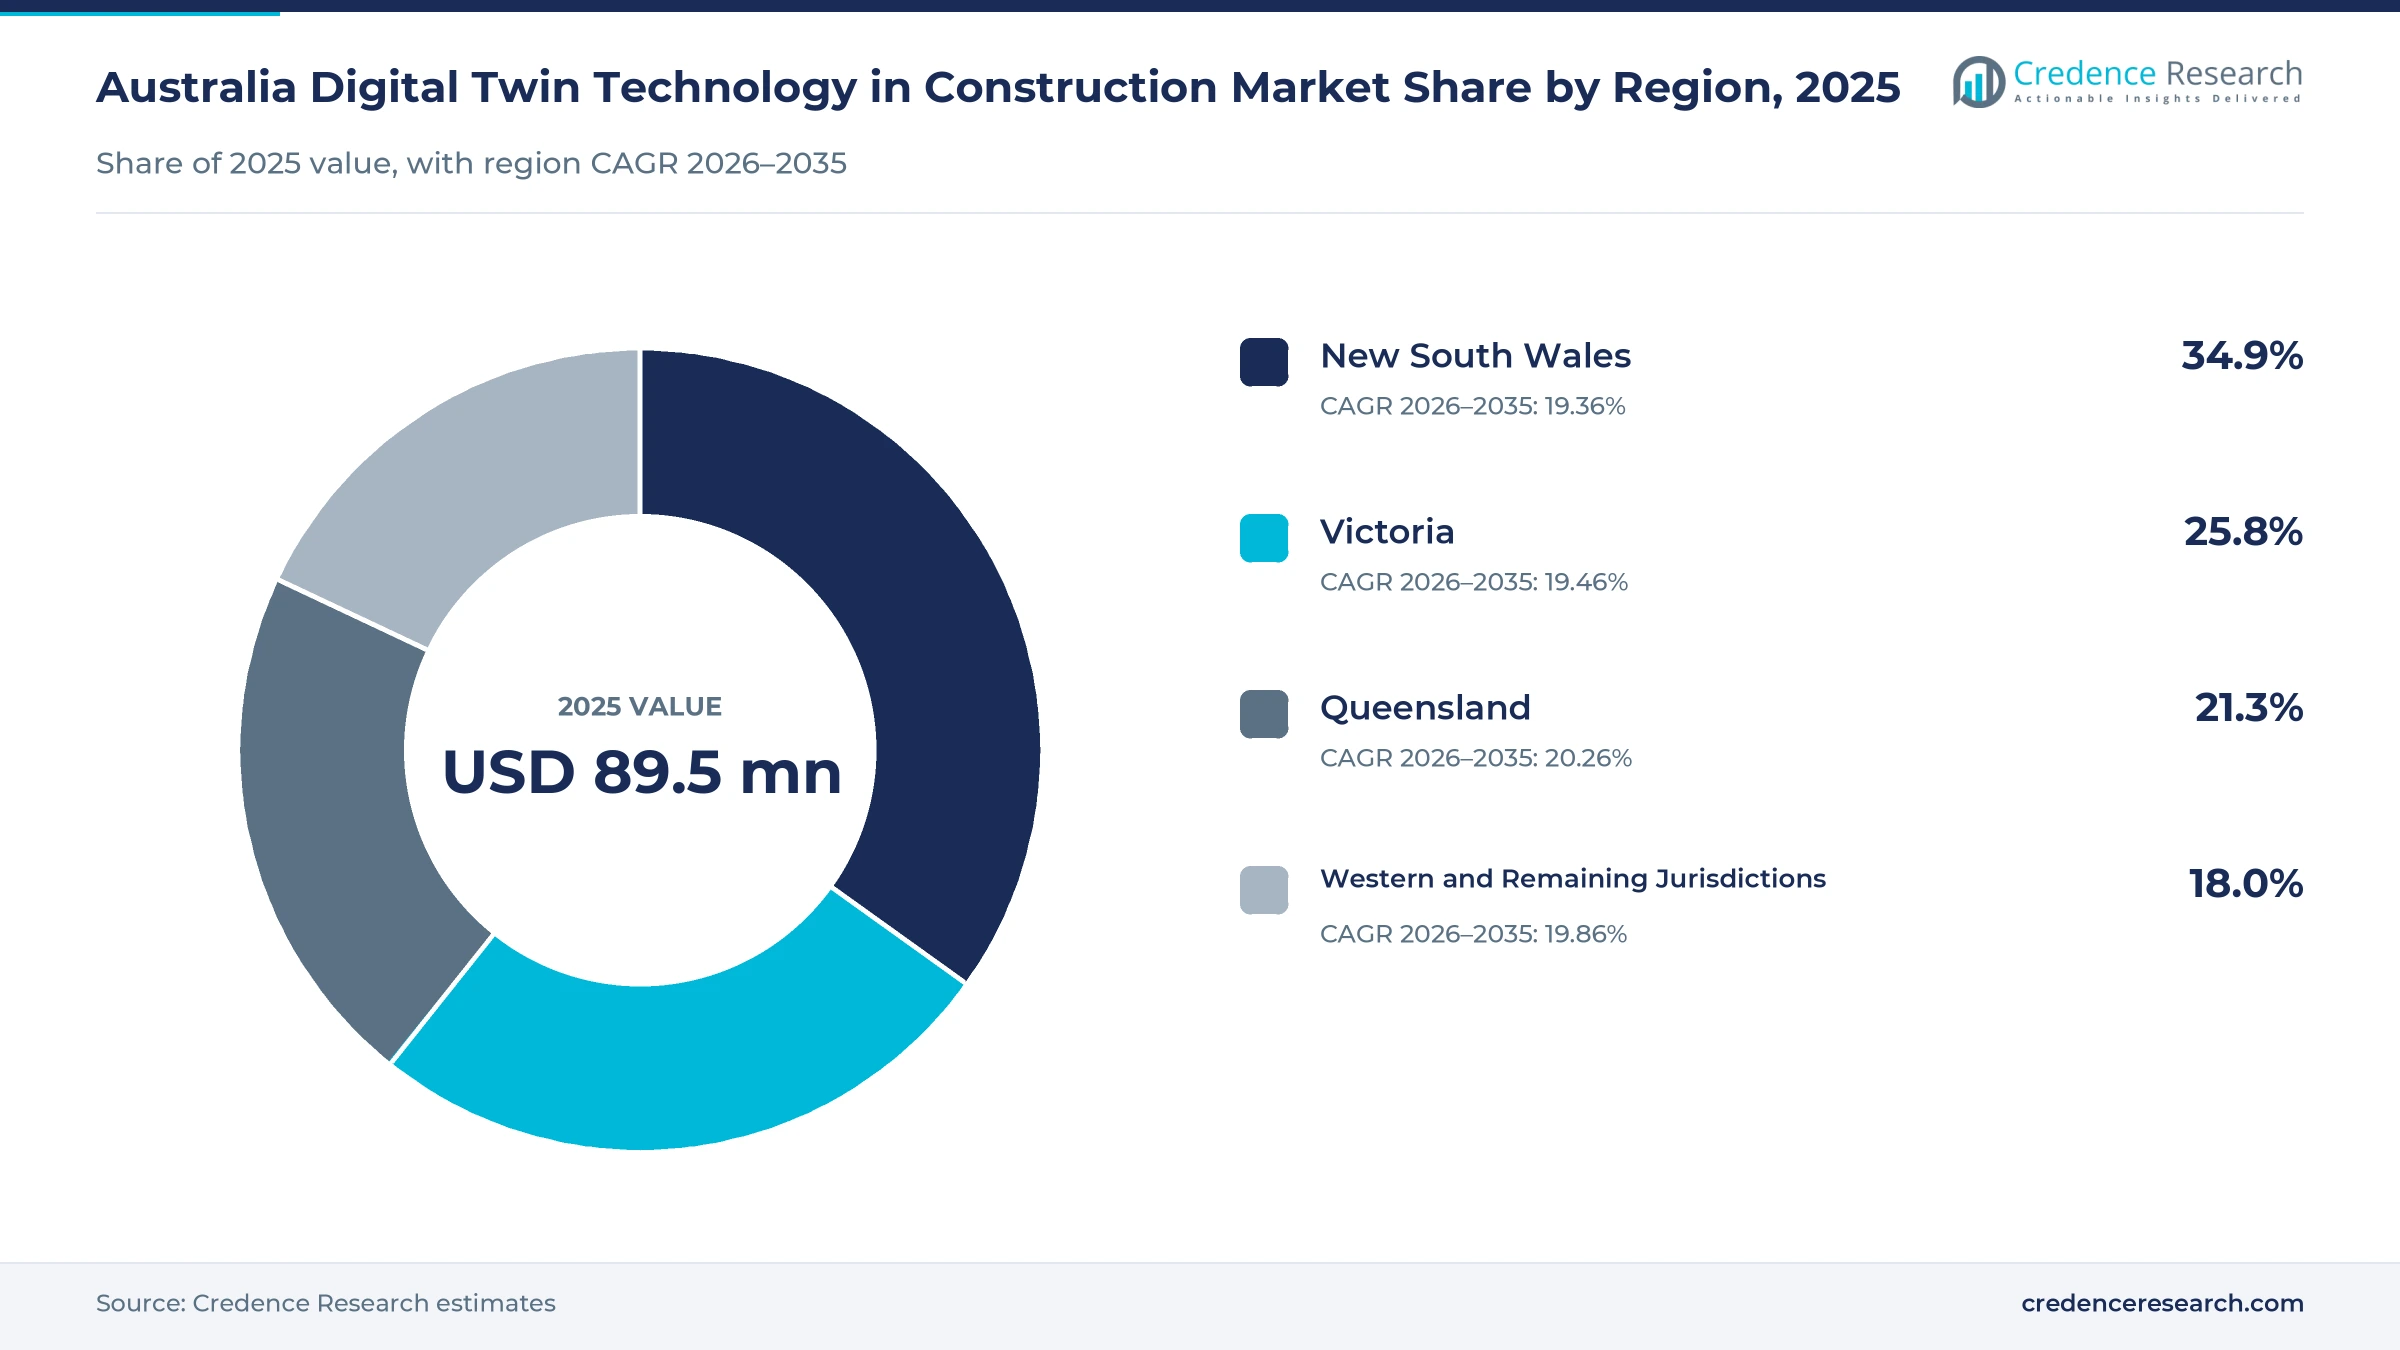
New South Wales leads as Queensland grows fastest
| Region | Value, 2025 (USD million) | Share, 2025 | CAGR, 2026–2035 |
|---|---|---|---|
| New South Wales | 31.2 | 34.9% | 19.36% |
| Victoria | 23.1 | 25.8% | 19.46% |
| Queensland | 19.1 | 21.3% | 20.26% |
| Western and Remaining Jurisdictions | 16.1 | 18.0% | 19.86% |
Why do Sydney road and water owners give the state the lead?
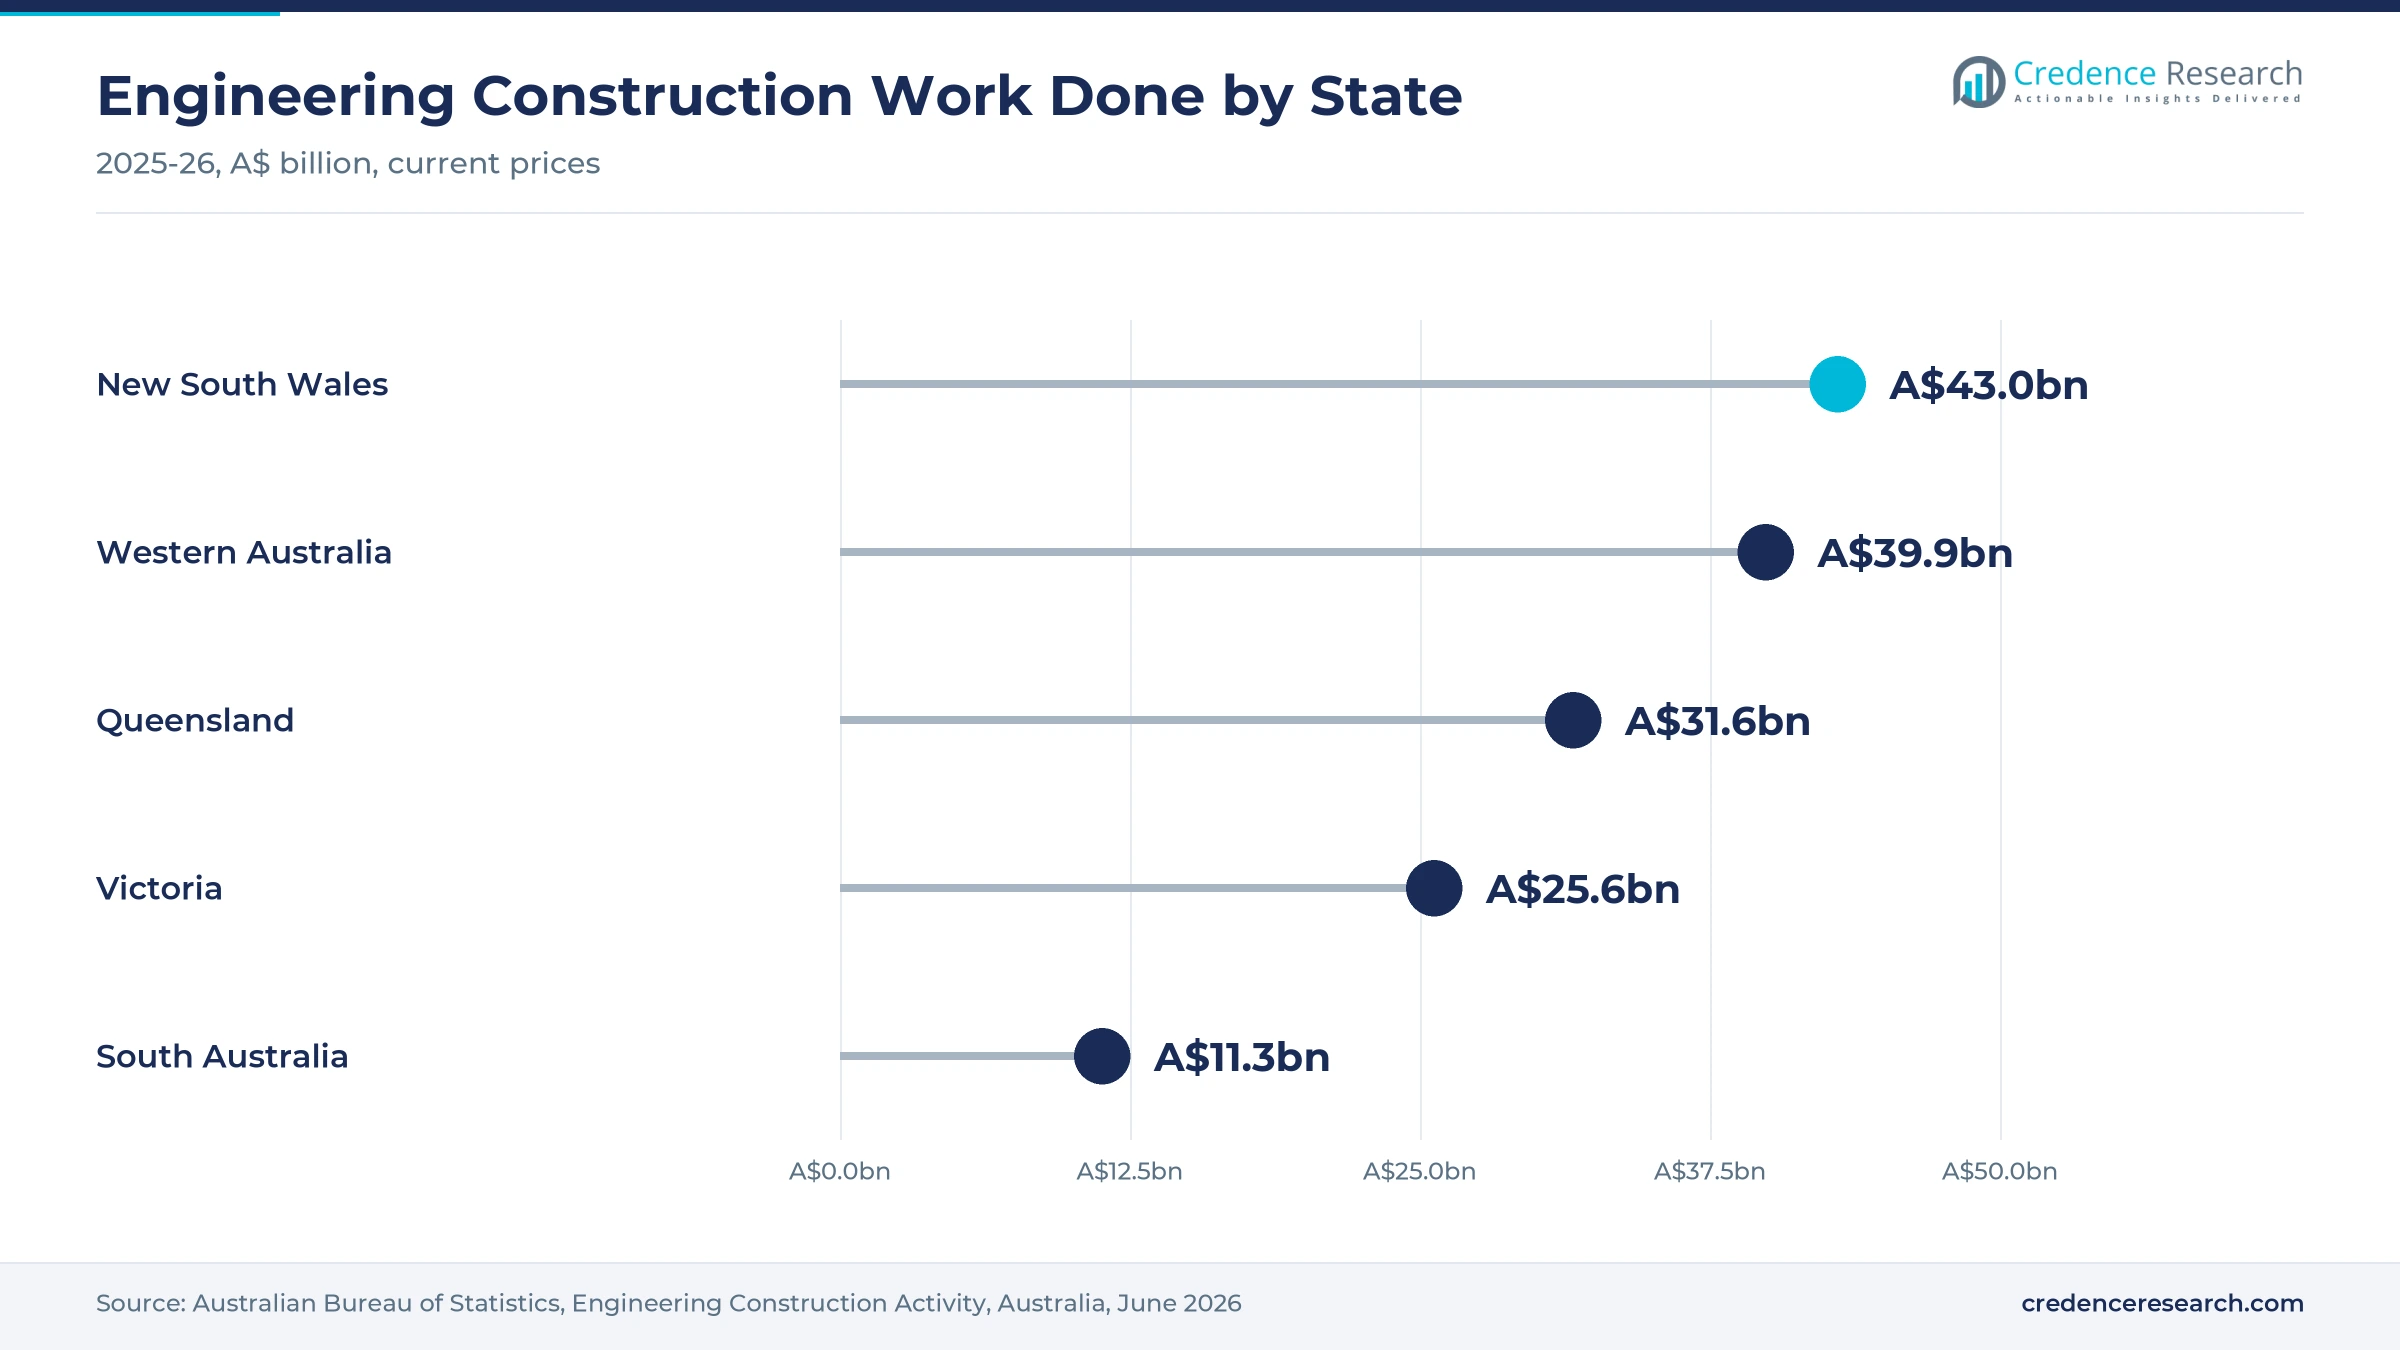
New South Wales held a 34.9% share of 2025 value and grows at 19.36% a year, because Sydney carries the largest load of transport and water projects. The state recorded about A$43.0 billion of engineering construction work in 2025-26, the highest of any state, according to the Australian Bureau of Statistics. NSW Spatial Services also operates the state spatial digital twin, which gives contractors a shared base of terrain, property and utility data. Large owners therefore keep federated models standard on major work.
How does Victoria build on its statewide twin platform?
Victoria held a 25.8% share of 2025 value and grows at 19.46% a year, because Melbourne hosts large rail, road and building programs. The state recorded about A$25.6 billion of engineering construction work in 2025-26, according to the Australian Bureau of Statistics. Digital Twin Victoria received A$35.2 million over three years and added Telstra, Datacom and a Veris-led consortium as partners in May 2024. As a result, Victorian agencies give contractors a shared spatial base for planning and design.
Why does Queensland lead growth in project twin spending?
Queensland held a 21.3% share of 2025 value and grows fastest at 20.26% a year, because Games venues and regional infrastructure add work quickly. Infrastructure Australia reported that the public pipeline for Queensland and the Northern Territory rose by A$4 billion to A$51 billion. The state also recorded about A$31.6 billion of engineering construction work in 2025-26, and Trimble chose Brisbane for its new Australian user conference in August 2025. In turn, venue and transport owners add new twin programs.
How do the western and remaining jurisdictions add demand?
Western Australia, South Australia, Tasmania and the two territories held 18.0% of 2025 value and grow at 19.86% a year, because resource, energy and transport work is spread across remote sites. Western Australia recorded about A$39.9 billion of engineering construction work in 2025-26, second only to New South Wales. Infrastructure Australia also counted A$15 billion of transmission projects in the public pipeline, much of it in remote corridors that suit monitored twins. As a result, owners in these zones adopt twins for remote monitoring.
Platform launches, state programs and venue contracts
| Development | Status and market relevance |
|---|---|
| In April 2024, Autodesk introduced an Australian data storage option for selected Autodesk Construction Cloud products. | Supports buyers with data residency rules |
| In May 2024, Digital Twin Victoria added Telstra, Datacom and a Veris-led consortium that includes Hexagon as partners. | Widens the statewide spatial twin network |
| In June 2025, the Queensland budget set a A$7.1 billion funding envelope for the Brisbane 2032 venue program. | Creates a large owner-led twin portfolio |
| In October 2025, Bentley Systems released AI-powered ProjectWise search and Bentley Infrastructure Cloud Connect. | Adds AI to project data environments |
| In February 2026, Graphisoft, part of the Nemetschek Group, acquired its Australian distributor from Central Innovation. | Gives the vendor a direct local sales presence |
Federated models, reality capture and AI search lead
- Federated design models join road, bridge and structure models in one browser view, which lets owners and agencies review designs without installing specialist software.
- Reality capture turns drone and laser scans into 3D meshes that show actual site progress, which helps teams compare built work against the design model.
- 4D staging simulation links the schedule to the model so teams can test construction sequences, which shortened the Warringah Freeway program by six to eight weeks.
- AI-powered search returns summaries from project files across a common data environment, which saves engineers time when they check design and handover records.
Need a Custom Version of This Report?
Tailor the scope, geography, or segments to your exact requirements.
- Custom geography or segment scope
- Direct access to our analyst team
Design software vendors compete through local partners
Competition centers on global design and engineering software vendors that sell platforms through local consultancies, integrators and state program consortia. Bentley Systems supplies the iTwin and ProjectWise platforms used on the Warringah Freeway upgrade and was part of the Telstra-led consortium that built the NSW spatial digital twin. Autodesk serves contractors through Autodesk Construction Cloud, now with an Australian data storage option. Trimble targets site and engineering teams and launched its Dimensions Australia user conference in Brisbane in 2025. Hexagon joined the Veris-led consortium developing Digital Twin Victoria, while the Nemetschek Group sells directly through Graphisoft after its 2026 distributor purchase. Rivals compete on local hosting, open data formats, AI features and partner reach.
Which software vendors lead Australian project twins?
| Company | Type | Role in the market |
|---|---|---|
| Bentley Systems | Infrastructure engineering software vendor | iTwin model on the Warringah Freeway upgrade |
| Autodesk | Design and construction software vendor | Australian data storage for Autodesk Construction Cloud |
| Trimble | Construction technology vendor | Dimensions Australia user conference in Brisbane |
| Hexagon | Reality capture and geospatial vendor | Member of the Digital Twin Victoria development consortium |
| Nemetschek Group | Building design software group | Direct Australian sales through Graphisoft |
Credence Research view on Australian project twins
Credence Research's view is that Australian project twins will move from design coordination tools to operating systems for public assets over the forecast period. Civil infrastructure keeps the largest share because transport and water owners set strict model rules, while operations work and managed services grow faster as owners keep twins current after handover. Queensland gains most from the Games venues and regional works. Vendors that pair onshore hosting with open formats and practical AI search should win the most share by 2035.
Pipeline data, state programs and vendor releases
The report uses 2025 as the base year on a calendar basis, and market values come from the Credence Research model. That model combines Infrastructure Australia pipeline and workforce data, Australian Bureau of Statistics engineering construction statistics, state digital twin program records, energy disclosure releases and vendor announcements. Segment splits and zone growth rates are Credence Research estimates. Sources used are statistics agency and government publications, company releases and international agency data, and no interviews or surveys were used.
Operations twins and Games venues carry demand to 2035
The Australia digital twin technology in construction market is expected to reach USD 573.7 million by 2035, a 19.67% CAGR during 2026–2035, as builders and owners keep one model from design through operations. Growth should be strongest in managed services, asset lifecycle operations, high-density residential buildings, public asset owners and Queensland, because these areas gain most from handover rules, energy disclosure and the Games venues. Skills gaps and uneven subcontractor uptake could slow some projects, while local hosting should support regulated buyers.
Frequently Asked Questions
How big is the Australia digital twin technology in construction market?
Which asset type leads the market?
Which region leads the market?
How large is the Australian public infrastructure pipeline?
How do project twins save time on Australian projects?
Which solution type grows fastest?
Who are the leading companies in the market?
What are the main challenges for the market?
Table of Content
Chapter 1 Market Segmentation
- 1.1 Segmentation Framework
- 1.1.1 Product and Service Classification
- 1.1.2 Application and End-Use Classification
- 1.1.3 Technology and Solution Classification
- 1.1.4 Customer and Distribution Channel Classification
- 1.1.5 Geographic Segmentation
- 1.1.6 Market Segment Definitions and Boundaries
- 1.2 By Solution Type
- 1.2.1 Software Licences and SaaS Platforms
- 1.2.2 Professional Services and Systems Integration
- 1.2.3 Dedicated IoT Hardware and Middleware
- 1.2.4 Managed Services and Maintenance
- 1.3 By Construction Asset Type
- 1.3.1 Infrastructure and Civil Engineering
- 1.3.2 Commercial and Public Buildings
- 1.3.3 High-Density Residential Buildings
- 1.3.4 Industrial and Logistics Buildings
- 1.4 By Application
- 1.4.1 Construction Execution
- 1.4.2 Commissioning and Handover
- 1.4.3 Asset Lifecycle Operations
- 1.5 By Customer Type
- 1.5.1 Major Contractors
- 1.5.2 Government and Public Asset Owners
- 1.5.3 Property Developers and Real Estate Investment Trusts
- 1.5.4 Specialist Contractors and Engineering Consultants
Chapter 2 Introduction
- 2.1 Report Objectives and Scope
- 2.2 Product Definition and Industry Terminology
- 2.3 Market Inclusions and Exclusions
- 2.4 Research Process
- 2.4.1 Primary Research and Expert Interviews
- 2.4.2 Secondary Research and Source Review
- 2.4.3 Top-Down and Bottom-Up Estimation
- 2.4.4 Data Triangulation and Verification
- 2.5 Market Size Measurement Basis
- 2.5.1 2025: USD 89.5 million → 2035: USD 573.7 million
- 2.6 Historical and Forecast Reference Periods
- 2.6.1 Historical Period: 2018-2025
- 2.6.2 Base Year: 2025
- 2.6.3 Forecast Period: 2025-2035
- 2.7 Research Assumptions and Limitations
Chapter 3 Executive Summary
- 3.1 Market Snapshot and Key Findings
- 3.2 Base-Year Market Size, 2025
- 3.3 Forecast Market Size, 2035
- 3.4 Revenue and Volume Growth Outlook
- 3.5 Key Demand and Supply Indicators
- 3.6 Leading Market Segments
- 3.7 Fastest-Growing Market Opportunities
- 3.8 Regional Performance Highlights
- 3.9 Technology and Industry Transformation
- 3.10 Competitive Landscape Summary
- 3.11 Analyst View and Strategic Implications
Chapter 4 Australia Digital Twin Technology in Construction Market Trends and Developments
- 4.1 Historical Industry Development, 2018-2025
- 4.2 Recent Market Trends and Developments
- 4.3 Demand and Customer Behavior Trends
- 4.4 Technology and Product Innovation
- 4.5 Artificial Intelligence, Automation and Digitalization
- 4.6 Local Manufacturing and Supply Chain Realignment
- 4.7 Industry Partnerships, Mergers and Acquisitions
- 4.8 Sustainability and Circular Economy Developments
- 4.9 Government and Private Sector Investment Trends
- 4.10 Emerging Business Models and Commercialization
- 4.11 Industry Developments and Announcements
Chapter 5 Australia Digital Twin Technology in Construction Market Production, Supply and Demand Analysis
- 5.1 Demand Trend and Consumption Analysis, 2018-2025
- 5.2 Demand Forecast, 2025-2035
- 5.3 Production and Output Trend, 2018-2025
- 5.4 Production and Output Forecast, 2025-2035
- 5.5 Installed Capacity and Capacity Utilization
- 5.6 Company-Wise Production Plants and Statistics
- 5.6.1 Installed Production Capacity
- 5.6.2 Actual Production
- 5.6.3 Planned Capacity and Expansion Targets
- 5.7 Supply Chain Structure and Procurement Trends
- 5.8 Supply-Demand Gap and Bottlenecks
- 5.9 Import Dependence and Sourcing Structure
- 5.10 Contract Manufacturing and Outsourcing
- 5.11 Regional Supply and Demand Concentration
Chapter 6 Australia Digital Twin Technology in Construction Market Pricing Analysis
- 6.1 Pricing Structure and Measurement
- 6.2 Historical Pricing Trends, 2018-2025
- 6.3 Pricing Outlook, 2025-2035
- 6.4 Average Selling Price and Unit Economics
- 6.5 Pricing by Product and Market Segment
- 6.6 Geographic Pricing Differences
- 6.7 Key Input, Energy, Labor and Logistics Costs
- 6.8 Contract Pricing and Purchasing Models
- 6.9 Pricing Sensitivity and Competitive Positioning
- 6.10 Price, Margin and Profitability Implications
Chapter 7 Australia Digital Twin Technology in Construction Market Dynamics
- 7.1 Market Growth Drivers
- 7.1.1 Demand-Side Drivers
- 7.1.2 Technology and Innovation Drivers
- 7.1.3 Infrastructure and Investment Drivers
- 7.1.4 Regulatory and Policy Drivers
- 7.2 Market Restraints
- 7.2.1 Cost and Affordability Constraints
- 7.2.2 Technology and Adoption Barriers
- 7.2.3 Supply Chain and Operational Constraints
- 7.3 Market Challenges
- 7.3.1 Competitive Pressure and Margin Erosion
- 7.3.2 Skills, Infrastructure and Implementation Gaps
- 7.4 Emerging Market Opportunities
- 7.5 Market Dynamics Impact and Time-Horizon Assessment
Chapter 8 Australia Digital Twin Technology in Construction Value Chain Analysis
- 8.1 Industry Value Chain Overview
- 8.2 Upstream Suppliers and Critical Inputs
- 8.3 Technology and Component Providers
- 8.4 Manufacturing or Service Delivery
- 8.5 Distribution, Channel Partners and Integrators
- 8.6 Downstream Applications and End Users
- 8.7 Value Addition and Profit Pools
- 8.8 Vertical Integration and Outsourcing
- 8.9 Supplier Concentration and Risk
- 8.10 Supply Chain Localization and Resilience
Chapter 9 Australia Digital Twin Technology in Construction Market Regulations and Policies
- 9.1 Relevant Laws, Standards and Compliance Frameworks
- 9.2 Product, Service, Safety and Quality Requirements
- 9.3 Government Policies, Incentives and Subsidies
- 9.4 Imports, Exports and Trade Barriers
- 9.5 Public Procurement and Local Content Requirements
- 9.6 Environmental and Sustainability Compliance
- 9.7 Data Protection, AI and Cybersecurity Compliance
- 9.8 Upcoming Policy Changes and Market Implications
Chapter 10 Australia Digital Twin Technology in Construction Market Hotspots and Opportunities
- 10.1 Market Opportunity Mapping and Growth Hotspots
- 10.2 High-Growth Applications and Customer Groups
- 10.3 Underserved Markets and White-Space Opportunities
- 10.4 Emerging Technology and Product Opportunities
- 10.5 New Capacity and Investment Hotspots
- 10.6 Market Entry and Expansion Opportunities
- 10.7 Distribution and Partnership Opportunities
- 10.8 Near-Term and Long-Term Commercial Potential
- 10.9 Opportunity Attractiveness and Execution Risks
Chapter 11 Australia Digital Twin Technology in Construction Market Outlook, 2025-2035
- 11.1 Market Size and Analysis
- 11.1.1 Revenue (Market Measurement: 2025: USD 89.5 million → 2035: USD 573.7 million)
- 11.1.2 Market Volume and Quantity Sold
- 11.1.3 Historical Market Size, 2018-2025
- 11.1.4 Base-Year Market Size, 2025
- 11.2 Market Forecast, 2025-2035
- 11.2.1 Revenue Forecast to 2035
- 11.2.2 Volume Forecast to 2035
- 11.2.3 CAGR and Year-on-Year Growth
- 11.2.4 Incremental Revenue Opportunity
- 11.3 Forecast Assumptions and Scenario Analysis
- 11.3.1 Base-Case Forecast
- 11.3.2 Optimistic and Conservative Scenarios
- 11.3.3 Technology, Pricing and Policy Sensitivities
- 11.4 Market Attractiveness and Growth Outlook
Chapter 12 Australia Digital Twin Technology in Construction Market Segmentation and Outlook
- 12.1 Segmentation Summary and Market Shares, 2025
- 12.2 Largest and Fastest-Growing Segments
- 12.3 By Solution Type - Market Size and Forecast, 2025-2035
- 12.3.1 Segment Definition and Scope
- 12.3.2 Historical Market Size, 2018-2025
- 12.3.3 Revenue Forecast, 2025-2035
- 12.3.4 Volume Forecast, 2025-2035
- 12.3.5 Base-Year Market Share, 2025
- 12.3.6 Segment CAGR and Growth Drivers
- 12.3.7 Subsegment Market Size and Forecast
- 12.3.7.1 Software Licences and SaaS Platforms
- 12.3.7.2 Professional Services and Systems Integration
- 12.3.7.3 Dedicated IoT Hardware and Middleware
- 12.3.7.4 Managed Services and Maintenance
- 12.3.8 Subsegment Pricing and Adoption Trends
- 12.3.9 Leading Suppliers and Competition
- 12.3.10 Regional Demand and Opportunities
- 12.4 By Construction Asset Type - Market Size and Forecast, 2025-2035
- 12.4.1 Segment Definition and Scope
- 12.4.2 Historical Market Size, 2018-2025
- 12.4.3 Revenue Forecast, 2025-2035
- 12.4.4 Volume Forecast, 2025-2035
- 12.4.5 Base-Year Market Share, 2025
- 12.4.6 Segment CAGR and Growth Drivers
- 12.4.7 Subsegment Market Size and Forecast
- 12.4.7.1 Infrastructure and Civil Engineering
- 12.4.7.2 Commercial and Public Buildings
- 12.4.7.3 High-Density Residential Buildings
- 12.4.7.4 Industrial and Logistics Buildings
- 12.4.8 Subsegment Pricing and Adoption Trends
- 12.4.9 Leading Suppliers and Competition
- 12.4.10 Regional Demand and Opportunities
- 12.5 By Application - Market Size and Forecast, 2025-2035
- 12.5.1 Segment Definition and Scope
- 12.5.2 Historical Market Size, 2018-2025
- 12.5.3 Revenue Forecast, 2025-2035
- 12.5.4 Volume Forecast, 2025-2035
- 12.5.5 Base-Year Market Share, 2025
- 12.5.6 Segment CAGR and Growth Drivers
- 12.5.7 Subsegment Market Size and Forecast
- 12.5.7.1 Construction Execution
- 12.5.7.2 Commissioning and Handover
- 12.5.7.3 Asset Lifecycle Operations
- 12.5.8 Subsegment Pricing and Adoption Trends
- 12.5.9 Leading Suppliers and Competition
- 12.5.10 Regional Demand and Opportunities
- 12.6 By Customer Type - Market Size and Forecast, 2025-2035
- 12.6.1 Segment Definition and Scope
- 12.6.2 Historical Market Size, 2018-2025
- 12.6.3 Revenue Forecast, 2025-2035
- 12.6.4 Volume Forecast, 2025-2035
- 12.6.5 Base-Year Market Share, 2025
- 12.6.6 Segment CAGR and Growth Drivers
- 12.6.7 Subsegment Market Size and Forecast
- 12.6.7.1 Major Contractors
- 12.6.7.2 Government and Public Asset Owners
- 12.6.7.3 Property Developers and Real Estate Investment Trusts
- 12.6.7.4 Specialist Contractors and Engineering Consultants
- 12.6.8 Subsegment Pricing and Adoption Trends
- 12.6.9 Leading Suppliers and Competition
- 12.6.10 Regional Demand and Opportunities
- 12.7 Segment Growth Comparison
- 12.8 Segment Attractiveness and Priority Matrix
Chapter 13 Australia Digital Twin Technology in Construction End-Use and Application Market Outlook
- 13.1 End-Use Industry and Customer Demand Structure
- 13.2 Leading Applications and Customer Groups
- 13.3 End-Use Market Size, Share and Forecast
- 13.4 Major End-Use Industry Deep Dives
- 13.4.1 Customer Requirements and Use Cases
- 13.4.2 Demand and Replacement Cycles
- 13.4.3 Technical and Regulatory Considerations
- 13.4.4 Purchasing and Procurement Models
- 13.4.5 Leading Vendors and Distribution Channels
- 13.4.6 Forecast and Commercial Opportunities
- 13.5 Emerging Applications and Cross-Segment Demand
- 13.6 End-Use Industry Investment Priorities
Chapter 14 Australia Digital Twin Technology in Construction Geographic Market Outlook, 2025-2035
- 14.1 Domestic Market Distribution and Demand Clusters
- 14.2 State- or Province-Wise Market Size and Forecast, 2025-2035
- 14.3 City and Metropolitan Market Outlook
- 14.4 Industrial, Manufacturing and Commercial Clusters
- 14.5 Geographic Concentration of Key End Users
- 14.6 Local Pricing and Purchasing Differences
- 14.7 Domestic Production Facilities and Capacity Map
- 14.8 Local Infrastructure and Project Pipeline
- 14.9 State-Level Policy and Incentive Differences
- 14.10 Subnational Investment Hotspots and Opportunities
- 14.11 Distribution and Logistics Networks
- 14.12 Domestic Competitive Footprint
Chapter 15 Australia Digital Twin Technology in Construction Technology, Innovation and Sustainability Outlook
- 15.1 Technology Landscape and Maturity
- 15.2 Product, Process and Service Innovation
- 15.3 AI, Automation and Digital Tools in the Industry
- 15.4 Technology Adoption and Performance Benchmarking
- 15.5 Innovation Pipeline and R&D Investment
- 15.6 Patent and Intellectual Property Trends
- 15.7 Energy Efficiency and Resource Management
- 15.8 Sustainability, Recycling and Circularity
- 15.9 Technology Roadmap, 2025-2035
- 15.10 Risks of Obsolescence and Technology Substitution
Chapter 16 Australia Digital Twin Technology in Construction Market Key Strategic Imperatives
- 16.1 Growth and Market Entry Priorities
- 16.2 High-Return Products and Segments
- 16.3 Pricing, Profitability and Cost Optimization
- 16.4 Technology Investment and Product Differentiation
- 16.5 Supply Chain Localization and Resilience
- 16.6 Distribution and Customer Acquisition
- 16.7 Partnership, Acquisition and Capacity Strategy
- 16.8 Regional Expansion Priorities
- 16.9 Short-, Medium- and Long-Term Actions
Chapter 17 Competition Outlook
- 17.1 Industry Competition Characteristics
- 17.2 Market Structure and Concentration
- 17.3 Market Share and Competitive Positioning, 2025
- 17.4 Company-Wise Revenue and Product Benchmarking
- 17.5 Production and Service Capacity Benchmarking
- 17.6 Technology, Pricing and Differentiation
- 17.7 Regional Footprint and Distribution Strength
- 17.8 Mergers, Acquisitions and Strategic Alliances
- 17.9 New Entrants and Competitive Threats
- 17.10 Porter's Five Forces and Industry Attractiveness
- 17.11 Competitive Outlook, 2025-2035
Chapter 18 Company Profiles
- 18.1 Company Coverage and Selection Criteria
- 18.2 Bentley Systems
- 18.2.1 Business Description
- 18.2.2 Company Ownership and Geographic Presence
- 18.2.3 Product and Service Portfolio
- 18.2.4 Manufacturing and Operating Footprint
- 18.2.5 Production Capacity and Expansion Plans
- 18.2.6 Financial Performance and Investment
- 18.2.7 Market Share and Competitive Position
- 18.2.8 Technology and Innovation Capabilities
- 18.2.9 Strategic Alliances or Partnerships
- 18.2.10 Recent Developments
- 18.2.11 Growth Strategy and Outlook
- 18.3 Autodesk
- 18.4 Trimble
- 18.5 Hexagon
- 18.6 Nemetschek Group
- 18.7 Other Relevant Market Participants
Note: Every listed company is profiled on the structure shown under the first company. The company list is preliminary and may change based on research findings, market developments, data availability and client requirements.
Chapter 19 Disclaimer
- 19.1 Research and Forecast Disclaimer
- 19.2 Data Source and Estimation Limitations
Note: The depth of individual sections depends on data availability for this market. Volume, capacity, trade and other unit-based metrics are included where applicable.

