
Uptime rules turn charging upkeep into a contracted service
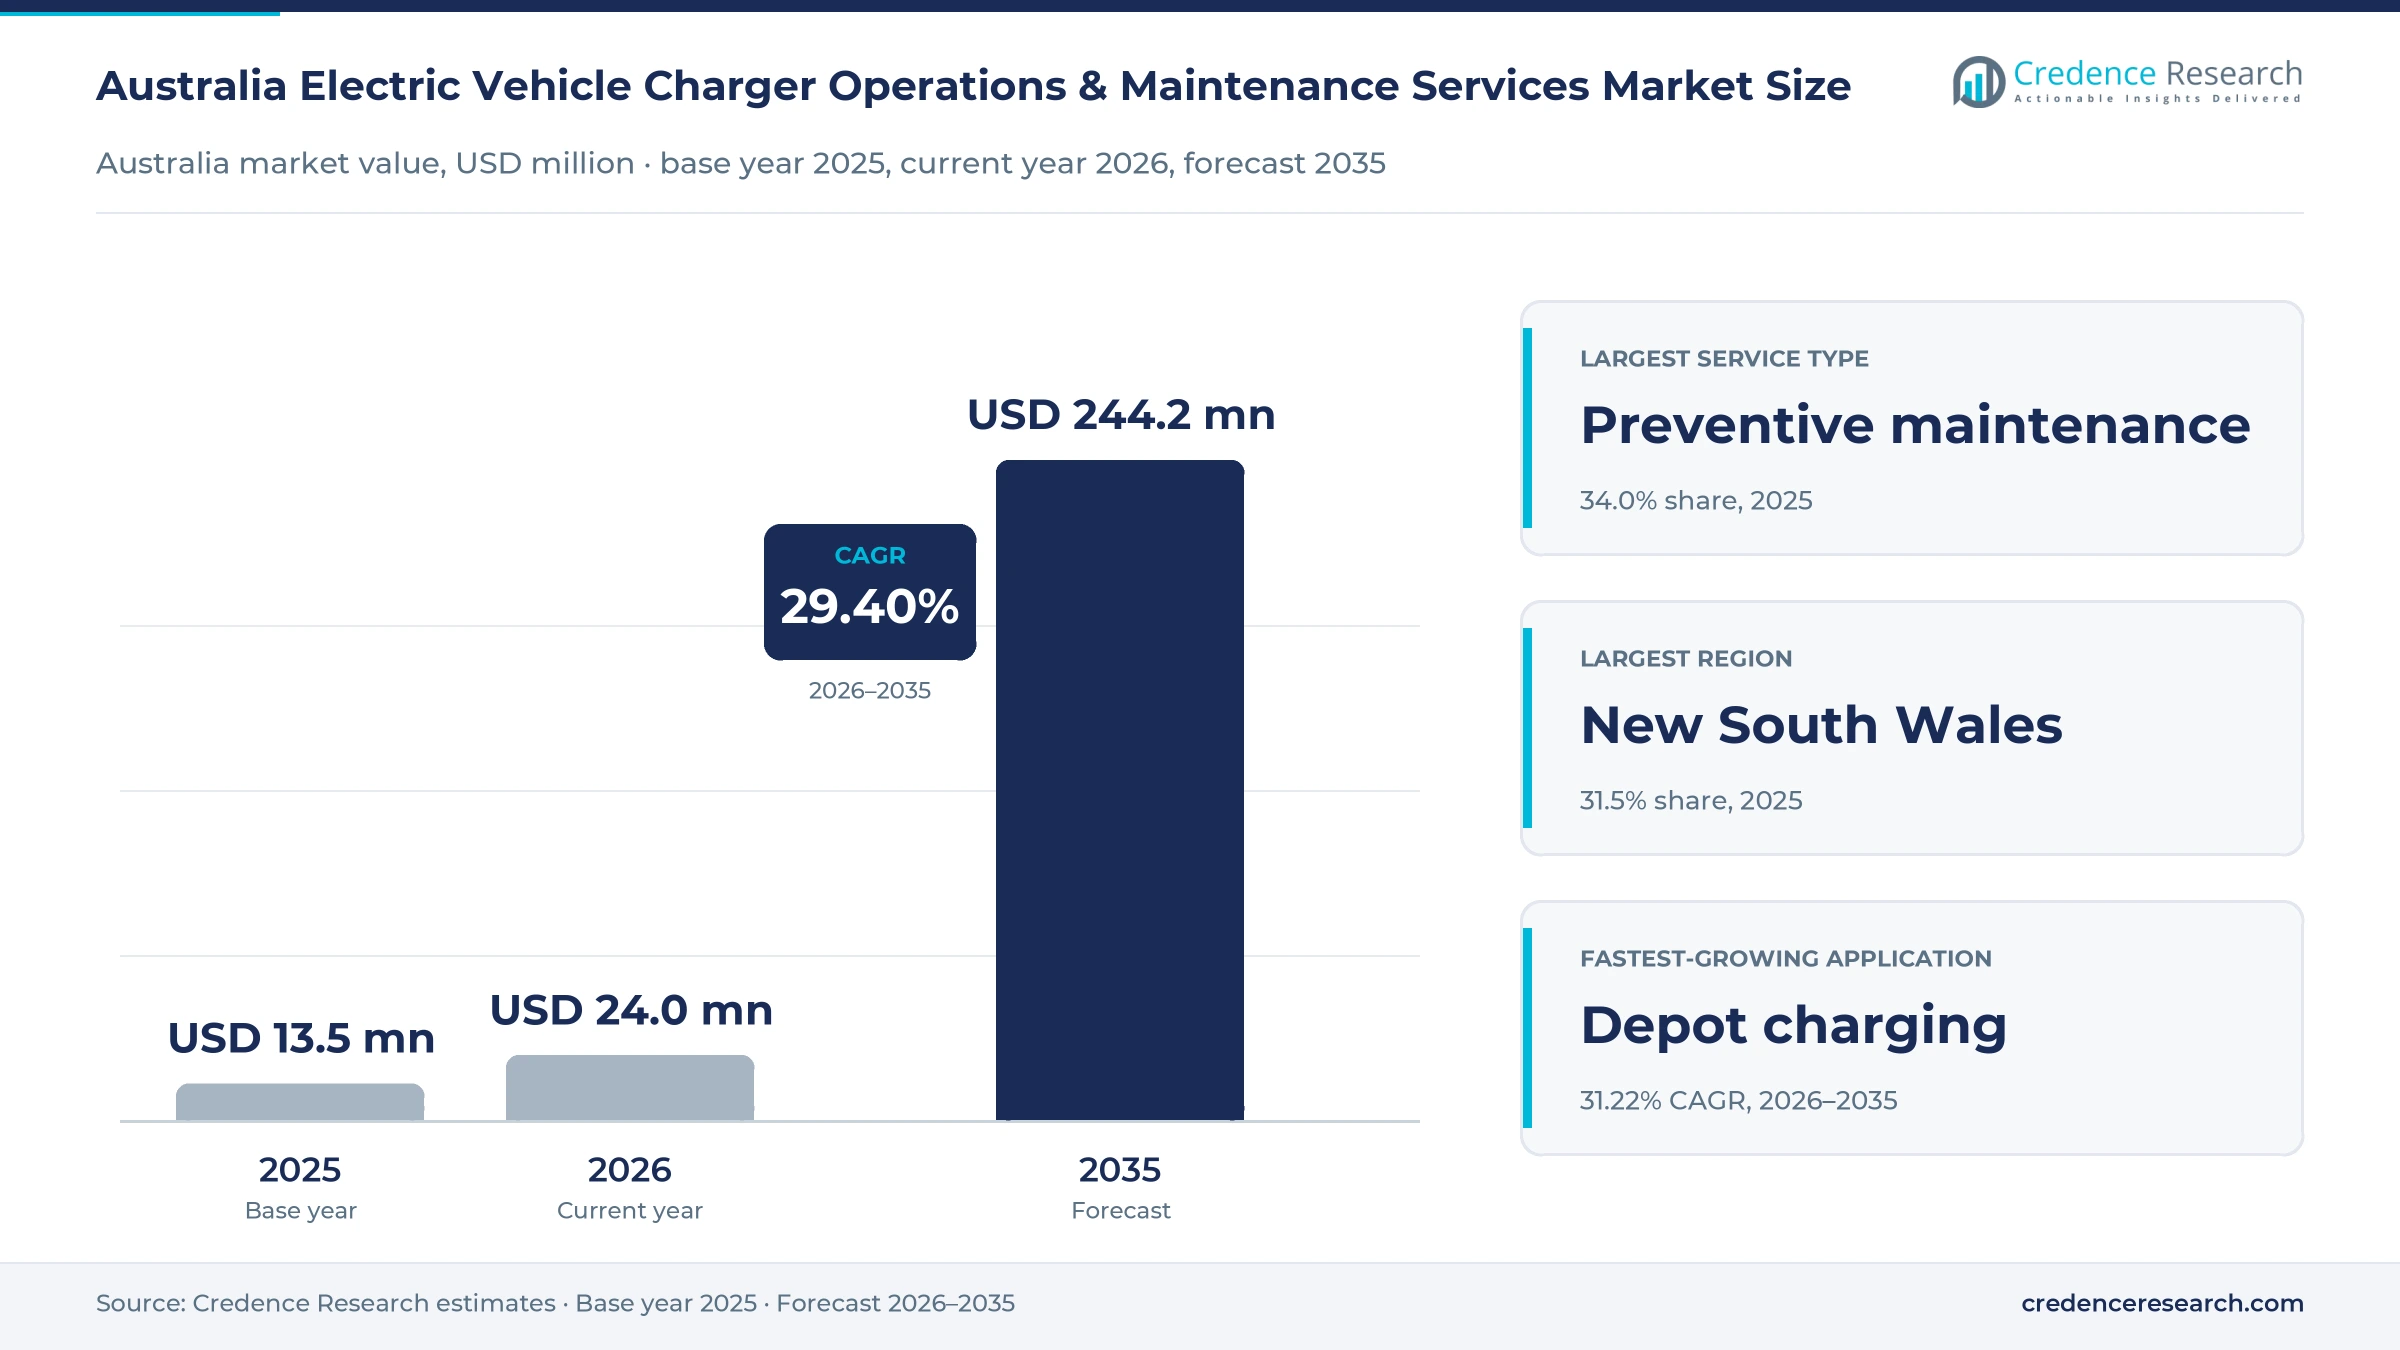
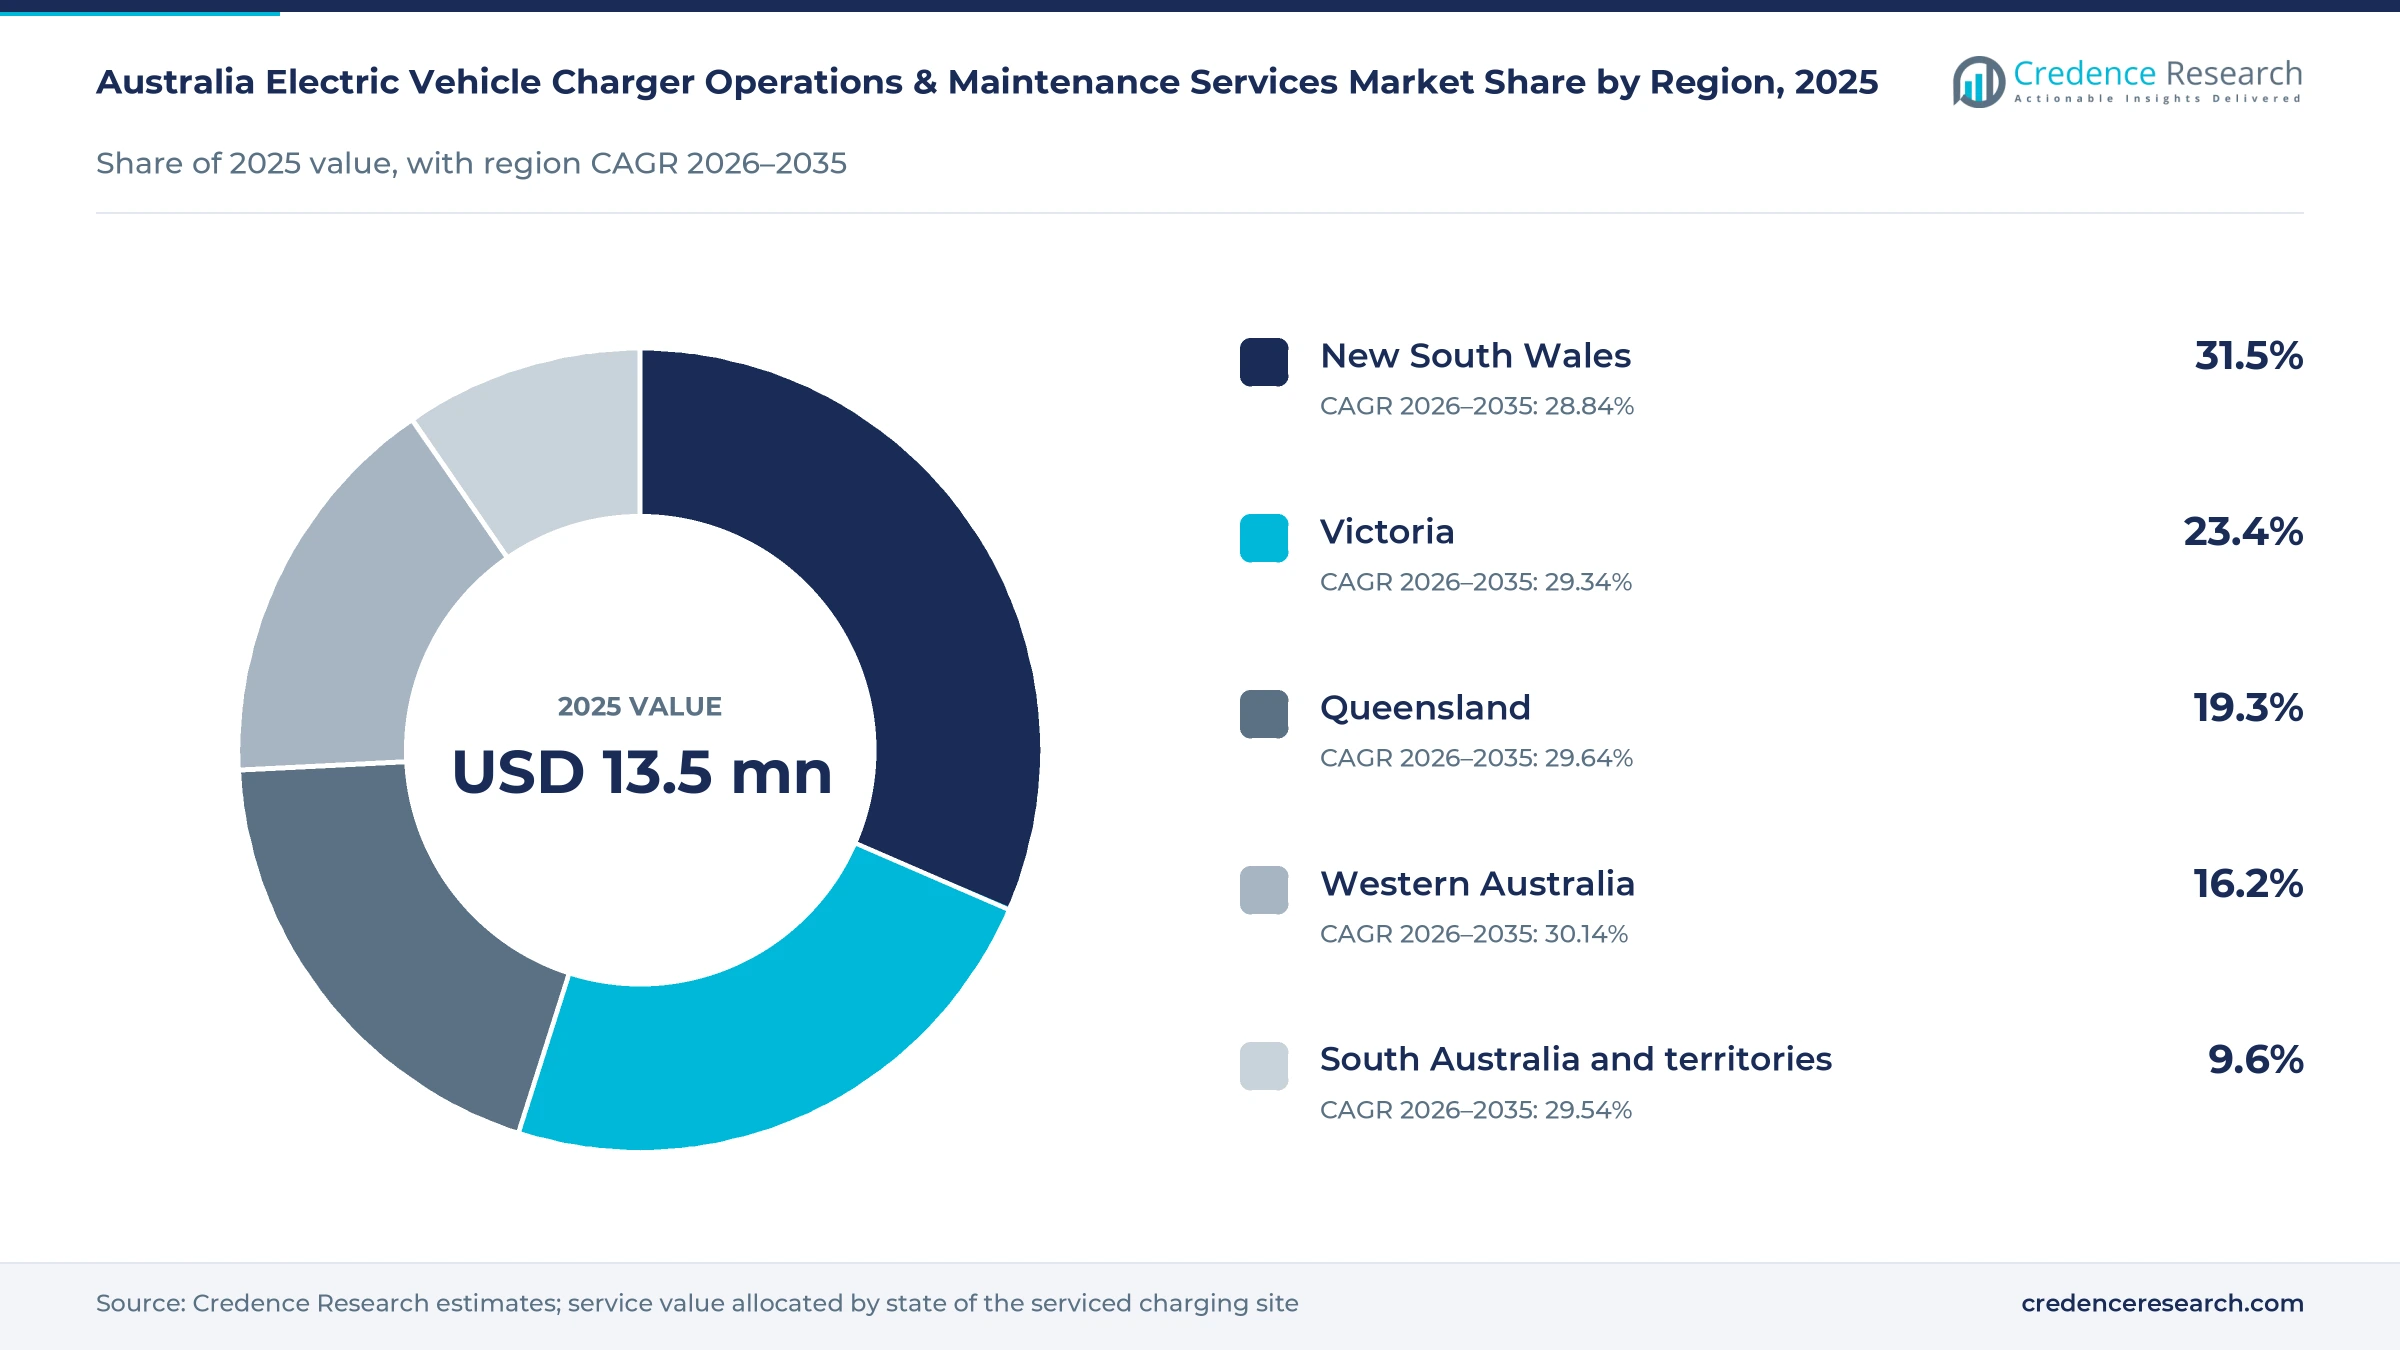
The Australia electric vehicle charger operations and maintenance services market was valued at USD 13.5 million in 2025 and is projected to increase from USD 24.0 million in 2026 to USD 244.2 million by 2035, registering a CAGR of 29.40% during 2026–2035. Demand comes from public network operators that must keep fast chargers working, fleet owners that need depot chargers ready every morning, and property owners that host destination and workplace chargers. New South Wales held the largest regional share, 31.5% in 2025, because the state hosts the most public fast-charging sites and highway corridors. Western Australia is the fastest-growing region at 30.14% a year, as long highway routes and newer networks need regular field service. In turn, government grants now tie funded fast chargers to a 98% uptime standard, which pushes operators toward contracted maintenance with response times and remote monitoring.
Which charging services does the estimate cover?
The estimate measures the value of operations and maintenance services for electric vehicle chargers installed in Australia. It covers scheduled preventive visits, fault repair, remote monitoring and resets, and the service share of subscription packages that bundle hardware, software and upkeep. Buyers include public network operators, fleets, property owners, councils and households.
The estimate excludes the sale and installation of new charging hardware, electricity sold to drivers and grid connection works. The value chain runs from hardware makers and software platforms through network operators, installers and field technicians to the site hosts and drivers that depend on working chargers.
Australia Electric Vehicle Charger Operations & Maintenance Services Market Insights
- Charging upkeep value in Australia was USD 13.5 million in 2025 and is projected to reach USD 244.2 million by 2035, registering a CAGR of 29.40% during 2026–2035.
- New South Wales held a 31.5% share of 2025 value, because the state hosts the most public fast-charging sites and highway corridors.
- Preventive maintenance led with a 34.0% share of 2025 value, because network rules and grant terms require scheduled inspections of public chargers.
- Australia had 1,272 fast-charging sites with more than 3,436 plugs in the first half of 2025, each needing inspection, repair and software support.
- Exploren announced in September 2026 that it would invest $30 million over two years in more than 600 new fast chargers and upgrades.
Preventive work leads as bundled subscriptions grow fastest
Why does preventive maintenance lead service demand?
Based on service type, the market is categorized into preventive maintenance, reactive maintenance, remote monitoring and the CaaS O&M component. Preventive maintenance led with a 34.0% share of 2025 value, because network rules require scheduled checks of public chargers. The CaaS O&M component grows fastest at 31.78% a year, as fleets buy charging as a subscription with upkeep included.
How do operators and fleets split service spending?
Based on customer type, the market is categorized into charge point operators, property owners, fleet operators, public authorities and residential subscribers. Charge point operators led with a 46.0% share of 2025 value, because they run most public fast chargers. Fleet operators grow fastest at 31.12% a year, as delivery vans, trucks and buses move to depot charging.
Why is depot charging the fastest-growing application?
Based on application, the market is categorized into public corridor charging, destination charging, workplace charging, depot charging and home charging. Public corridor charging led with a 38.0% share of 2025 value, because highway fast chargers face heavy use and harsh weather. Depot charging grows fastest at 31.22% a year, as fleets build shared and private hubs for heavy trucks.
How are service contracts priced?
Based on revenue model, the market is categorized into fixed recurring contracts, usage-linked service fees, time-and-materials contracts and performance-linked contracts. Fixed recurring contracts led with a 44.0% share of 2025 value, because operators prefer predictable annual plans that cover scheduled visits and routine repairs. Performance-linked contracts grow fastest at 31.38% a year, as grant funders and site hosts move uptime targets, response times and penalties into service agreements.
| Segment Group | Leading Sub-segment | Share, 2025 | Fastest-growing Sub-segment | CAGR, 2026–2035 |
|---|---|---|---|---|
| By Service Type | Preventive maintenance | 34.0% | CaaS O&M component | 31.78% |
| By Customer Type | Charge point operators | 46.0% | Fleet operators | 31.12% |
| By Application | Public corridor charging | 38.0% | Depot charging | 31.22% |
| By Revenue Model | Fixed recurring contracts | 44.0% | Performance-linked contracts | 31.38% |
Request a Free Sample
Fill in your details and we'll send you a free sample report.
- Sample data tables & charts
- Research methodology
Site growth, uptime rules and fleets lift service demand
How does the expanding serviceable charging base lift demand?
The expanding serviceable charging base lifts demand, because every new fast charger needs inspections, repairs and software support for its working life. Australia had 1,272 fast-charging sites with more than 3,436 plugs in the first half of 2025, according to industry council data. NRMA added 35 new highway sites in 2025, about three a month, while Exploren announced a $30 million plan for more than 600 fast chargers in September 2026. Battery electric cars also reached 23.4% of new car sales in the six months to mid-2026, which raises use of battery-powered cars at public sites. As a result, public corridor charging holds a 38.0% share of 2025 value.
Why does availability-linked procurement favor contracted upkeep?
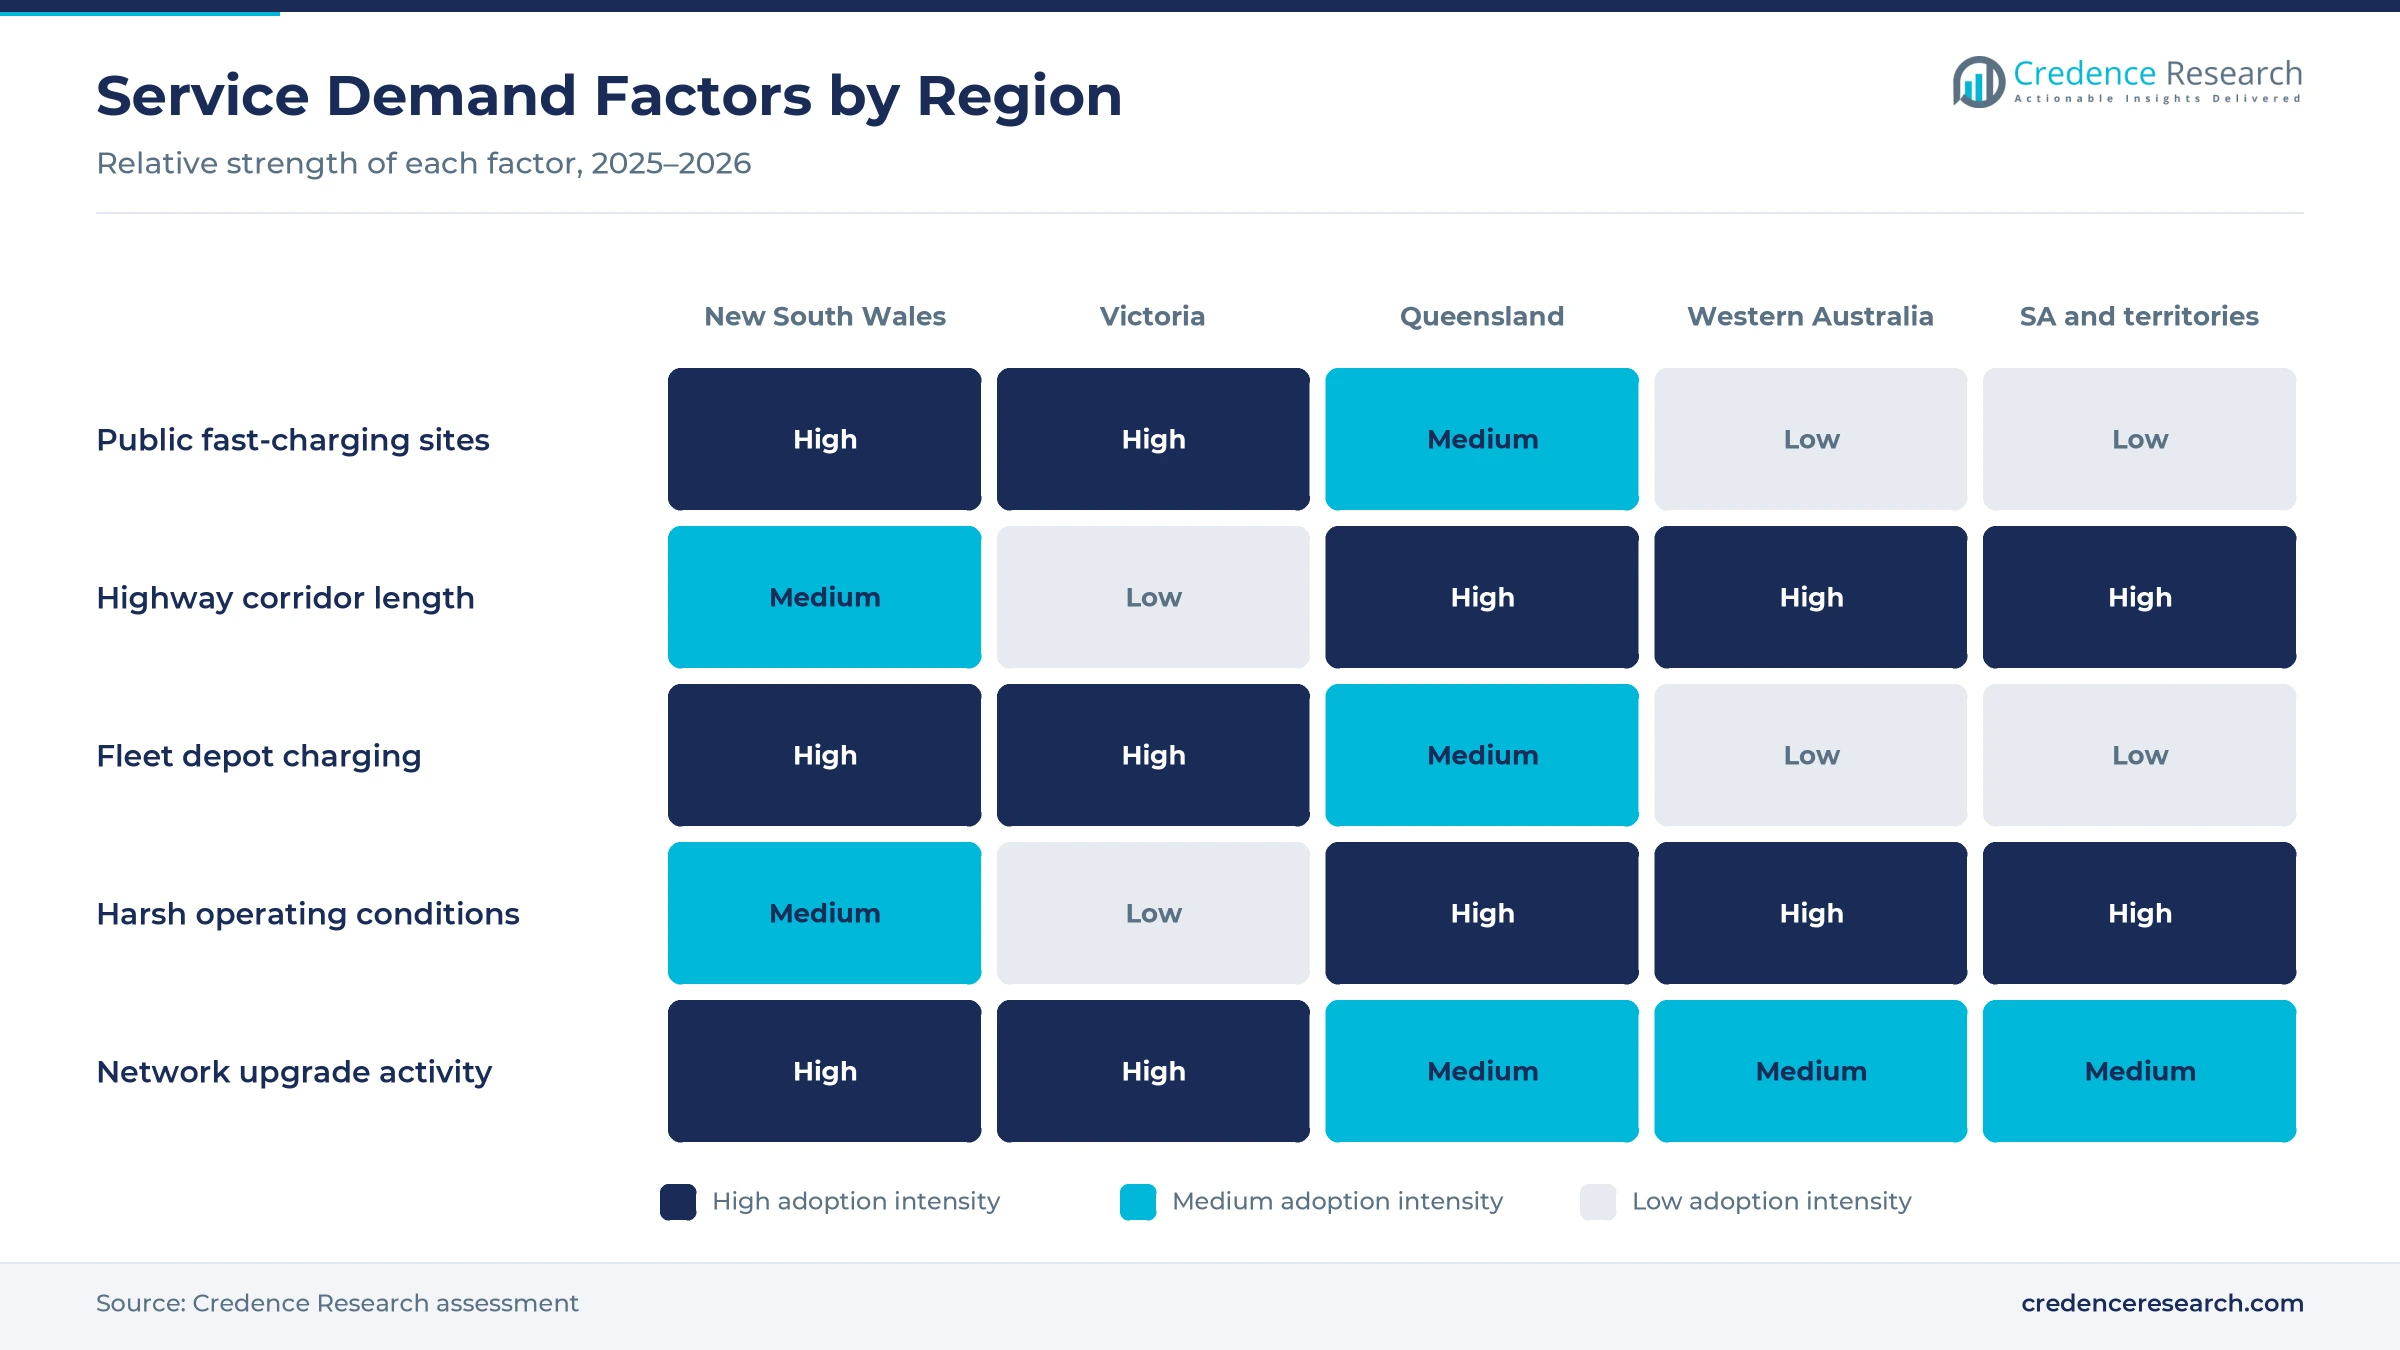
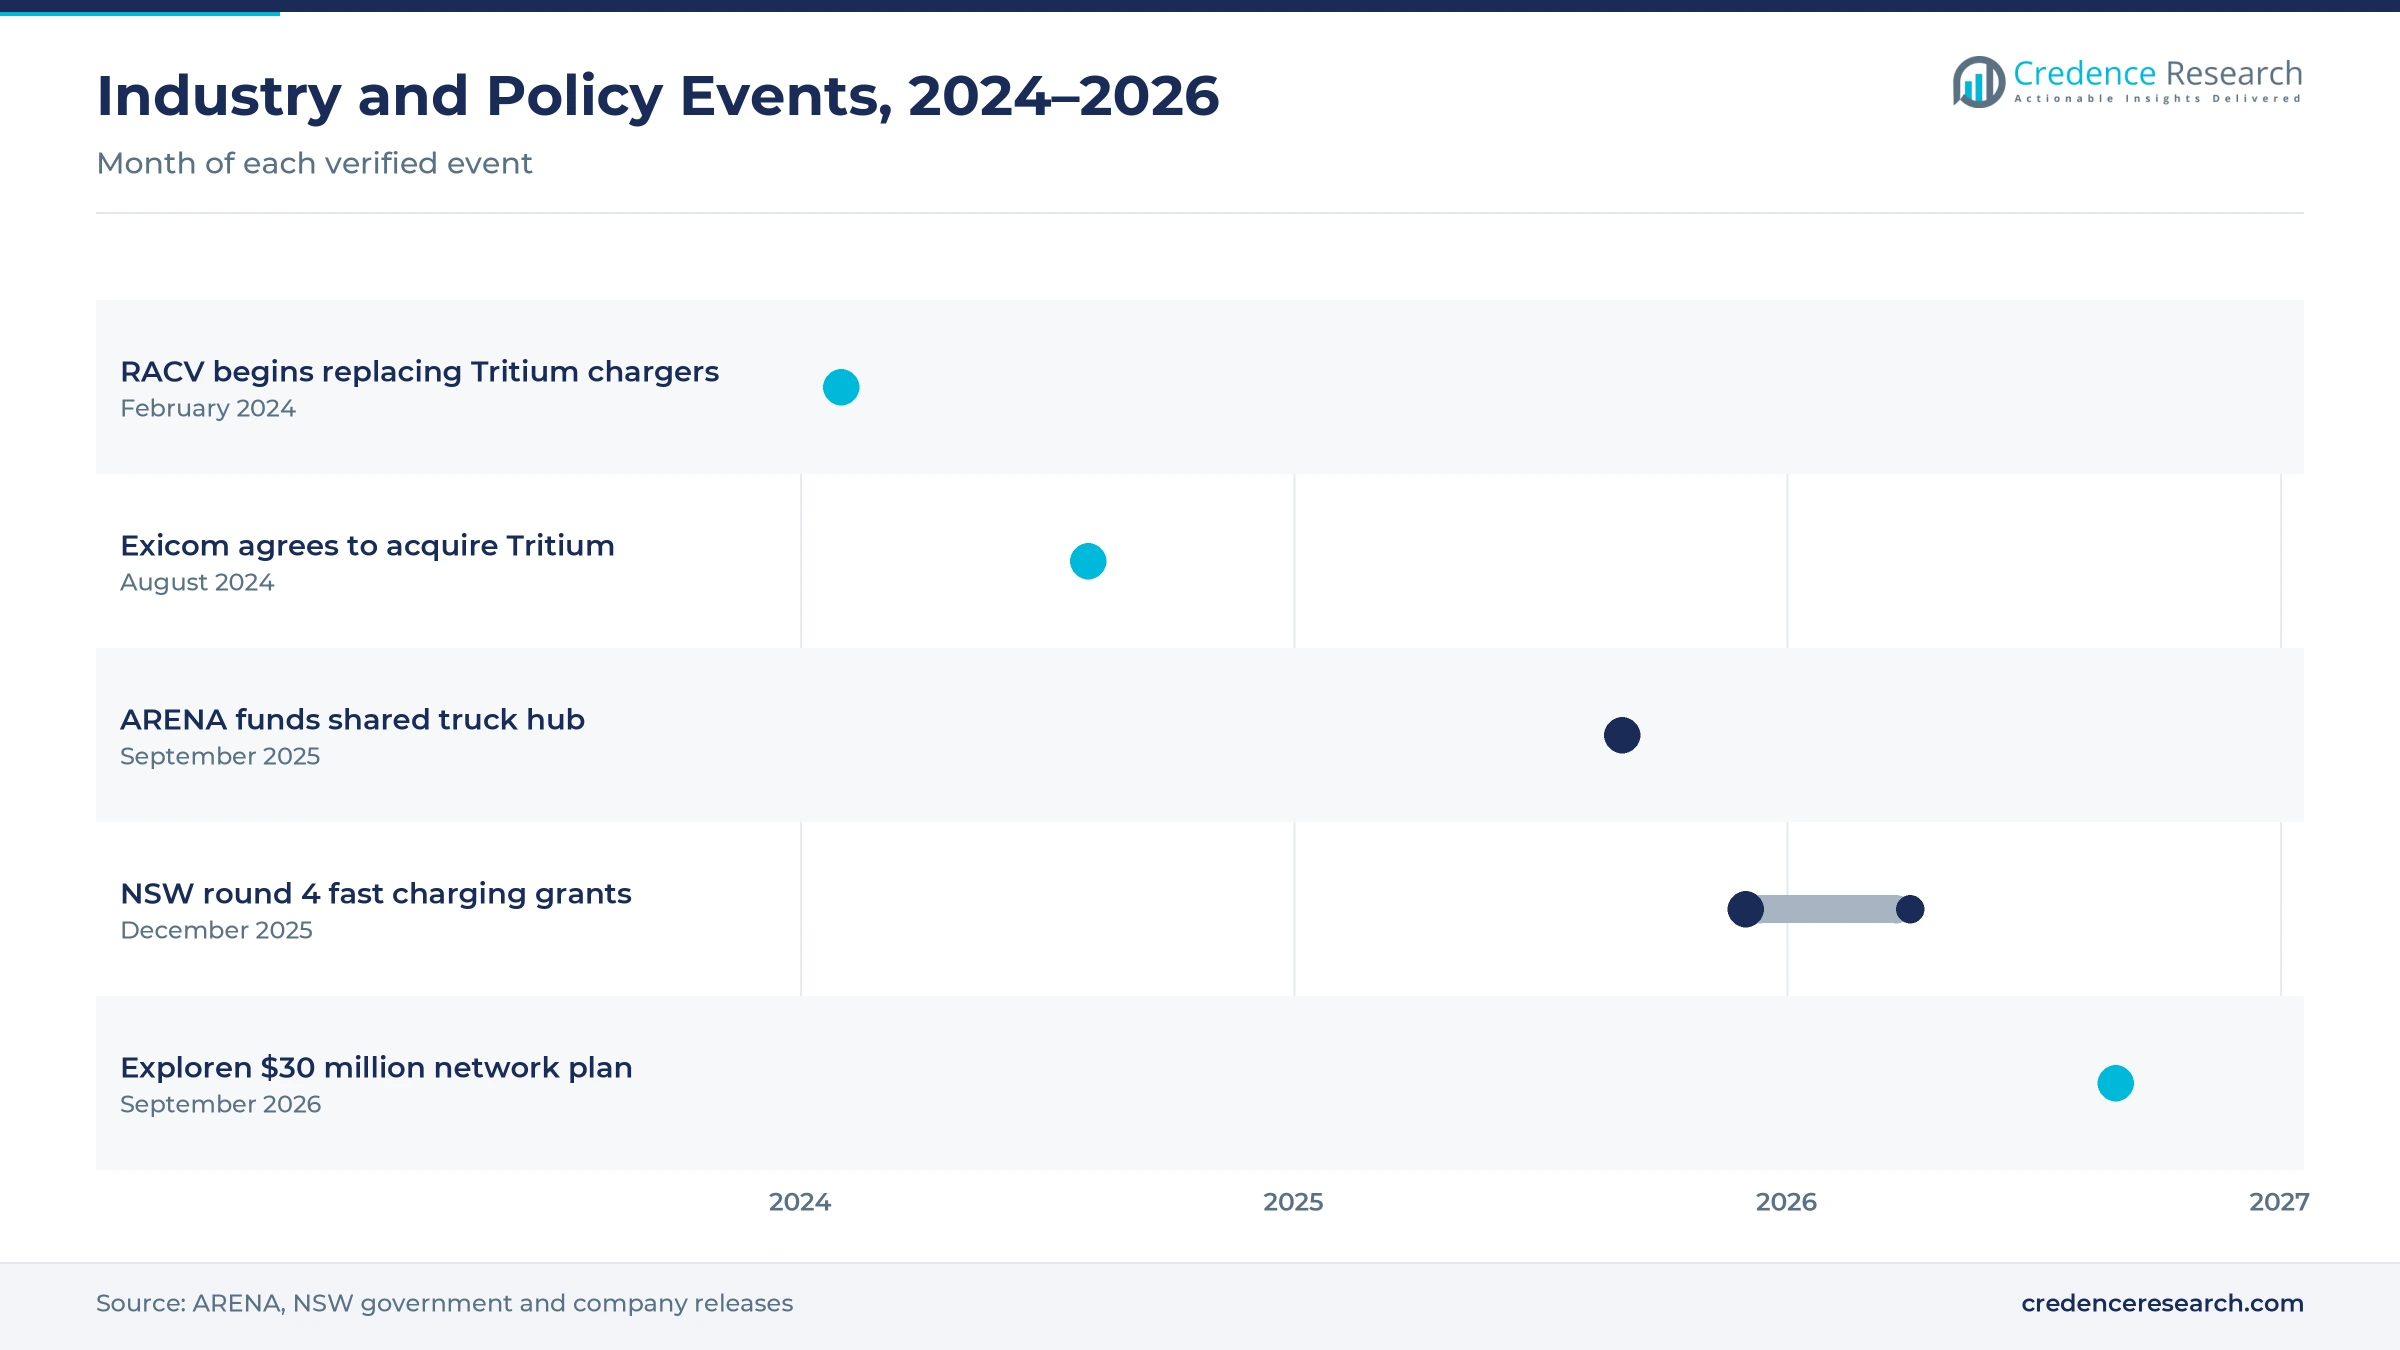
Availability-linked procurement favors contracted upkeep, because public funders now judge chargers on whether drivers can actually charge. Fast chargers built with public funding must meet a 98% uptime standard, and New South Wales also applies the same standard. Up to 13% of registered public chargers were unavailable in May 2025, with 9% of connectors under repair, according to a review of public charger listings. The national drivers' association called for financial penalties on operators that neglect service agreements. The state also offered up to $20 million in fourth-round grants from December 2025, according to the NSW government. In turn, performance-linked contracts grow at 31.38% a year, the fastest pricing rate.
How does fleet charging service adoption widen the buyer base?
Fleet charging service adoption widens the buyer base, because fleet owners want chargers that work every morning without running their own technical teams. JET Charge received $12 million from the national renewable energy agency for a $24.9 million charging-as-a-service project in which the subscription fee covers operations and maintenance. Mondo Power received $12.3 million in September 2025 for a shared truck hub with 14 dual-plug chargers at Laverton North, according to the Australian Renewable Energy Agency, and it also supports 20 heavy battery electric trucks. As a result, fleet operators grow at 31.12% a year, the fastest customer rate, as depots move from pilots to full fleets.
Why does replacement of first-generation chargers create service work?
Replacement of first-generation chargers creates service work, because early fast chargers are wearing out under heavy use and harsh weather. RACV began replacing 24 Tritium DC chargers at seven Victorian sites in February 2024, citing rising use of its first ultra-rapid stations. Chargefox completed or started upgrades at more than 20 NRMA sites in 2025 with chargers built for extreme environments. Exicom agreed to acquire the business and assets of Tritium in August 2024, which had sold over 13,000 fast chargers across 47 countries. In turn, operators need technicians, parts and commissioning support as older units are removed and new chargers enter service across busy corridors.
Remote fixes, uptime data and depot hubs reshape upkeep
How is the shift to remote diagnostics changing field service?
The shift to remote diagnostics is changing field service, because many faults can be fixed with a reset or software update without a site visit. EVSE Australia offers service packages with 24/7 fault monitoring and remote technical support, with technical response within six hours on its top tier. Its chargers can be reset, updated or reconfigured remotely to avoid site visits. Chargefox has required approved maintenance plans for sites on its network since Feb. 14, 2024, and JET Charge uses a ticketing system to manage those plans. As a result, remote monitoring grows faster than field-only work, while network management platforms feed fault data to technicians before they travel.
Why is the rise of uptime transparency reshaping contracts?
The rise of uptime transparency is reshaping contracts, because operators and funders now see that reported uptime can overstate how often drivers succeed. An October 2025 university review of California fast chargers found networks reported 95% or more uptime, while the chance of a successful charge was 75% to 83%. An August 2026 university analysis cited a San Francisco study in which 73% of chargers worked when tested. The same August 2026 analysis noted that the U.K. requires 99% uptime for public rapid chargers, while the EU requires operators to share uptime and payment data with authorities. In turn, service agreements in Australia are adding response times, success-rate measures and penalties, which favors providers with strong field coverage.
Can heavy-vehicle depot hubs open a larger service pool?
Heavy-vehicle depot hubs open a larger service pool, because high-power chargers for trucks run long hours and need fast repair. Mondo Power is building 14 dual-plug truck chargers at Laverton North with federal support announced in September 2025. Team Global Express also received federal support for 60 battery electric delivery trucks and charging at a western Sydney depot. Shared hubs serve several fleets at once, which raises the cost of any downtime for each operator. Trucks also return to base on tight schedules, so a failed overnight charge can cancel delivery routes the next day. As a result, commercial depot hubs grow at 31.22% a year, the fastest application rate.
Is there room for growth in network acquisitions and upgrades?
Network acquisitions and upgrades leave room for service growth, because new owners often modernize sites and sign fresh maintenance contracts. Exploren acquired the Australian and New Zealand network of a global energy group in 2025, adding more than 200 locations. The company said its $30 million plan also covers upgrading existing sites and maintaining current infrastructure. Coles and Evie Networks plan 200 kW chargers at up to 30 supermarkets in Victoria and Queensland. About 87.7% of Australians lived in urban areas in 2025, according to World Bank data, which concentrates destination sites in cities. In turn, subscription charging models gain buyers among retail and property hosts.
Technician gaps, legacy units and parts delays limit uptime
How do technician shortages slow repair times?
Technician shortages slow repair times, because fast chargers need electricians trained in high-voltage equipment and specific brands. Regional and highway sites can be hours from the nearest qualified technician. As a result, a single fault can leave a site offline for days, hurt driver trust and put grant uptime targets at risk. Providers respond with regional technician networks, brand training programs and remote diagnostics that fix simple faults without travel.
Why do legacy units raise maintenance costs?
Legacy units raise maintenance costs, because early fast chargers wear out faster and some makers have changed owners. Spare parts and firmware support can be harder to secure for older models, which is a growing risk for networks built before 2022. In turn, operators spend more on repeat visits and eventually on full replacement. Operators respond with planned upgrade programs, standard hardware lists and service contracts that include parts supply.
How do harsh conditions damage charging equipment?
Harsh conditions damage charging equipment, because heat, dust, coastal salt and vandalism stress cables, screens and cooling systems. Highway sites in remote areas face the most severe conditions. As a result, failures rise in summer when travel demand also peaks, which puts pressure on response times during holiday periods. Operators respond with chargers built for extreme environments, protective enclosures and more frequent inspections for heavy-use sites.
Why does fragmented ownership complicate service models?
Fragmented ownership complicates service models, because councils, motoring clubs, retailers and private networks own chargers under different contracts. About one-third of councils lacked asset management plans for major assets in a 2024 local government review, which limits planned upkeep. In turn, responsibility for repairs can be unclear and response times vary widely. Providers respond with national service contracts, shared ticketing systems and clear service level agreements that define who fixes what.
Sydney sites lead as long western corridors grow fastest
| Region | Value, 2025 (USD million) | Share, 2025 | CAGR, 2026–2035 |
|---|---|---|---|
| New South Wales | 4.3 | 31.5% | 28.84% |
| Victoria | 3.2 | 23.4% | 29.34% |
| Queensland | 2.6 | 19.3% | 29.64% |
| Western Australia | 2.2 | 16.2% | 30.14% |
| South Australia and territories | 1.3 | 9.6% | 29.54% |
Why does New South Wales hold the largest share?
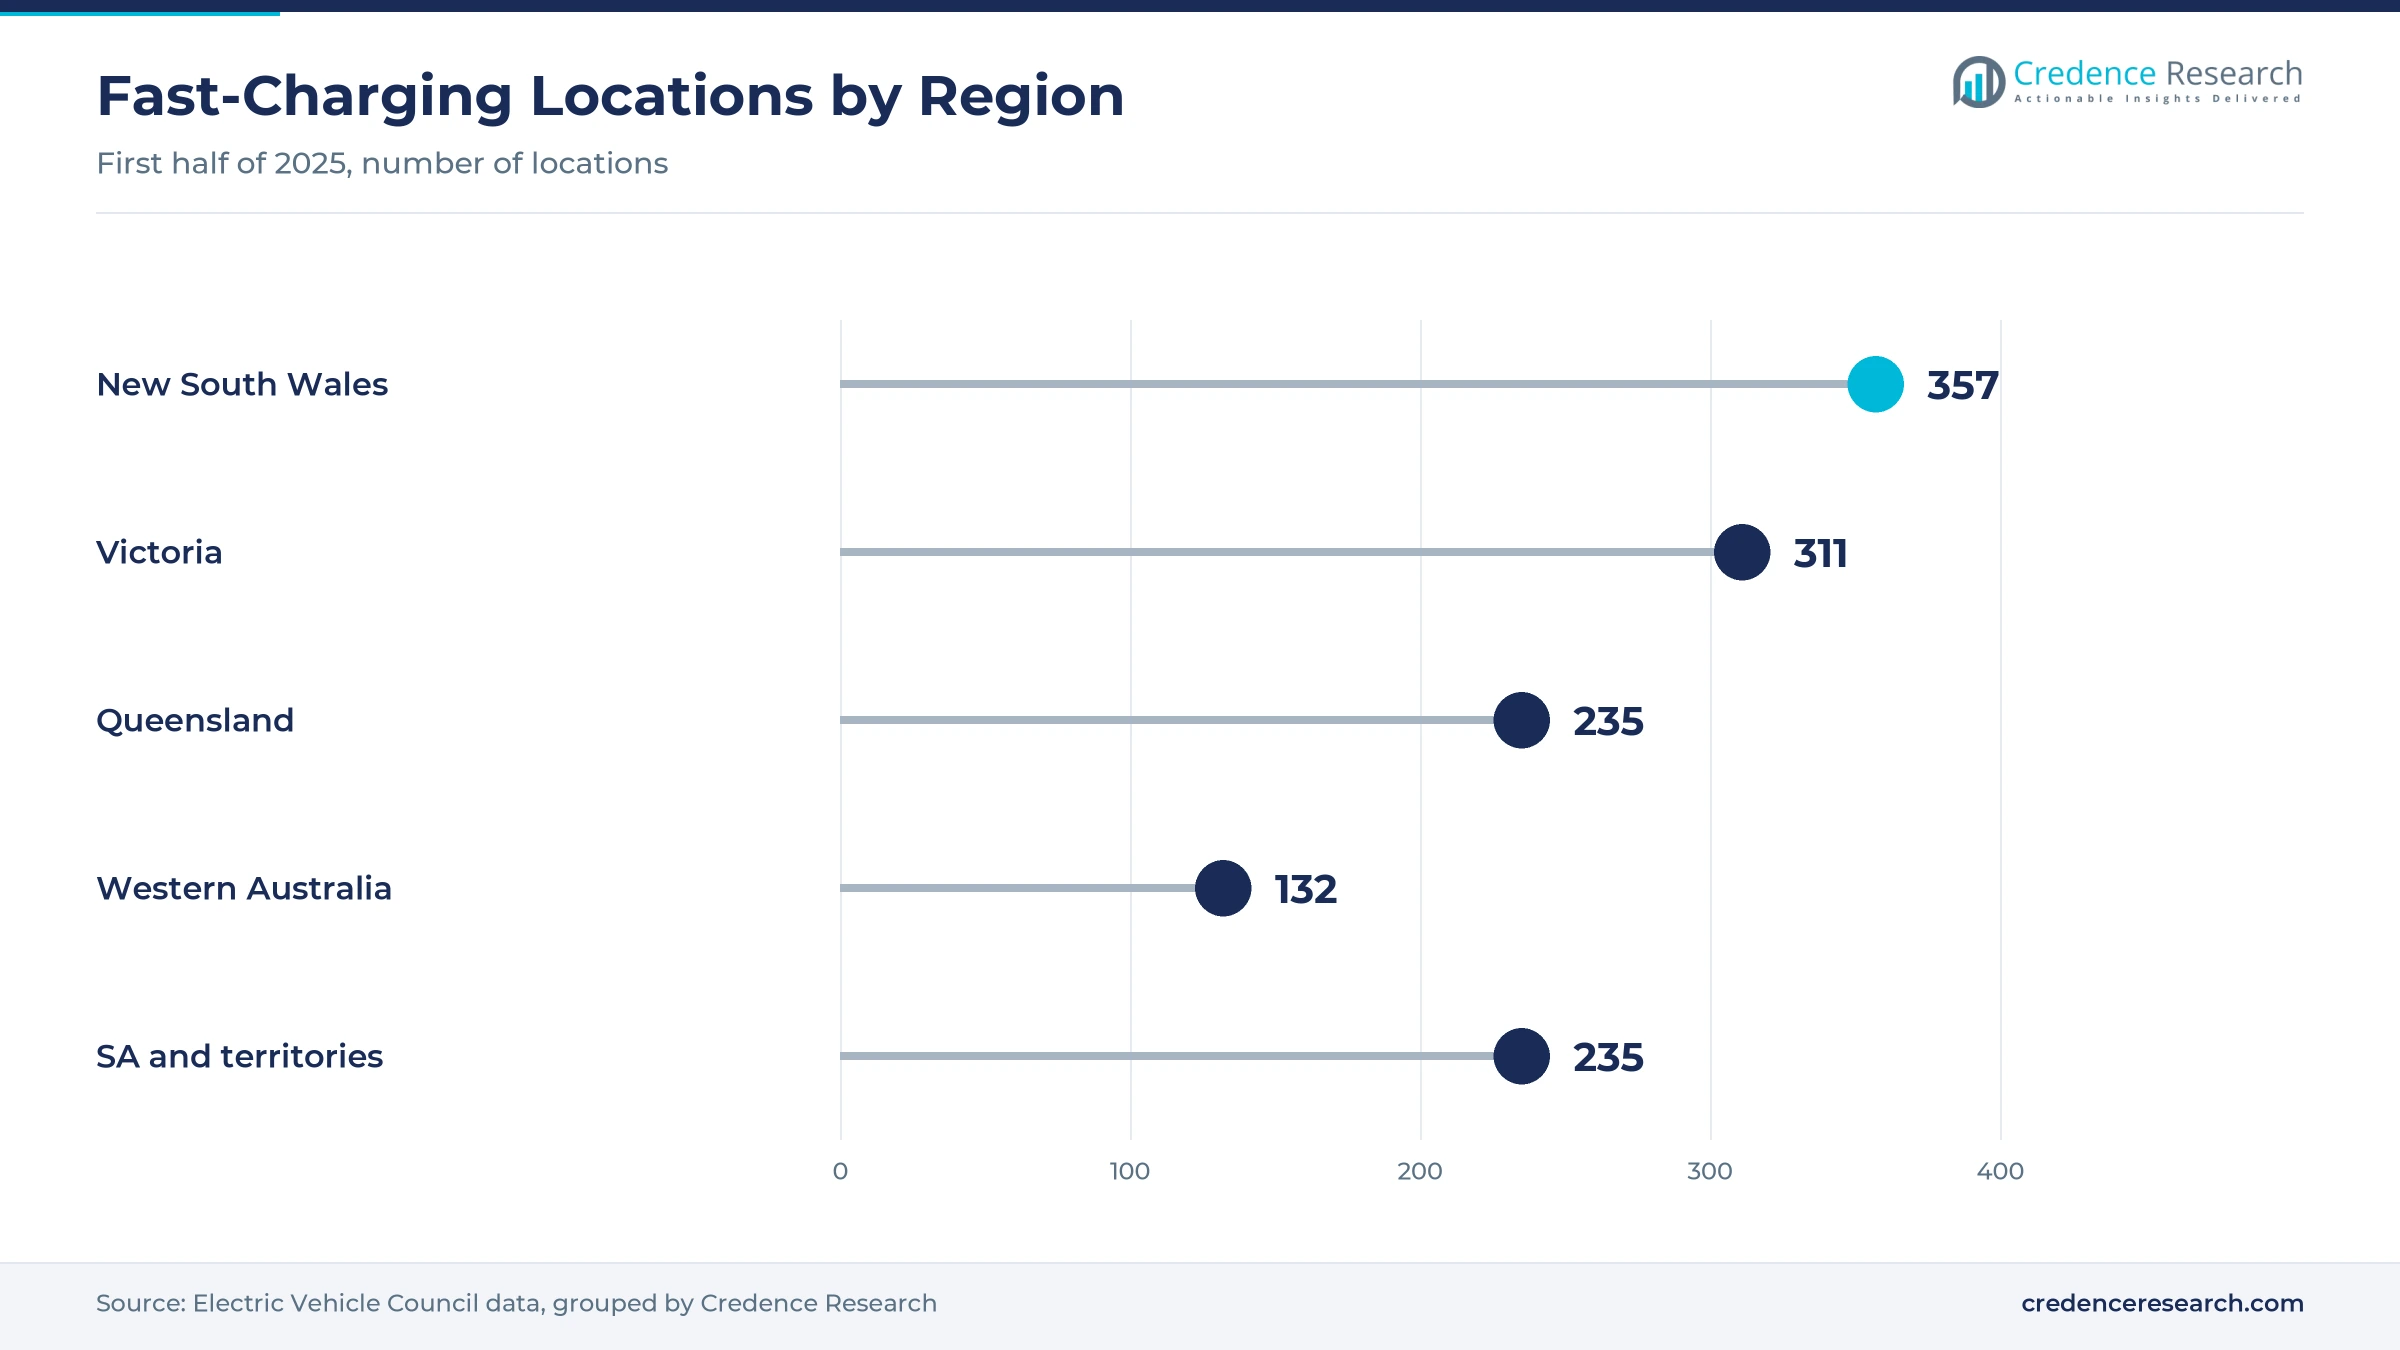
New South Wales held a 31.5% share of 2025 value and grows at 28.84% a year, because the state hosts the most public fast-charging sites. The state had 357 fast-charging locations in the first half of 2025, including 143 ultrafast sites. However, growth is slower than in other zones because the network is already large. Most NRMA network upgrades in 2025 were also in the state, which created replacement and commissioning work for service teams along the main highway corridors.
How does Victoria support service growth?
Victoria held a 23.4% share of 2025 value and grows at 29.34% a year, because Melbourne has dense urban charging and new truck hubs. The state had 311 fast-charging locations in the first half of 2025. A shared truck hub at Laverton North and supermarket chargers planned by Coles and Evie Networks add service work. RACV also replaced older fast chargers at seven sites from 2024, which shows how quickly early equipment in the state reaches the end of its service life.
Why does Queensland need more corridor service?
Queensland held a 19.3% share of 2025 value and grows at 29.64% a year, because long coastal highways need regular service at remote sites. The state had 235 fast-charging locations in the first half of 2025, including 96 ultrafast sites. Heat, humidity and coastal salt in the north also raise the need for regular inspections and part replacement. New supermarket chargers planned in the state will add destination sites that need contracted service.
Why does western Australia grow fastest?
Western Australia held a 16.2% share of 2025 value and grows fastest at 30.14% a year, because long highway routes and newer networks need field service. The state had 132 fast-charging locations in the first half of 2025. The original state highway network of 16 sites is now run by local councils. Chargefox controls about 58% of public chargers in the state.
How do South Australia and the territories add demand?
South Australia and the territories held a 9.6% share of 2025 value and grow at 29.54% a year, because remote sites need contracted service. South Australia had 136 fast-charging locations in the first half of 2025, including 89 ultrafast sites. Tasmania, the Australian Capital Territory and the Northern Territory added 99 more locations.
Grants, network upgrades and acquisitions shaped 2024-2026
| Development | Status and market relevance |
|---|---|
| In February 2024, RACV began replacing 24 Tritium DC chargers at seven public sites in Victoria. | Created replacement and commissioning work for older fast chargers |
| In August 2024, Exicom agreed to acquire the business and assets of Tritium. | Kept service support for more than 13,000 fast chargers sold worldwide |
| In September 2025, ARENA awarded Mondo Power $12.3 million for a shared truck charging hub at Laverton North. | Added high-power depot chargers that need contracted upkeep |
| In December 2025, the NSW government opened up to $20 million in fourth-round fast charging grants. | Funded new sites under state uptime requirements |
| In September 2026, Exploren announced a $30 million plan for more than 600 new fast chargers and site upgrades. | Expanded the installed base that needs maintenance |
Remote diagnostics and predictive tools cut site visits
- Remote diagnostics let technicians reset, update and reconfigure chargers from a control room, which avoids many site visits.
- Predictive maintenance tools analyze fault and usage data to plan repairs before failures, which reduces downtime.
- Ticketing and work order systems track each fault from report to repair, which helps providers meet response times.
- Contactless payment terminals replace app-only access at public sites, which cuts failed sessions caused by payment errors.
Need a Custom Version of This Report?
Tailor the scope, geography, or segments to your exact requirements.
- Custom geography or segment scope
- Direct access to our analyst team
Networks, installers and makers compete on uptime
Competition includes public network operators, installers that sell maintenance plans, hardware makers and specialist service firms. Chargefox runs a large public network and upgraded more than 20 NRMA sites in 2025 while cutting prices at more than 40 sites. JET Charge sells maintenance plans that meet Chargefox requirements and runs a charging-as-a-service model for fleets. EVSE Australia offers service packages with 24/7 monitoring, and its sister network Exploren is expanding and upgrading sites. Tritium, now owned by Exicom, keeps an engineering center in Brisbane that supports its installed chargers. Rivals compete on response times, technician coverage, parts supply, remote tools and the ability to meet uptime targets. Motoring clubs such as RACV and NRMA also shape demand, because they own large networks and choose who services and upgrades their chargers.
Companies profiled and their roles in this market
| Company | Type | Role in the market |
|---|---|---|
| Chargefox | Network operator | Upgraded more than 20 NRMA sites in 2025 |
| JET Charge | Installer and service provider | Runs a charging-as-a-service model with upkeep included |
| EVSE Australia | Hardware and service provider | Offers 24/7 fault monitoring and remote support |
| Exploren | Network operator | Announced a $30 million plan for 600 chargers in 2026 |
| Tritium | Hardware maker | Acquired by Exicom in 2024 with a Brisbane engineering center |
Credence Research view on Australian charging upkeep
Credence Research's view is that charging upkeep in Australia will grow much faster than the installed base, because operators and funders now demand that chargers actually work. Preventive visits remain the core of the market, while subscription packages, remote monitoring and depot service gain share. Technician shortages and harsh conditions limit how fast providers can scale. Providers that combine remote tools, regional field teams and clear uptime commitments should gain share fastest, and fleet depots are the clearest opening for new service contracts.
How the Australian charging upkeep estimate was built
The report uses 2025 as the base year on a calendar basis, and market values come from the Credence Research model. That model combines industry council site counts, government grant and agency releases, World Bank urban data, company releases and trade press on charger reliability. Segment splits and regional growth rates are Credence Research estimates, while regional shares follow the client-defined split. Sources used are public reports, official statistics, company releases and trade press, and no interviews or surveys were used.
Larger networks and stricter uptime carry value to 2035
Charging service value is expected to reach USD 244.2 million by 2035, a 29.40% CAGR during 2026–2035, as networks expand and uptime rules tighten. Growth should be fastest through 2030 while thousands of new fast chargers enter service. After that, aging equipment, fleet depots and performance contracts will carry more growth as the base matures. Technician shortages would slow growth, while stronger uptime rules would support it. Providers with national coverage and remote tools are expected to gain the most.
Frequently Asked Questions
How big is the Australia electric vehicle charger operations and maintenance services market?
Which service type leads Australian charging upkeep?
Which region leads the Australia electric vehicle charger operations and maintenance services market?
How many fast-charging sites did Australia have in 2025?
What uptime do funded fast chargers need in Australia?
Which customer type is growing fastest?
Who are the leading charging service providers in Australia?
What are the main challenges for charging service providers?
Table of Content
Chapter 1 Market Segmentation
- 1.1 Segmentation Framework
- 1.1.1 Product and Service Classification
- 1.1.2 Application and End-Use Classification
- 1.1.3 Technology and Solution Classification
- 1.1.4 Customer and Distribution Channel Classification
- 1.1.5 Geographic Segmentation
- 1.1.6 Market Segment Definitions and Boundaries
- 1.2 By Service Type
- 1.2.1 Preventive maintenance
- 1.2.2 Reactive maintenance
- 1.2.3 Remote monitoring
- 1.2.4 CaaS O&M component
- 1.3 By Customer Type
- 1.3.1 Charge point operators
- 1.3.2 Property owners
- 1.3.3 Fleet operators
- 1.3.4 Public authorities
- 1.3.5 Residential subscribers
- 1.4 By Application
- 1.4.1 Public corridor charging
- 1.4.2 Destination charging
- 1.4.3 Workplace charging
- 1.4.4 Depot charging
- 1.4.5 Home charging
- 1.5 By Revenue Model
- 1.5.1 Fixed recurring contracts
- 1.5.2 Usage-linked service fees
- 1.5.3 Time-and-materials contracts
- 1.5.4 Performance-linked contracts
Chapter 2 Introduction
- 2.1 Report Objectives and Scope
- 2.2 Product Definition and Industry Terminology
- 2.3 Market Inclusions and Exclusions
- 2.4 Research Process
- 2.4.1 Primary Research and Expert Interviews
- 2.4.2 Secondary Research and Source Review
- 2.4.3 Top-Down and Bottom-Up Estimation
- 2.4.4 Data Triangulation and Verification
- 2.5 Market Size Measurement Basis
- 2.5.1 2025: USD 13.5 million → 2035: USD 244.2 million
- 2.6 Historical and Forecast Reference Periods
- 2.6.1 Historical Period: 2018-2025
- 2.6.2 Base Year: 2025
- 2.6.3 Forecast Period: 2025-2035
- 2.7 Research Assumptions and Limitations
Chapter 3 Executive Summary
- 3.1 Market Snapshot and Key Findings
- 3.2 Base-Year Market Size, 2025
- 3.3 Forecast Market Size, 2035
- 3.4 Revenue and Volume Growth Outlook
- 3.5 Key Demand and Supply Indicators
- 3.6 Leading Market Segments
- 3.7 Fastest-Growing Market Opportunities
- 3.8 Regional Performance Highlights
- 3.9 Technology and Industry Transformation
- 3.10 Competitive Landscape Summary
- 3.11 Analyst View and Strategic Implications
Chapter 4 Australia Electric Vehicle Charger Operations & Maintenance Services Market Trends and Developments
- 4.1 Historical Industry Development, 2018-2025
- 4.2 Recent Market Trends and Developments
- 4.3 Demand and Customer Behavior Trends
- 4.4 Technology and Product Innovation
- 4.5 Artificial Intelligence, Automation and Digitalization
- 4.6 Local Manufacturing and Supply Chain Realignment
- 4.7 Industry Partnerships, Mergers and Acquisitions
- 4.8 Sustainability and Circular Economy Developments
- 4.9 Government and Private Sector Investment Trends
- 4.10 Emerging Business Models and Commercialization
- 4.11 Industry Developments and Announcements
Chapter 5 Australia Electric Vehicle Charger Operations & Maintenance Services Market Supply and Demand Analysis
- 5.1 Demand Trend and Consumption Analysis, 2018-2025
- 5.2 Demand Forecast, 2025-2035
- 5.3 Supply Chain Structure and Procurement Trends
- 5.4 Supply-Demand Gap and Bottlenecks
- 5.5 Import Dependence and Sourcing Structure
- 5.6 Regional Supply and Demand Concentration
Chapter 6 Australia Electric Vehicle Charger Operations & Maintenance Services Market Pricing Analysis
- 6.1 Pricing Structure and Measurement
- 6.2 Historical Pricing Trends, 2018-2025
- 6.3 Pricing Outlook, 2025-2035
- 6.4 Pricing by Product and Market Segment
- 6.5 Geographic Pricing Differences
- 6.6 Key Input, Energy, Labor and Logistics Costs
- 6.7 Contract Pricing and Purchasing Models
- 6.8 Pricing Sensitivity and Competitive Positioning
- 6.9 Price, Margin and Profitability Implications
Chapter 7 Australia Electric Vehicle Charger Operations & Maintenance Services Market Dynamics
- 7.1 Market Growth Drivers
- 7.1.1 Demand-Side Drivers
- 7.1.2 Technology and Innovation Drivers
- 7.1.3 Infrastructure and Investment Drivers
- 7.1.4 Regulatory and Policy Drivers
- 7.2 Market Restraints
- 7.2.1 Cost and Affordability Constraints
- 7.2.2 Technology and Adoption Barriers
- 7.2.3 Supply Chain and Operational Constraints
- 7.3 Market Challenges
- 7.3.1 Competitive Pressure and Margin Erosion
- 7.3.2 Skills, Infrastructure and Implementation Gaps
- 7.4 Emerging Market Opportunities
- 7.5 Market Dynamics Impact and Time-Horizon Assessment
Chapter 8 Australia Electric Vehicle Charger Operations & Maintenance Services Value Chain Analysis
- 8.1 Industry Value Chain Overview
- 8.2 Upstream Suppliers and Critical Inputs
- 8.3 Technology and Component Providers
- 8.4 Manufacturing or Service Delivery
- 8.5 Distribution, Channel Partners and Integrators
- 8.6 Downstream Applications and End Users
- 8.7 Value Addition and Profit Pools
- 8.8 Vertical Integration and Outsourcing
- 8.9 Supplier Concentration and Risk
- 8.10 Supply Chain Localization and Resilience
Chapter 9 Australia Electric Vehicle Charger Operations & Maintenance Services Market Regulations and Policies
- 9.1 Relevant Laws, Standards and Compliance Frameworks
- 9.2 Product, Service, Safety and Quality Requirements
- 9.3 Government Policies, Incentives and Subsidies
- 9.4 Imports, Exports and Trade Barriers
- 9.5 Public Procurement and Local Content Requirements
- 9.6 Data Protection, AI and Cybersecurity Compliance
- 9.7 Upcoming Policy Changes and Market Implications
Chapter 10 Australia Electric Vehicle Charger Operations & Maintenance Services Market Hotspots and Opportunities
- 10.1 Market Opportunity Mapping and Growth Hotspots
- 10.2 High-Growth Applications and Customer Groups
- 10.3 Underserved Markets and White-Space Opportunities
- 10.4 Emerging Technology and Product Opportunities
- 10.5 New Capacity and Investment Hotspots
- 10.6 Market Entry and Expansion Opportunities
- 10.7 Distribution and Partnership Opportunities
- 10.8 Near-Term and Long-Term Commercial Potential
- 10.9 Opportunity Attractiveness and Execution Risks
Chapter 11 Australia Electric Vehicle Charger Operations & Maintenance Services Market Outlook, 2025-2035
- 11.1 Market Size and Analysis
- 11.1.1 Revenue (Market Measurement: 2025: USD 13.5 million → 2035: USD 244.2 million)
- 11.1.2 Historical Market Size, 2018-2025
- 11.1.3 Base-Year Market Size, 2025
- 11.2 Market Forecast, 2025-2035
- 11.2.1 Revenue Forecast to 2035
- 11.2.2 CAGR and Year-on-Year Growth
- 11.2.3 Incremental Revenue Opportunity
- 11.3 Forecast Assumptions and Scenario Analysis
- 11.3.1 Base-Case Forecast
- 11.3.2 Optimistic and Conservative Scenarios
- 11.3.3 Technology, Pricing and Policy Sensitivities
- 11.4 Market Attractiveness and Growth Outlook
Chapter 12 Australia Electric Vehicle Charger Operations & Maintenance Services Market Segmentation and Outlook
- 12.1 Segmentation Summary and Market Shares, 2025
- 12.2 Largest and Fastest-Growing Segments
- 12.3 By Service Type - Market Size and Forecast, 2025-2035
- 12.3.1 Segment Definition and Scope
- 12.3.2 Historical Market Size, 2018-2025
- 12.3.3 Revenue Forecast, 2025-2035
- 12.3.4 Base-Year Market Share, 2025
- 12.3.5 Segment CAGR and Growth Drivers
- 12.3.6 Subsegment Market Size and Forecast
- 12.3.6.1 Preventive maintenance
- 12.3.6.2 Reactive maintenance
- 12.3.6.3 Remote monitoring
- 12.3.6.4 CaaS O&M component
- 12.3.7 Subsegment Pricing and Adoption Trends
- 12.3.8 Leading Suppliers and Competition
- 12.3.9 Regional Demand and Opportunities
- 12.4 By Customer Type - Market Size and Forecast, 2025-2035
- 12.4.1 Segment Definition and Scope
- 12.4.2 Historical Market Size, 2018-2025
- 12.4.3 Revenue Forecast, 2025-2035
- 12.4.4 Base-Year Market Share, 2025
- 12.4.5 Segment CAGR and Growth Drivers
- 12.4.6 Subsegment Market Size and Forecast
- 12.4.6.1 Charge point operators
- 12.4.6.2 Property owners
- 12.4.6.3 Fleet operators
- 12.4.6.4 Public authorities
- 12.4.6.5 Residential subscribers
- 12.4.7 Subsegment Pricing and Adoption Trends
- 12.4.8 Leading Suppliers and Competition
- 12.4.9 Regional Demand and Opportunities
- 12.5 By Application - Market Size and Forecast, 2025-2035
- 12.5.1 Segment Definition and Scope
- 12.5.2 Historical Market Size, 2018-2025
- 12.5.3 Revenue Forecast, 2025-2035
- 12.5.4 Base-Year Market Share, 2025
- 12.5.5 Segment CAGR and Growth Drivers
- 12.5.6 Subsegment Market Size and Forecast
- 12.5.6.1 Public corridor charging
- 12.5.6.2 Destination charging
- 12.5.6.3 Workplace charging
- 12.5.6.4 Depot charging
- 12.5.6.5 Home charging
- 12.5.7 Subsegment Pricing and Adoption Trends
- 12.5.8 Leading Suppliers and Competition
- 12.5.9 Regional Demand and Opportunities
- 12.6 By Revenue Model - Market Size and Forecast, 2025-2035
- 12.6.1 Segment Definition and Scope
- 12.6.2 Historical Market Size, 2018-2025
- 12.6.3 Revenue Forecast, 2025-2035
- 12.6.4 Base-Year Market Share, 2025
- 12.6.5 Segment CAGR and Growth Drivers
- 12.6.6 Subsegment Market Size and Forecast
- 12.6.6.1 Fixed recurring contracts
- 12.6.6.2 Usage-linked service fees
- 12.6.6.3 Time-and-materials contracts
- 12.6.6.4 Performance-linked contracts
- 12.6.7 Subsegment Pricing and Adoption Trends
- 12.6.8 Leading Suppliers and Competition
- 12.6.9 Regional Demand and Opportunities
- 12.7 Segment Growth Comparison
- 12.8 Segment Attractiveness and Priority Matrix
Chapter 13 Australia Electric Vehicle Charger Operations & Maintenance Services End-Use and Application Market Outlook
- 13.1 End-Use Industry and Customer Demand Structure
- 13.2 Leading Applications and Customer Groups
- 13.3 End-Use Market Size, Share and Forecast
- 13.4 Major End-Use Industry Deep Dives
- 13.4.1 Customer Requirements and Use Cases
- 13.4.2 Demand and Replacement Cycles
- 13.4.3 Technical and Regulatory Considerations
- 13.4.4 Purchasing and Procurement Models
- 13.4.5 Leading Vendors and Distribution Channels
- 13.4.6 Forecast and Commercial Opportunities
- 13.5 Emerging Applications and Cross-Segment Demand
- 13.6 End-Use Industry Investment Priorities
Chapter 14 Australia Electric Vehicle Charger Operations & Maintenance Services Geographic Market Outlook, 2025-2035
- 14.1 Domestic Market Distribution and Demand Clusters
- 14.2 State- or Province-Wise Market Size and Forecast, 2025-2035
- 14.3 City and Metropolitan Market Outlook
- 14.4 Industrial, Manufacturing and Commercial Clusters
- 14.5 Geographic Concentration of Key End Users
- 14.6 Local Pricing and Purchasing Differences
- 14.7 Domestic Production Facilities and Capacity Map
- 14.8 Local Infrastructure and Project Pipeline
- 14.9 State-Level Policy and Incentive Differences
- 14.10 Subnational Investment Hotspots and Opportunities
- 14.11 Distribution and Logistics Networks
- 14.12 Domestic Competitive Footprint
Chapter 15 Australia Electric Vehicle Charger Operations & Maintenance Services Technology, Innovation and Sustainability Outlook
- 15.1 Technology Landscape and Maturity
- 15.2 Product, Process and Service Innovation
- 15.3 AI, Automation and Digital Tools in the Industry
- 15.4 Technology Adoption and Performance Benchmarking
- 15.5 Innovation Pipeline and R&D Investment
- 15.6 Energy Efficiency and Resource Management
- 15.7 Sustainability, Recycling and Circularity
- 15.8 Technology Roadmap, 2025-2035
- 15.9 Risks of Obsolescence and Technology Substitution
Chapter 16 Australia Electric Vehicle Charger Operations & Maintenance Services Market Key Strategic Imperatives
- 16.1 Growth and Market Entry Priorities
- 16.2 High-Return Products and Segments
- 16.3 Pricing, Profitability and Cost Optimization
- 16.4 Technology Investment and Product Differentiation
- 16.5 Supply Chain Localization and Resilience
- 16.6 Distribution and Customer Acquisition
- 16.7 Partnership, Acquisition and Capacity Strategy
- 16.8 Regional Expansion Priorities
- 16.9 Short-, Medium- and Long-Term Actions
Chapter 17 Competition Outlook
- 17.1 Industry Competition Characteristics
- 17.2 Market Structure and Concentration
- 17.3 Market Share and Competitive Positioning, 2025
- 17.4 Company-Wise Revenue and Product Benchmarking
- 17.5 Production and Service Capacity Benchmarking
- 17.6 Technology, Pricing and Differentiation
- 17.7 Regional Footprint and Distribution Strength
- 17.8 Mergers, Acquisitions and Strategic Alliances
- 17.9 New Entrants and Competitive Threats
- 17.10 Porter's Five Forces and Industry Attractiveness
- 17.11 Competitive Outlook, 2025-2035
Chapter 18 Company Profiles
- 18.1 Company Coverage and Selection Criteria
- 18.2 JET Charge
- 18.2.1 Business Description
- 18.2.2 Company Ownership and Geographic Presence
- 18.2.3 Product and Service Portfolio
- 18.2.4 Manufacturing and Operating Footprint
- 18.2.5 Financial Performance and Investment
- 18.2.6 Market Share and Competitive Position
- 18.2.7 Technology and Innovation Capabilities
- 18.2.8 Strategic Alliances or Partnerships
- 18.2.9 Recent Developments
- 18.2.10 Growth Strategy and Outlook
- 18.3 EVSE Australia
- 18.4 Chargefox
- 18.5 Exploren
- 18.6 Tritium
- 18.7 Other Relevant Market Participants
Note: Every listed company is profiled on the structure shown under the first company. The company list is preliminary and may change based on research findings, market developments, data availability and client requirements.
Chapter 19 Disclaimer
- 19.1 Research and Forecast Disclaimer
- 19.2 Data Source and Estimation Limitations
Note: The depth of individual sections depends on data availability for this market. Volume, capacity, trade and other unit-based metrics are included where applicable.

