
Larger fleets and organized repair lift parts demand
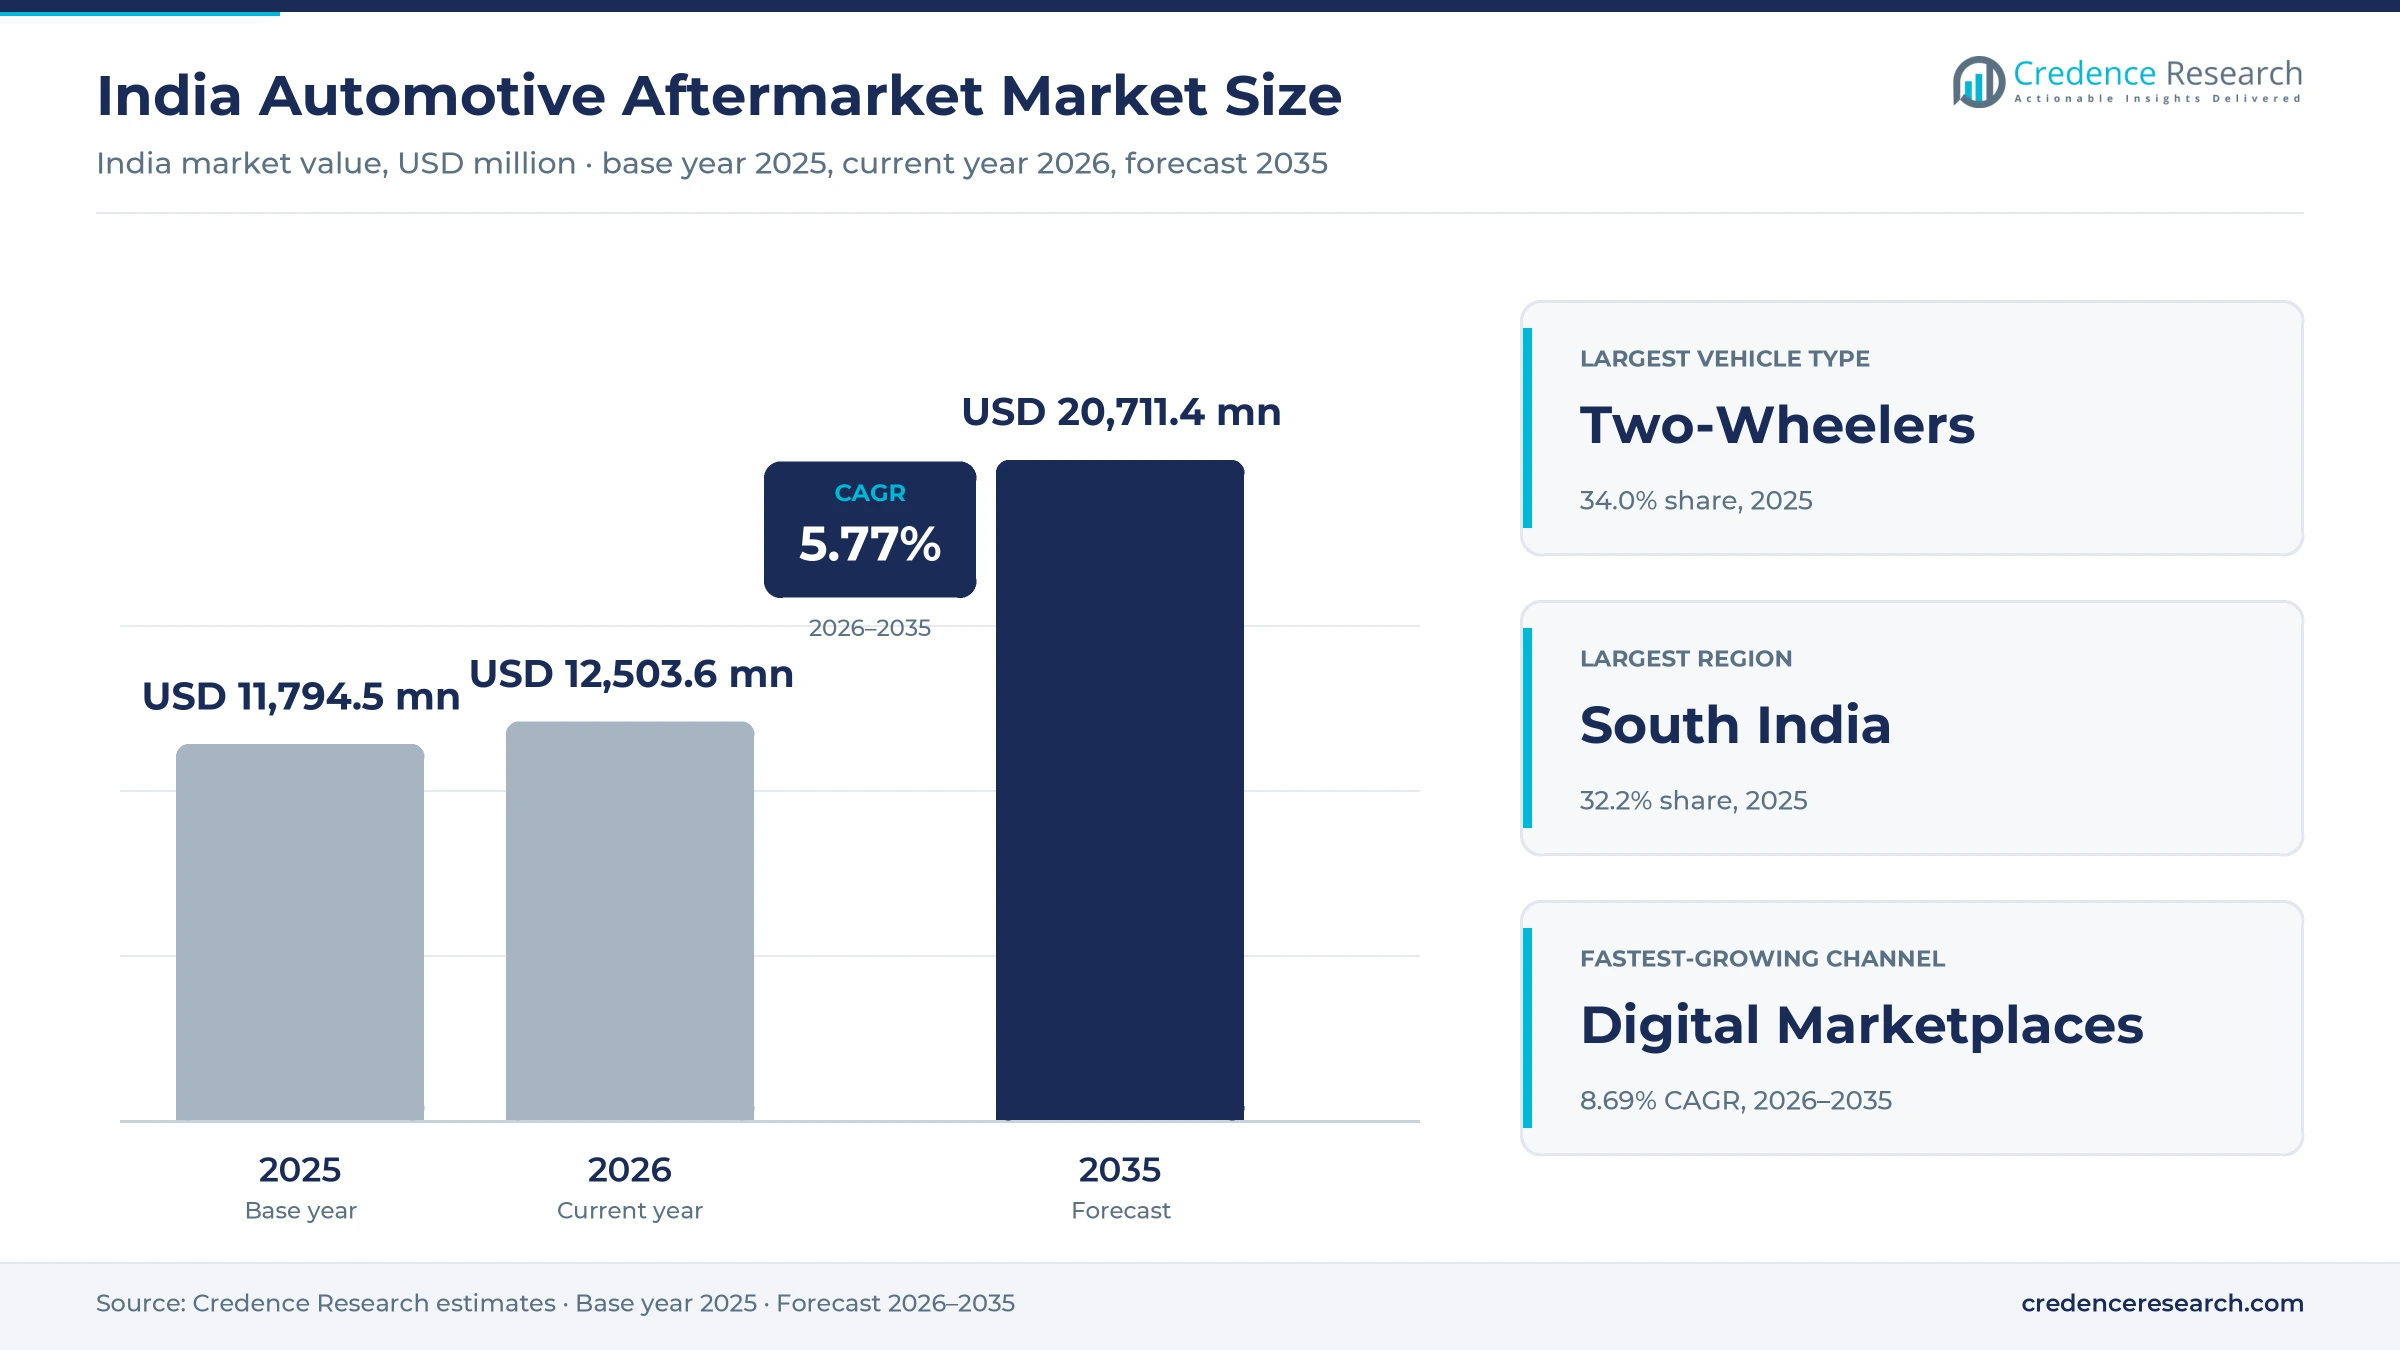
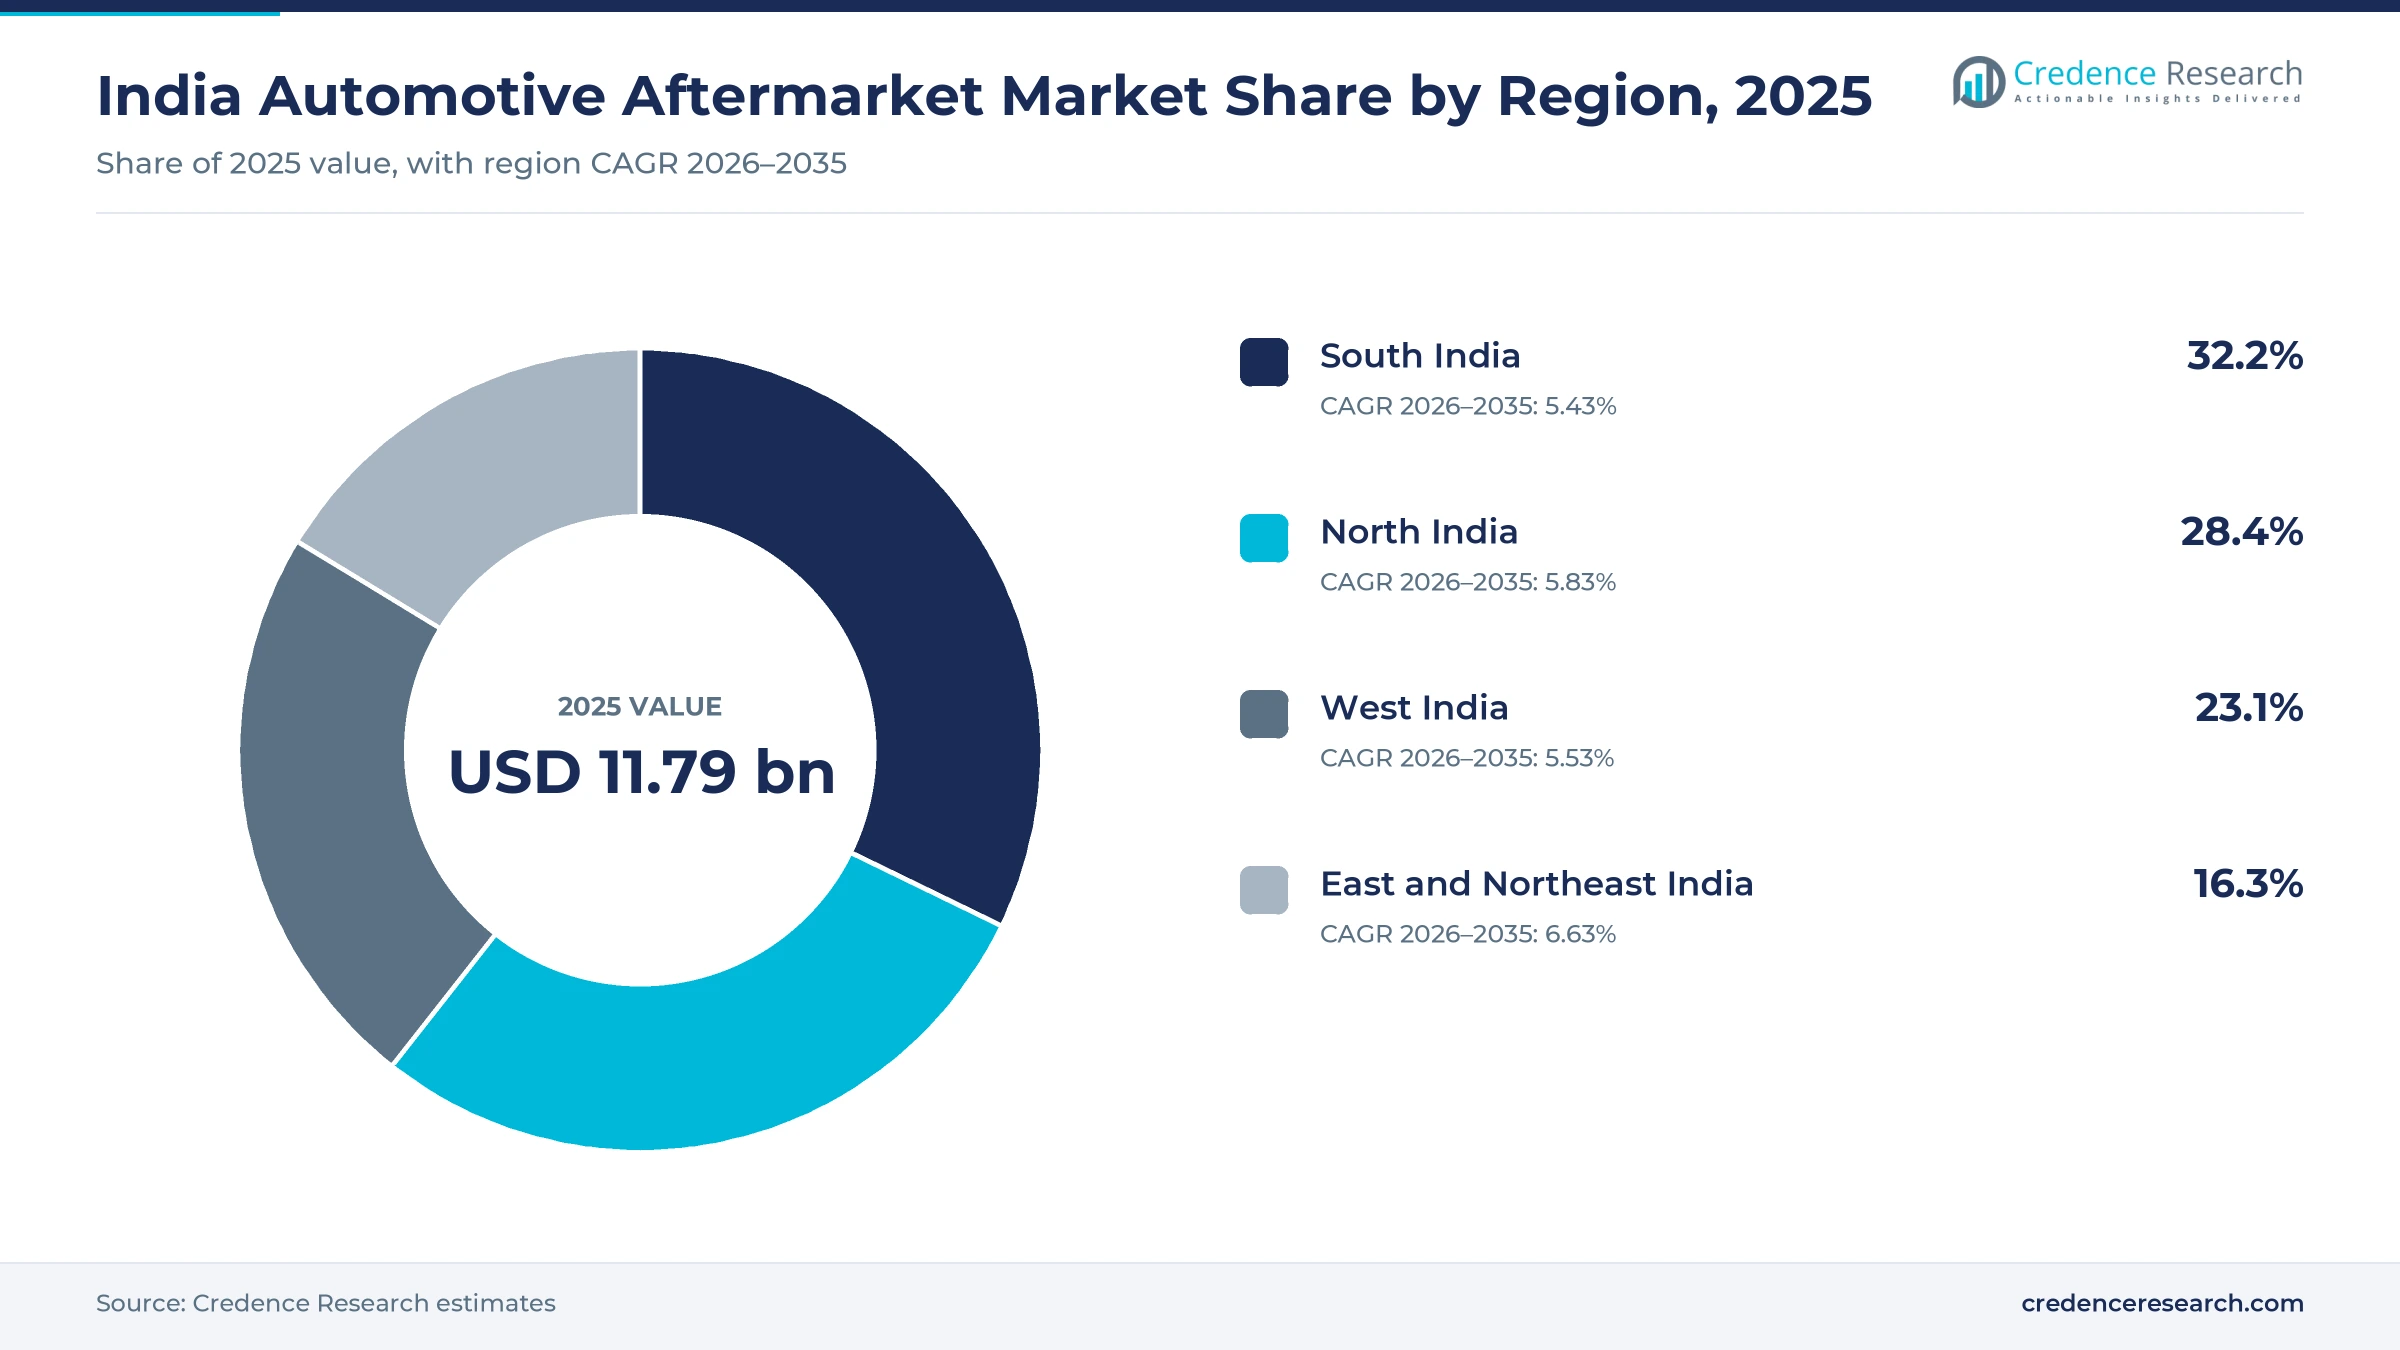
The India automotive aftermarket market was valued at USD 11.79 billion in 2025 and is projected to increase from USD 12.50 billion in 2026 to USD 20.71 billion by 2035, registering a CAGR of 5.77% during 2026–2035. Demand comes from a fast-growing vehicle fleet, longer vehicle lives, heavy daily use of two-wheelers and commercial vehicles, and a shift from roadside mechanics toward organized workshops. South India held the largest regional share, 32.2% in 2025, because southern states combine high vehicle ownership with dense workshop and parts distribution networks. East and Northeast India grows fastest at 6.63% a year, as two-wheeler and three-wheeler fleets expand in smaller towns. The GST Council moved all auto parts to a uniform 18% rate from Sept. 22, 2025, which lowered the tax on many parts that earlier sat at 28%. Electric vehicle service networks are also opening new demand for diagnostics, batteries and trained technicians.
Which replacement parts and services does this estimate count?
The estimate measures spending in India on replacement parts, consumables and accessories bought after a vehicle is sold, covering two-wheelers, passenger vehicles, commercial vehicles and three-wheelers. It includes filters, brake parts, clutches, bearings, suspension parts, batteries, lighting, electrical parts and engine oils sold through independent distributors, carmaker service networks, online stores and direct fleet supply. Values are stated in USD million at current prices, converted from Indian rupees at average annual exchange rates.
The estimate excludes parts fitted on new vehicles at the factory, warranty replacements paid by vehicle makers, insurance repair labor and the resale value of used vehicles. It also excludes standalone fuel sales and new tires sold with new vehicles. The value chain runs from component makers and importers through national distributors, regional wholesalers and retailers to workshops, fleet operators and vehicle owners.
India Automotive Aftermarket Market Insights
- The India automotive aftermarket was valued at USD 11.79 billion in 2025 and is projected to reach USD 20.71 billion by 2035, registering a CAGR of 5.77% during 2026–2035.
- South India held 32.2% of 2025 value, because southern states combine high vehicle ownership with dense workshop and parts distribution networks.
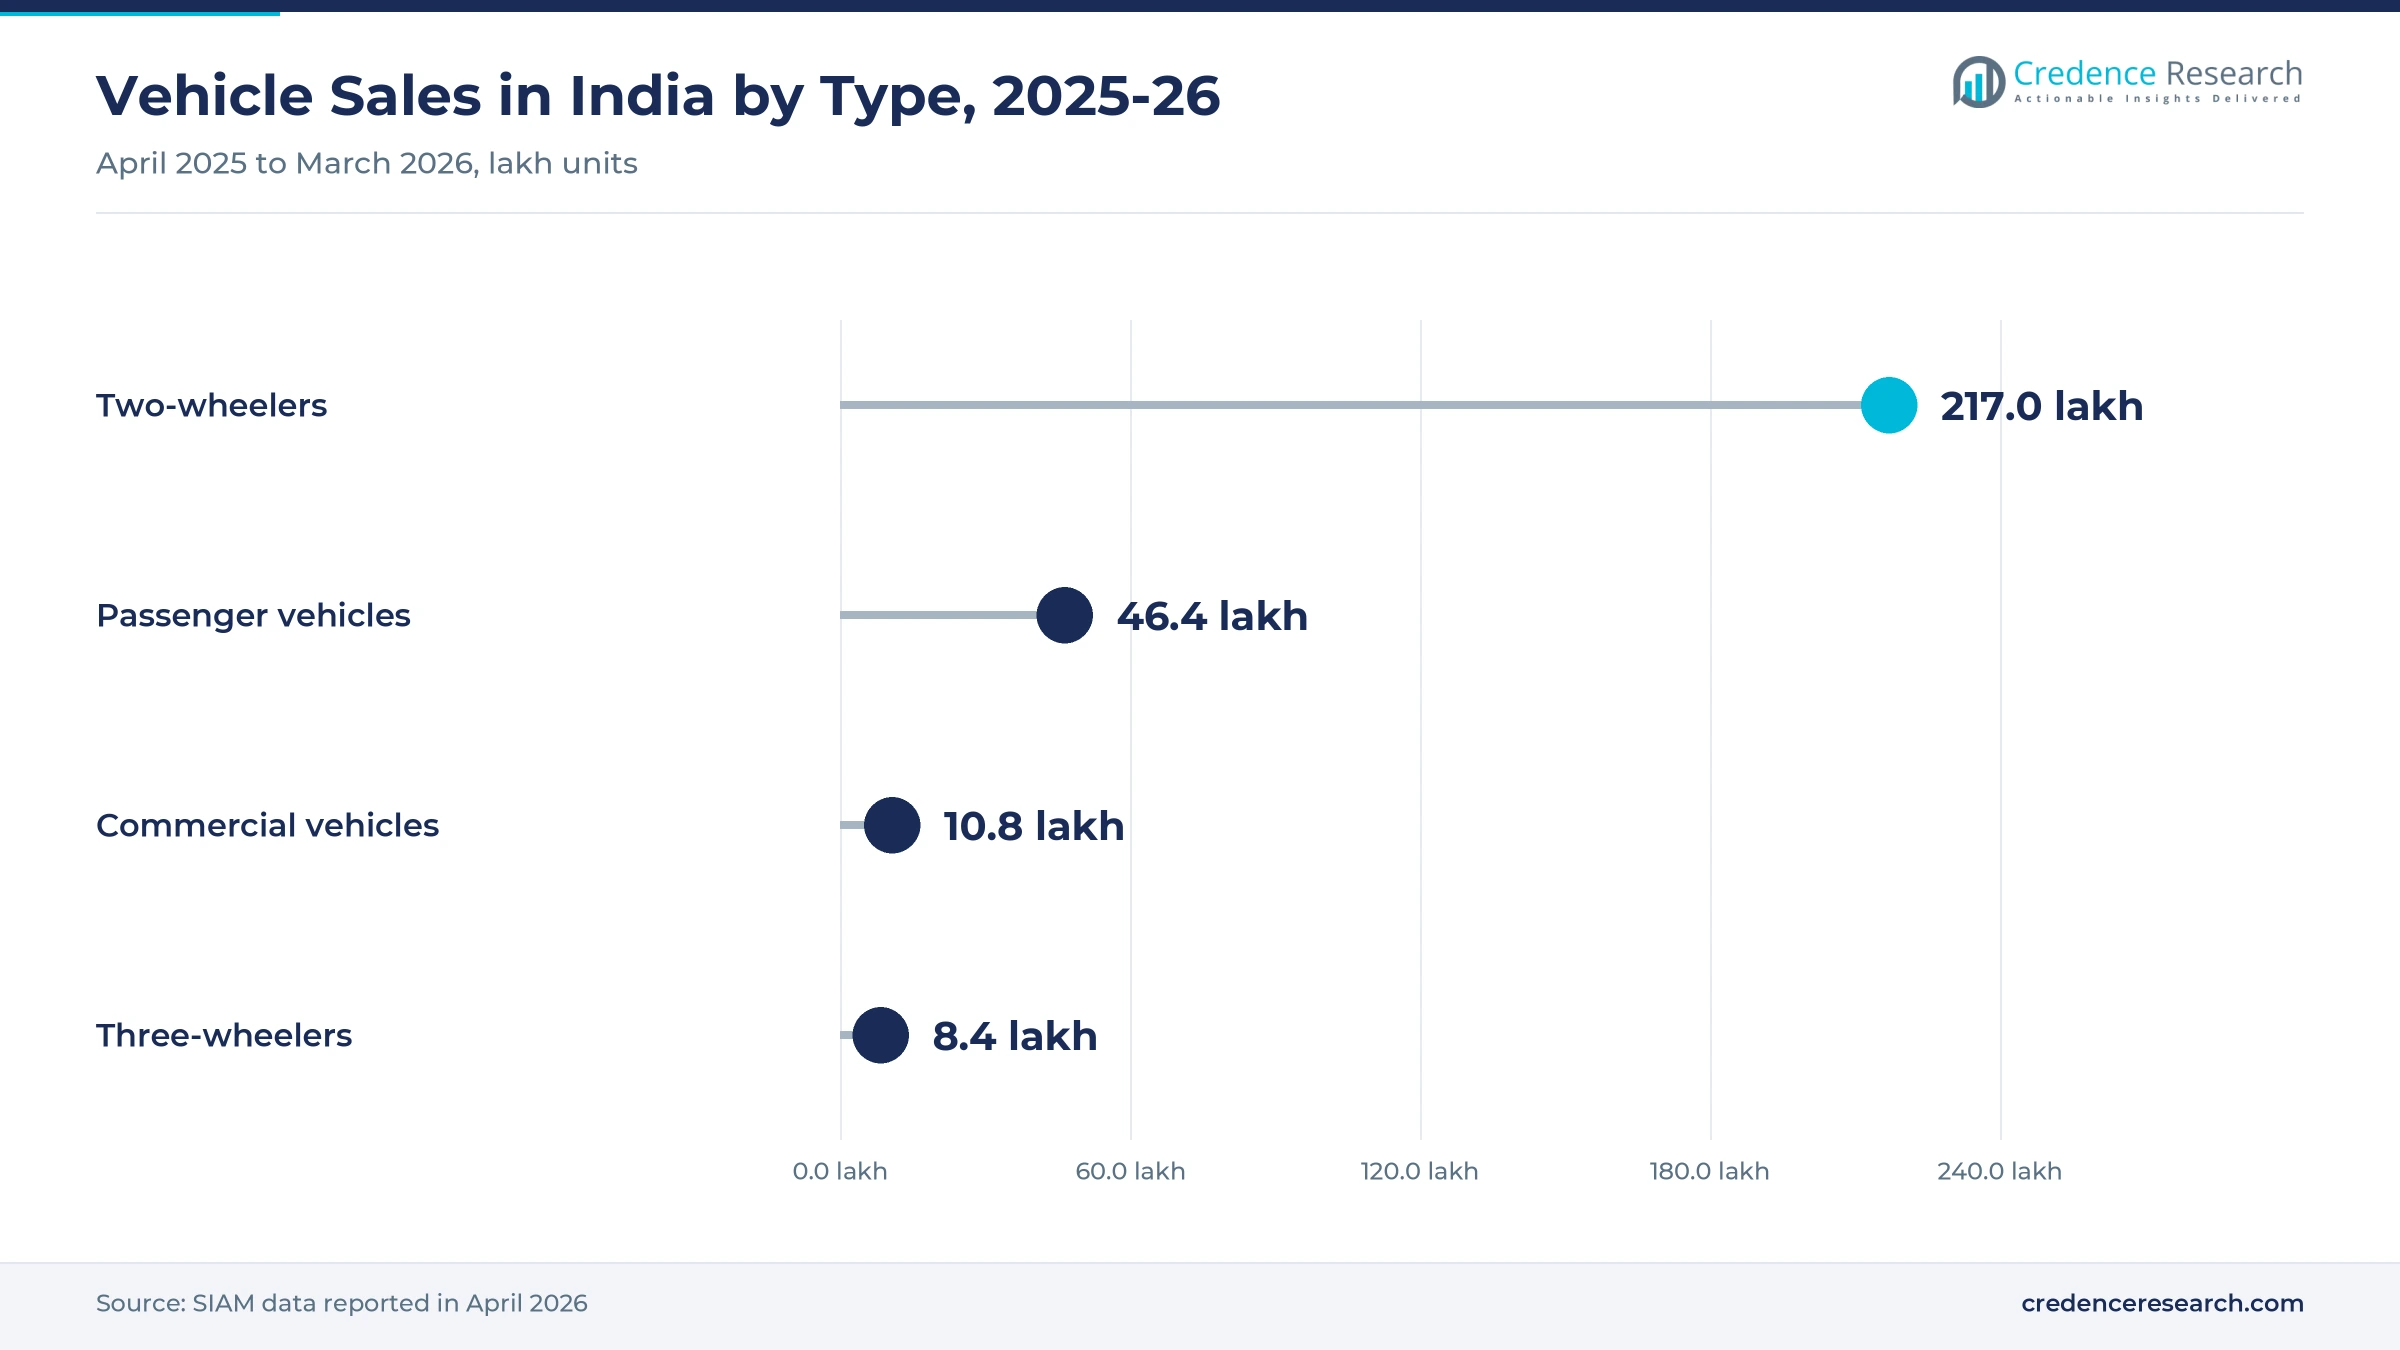
- Two-wheelers led with 34.0% of 2025 value, because India sold about 2.17 crore two-wheelers in 2025-26 and most are serviced at local workshops.
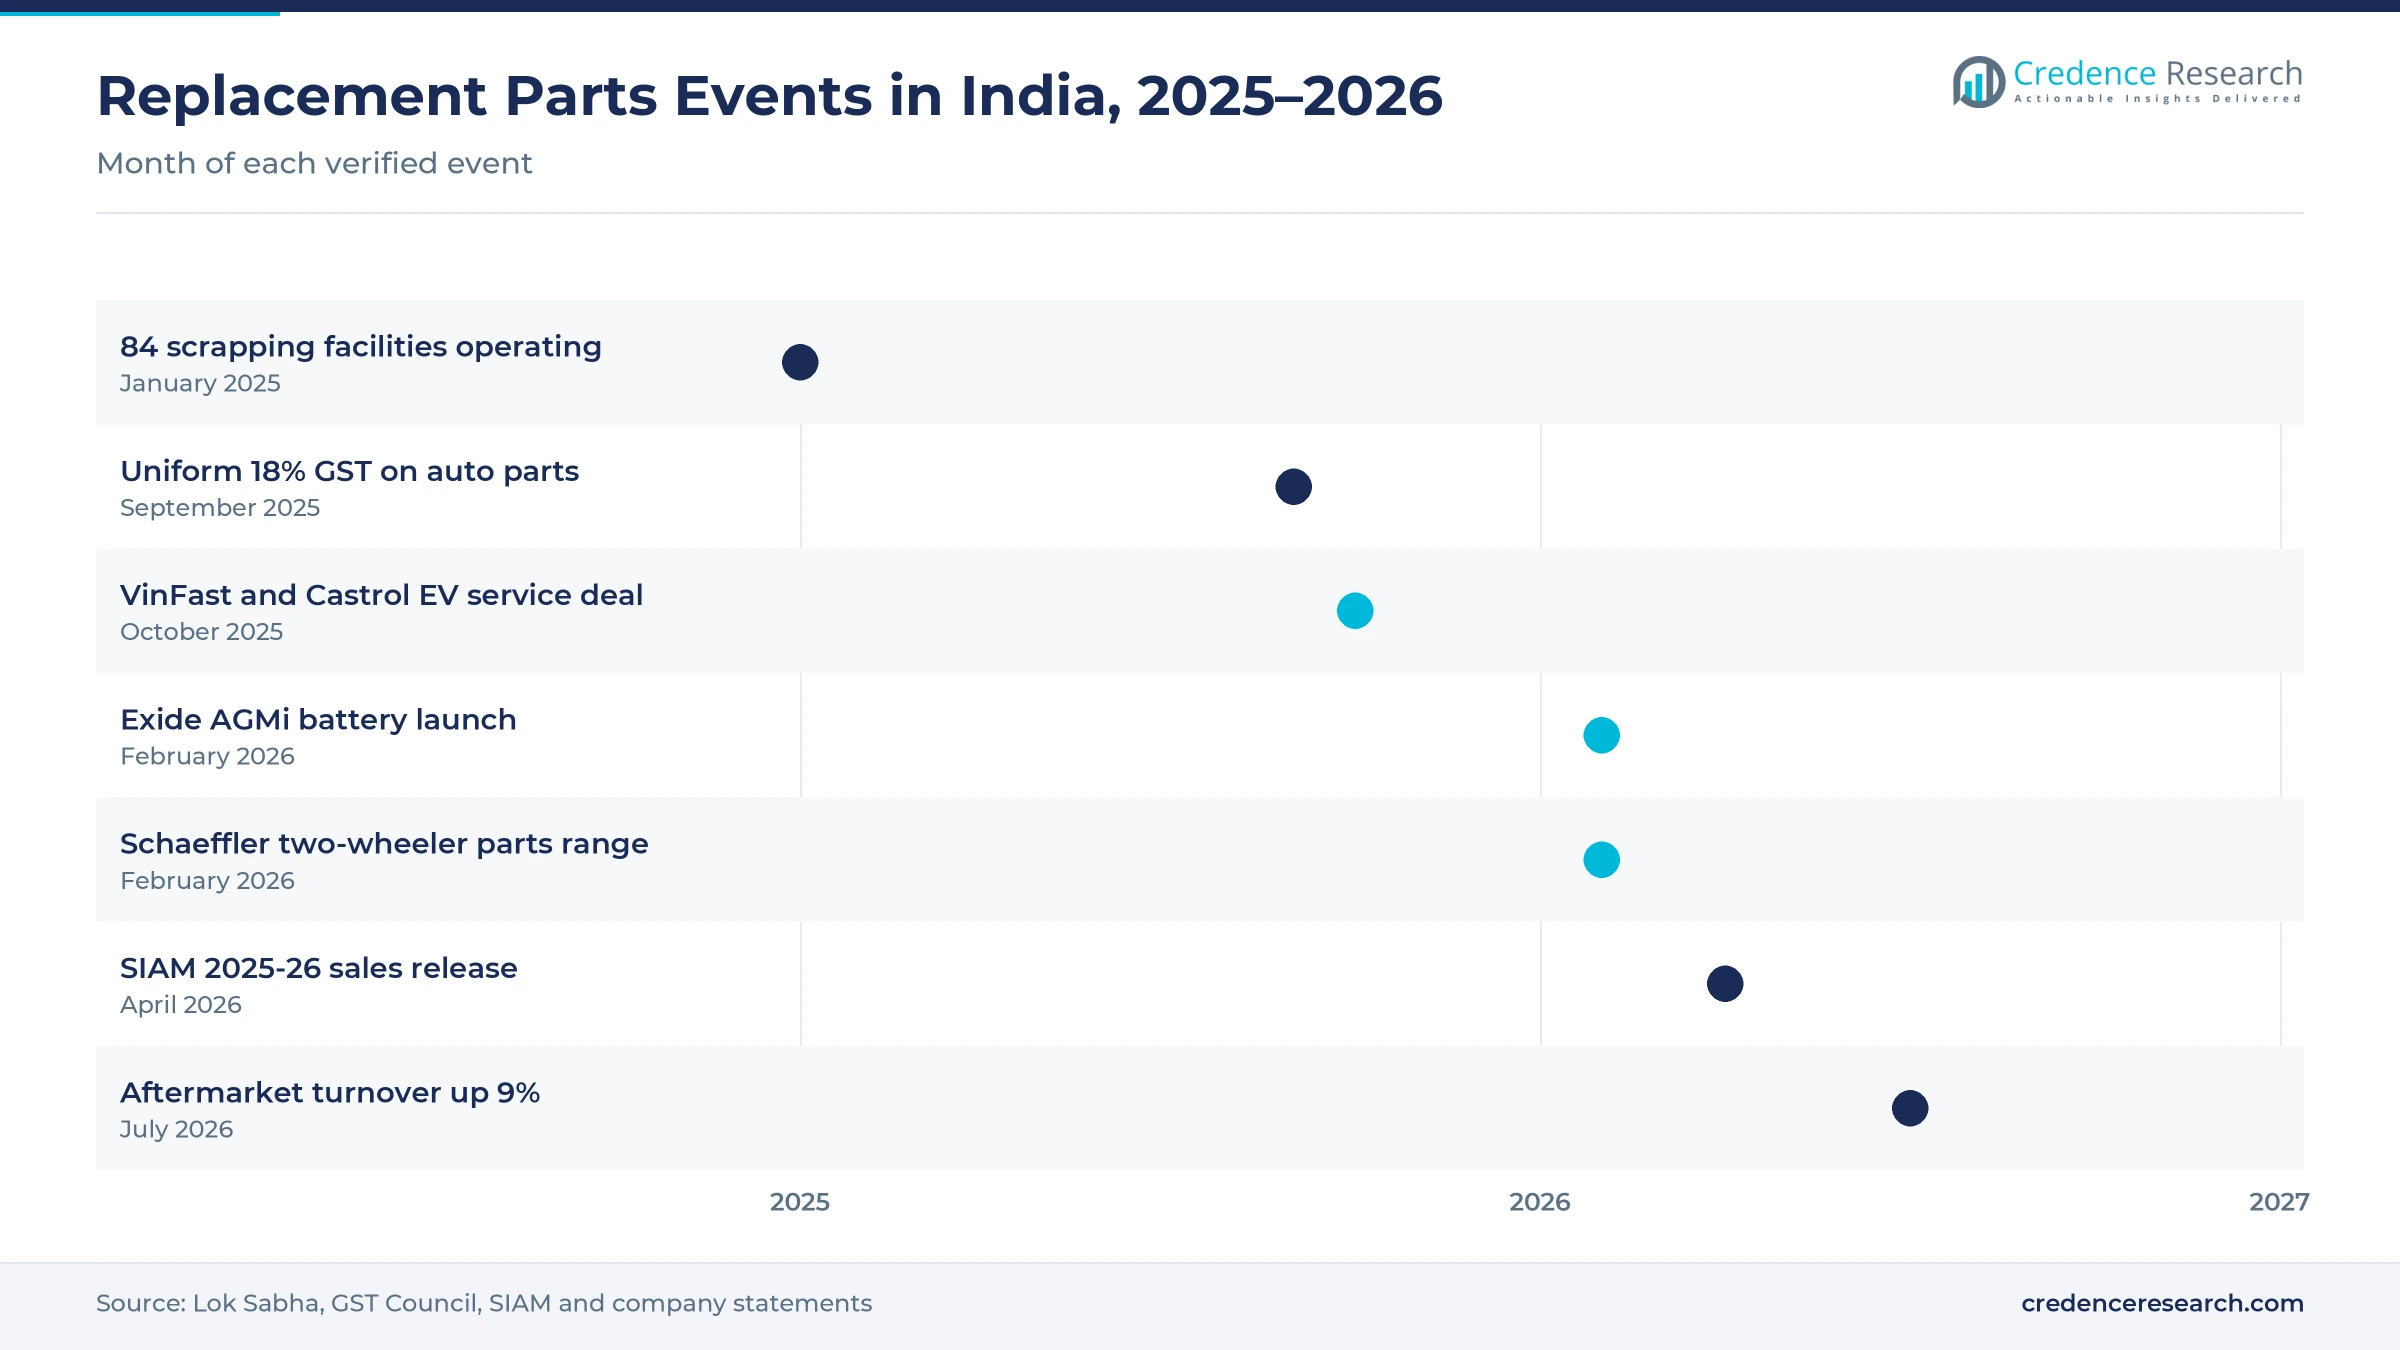
- The GST Council set a uniform 18% rate on all auto parts from Sept. 22, 2025, which removed the earlier 28% rate on many items.
- Digital marketplaces grow fastest among sales channels at 8.69% a year during 2026–2035, as workshops order parts online for faster delivery.
Two-wheelers and wear parts carry most replacement value
Why do two-wheelers account for the largest share of replacement demand?
Based on vehicle type, the market is categorized into two-wheelers, passenger vehicles, commercial vehicles and three-wheelers. Two-Wheelers led with 34.0% of 2025 value, because the two-wheeler fleet is several times larger than the car fleet and is used daily for commuting and delivery. Three-Wheelers grow fastest at 6.44% a year, as electric and CNG three-wheelers spread in urban and rural transport.
Why does wear-and-tear replacement lead parts spending?
Based on usage type, the market is categorized into routine maintenance, wear-and-tear replacement, breakdown repair and performance and customization. Wear-and-Tear Replacement led with 40.0% of 2025 value, because brake pads, clutches, bearings and suspension parts wear quickly on crowded and uneven roads. Performance and Customization grows fastest at 6.98% a year, as younger owners upgrade lighting, wheels and accessories.
Why do independent distributors still move most replacement parts?
Based on sales channel, the market is categorized into independent distributors, OEM authorized channels, digital marketplaces and direct fleet supply. Independent Distributors led with 52.0% of 2025 value, because most vehicles older than the warranty period are serviced at independent workshops supplied by local wholesalers. Digital Marketplaces grow fastest at 8.69% a year, as online ordering spreads among workshops.
Why do combustion vehicles still dominate parts demand?
Based on powertrain, the market is categorized into internal combustion engine, hybrid, battery electric vehicles and alternative fuel vehicles. Internal Combustion Engine led with 92.5% of 2025 value, because petrol and diesel vehicles make up almost all of the vehicles now on Indian roads. Battery Electric Vehicles grow fastest at 12.79% a year, as electric scooters, three-wheelers and cars reach their first out-of-warranty service cycles.
| Segment Group | Leading Sub-segment | Share, 2025 | Fastest-growing Sub-segment | CAGR, 2026–2035 |
|---|---|---|---|---|
| By Vehicle Type | Two-Wheelers | 34.0% | Three-Wheelers | 6.44% |
| By Usage Type | Wear-and-Tear Replacement | 40.0% | Performance and Customization | 6.98% |
| By Sales Channel | Independent Distributors | 52.0% | Digital Marketplaces | 8.69% |
| By Powertrain | Internal Combustion Engine | 92.5% | Battery Electric Vehicles | 12.79% |
Request a Free Sample
Fill in your details and we'll send you a free sample report.
- Sample data tables & charts
- Research methodology
Fleet growth, formal repair and older vehicles drive demand
How does vehicle parc expansion and heavy use lift parts demand?
Vehicle parc expansion lifts parts demand, because every new vehicle adds years of future service, wear parts and consumables. India sold about 2.17 crore two-wheelers in 2025-26, up 10.7%, and 46.43 lakh passenger vehicles, up 7.9%, according to SIAM figures reported in April 2026. Commercial vehicle sales rose 12.6% to about 10.8 lakh units, while three-wheeler sales grew 12.8% to 8.36 lakh units in the same year. These vehicles run long daily distances for commuting, delivery and freight, which speeds up wear on brakes, clutches and tires. As a result, two-wheelers lead with 34.0% of 2025 value, and wear-and-tear replacement holds 40.0% of spending.
Why does organized service and digital channel formalization matter?
Organized service and digital channel formalization support growth, because branded workshops and online ordering raise the share of genuine and branded parts. Auto component makers reported that aftermarket turnover rose 9% in 2025-26, helped by a larger vehicle fleet and a more organized repair network. Castrol India runs more than 750 Castrol Auto Service workshops in over 300 cities and reaches more than 150,000 retail outlets. The GST Council also moved all auto parts to a uniform 18% rate from Sept. 22, 2025, which narrows the price gap between billed and unbilled parts. Consequently, branded workshops and OEM authorized channels gain from cleaner billing and genuine parts.
How do used vehicles and longer replacement cycles deepen demand?
Longer vehicle lives deepen replacement demand, because owners keep cars, two-wheelers and trucks running well beyond the warranty period. Real GDP grew 6.5% in 2024-25, according to MoSPI provisional estimates released on May 30, 2025, which supported household spending on vehicle upkeep. India had 84 registered vehicle scrapping facilities in operation by January 2025, according to a Lok Sabha reply, so most older vehicles stay in use rather than being scrapped. Scrapping targets for producers apply to transport vehicles after 15 years and to other vehicles after 20 years. As a result, breakdown repair and routine maintenance remain steady sources of workshop demand across smaller towns.
Why does the growing electric fleet add new service needs?
The growing electric fleet adds new service needs, because electric two-wheelers, three-wheelers and cars require battery checks, software diagnostics and new brake and tire wear patterns. About 23 lakh electric vehicles were sold in 2025, or 8% of all new vehicle registrations, according to Vahan data. Electric two-wheelers made up about 12.8 lakh of those sales. The PM E-DRIVE scheme has an outlay of Rs 10,900 crore over two years and targets 24.79 lakh electric two-wheelers. In turn, battery electric vehicles grow fastest by powertrain at 12.79% a year, as more electric scooters, three-wheelers and cars leave warranty.
EV service, branded workshops and online parts gain ground
How is the rise of EV-ready multi-brand workshops playing out?
Multi-brand workshops are rising as an EV service channel, because new vehicle brands need trained repair partners faster than they can build their own networks. VinFast India signed an agreement with Castrol India that was reported on Oct. 1, 2025, under which selected Castrol Auto Service workshops add VinFast service bays and certified EV technicians. VinFast planned 35 dealerships across 27 cities by the end of 2025, which shows how quickly the service need grows. Schaeffler India also showed EV-ready repair solutions and its REPXPERT workshop training program at a New Delhi trade show in February 2026. Therefore, battery electric vehicles still hold a small base but grow fastest by powertrain.
Why is the shift to premium batteries and lubricants gaining pace?
Vehicle owners are shifting toward premium batteries and lubricants, because newer cars carry more electronics, start-stop systems and tighter engine tolerances. Exide launched its AGMi range of absorbent glass mat batteries for the replacement market on Feb. 3, 2026, in five sizes for cars with heavy electrical loads. The range first reaches select partners in the top 10 Indian cities, with a phased rollout after that. Castrol India also blends engine oils at three plants for workshops and retailers across the country. As a result, demand for synthetic engine oils and premium batteries supports higher value per service visit.
Can two-wheeler parts ranges from branded suppliers open new demand?
Branded two-wheeler parts ranges offer a clear opening, because the largest vehicle group is still served mainly by unbranded parts and local mechanics. Schaeffler India showed a new two-wheeler spare parts range, including bearings, fuel injectors, clutch plates and brake pads, at an industry show held from Feb. 5 to 7, 2026. Uno Minda displayed engine oils, alloy wheels, electric vehicle spares and batteries at the same event on a 240 square meter stand. Uttar Pradesh accounted for 15.7% of national two-wheeler sales in April to June 2026, according to SIAM state data. Therefore, branded suppliers can win share in the two-wheeler segment, which leads with the largest share of value.
Will online parts ordering create an opening for faster supply?
Online parts ordering creates an opening, because workshops want quick delivery, clear prices and confirmed fit for a wide range of models. Exide alone lists batteries from 2.5Ah to 20,200Ah across its product line, which shows how wide catalogs have become for local shops. India also had about 2.17 crore two-wheeler sales and 46.43 lakh passenger vehicle sales in 2025-26, which widens the catalog each year. Uno Minda said in January 2026 that the replacement business must move from supplying parts to providing high-tech solutions. Consequently, digital marketplaces gain share from a small base, while independent distributors still hold 52.0% of 2025 value.
Fake parts, skill gaps and EV shifts weigh on suppliers
How do counterfeit parts hurt branded suppliers and owners?
Counterfeit and low-grade parts hurt branded suppliers, because fake filters, brake pads and bearings sell at much lower prices in informal markets. Vehicle owners often cannot tell real parts from copies, which raises safety risks and repeat repairs. As a result, branded makers lose sales and face warranty disputes. Suppliers respond with holograms, QR codes and mechanic loyalty programs that reward the use of genuine parts, while trade bodies push for stronger enforcement.
Why do technician skill gaps slow the move to complex repairs?
Technician skill gaps slow the move to complex repairs, because newer vehicles use electronic controls, sensors and software that many roadside mechanics have not been trained to handle. Wrong diagnosis leads to repeat visits, wasted parts and higher bills for owners. Consequently, owners return to authorized service centers, which raises their costs. Component makers and oil companies run training programs, but coverage in smaller towns remains thin compared with demand.
How does the shift to electric vehicles change parts demand?
The shift to electric vehicles changes parts demand, because battery electric vehicles do not need engine oil, spark plugs, exhaust parts or clutch plates. Suppliers that depend on engine and transmission parts will see slower growth as electric scooters and three-wheelers spread. In turn, they must add battery, motor and electronics service products. Many firms are already showing electric vehicle spares and training at trade fairs, including the New Delhi show in February 2026.
Why do fragmented distribution and credit terms squeeze margins?
Fragmented distribution squeezes margins, because parts move through several layers of distributors, wholesalers and retailers before they reach a workshop. Each layer adds cost and often extends long credit periods to small buyers. As a result, suppliers carry high inventory and collection risk. Digital ordering platforms and direct supply to large fleets help reduce these layers over time, although small retailers still depend on wholesaler credit.
South India leads while the east and northeast grow fastest
| Region | Value, 2025 (USD billion) | Share, 2025 | CAGR, 2026–2035 |
|---|---|---|---|
| South India | 3.80 | 32.2% | 5.43% |
| North India | 3.35 | 28.4% | 5.83% |
| West India | 2.72 | 23.1% | 5.53% |
| East and Northeast India | 1.92 | 16.3% | 6.63% |
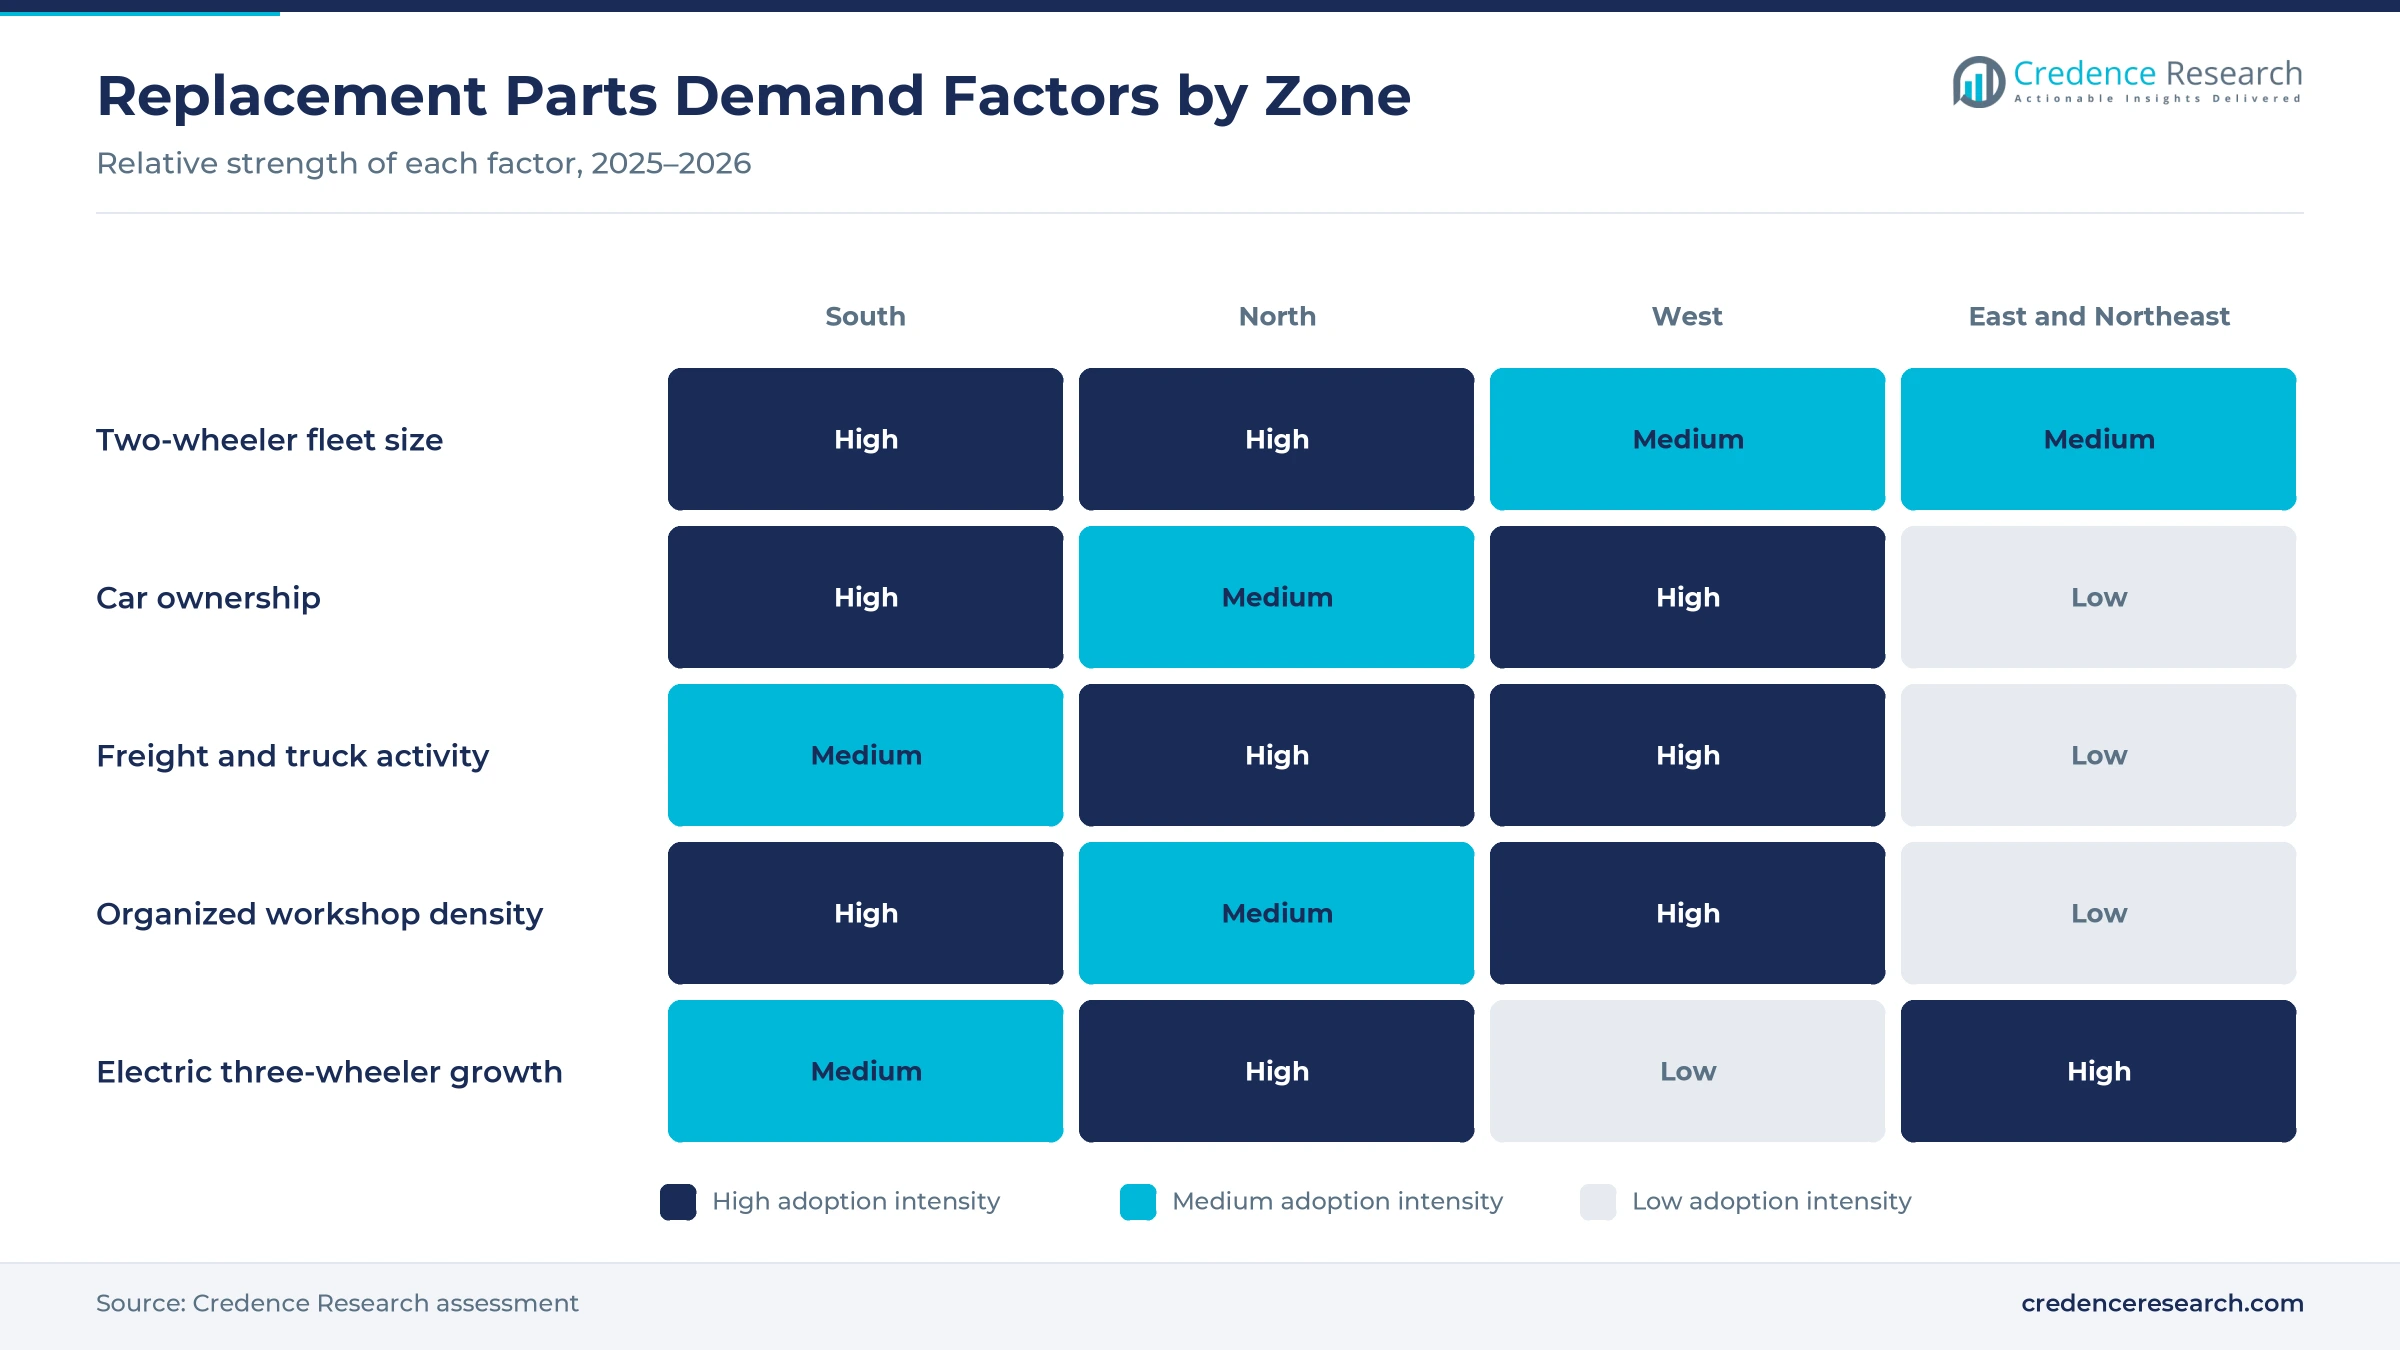
How do high ownership and dense workshops keep the south ahead?
South India held 32.2% of 2025 value and grows at 5.43% a year, because Tamil Nadu, Karnataka, Kerala, Andhra Pradesh and Telangana have high two-wheeler and car ownership. The region also hosts large vehicle plants around Chennai and Bengaluru, which supports dense supplier and distributor networks. VinFast's plant at Thoothukudi, Tamil Nadu, has an initial capacity of 50,000 vehicles a year, which adds a new brand to the service base.
Why does Uttar Pradesh anchor northern demand?
North India held 28.4% of 2025 value and grows at 5.83% a year, because Uttar Pradesh, Delhi, Haryana, Punjab and Rajasthan hold a very large two-wheeler and commercial vehicle fleet. Uttar Pradesh accounted for 10.6% of national passenger vehicle sales in April to June 2026, second only to Maharashtra. Long freight routes across the northern plains also raise wear on truck brakes, clutches and replacement tires.
How do car ownership and freight hubs shape the west?
West India held 23.1% of 2025 value and grows at 5.53% a year, because Maharashtra and Gujarat combine high car ownership with major ports and freight corridors. Maharashtra accounted for 11.6% of national passenger vehicle sales and 13.8% of commercial vehicle sales in April to June 2026. As a result, demand for car service parts and truck components is strong in Mumbai, Pune and Ahmedabad.
Why are East and Northeast India growing fastest?
East and Northeast India held 16.3% of 2025 value and grows fastest at 6.63% a year, because two-wheeler and three-wheeler fleets are expanding quickly in Bihar, West Bengal, Odisha, Assam and nearby states. Electric rickshaws are common across the zone, which raises demand for lead-acid batteries and simple electrical parts.
Tax relief, EV service deals and new product launches
| Development | Status and market relevance |
|---|---|
| In September 2025, the GST Council moved all auto parts to a uniform 18% rate. | Removes the earlier 28% rate on many replacement parts |
| In October 2025, VinFast India signed an agreement with Castrol India for EV service at selected Castrol Auto Service workshops. | Adds EV service bays and certified technicians |
| In February 2026, Exide launched its AGMi absorbent glass mat battery range for the replacement market. | Targets cars with start-stop systems and heavy electrical loads |
| In February 2026, Schaeffler India showed a new two-wheeler spare parts range at a New Delhi trade show. | Covers bearings, fuel injectors, clutch plates and brake pads |
| In July 2026, auto component makers reported that aftermarket turnover rose 9% in 2025-26. | Points to a larger fleet and more organized repair |
Diagnostics, AGM batteries and EV tools change repair work
- Plug-in diagnostic tools read fault codes from engine, brake and battery systems, which helps mechanics fix problems without trial and error.
- AGM and enhanced batteries support start-stop systems and heavy electrical loads in newer cars, which raises the value of each battery replacement.
- EV service equipment lets workshops test battery health, motor performance and charging faults, which opens a new line of paid service work.
- Online parts catalogs match part numbers to vehicle models, which cuts wrong orders and speeds delivery to independent workshops.
Need a Custom Version of This Report?
Tailor the scope, geography, or segments to your exact requirements.
- Custom geography or segment scope
- Direct access to our analyst team
Component makers and oil brands compete for workshop loyalty
Competition is led by large component makers with strong replacement brands, battery makers and lubricant companies that build loyalty among mechanics and retailers. Bosch Limited runs a multi-brand Bosch Car Service network and planned to expand it to more than 1,000 workshops. Schaeffler India sells bearings, clutches and engine parts and trains mechanics through REPXPERT. Uno Minda offers lighting, horns, engine oils, alloy wheels and electric vehicle spares. Exide Industries sells replacement batteries and launched an AGM range in February 2026. Castrol India runs more than 750 branded workshops and reaches over 150,000 retail outlets. Companies compete on brand trust, distributor reach, mechanic rewards, product range and the ability to serve electric vehicles.
Companies profiled and their roles in this market
| Company | Type | Role in the market |
|---|---|---|
| Bosch Limited | Global component maker (Indian listed unit) | Multi-brand Bosch Car Service network; diagnostics and parts |
| Schaeffler India Limited | Global component maker (Indian listed unit) | Two-wheeler spare parts range; REPXPERT training; TruPower |
| Uno Minda Limited | Domestic component maker | Lighting, horns, engine oils, alloy wheels and EV spares |
| Exide Industries Limited | Domestic battery maker | AGMi replacement battery range launched in February 2026 |
| Castrol India Limited | Lubricant company (BP group) | 750+ Castrol Auto Service workshops; 150,000+ retail outlets |
Credence Research view on organized repair and EV service
Credence Research's view is that the India automotive aftermarket will grow steadily through 2035, because the vehicle fleet keeps expanding and owners keep vehicles in use for longer. However, value will shift toward branded parts, organized workshops and online ordering as tax gaps narrow and vehicles grow more complex. Two-wheelers should keep the largest share, while electric vehicles add the most new service lines. With 2.17 crore two-wheelers sold in 2025-26, replacement demand will stay broad across cities and villages. Electric vehicles reached 8% of new registrations in 2025, which signals the next shift in India automotive aftermarket demand.
How the replacement parts and service estimate was built
The report uses 2025 as the base year, with values in USD million at current prices. Market values come from the Credence Research model, which combines vehicles in use by type and age, service intervals, parts replacement rates and average prices. Regional zones and segment splits by vehicle type, usage type, sales channel and powertrain are Credence Research estimates. Sources used are government statistics and parliamentary replies, industry association data, company statements and news reports, and no interviews or surveys were used.
Older fleets and EV service set the path to 2035
The market is expected to reach USD 20.71 billion by 2035, a 5.77% CAGR during 2026–2035, as a larger and older fleet needs more parts, consumables and repairs. Growth should be strongest in East and Northeast India, in digital marketplaces and in battery electric vehicle service. Digital marketplaces should grow at 8.69% a year, the fastest rate of any India automotive aftermarket sales channel. South India should keep the largest share because of high ownership and dense workshop networks. In contrast, a flood of fake parts, slow technician training or a faster drop in engine-related parts would weaken margins for suppliers.
Frequently Asked Questions
How big is the India automotive aftermarket?
Which region leads replacement parts spending in India?
Which region grows fastest?
Which vehicle type holds the largest share?
How did the GST change affect auto parts?
Which sales channel grows fastest?
Who are the leading companies in Indian replacement parts?
What are the main risks to growth?
Table of Content
Chapter 1 Market Segmentation
- 1.1 Segmentation Framework
- 1.1.1 Product and Service Classification
- 1.1.2 Application and End-Use Classification
- 1.1.3 Technology and Solution Classification
- 1.1.4 Customer and Distribution Channel Classification
- 1.1.5 Geographic Segmentation
- 1.1.6 Market Segment Definitions and Boundaries
- 1.2 By Vehicle Type
- 1.2.1 Two-Wheelers
- 1.2.2 Passenger Vehicles
- 1.2.3 Commercial Vehicles
- 1.2.4 Three-Wheelers
- 1.3 By Usage Type
- 1.3.1 Routine Maintenance
- 1.3.2 Wear-and-Tear Replacement
- 1.3.3 Breakdown Repair
- 1.3.4 Performance and Customization
- 1.4 By Sales Channel
- 1.4.1 Independent Distributors
- 1.4.2 OEM Authorized Channels
- 1.4.3 Digital Marketplaces
- 1.4.4 Direct Fleet Supply
- 1.5 By Powertrain
- 1.5.1 Internal Combustion Engine
- 1.5.2 Hybrid
- 1.5.3 Battery Electric Vehicles
- 1.5.4 Alternative Fuel
Chapter 2 Introduction
- 2.1 Report Objectives and Scope
- 2.2 Product Definition and Industry Terminology
- 2.3 Market Inclusions and Exclusions
- 2.4 Research Process
- 2.4.1 Primary Research and Expert Interviews
- 2.4.2 Secondary Research and Source Review
- 2.4.3 Top-Down and Bottom-Up Estimation
- 2.4.4 Data Triangulation and Verification
- 2.5 Market Size Measurement Basis
- 2.5.1 2025: USD 11.79 billion → 2035: USD 20.71 billion
- 2.6 Historical and Forecast Reference Periods
- 2.6.1 Historical Period: 2018-2025
- 2.6.2 Base Year: 2025
- 2.6.3 Forecast Period: 2025-2035
- 2.7 Research Assumptions and Limitations
Chapter 3 Executive Summary
- 3.1 Market Snapshot and Key Findings
- 3.2 Base-Year Market Size, 2025
- 3.3 Forecast Market Size, 2035
- 3.4 Revenue and Volume Growth Outlook
- 3.5 Key Demand and Supply Indicators
- 3.6 Leading Market Segments
- 3.7 Fastest-Growing Market Opportunities
- 3.8 Regional Performance Highlights
- 3.9 Technology and Industry Transformation
- 3.10 Competitive Landscape Summary
- 3.11 Analyst View and Strategic Implications
Chapter 4 India Automotive Aftermarket Market Trends and Developments
- 4.1 Historical Industry Development, 2018-2025
- 4.2 Recent Market Trends and Developments
- 4.3 Demand and Customer Behavior Trends
- 4.4 Technology and Product Innovation
- 4.5 Artificial Intelligence, Automation and Digitalization
- 4.6 Local Manufacturing and Supply Chain Realignment
- 4.7 Industry Partnerships, Mergers and Acquisitions
- 4.8 Sustainability and Circular Economy Developments
- 4.9 Government and Private Sector Investment Trends
- 4.10 Emerging Business Models and Commercialization
- 4.11 Industry Developments and Announcements
Chapter 5 India Automotive Aftermarket Market Production, Supply and Demand Analysis
- 5.1 Demand Trend and Consumption Analysis, 2018-2025
- 5.2 Demand Forecast, 2025-2035
- 5.3 Production and Output Trend, 2018-2025
- 5.4 Production and Output Forecast, 2025-2035
- 5.5 Installed Capacity and Capacity Utilization
- 5.6 Company-Wise Production Plants and Statistics
- 5.6.1 Installed Production Capacity
- 5.6.2 Actual Production
- 5.6.3 Planned Capacity and Expansion Targets
- 5.7 Supply Chain Structure and Procurement Trends
- 5.8 Supply-Demand Gap and Bottlenecks
- 5.9 Import Dependence and Sourcing Structure
- 5.10 Contract Manufacturing and Outsourcing
- 5.11 Regional Supply and Demand Concentration
Chapter 6 India Automotive Aftermarket Market Pricing Analysis
- 6.1 Pricing Structure and Measurement
- 6.2 Historical Pricing Trends, 2018-2025
- 6.3 Pricing Outlook, 2025-2035
- 6.4 Average Selling Price and Unit Economics
- 6.5 Pricing by Product and Market Segment
- 6.6 Geographic Pricing Differences
- 6.7 Key Input, Energy, Labor and Logistics Costs
- 6.8 Contract Pricing and Purchasing Models
- 6.9 Pricing Sensitivity and Competitive Positioning
- 6.10 Price, Margin and Profitability Implications
Chapter 7 India Automotive Aftermarket Market Dynamics
- 7.1 Market Growth Drivers
- 7.1.1 Demand-Side Drivers
- 7.1.2 Technology and Innovation Drivers
- 7.1.3 Infrastructure and Investment Drivers
- 7.1.4 Regulatory and Policy Drivers
- 7.2 Market Restraints
- 7.2.1 Cost and Affordability Constraints
- 7.2.2 Technology and Adoption Barriers
- 7.2.3 Supply Chain and Operational Constraints
- 7.3 Market Challenges
- 7.3.1 Competitive Pressure and Margin Erosion
- 7.3.2 Skills, Infrastructure and Implementation Gaps
- 7.4 Emerging Market Opportunities
- 7.5 Market Dynamics Impact and Time-Horizon Assessment
Chapter 8 India Automotive Aftermarket Value Chain Analysis
- 8.1 Industry Value Chain Overview
- 8.2 Upstream Suppliers and Critical Inputs
- 8.3 Technology and Component Providers
- 8.4 Manufacturing or Service Delivery
- 8.5 Distribution, Channel Partners and Integrators
- 8.6 Downstream Applications and End Users
- 8.7 Value Addition and Profit Pools
- 8.8 Vertical Integration and Outsourcing
- 8.9 Supplier Concentration and Risk
- 8.10 Supply Chain Localization and Resilience
Chapter 9 India Automotive Aftermarket Market Regulations and Policies
- 9.1 Relevant Laws, Standards and Compliance Frameworks
- 9.2 Product, Service, Safety and Quality Requirements
- 9.3 Government Policies, Incentives and Subsidies
- 9.4 Imports, Exports and Trade Barriers
- 9.5 Public Procurement and Local Content Requirements
- 9.6 Environmental and Sustainability Compliance
- 9.7 Upcoming Policy Changes and Market Implications
Chapter 10 India Automotive Aftermarket Market Hotspots and Opportunities
- 10.1 Market Opportunity Mapping and Growth Hotspots
- 10.2 High-Growth Applications and Customer Groups
- 10.3 Underserved Markets and White-Space Opportunities
- 10.4 Emerging Technology and Product Opportunities
- 10.5 New Capacity and Investment Hotspots
- 10.6 Market Entry and Expansion Opportunities
- 10.7 Distribution and Partnership Opportunities
- 10.8 Near-Term and Long-Term Commercial Potential
- 10.9 Opportunity Attractiveness and Execution Risks
Chapter 11 India Automotive Aftermarket Market Outlook, 2025-2035
- 11.1 Market Size and Analysis
- 11.1.1 Revenue (Market Measurement: 2025: USD 11.79 billion → 2035: USD 20.71 billion)
- 11.1.2 Market Volume and Quantity Sold
- 11.1.3 Historical Market Size, 2018-2025
- 11.1.4 Base-Year Market Size, 2025
- 11.2 Market Forecast, 2025-2035
- 11.2.1 Revenue Forecast to 2035
- 11.2.2 Volume Forecast to 2035
- 11.2.3 CAGR and Year-on-Year Growth
- 11.2.4 Incremental Revenue Opportunity
- 11.3 Forecast Assumptions and Scenario Analysis
- 11.3.1 Base-Case Forecast
- 11.3.2 Optimistic and Conservative Scenarios
- 11.3.3 Technology, Pricing and Policy Sensitivities
- 11.4 Market Attractiveness and Growth Outlook
Chapter 12 India Automotive Aftermarket Market Segmentation and Outlook
- 12.1 Segmentation Summary and Market Shares, 2025
- 12.2 Largest and Fastest-Growing Segments
- 12.3 By Vehicle Type - Market Size and Forecast, 2025-2035
- 12.3.1 Segment Definition and Scope
- 12.3.2 Historical Market Size, 2018-2025
- 12.3.3 Revenue Forecast, 2025-2035
- 12.3.4 Volume Forecast, 2025-2035
- 12.3.5 Base-Year Market Share, 2025
- 12.3.6 Segment CAGR and Growth Drivers
- 12.3.7 Subsegment Market Size and Forecast
- 12.3.7.1 Two-Wheelers
- 12.3.7.2 Passenger Vehicles
- 12.3.7.3 Commercial Vehicles
- 12.3.7.4 Three-Wheelers
- 12.3.8 Subsegment Pricing and Adoption Trends
- 12.3.9 Leading Suppliers and Competition
- 12.3.10 Regional Demand and Opportunities
- 12.4 By Usage Type - Market Size and Forecast, 2025-2035
- 12.4.1 Segment Definition and Scope
- 12.4.2 Historical Market Size, 2018-2025
- 12.4.3 Revenue Forecast, 2025-2035
- 12.4.4 Volume Forecast, 2025-2035
- 12.4.5 Base-Year Market Share, 2025
- 12.4.6 Segment CAGR and Growth Drivers
- 12.4.7 Subsegment Market Size and Forecast
- 12.4.7.1 Routine Maintenance
- 12.4.7.2 Wear-and-Tear Replacement
- 12.4.7.3 Breakdown Repair
- 12.4.7.4 Performance and Customization
- 12.4.8 Subsegment Pricing and Adoption Trends
- 12.4.9 Leading Suppliers and Competition
- 12.4.10 Regional Demand and Opportunities
- 12.5 By Sales Channel - Market Size and Forecast, 2025-2035
- 12.5.1 Segment Definition and Scope
- 12.5.2 Historical Market Size, 2018-2025
- 12.5.3 Revenue Forecast, 2025-2035
- 12.5.4 Volume Forecast, 2025-2035
- 12.5.5 Base-Year Market Share, 2025
- 12.5.6 Segment CAGR and Growth Drivers
- 12.5.7 Subsegment Market Size and Forecast
- 12.5.7.1 Independent Distributors
- 12.5.7.2 OEM Authorized Channels
- 12.5.7.3 Digital Marketplaces
- 12.5.7.4 Direct Fleet Supply
- 12.5.8 Subsegment Pricing and Adoption Trends
- 12.5.9 Leading Suppliers and Competition
- 12.5.10 Regional Demand and Opportunities
- 12.6 By Powertrain - Market Size and Forecast, 2025-2035
- 12.6.1 Segment Definition and Scope
- 12.6.2 Historical Market Size, 2018-2025
- 12.6.3 Revenue Forecast, 2025-2035
- 12.6.4 Volume Forecast, 2025-2035
- 12.6.5 Base-Year Market Share, 2025
- 12.6.6 Segment CAGR and Growth Drivers
- 12.6.7 Subsegment Market Size and Forecast
- 12.6.7.1 Internal Combustion Engine
- 12.6.7.2 Hybrid
- 12.6.7.3 Battery Electric Vehicles
- 12.6.7.4 Alternative Fuel
- 12.6.8 Subsegment Pricing and Adoption Trends
- 12.6.9 Leading Suppliers and Competition
- 12.6.10 Regional Demand and Opportunities
- 12.7 Segment Growth Comparison
- 12.8 Segment Attractiveness and Priority Matrix
Chapter 13 India Automotive Aftermarket Geographic Market Outlook, 2025-2035
- 13.1 Regional Market Size and Country-Level Shares, 2025
- 13.2 Country Market Size Comparison, 2025
- 13.3 Country Market Forecasts, 2025-2035
- 13.4 Subregional Industrial and Demand Clusters
- 13.5 Intra-Regional Pricing and Cost Differences
- 13.6 Cross-Border Trade and Supply Networks
- 13.7 Regional Supply and Demand Balances
- 13.8 Country Opportunity Comparison and Prioritization
Note: Every listed country is covered on the structure shown under the first country.
Chapter 14 India Automotive Aftermarket Technology, Innovation and Sustainability Outlook
- 14.1 Technology Landscape and Maturity
- 14.2 Product, Process and Service Innovation
- 14.3 AI, Automation and Digital Tools in the Industry
- 14.4 Technology Adoption and Performance Benchmarking
- 14.5 Innovation Pipeline and R&D Investment
- 14.6 Patent and Intellectual Property Trends
- 14.7 Energy Efficiency and Resource Management
- 14.8 Sustainability, Recycling and Circularity
- 14.9 Technology Roadmap, 2025-2035
- 14.10 Risks of Obsolescence and Technology Substitution
Chapter 15 India Automotive Aftermarket Market Key Strategic Imperatives
- 15.1 Growth and Market Entry Priorities
- 15.2 High-Return Products and Segments
- 15.3 Pricing, Profitability and Cost Optimization
- 15.4 Technology Investment and Product Differentiation
- 15.5 Supply Chain Localization and Resilience
- 15.6 Distribution and Customer Acquisition
- 15.7 Partnership, Acquisition and Capacity Strategy
- 15.8 Regional Expansion Priorities
- 15.9 Short-, Medium- and Long-Term Actions
Chapter 16 Competition Outlook
- 16.1 Industry Competition Characteristics
- 16.2 Market Structure and Concentration
- 16.3 Market Share and Competitive Positioning, 2025
- 16.4 Company-Wise Revenue and Product Benchmarking
- 16.5 Production and Service Capacity Benchmarking
- 16.6 Technology, Pricing and Differentiation
- 16.7 Regional Footprint and Distribution Strength
- 16.8 Mergers, Acquisitions and Strategic Alliances
- 16.9 New Entrants and Competitive Threats
- 16.10 Porter's Five Forces and Industry Attractiveness
- 16.11 Competitive Outlook, 2025-2035
Chapter 17 Company Profiles
- 17.1 Company Coverage and Selection Criteria
- 17.2 Bosch Limited
- 17.2.1 Business Description
- 17.2.2 Company Ownership and Geographic Presence
- 17.2.3 Product and Service Portfolio
- 17.2.4 Manufacturing and Operating Footprint
- 17.2.5 Production Capacity and Expansion Plans
- 17.2.6 Financial Performance and Investment
- 17.2.7 Market Share and Competitive Position
- 17.2.8 Technology and Innovation Capabilities
- 17.2.9 Strategic Alliances or Partnerships
- 17.2.10 Recent Developments
- 17.2.11 Growth Strategy and Outlook
- 17.3 Uno Minda Limited
- 17.4 ZF Commercial Vehicle Control Systems India Limited
- 17.5 Schaeffler India Limited
- 17.6 SKF India Limited
- 17.7 Lumax Auto Technologies Limited
- 17.8 Gabriel India Limited
- 17.9 Exide Industries Limited
- 17.10 Amara Raja Energy & Mobility Limited
- 17.11 Castrol India Limited
- 17.12 Other Relevant Market Participants
Note: Every listed company is profiled on the structure shown under the first company. The company list is preliminary and may change based on research findings, market developments, data availability and client requirements.
Chapter 18 Disclaimer
- 18.1 Research and Forecast Disclaimer
- 18.2 Data Source and Estimation Limitations
Note: The depth of individual sections depends on data availability for this market. Volume, capacity, trade and other unit-based metrics are included where applicable.

