
Electrified SUVs and utes pull electronic controls forward
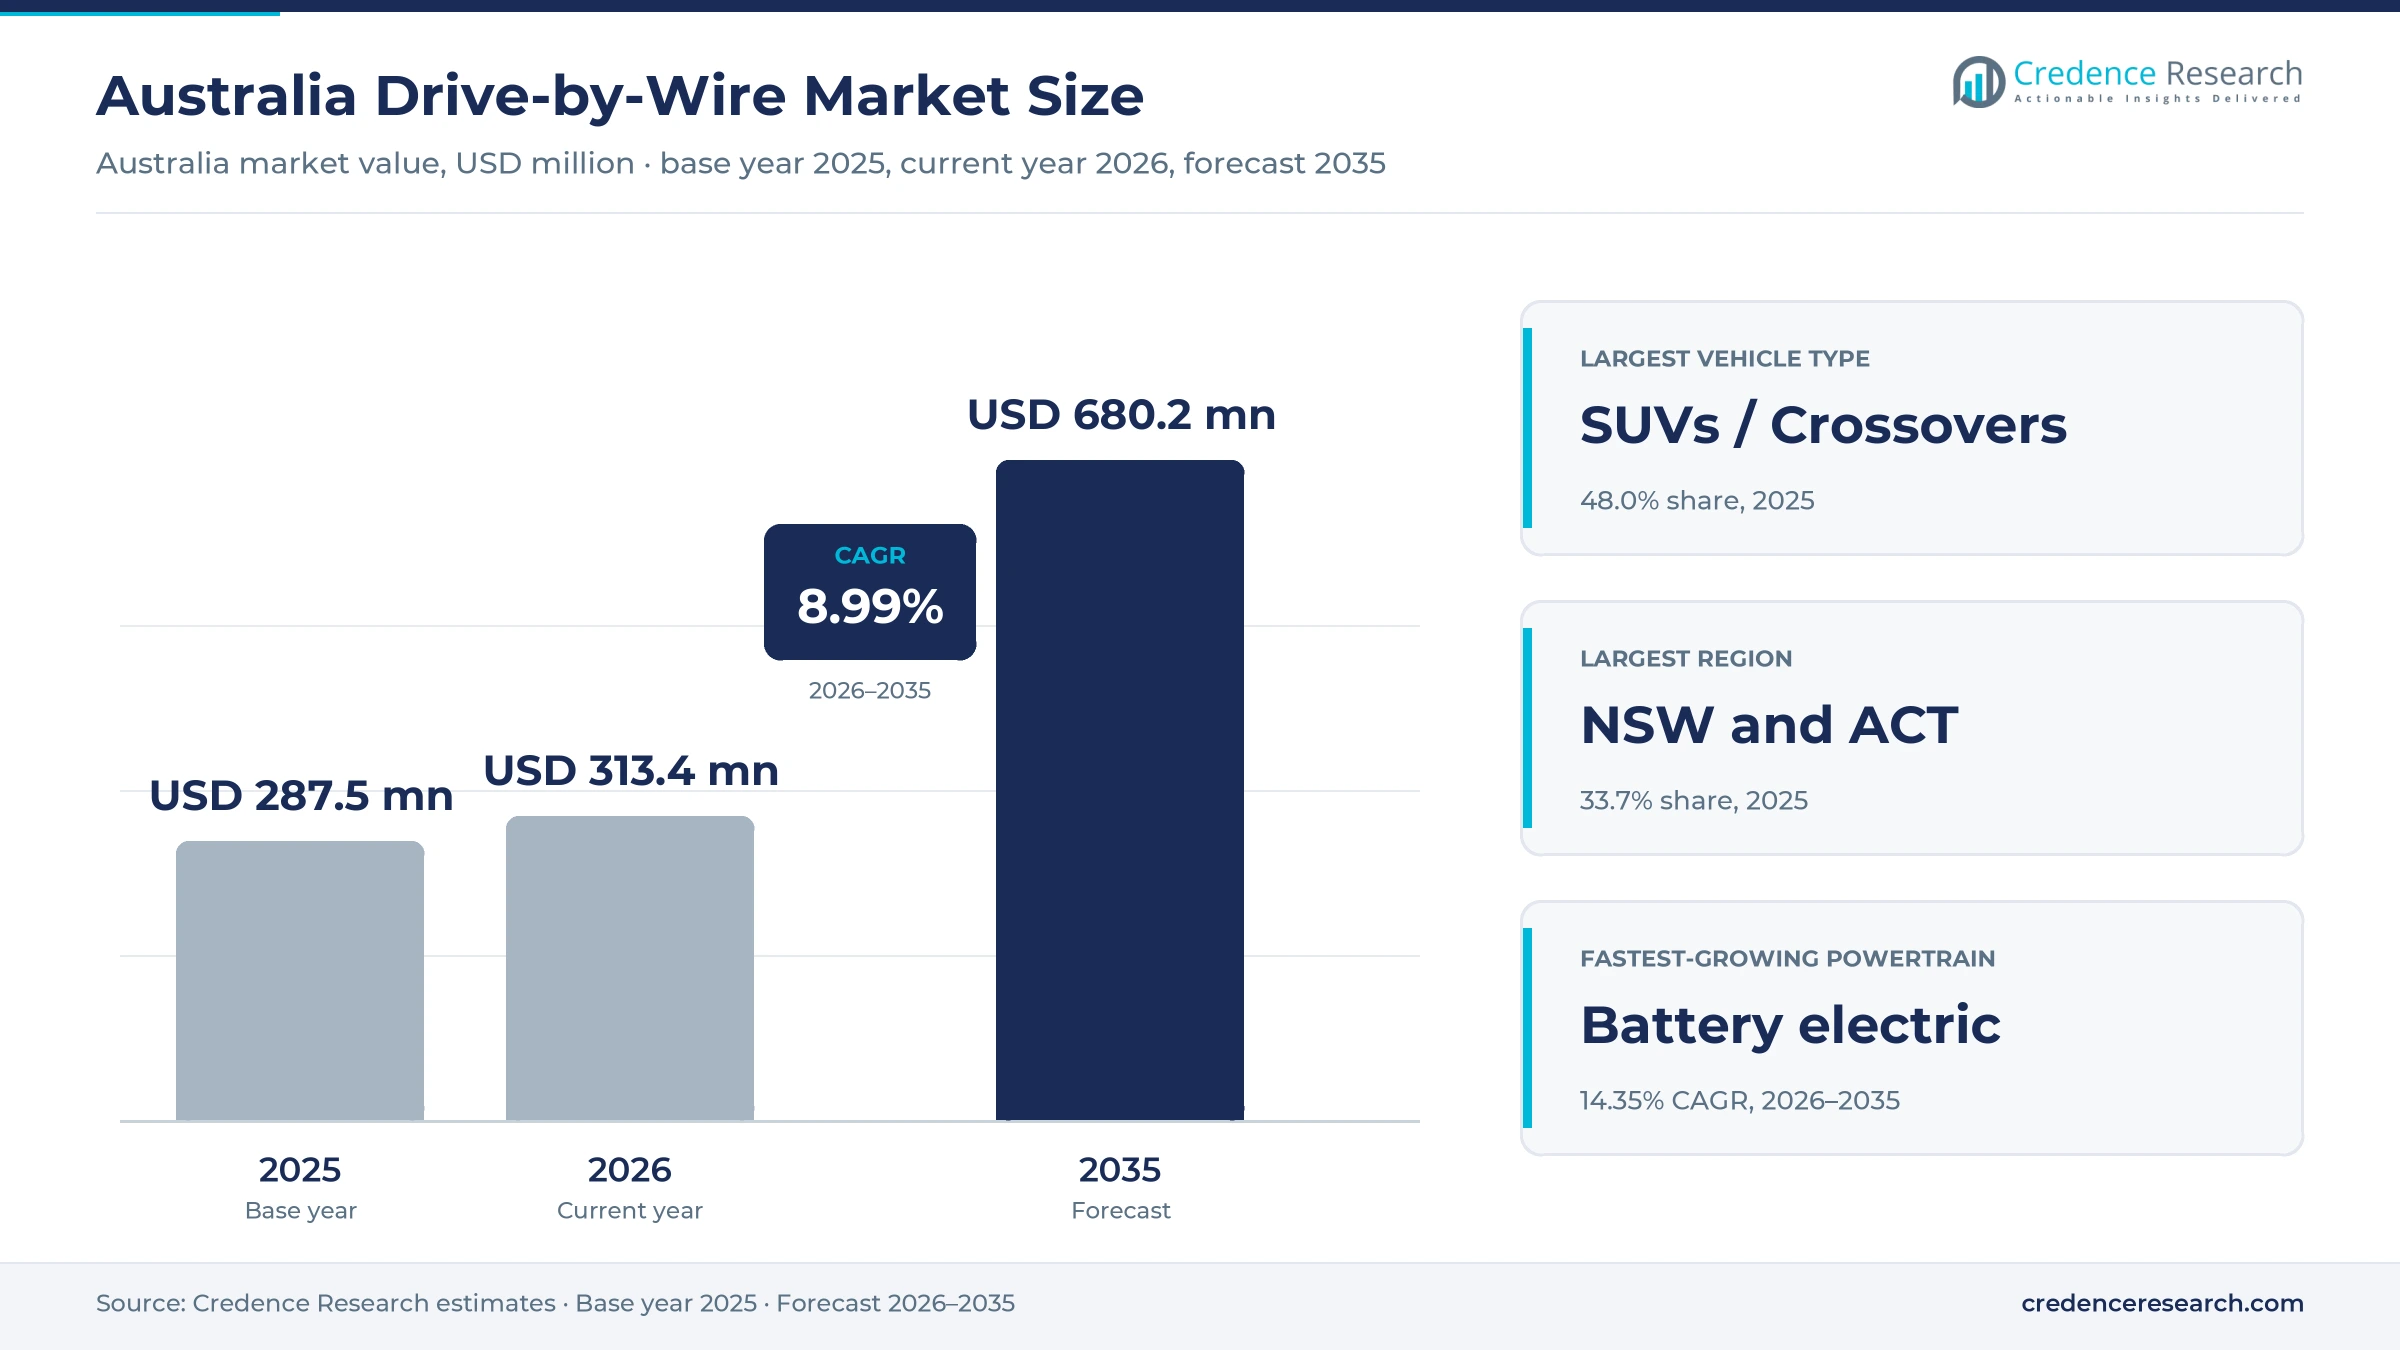
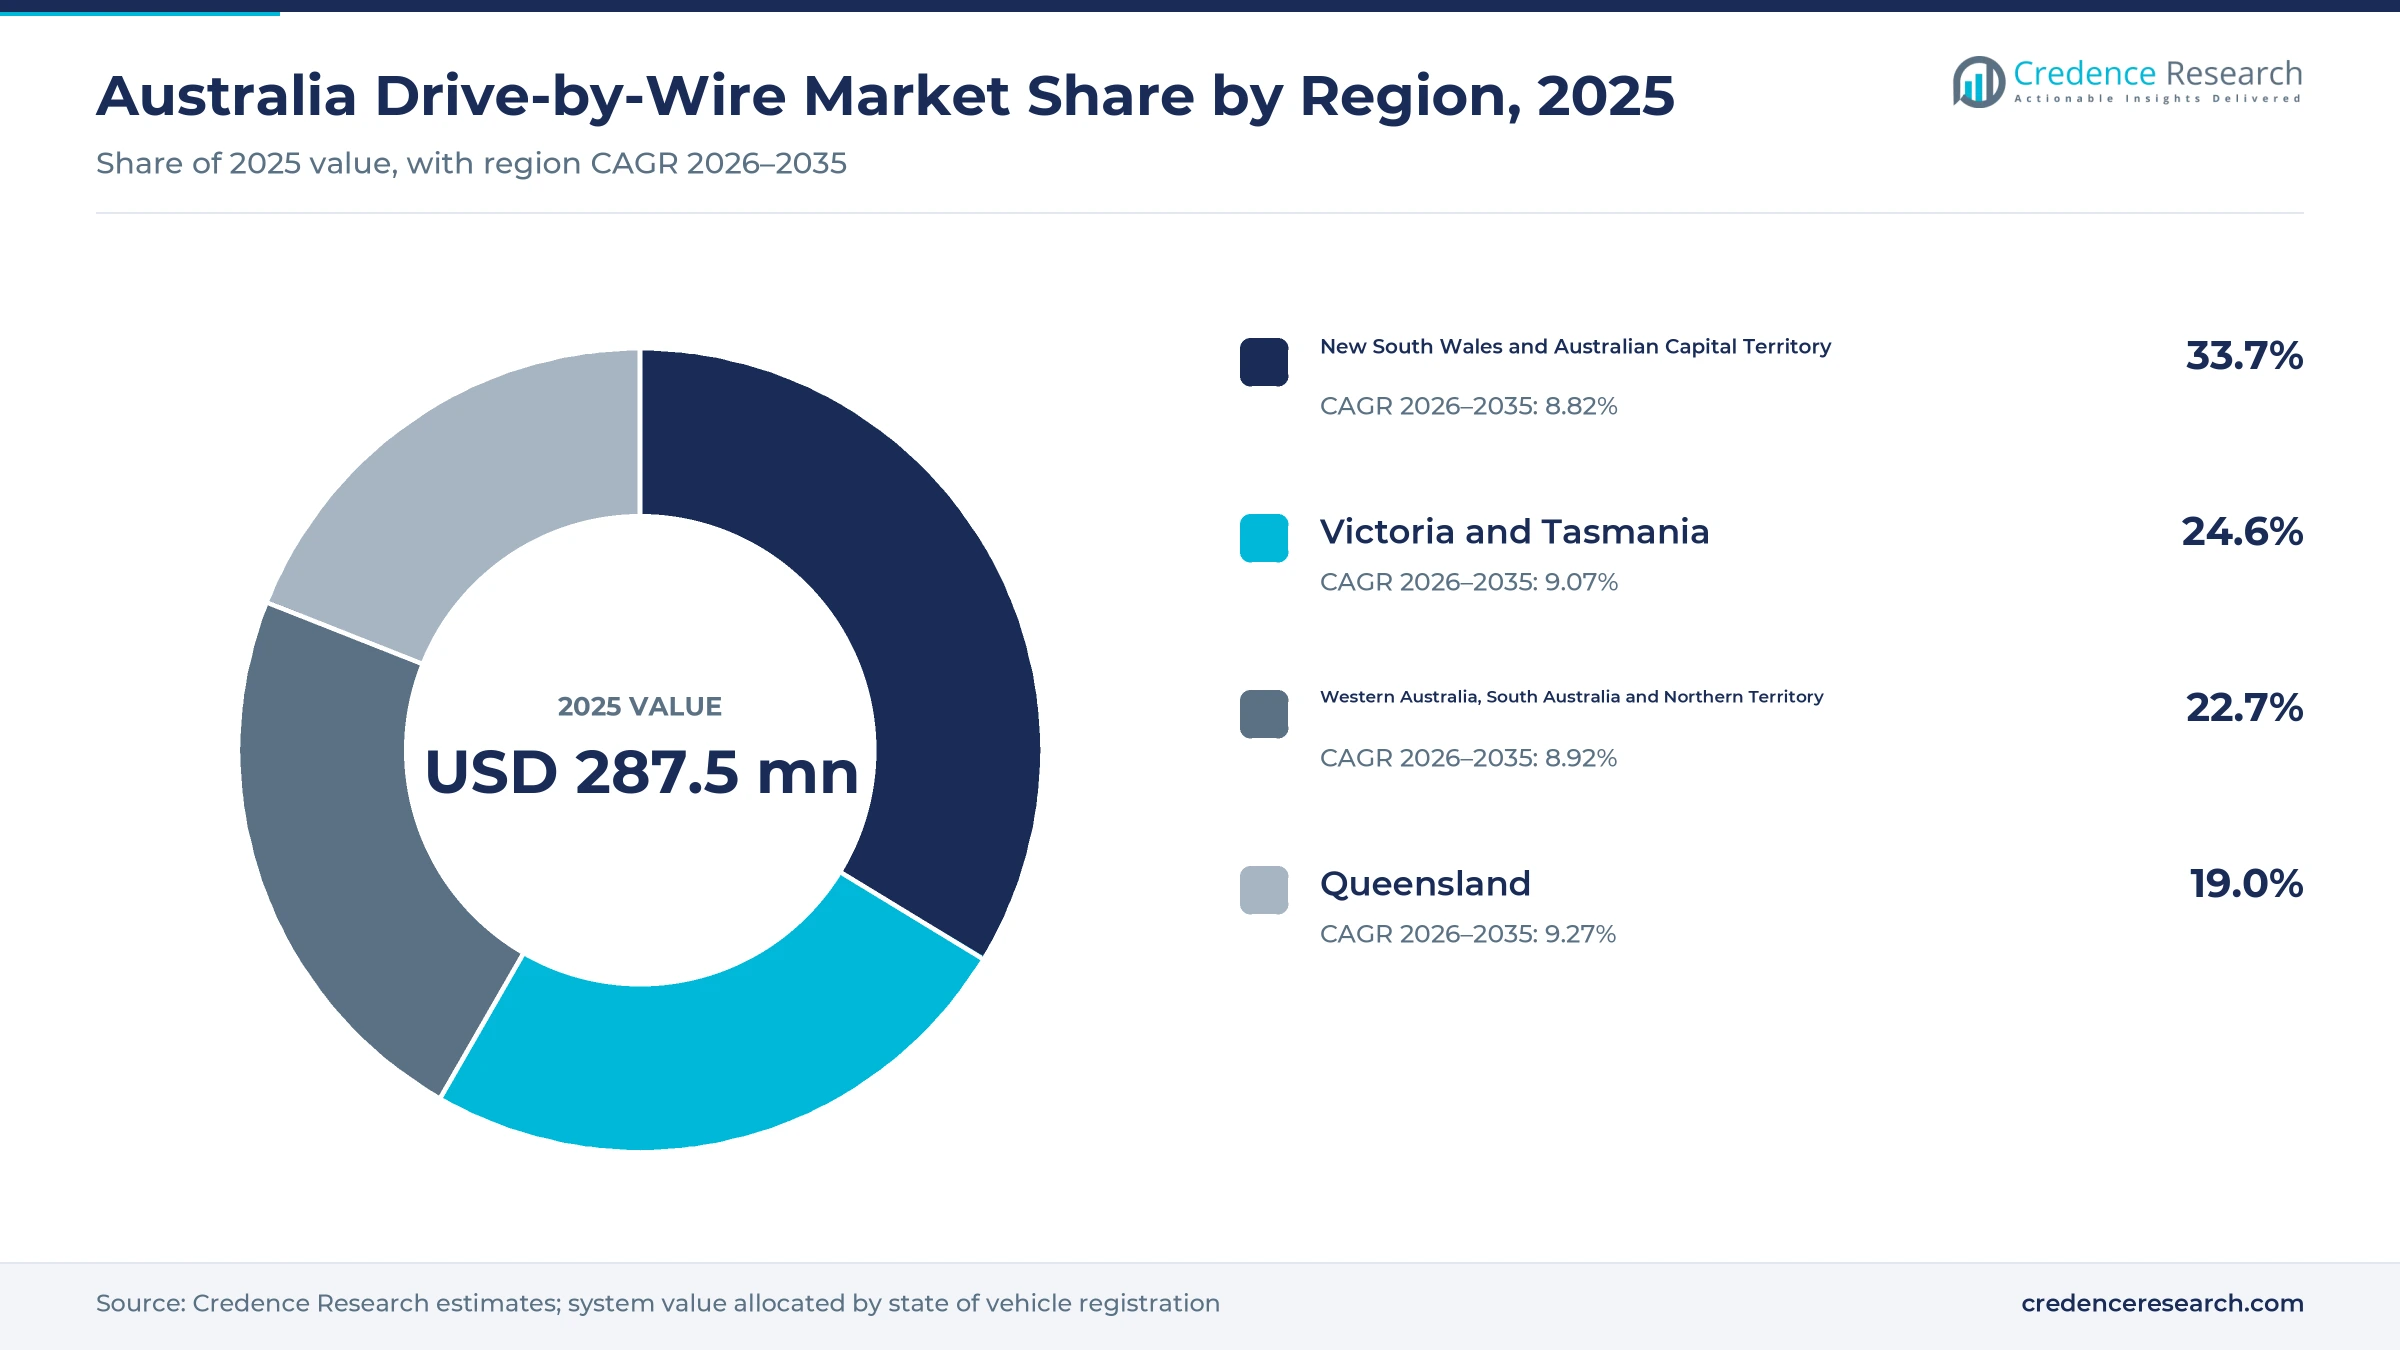
The Australia drive-by-wire market was valued at USD 287.5 million in 2025 and is projected to increase from USD 313.4 million in 2026 to USD 680.2 million by 2035, registering a CAGR of 8.99% during 2026–2035. Demand comes from new SUVs, utes and passenger cars that use electronic throttle, braking and steering controls, from business and government fleets that buy electrified models, and from performance owners who fit electronic throttle systems. New South Wales and the Australian Capital Territory held the largest regional share, 33.7% in 2025, because Sydney and Canberra register the most new vehicles. Queensland is the fastest-growing region at 9.27% a year, as population growth and strong ute and SUV sales add new vehicles. In turn, the New Vehicle Efficiency Standard that began on Jan. 1, 2025, is pushing brands toward hybrid and battery electric models that rely more heavily on electronic vehicle control.
Which electronic control systems does the estimate cover?
The estimate measures the value of electronic throttle, brake and steering control systems fitted to vehicles sold or modified in Australia. It covers pedal sensors, throttle actuators, electronic brake controllers, steering actuators and the control units that link them. Values include systems built into new vehicles, parts replaced through authorized dealers and units fitted by independent workshops and performance tuners.
The estimate excludes conventional hydraulic power steering, purely mechanical brake parts and engine hardware that does not carry a control function. The value chain runs from semiconductor and sensor makers through global chassis suppliers and vehicle makers to importers, dealers, fleet managers, independent workshops and private owners in every state and territory.
Australia Drive-by-Wire Market Insights
- The Australia drive-by-wire market was valued at USD 287.5 million in 2025 and is projected to reach USD 680.2 million by 2035, registering a CAGR of 8.99% during 2026–2035.
- New South Wales and the Australian Capital Territory held a 33.7% share of 2025 value, because Sydney and Canberra register the most new vehicles.
- SUVs and crossovers led with a 48.0% share of 2025 value, because they are the largest new vehicle body type in Australia.
- Battery electric vehicles reached 23.3% of all new vehicle sales in June 2026, up from 7.6% in June 2025, which lifts demand for electronic controls.
- Nexteer put its first steer-by-wire system into series production in April 2026, showing that column-free steering has reached production vehicles.
SUVs lead while battery electric models grow fastest
Why do SUVs and crossovers lead vehicle demand?
Based on vehicle type, the market is categorized into SUVs and crossovers, light commercial vehicles, passenger cars and heavy and specialty vehicles. SUVs / Crossovers led with a 48.0% share of 2025 value, because they are the largest body type in new sales. SUVs / Crossovers grow fastest at 9.37% a year, as electrified SUV models carry more electronic chassis controls.
How does powertrain mix change control system value?
Based on powertrain, the market is categorized into internal combustion, hybrid electric, plug-in hybrid and battery electric vehicles. Internal Combustion Vehicles led with a 54.0% share of 2025 value, because most vehicles on sale still use engines with electronic throttles. Battery Electric Vehicles grow fastest at 14.35% a year, as their sales share rises quickly and each one relies on electronic control.
Why does embedded supply dominate sales channels?
Based on sales channel, the market is categorized into OEM embedded supply, authorized dealer aftermarket and independent aftermarket. OEM Embedded Supply led with 84.0% of 2025 value, because control systems arrive fitted in imported new vehicles. Independent Aftermarket grows fastest at 9.24% a year, as performance tuners fit electronic throttle bodies and engine control units.
How do private owners and fleets split demand?
Based on customer type, the market is categorized into private vehicle owners, business fleets and government fleets. Private Vehicle Owners led with a 61.0% share of 2025 value, because households buy most new SUVs and passenger cars. Government Fleets grow fastest at 9.39% a year, as public agencies add hybrid and battery electric models to meet emissions goals.
| Segment Group | Leading Sub-segment | Share, 2025 | Fastest-growing Sub-segment | CAGR, 2026–2035 |
|---|---|---|---|---|
| By Vehicle Type | SUVs / Crossovers | 48.0% | SUVs / Crossovers | 9.37% |
| By Powertrain | Internal Combustion Vehicles | 54.0% | Battery Electric Vehicles | 14.35% |
| By Sales Channel | OEM Embedded Supply | 84.0% | Independent Aftermarket | 9.24% |
| By Customer Type | Private Vehicle Owners | 61.0% | Government Fleets | 9.39% |
Request a Free Sample
Fill in your details and we'll send you a free sample report.
- Sample data tables & charts
- Research methodology
Efficiency rules and chassis electronics lift system value
How does efficiency-led electrification lift system demand?
Efficiency-led platform electrification lifts demand, because hybrid and battery electric vehicles depend on electronic throttle, brake and steering control. The New Vehicle Efficiency Standard began on Jan. 1, 2025, and brands started earning credits or penalties from July 1, 2025. The standard aims to cut new passenger vehicle emissions by more than 60% by 2030 and light commercial emissions by roughly half. Transport carbon dioxide emissions also rose to about 100.5 million tons in 2024 from 89.2 million tons in 2022, according to World Bank data. As a result, battery electric vehicles grow at 14.35% a year, the fastest powertrain rate.
Why does electronic chassis integration raise value per vehicle?
Higher-value electronic chassis integration raises value per vehicle, because steering and braking move from hydraulic links to actuators controlled by software. ZF began series production of steer-by-wire for the Nio ET9 flagship in February 2025, according to Autocar Professional, with no mechanical link between wheel and steering gear. ZF also reported an order for brake-by-wire systems covering almost five million vehicles. Nexteer then put its first steer-by-wire program into series production in April 2026 after ASIL D certification in late 2025. In turn, SUVs and crossovers keep a 48.0% share of 2025 value, as new models adopt column-free steering and electronic braking.
How does the local electronic throttle ecosystem add demand?
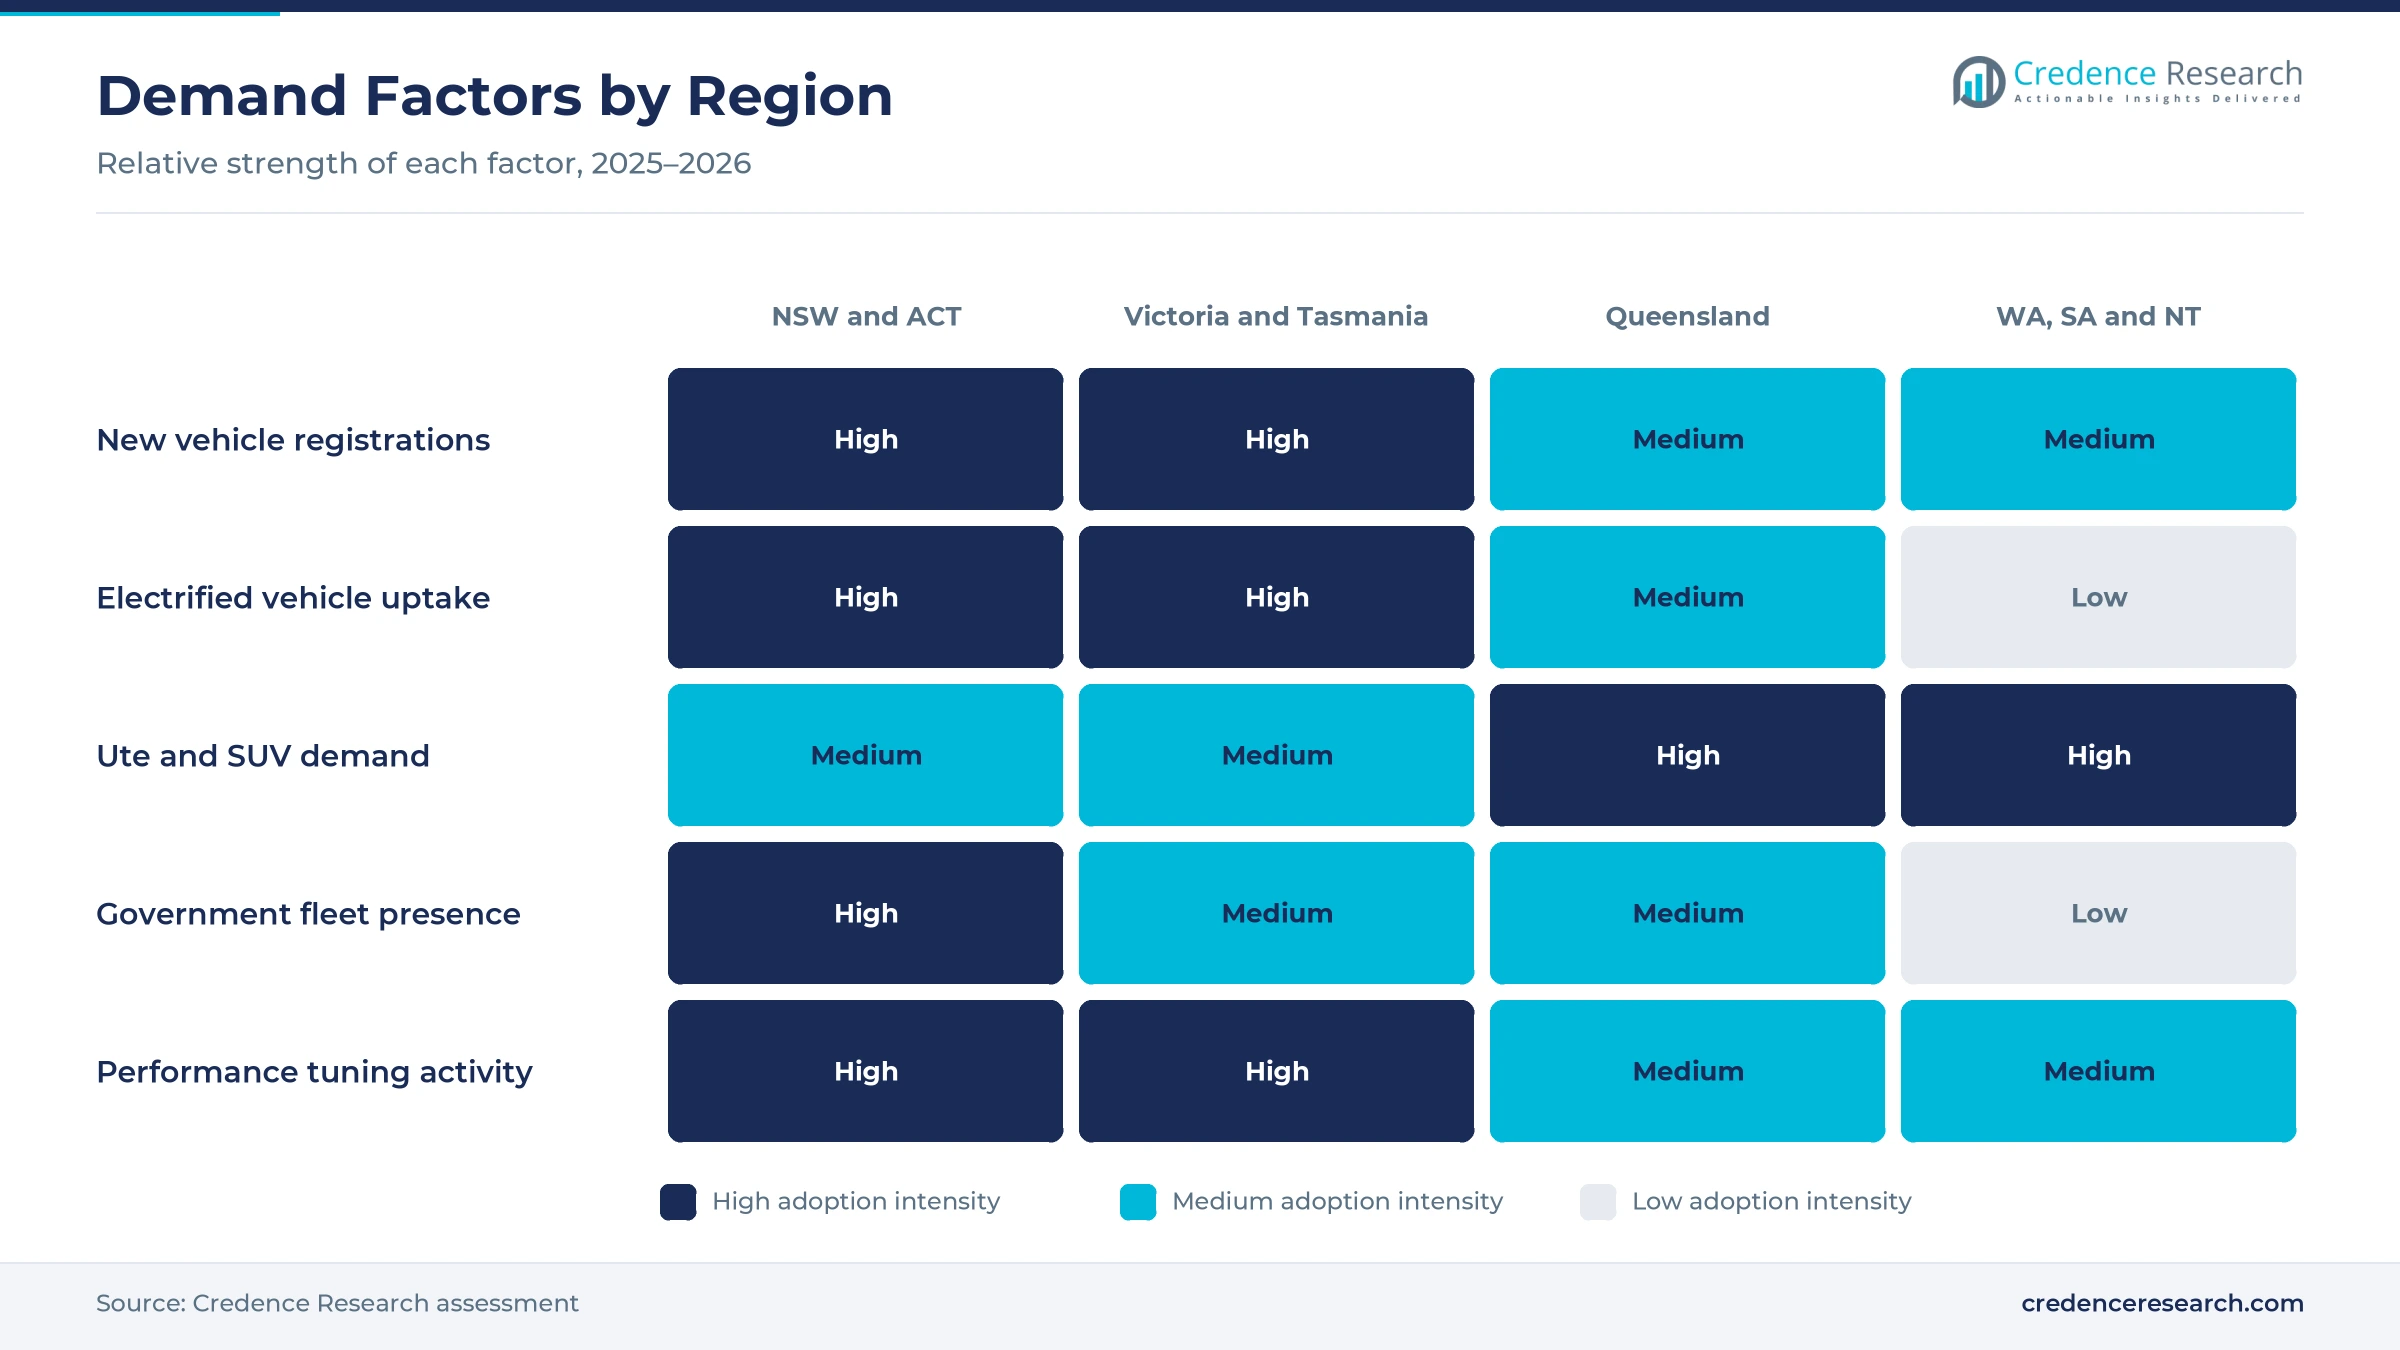
A specialist electronic throttle ecosystem adds aftermarket demand, because Australian engine management firms supply tuners at home and abroad. Haltech, headquartered in Sydney, offers Nexus S2 and S3 controllers that run dual electronic throttle bodies, according to Dragzine in September 2024. The MoTeC M1 controller can run up to two electronic throttle bodies, which suits V8 and twin-throttle builds. Emtron Australia also sells engine management and motorsport electronics from Australia. Haltech joined Race Winning Brands in May 2022 and kept operating from its existing locations, while each Nexus S-series unit has one wideband channel that expands to 10 channels. As a result, the independent aftermarket grows at 9.24% a year, the fastest channel rate, as owners upgrade engine control units.
Why does strong SUV and ute buying support volume?
Strong SUV and ute buying supports volume, because these vehicles carry heavier loads and more electronic driver aids than small cars. About nine SUVs were sold for every two passenger cars in the first seven months of 2025, according to the Federal Chamber of Automotive Industries. July 2025 sales reached 103,097 vehicles, then a July record. In June 2026, the Ford Ranger was the top-selling model with 5,999 sales, followed by the Toyota HiLux 4x4 with 5,175. As a result, light commercial vehicles keep a large share of 2025 value, as popular utes add electronic throttle, stability and driver assistance controls with each new model generation.
Electrified SUVs and Chinese imports reshape demand
How is the shift to electrified SUVs changing demand?
The shift to electrified SUVs is changing demand, because SUV buyers now choose hybrid, plug-in hybrid and battery electric models at a fast pace. Electrified vehicles reached 46% of new vehicle sales in May 2026, according to industry data. In the SUV segment, battery electric sales rose 167% and plug-in hybrid sales rose 377% from May 2025, while petrol SUV sales fell 31%. Battery electric vehicles then reached 23.3% of all sales in June 2026, up from 7.6% a year earlier, according to the Federal Chamber of Automotive Industries. In turn, hybrid and plug-in hybrid vehicles gain share, as their electronic throttles and brakes blend engine and motor power.
Why is the rise of Chinese-sourced vehicles notable?
The rise of Chinese-sourced vehicles is notable, because many of these models arrive with electronic chassis controls designed for electrified platforms. China became the leading source of new vehicles, with 46,592 sales or 35.5% of the June 2026 market. Japan followed with 20.7%, Thailand with 17.8% and Korea with 11.3%. BYD recorded 18,881 sales in June 2026, close behind the market leader, while Omoda Jaecoo and Geely also posted very fast growth in May 2026. The BYD Sealion 7 electric SUV was also among the five top-selling models in June 2026 with 4,730 sales. As a result, OEM embedded supply keeps 84.0% of 2025 value, as imported platforms bring advanced control systems into dealer showrooms across every state and territory.
Can plug-in hybrid growth open a new revenue path?
Plug-in hybrid growth opens a revenue path, because each vehicle needs electronic throttle and brake control to switch between engine and motor. Plug-in hybrid sales rose 183% in the first seven months of 2025, with more than 50 models on sale. Industry leaders described them as an important transition technology for regional buyers and owners without home charging. In May 2026, plug-in hybrid SUV sales rose 377% from a year earlier, as more brands introduced models in the segment. In turn, plug-in hybrids grow at a strong rate, as fleets and regional buyers adopt them for long trips where public charging is still limited.
Is there room to grow fleet electrification demand?
Fleet electrification has room to grow, because public charging and dealer charging investment make electric vehicles easier to run. The government committed $60 million to boost electric vehicle charging at dealerships through the Driving the Nation fund. Battery electric share of new sales rose from 8.4% in January 2026 to 23.4% in June 2026. Year to date, buyers purchased 127,244 battery electric vehicles by July 2026, about 17.3% of the market, according to industry sales data. As a result, government fleets grow at 9.39% a year, the fastest customer rate, as agencies expand the public charging network use.
Cost, repair skills and safety rules test suppliers
How do system costs slow adoption in cheaper vehicles?
System costs slow adoption in cheaper vehicles, because redundant actuators, sensors and controllers add cost to each model. Entry platforms compete mainly on price, so brands limit advanced controls to higher trims. As a result, fully electronic steering and braking stay concentrated in premium and electric models for now. Suppliers respond with shared platforms, common software and higher volumes that lower cost per vehicle over time, which should bring electronic steering to mainstream models after 2030.
Why do repair skills limit aftermarket service?
Repair skills limit aftermarket service, because electronic controls need diagnostic tools, software access and calibration after repairs. Many independent workshops lack the equipment needed to service steering and brake actuators. In turn, owners return to dealers for some repairs, which raises service costs. Industry training and shared repair information help close the gap as more electrified vehicles age, while suppliers offer remote diagnostics and training programs for independent workshops in regional areas.
How do safety and certification rules slow launches?
Safety and certification rules slow launches, because steering and braking without mechanical backup must meet strict functional safety standards. Nexteer needed ASIL D certification in late 2025 before its steer-by-wire program reached production. As a result, new systems take several years to move from prototype to sale. Suppliers respond with redundant controllers, dual power supplies and extensive testing that support approval, which adds time and engineering cost before each launch.
Why does charging access cloud electric vehicle demand?
Charging access clouds electric vehicle demand, because buyers without home charging worry about public network reliability. Industry leaders warned in 2026 that rapid electric vehicle uptake could outpace public charging supply. In turn, some buyers choose hybrids instead of battery electric models. Governments and private operators respond with new public chargers, dealer charging funds and regional charging corridors, which should ease range concerns for buyers outside the major cities.
New South Wales leads while Queensland grows fastest
| Region | Value, 2025 (USD million) | Share, 2025 | CAGR, 2026–2035 |
|---|---|---|---|
| New South Wales and Australian Capital Territory | 96.9 | 33.7% | 8.82% |
| Victoria and Tasmania | 70.7 | 24.6% | 9.07% |
| Western Australia, South Australia and Northern Territory | 65.3 | 22.7% | 8.92% |
| Queensland | 54.6 | 19.0% | 9.27% |
Why do New South Wales and the ACT hold the largest share?
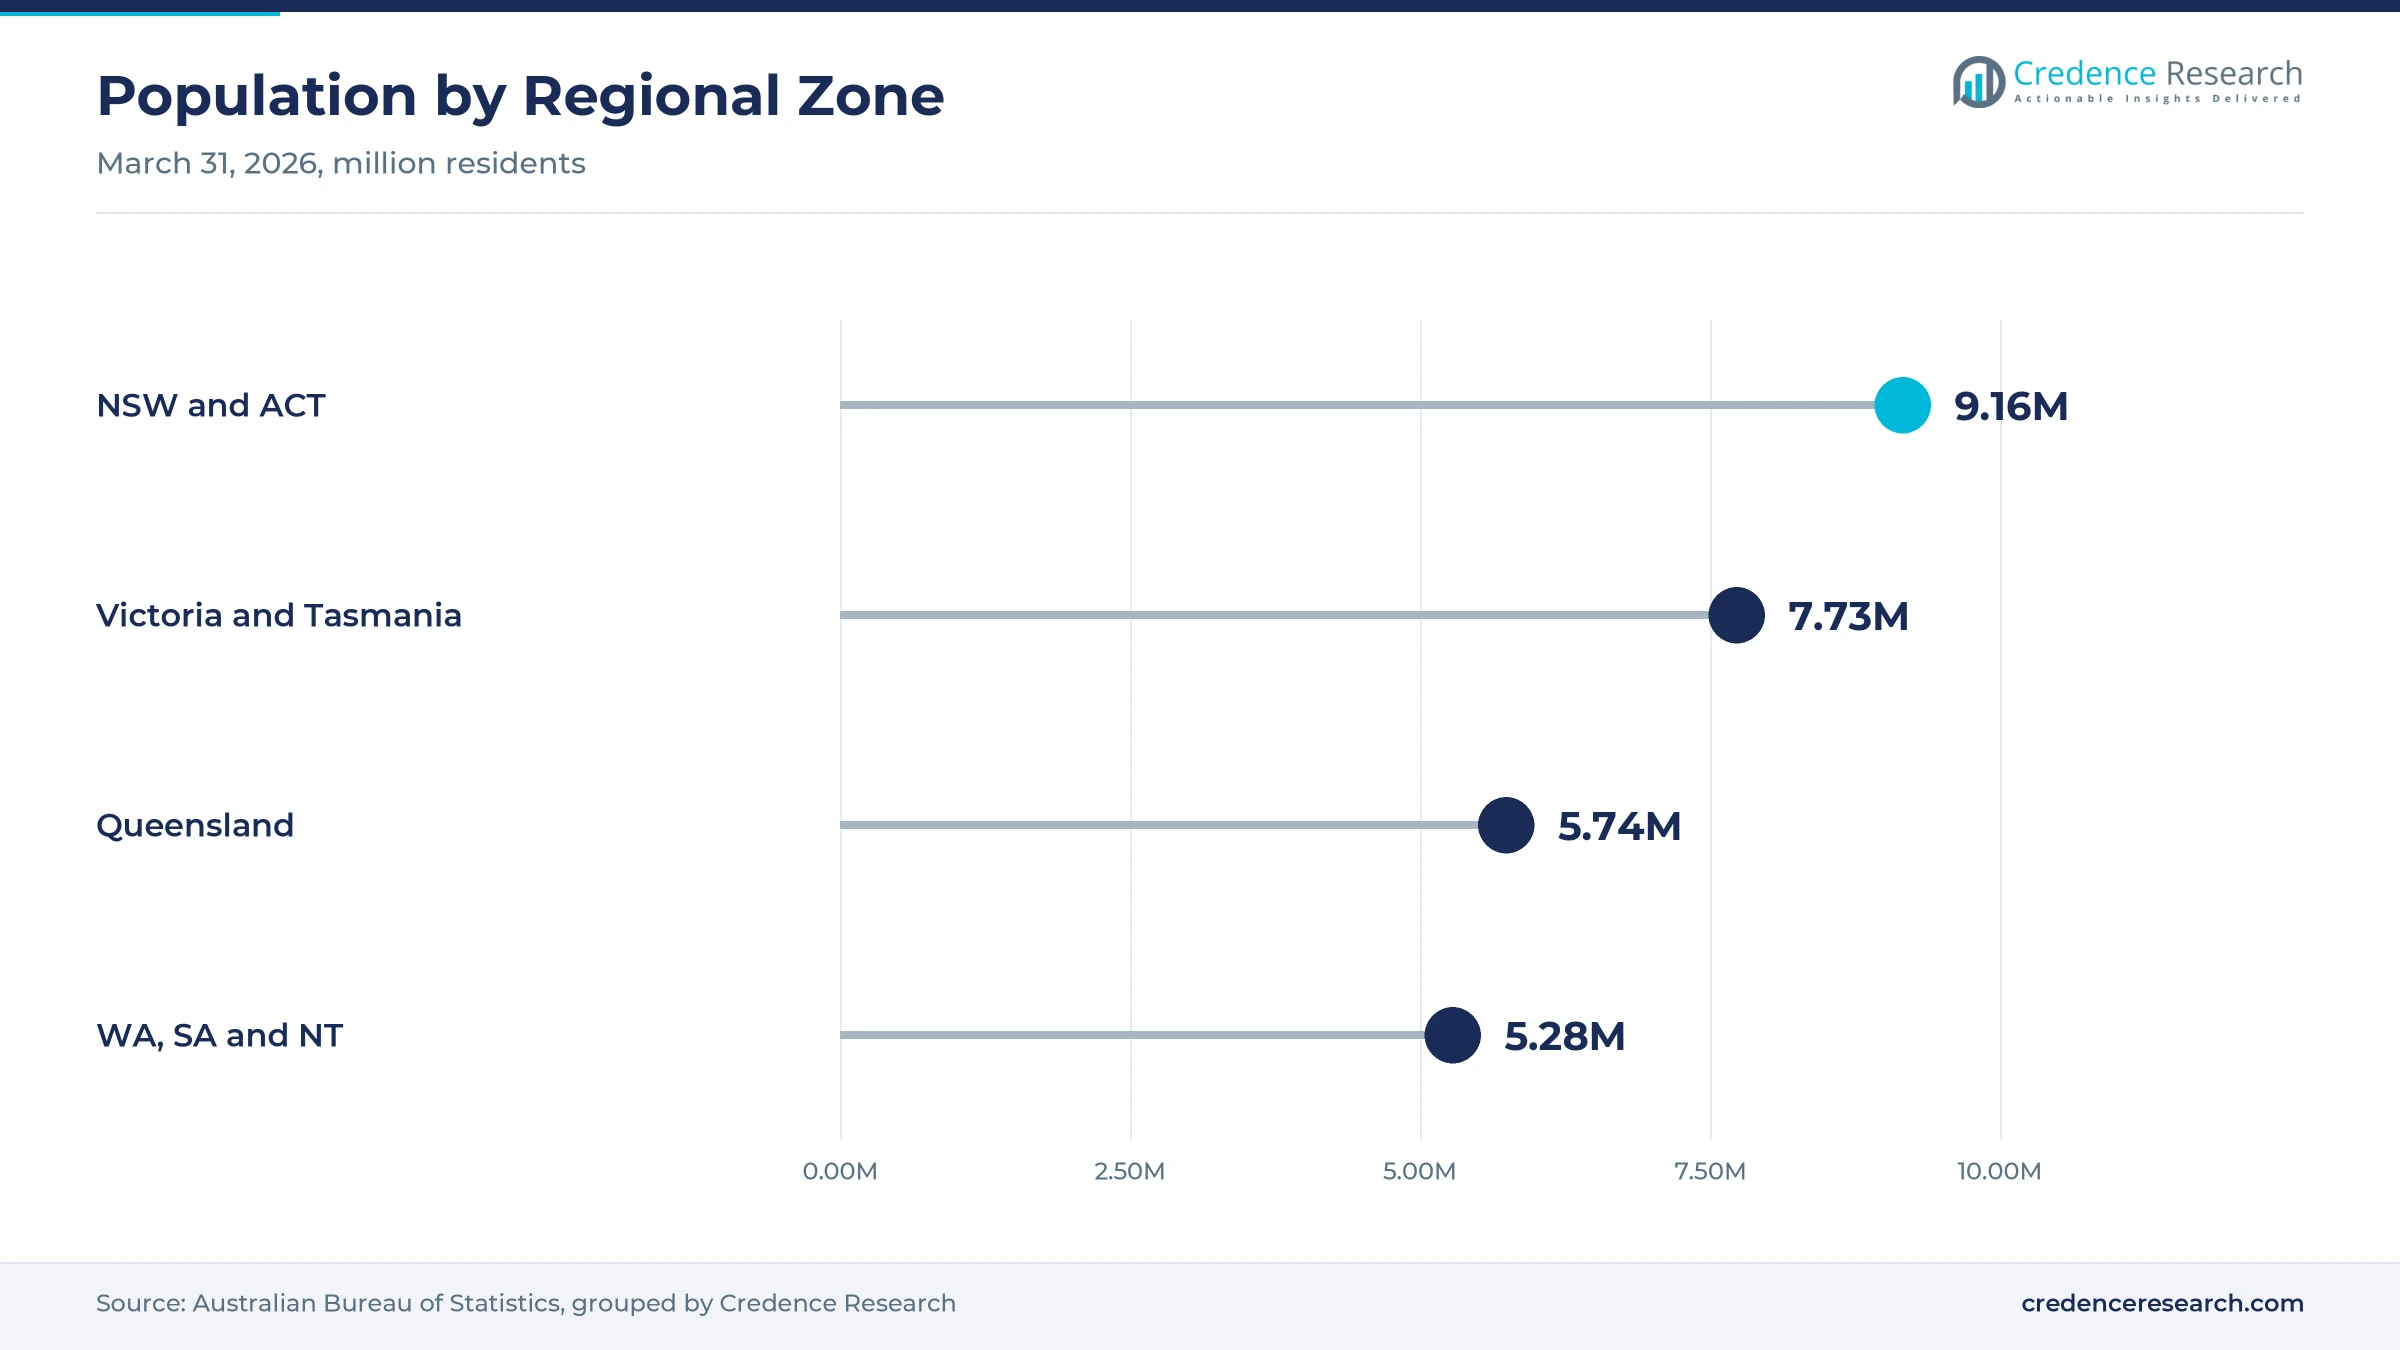
New South Wales and the Australian Capital Territory held a 33.7% share of 2025 value and grow at 8.82% a year, because the zone had about 9.16 million residents at March 31, 2026. Sydney and Canberra also host many corporate and government fleets. However, growth is slower than in Queensland because New South Wales population growth was 1.1% over the year.
How do Victoria and Tasmania support system demand?
Victoria and Tasmania held a 24.6% share of 2025 value and grow at 9.07% a year, because Melbourne is a large market for new SUVs and electrified vehicles. The zone had about 7.73 million residents at March 31, 2026, and Victoria grew 1.6% over the year. This growth adds households that buy new SUVs and electrified models, which supports demand for embedded electronic controls.
Why is Queensland the fastest-growing region?
Queensland held a 19.0% share of 2025 value and grows fastest at 9.27% a year, because strong population growth and high ute and SUV ownership keep new vehicle demand rising. The state added about 90,100 residents in the year to March 2026. Long regional driving distances also favor hybrids and plug-in hybrids, which rely on electronic throttle and brake control.
What drives demand in the western and central zone?
Western Australia, South Australia and the Northern Territory held a 22.7% share of 2025 value and grow at 8.92% a year, because mining, farm and service fleets buy many utes and heavy vehicles. Western Australia recorded the fastest state population growth at 2.1% in the year to March 2026.
Steering, throttle and policy milestones from 2024 to 2026
| Development | Status and market relevance |
|---|---|
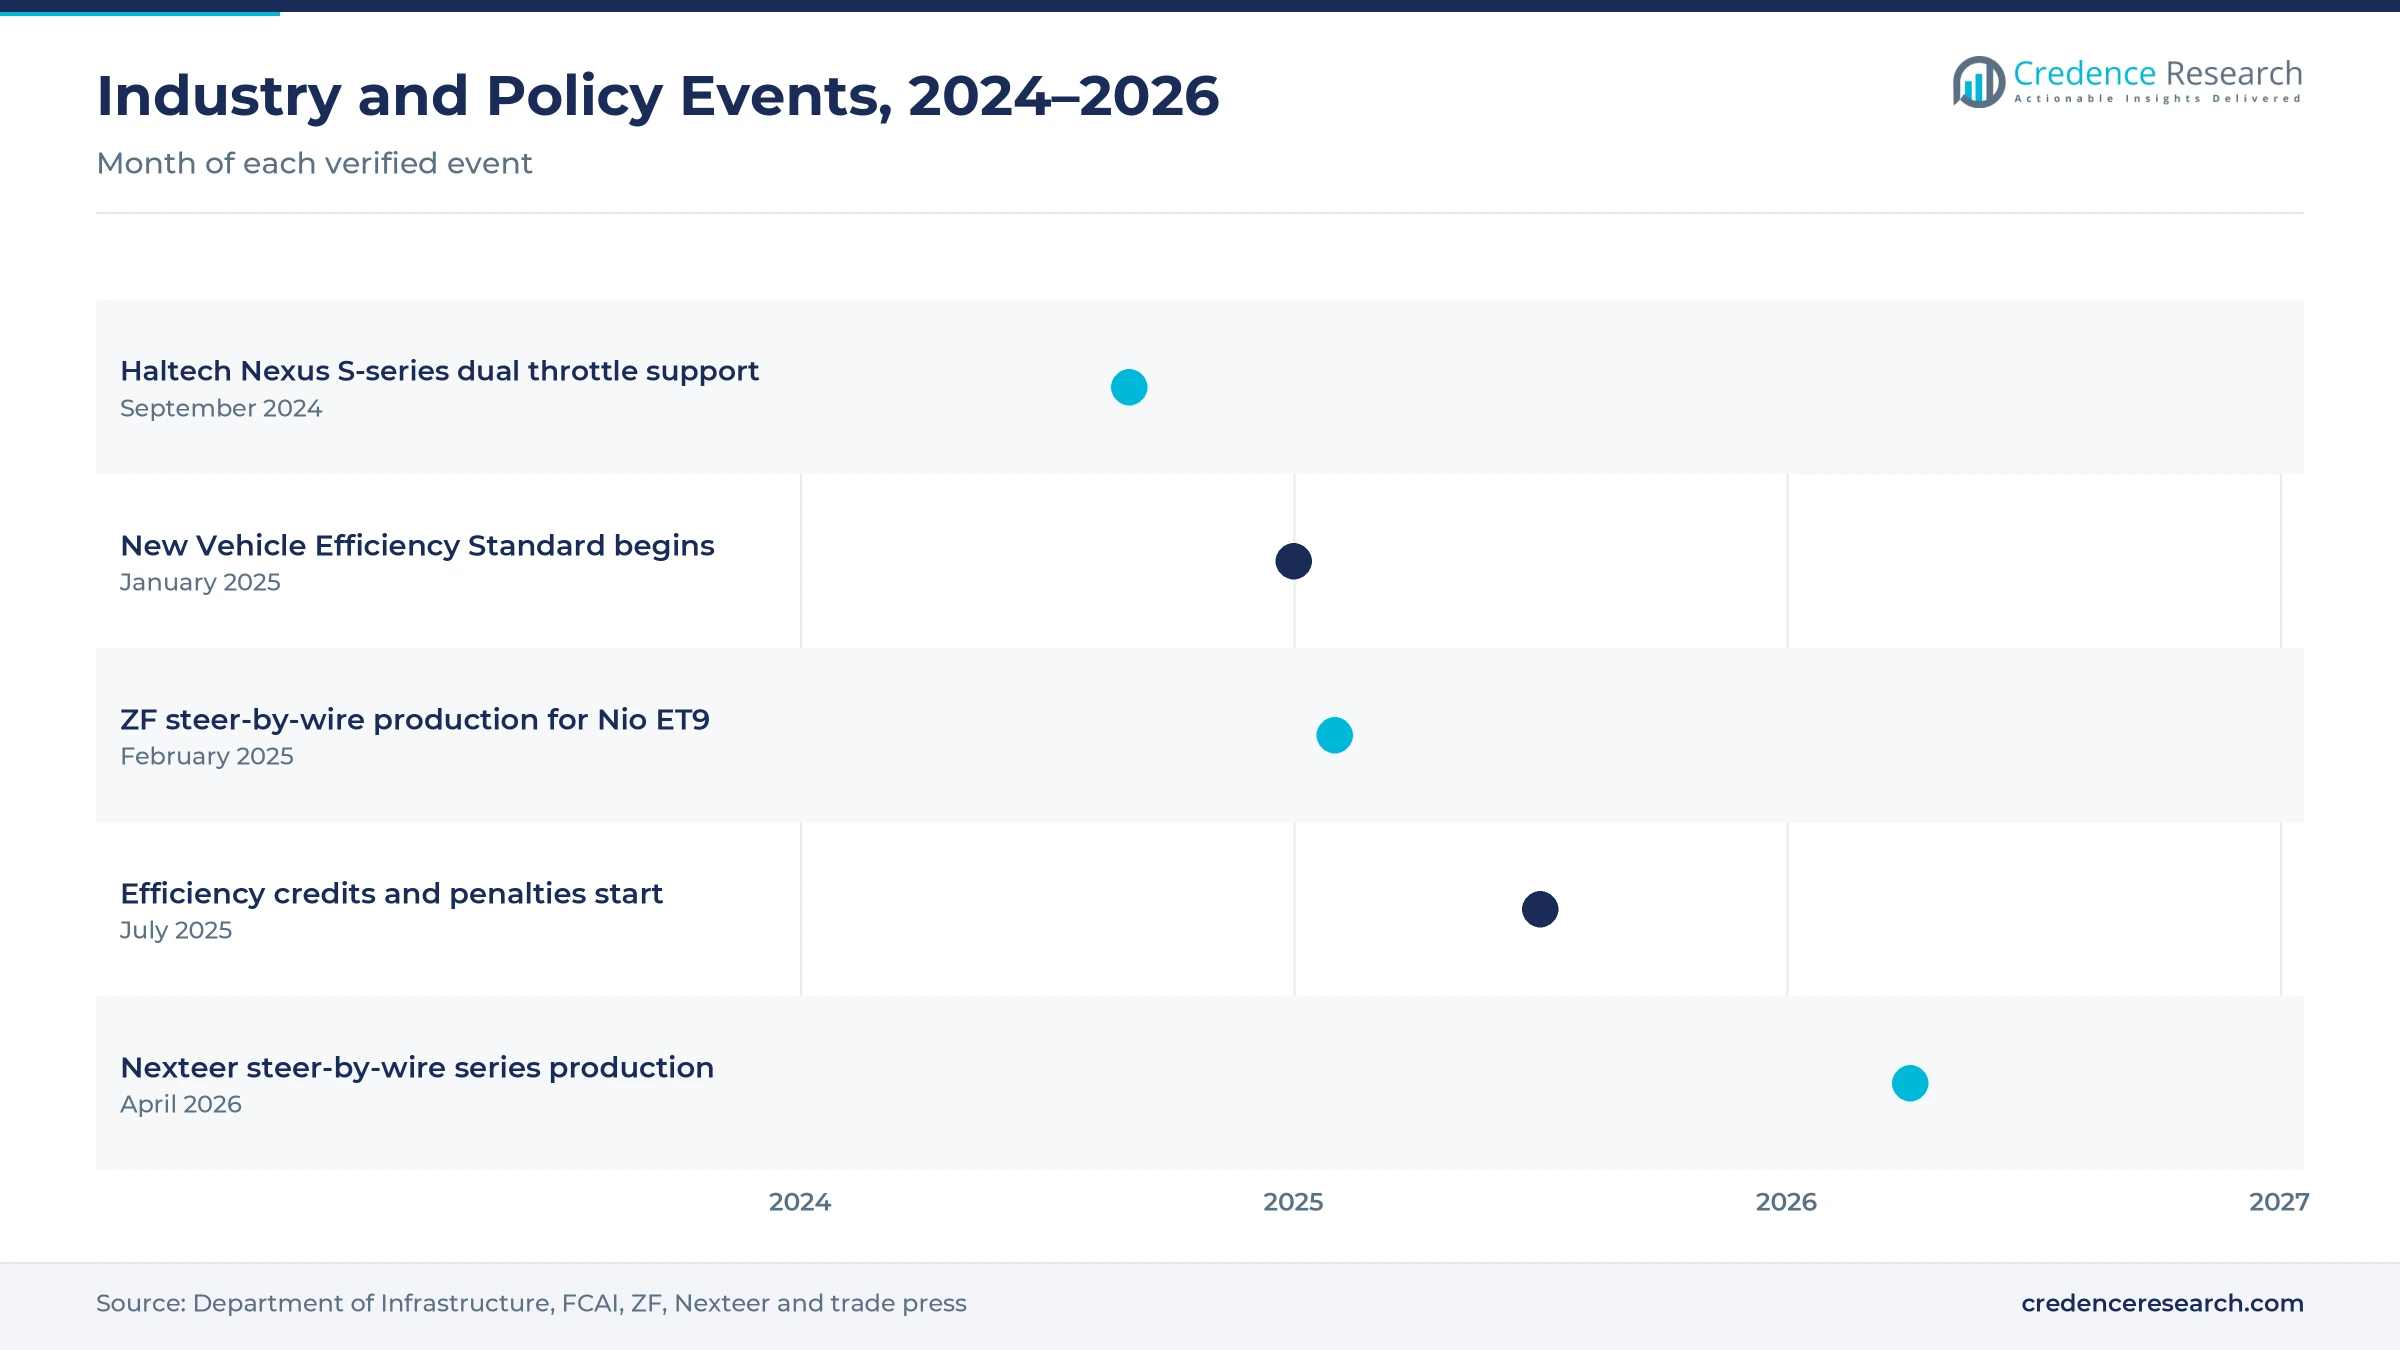
| In September 2024, Haltech promoted Nexus S-series controllers that run dual electronic throttle bodies. | Supported Australian aftermarket throttle demand |
| In January 2025, the New Vehicle Efficiency Standard began in Australia. | Pushed brands toward hybrid and electric models |
| In February 2025, ZF began series production of steer-by-wire for the Nio ET9. | Showed column-free steering in a production vehicle |
| In April 2026, Nexteer put its first steer-by-wire program into series production. | Followed ASIL D functional safety certification |
| In June 2026, battery electric vehicles reached 23.3% of new sales from all sources. | Raised demand for electronic vehicle control |
Redundant actuators and software reshape vehicle control
- Redundant steering actuators use dual controllers, dual power supplies and multiple communication links, which keep steering working if one path fails.
- Electromechanical brake systems replace hydraulic lines with electric actuators, which support regenerative braking and faster stability control in electrified vehicles.
- Electronic throttle bodies link pedal sensors to engine control units, which allow traction and cruise control functions.
- Variable steering ratio software changes wheel response with speed, which improves parking and highway stability.
Need a Custom Version of This Report?
Tailor the scope, geography, or segments to your exact requirements.
- Custom geography or segment scope
- Direct access to our analyst team
Global chassis suppliers and local tuners split demand
Competition is split between global chassis suppliers that ship systems inside imported vehicles and Australian engine management firms that serve tuners and motorsport teams. ZF announced series production of steer-by-wire for the Nio ET9 in February 2025 and won a large brake-by-wire order. Nexteer announced in April 2026 that its first steer-by-wire program had entered series production. In the aftermarket, Sydney-based Haltech, MoTeC and Emtron Australia supply engine control units that run electronic throttle bodies. Robert Bosch Australia, DENSO Australia, Aptiv, Astemo and Link Engine Management also supply control parts and electronics. Rivals compete on functional safety, software quality, redundancy, price and support for local workshops and tuners. Because China, Japan, Thailand and Korea supplied about 85% of June 2026 new vehicle sales, global suppliers win business through vehicle makers overseas, while local firms build demand through dealers, tuners and motorsport teams in every state.
Companies profiled and their roles in this market
| Company | Type | Role in the market |
|---|---|---|
| ZF | Global chassis supplier | Began steer-by-wire series production for the Nio ET9 in 2025 |
| Nexteer Automotive | Global steering supplier | Put its first steer-by-wire program into production in 2026 |
| Haltech | Engine management maker | Sydney-based maker of controllers with dual electronic throttle support |
| MoTeC | Motorsport electronics maker | M1 controllers run up to two electronic throttle bodies |
| Emtron Australia | Engine management maker | Sells engine management and motorsport electronics |
Credence Research view on Australian vehicle control
Credence Research's view is that Australian demand for electronic vehicle control will grow quickly because the efficiency standard and buyer interest are pushing electrified SUVs into the mainstream. Electronic throttles remain the base of the market, while electronic braking and steering raise value per vehicle. Chinese-sourced electrified models are spreading advanced controls faster, while local tuners keep the aftermarket active. Suppliers that combine functional safety, software and local service support should gain share fastest, especially as fleets electrify.
How the Australian electronic control estimate was built
The report uses 2025 as the base year on a calendar basis, and market values come from the Credence Research model. That model combines new vehicle sales data, efficiency standard rules, population statistics, World Bank emissions data and company announcements on steering, braking and engine control products. Segment splits and regional growth rates are Credence Research estimates, while regional shares follow the client-defined split. Sources used are public reports, official statistics, trade press, industry association releases and company releases, and no interviews or surveys were used.
Electrification carries electronic control growth to 2035
System value is expected to reach USD 680.2 million by 2035, an 8.99% CAGR during 2026–2035, as electrified vehicles, electronic braking and column-free steering lift value per vehicle. Growth should stay strong through 2030 while efficiency targets tighten. After that, steer-by-wire and brake-by-wire adoption in mainstream models will carry more growth. Faster charging rollout would lift battery electric demand, while weaker vehicle sales would slow it. Suppliers with proven redundant systems are expected to gain the most.
Frequently Asked Questions
How big is the Australia drive-by-wire market?
Which vehicle type leads Australian electronic control demand?
Which region leads the Australia drive-by-wire market?
How fast are battery electric vehicle sales growing in Australia?
How does the New Vehicle Efficiency Standard affect demand?
Which powertrain is growing fastest?
Who are the leading companies in Australian electronic vehicle control?
What are the main challenges for suppliers?
Table of Content
Chapter 1 Market Segmentation
- 1.1 Segmentation Framework
- 1.1.1 Product and Service Classification
- 1.1.2 Application and End-Use Classification
- 1.1.3 Technology and Solution Classification
- 1.1.4 Customer and Distribution Channel Classification
- 1.1.5 Geographic Segmentation
- 1.1.6 Market Segment Definitions and Boundaries
- 1.2 By Vehicle Type
- 1.2.1 SUVs / Crossovers
- 1.2.2 Light Commercial Vehicles
- 1.2.3 Passenger Cars
- 1.2.4 Heavy Vehicles and Specialty Vehicles
- 1.3 By Powertrain
- 1.3.1 Internal Combustion Vehicles
- 1.3.2 Hybrid Electric Vehicles
- 1.3.3 Plug-In Hybrid Vehicles
- 1.3.4 Battery Electric Vehicles
- 1.4 By Sales Channel
- 1.4.1 OEM Embedded Supply
- 1.4.2 Authorized Dealer Aftermarket
- 1.4.3 Independent Aftermarket
- 1.5 By Customer Type
- 1.5.1 Private Vehicle Owners
- 1.5.2 Business Fleets
- 1.5.3 Government Fleets
Chapter 2 Introduction
- 2.1 Report Objectives and Scope
- 2.2 Product Definition and Industry Terminology
- 2.3 Market Inclusions and Exclusions
- 2.4 Research Process
- 2.4.1 Primary Research and Expert Interviews
- 2.4.2 Secondary Research and Source Review
- 2.4.3 Top-Down and Bottom-Up Estimation
- 2.4.4 Data Triangulation and Verification
- 2.5 Market Size Measurement Basis
- 2.5.1 2025: USD 287.5 million → 2035: USD 680.2 million
- 2.6 Historical and Forecast Reference Periods
- 2.6.1 Historical Period: 2018-2025
- 2.6.2 Base Year: 2025
- 2.6.3 Forecast Period: 2025-2035
- 2.7 Research Assumptions and Limitations
Chapter 3 Executive Summary
- 3.1 Market Snapshot and Key Findings
- 3.2 Base-Year Market Size, 2025
- 3.3 Forecast Market Size, 2035
- 3.4 Revenue and Volume Growth Outlook
- 3.5 Key Demand and Supply Indicators
- 3.6 Leading Market Segments
- 3.7 Fastest-Growing Market Opportunities
- 3.8 Regional Performance Highlights
- 3.9 Technology and Industry Transformation
- 3.10 Competitive Landscape Summary
- 3.11 Analyst View and Strategic Implications
Chapter 4 Australia Drive-by-Wire Market Trends and Developments
- 4.1 Historical Industry Development, 2018-2025
- 4.2 Recent Market Trends and Developments
- 4.3 Demand and Customer Behavior Trends
- 4.4 Technology and Product Innovation
- 4.5 Artificial Intelligence, Automation and Digitalization
- 4.6 Local Manufacturing and Supply Chain Realignment
- 4.7 Industry Partnerships, Mergers and Acquisitions
- 4.8 Sustainability and Circular Economy Developments
- 4.9 Government and Private Sector Investment Trends
- 4.10 Emerging Business Models and Commercialization
- 4.11 Industry Developments and Announcements
Chapter 5 Australia Drive-by-Wire Market Production, Supply and Demand Analysis
- 5.1 Demand Trend and Consumption Analysis, 2018-2025
- 5.2 Demand Forecast, 2025-2035
- 5.3 Production and Output Trend, 2018-2025
- 5.4 Production and Output Forecast, 2025-2035
- 5.5 Installed Capacity and Capacity Utilization
- 5.6 Company-Wise Production Plants and Statistics
- 5.6.1 Installed Production Capacity
- 5.6.2 Actual Production
- 5.6.3 Planned Capacity and Expansion Targets
- 5.7 Supply Chain Structure and Procurement Trends
- 5.8 Supply-Demand Gap and Bottlenecks
- 5.9 Import Dependence and Sourcing Structure
- 5.10 Contract Manufacturing and Outsourcing
- 5.11 Regional Supply and Demand Concentration
Chapter 6 Australia Drive-by-Wire Market Pricing Analysis
- 6.1 Pricing Structure and Measurement
- 6.2 Historical Pricing Trends, 2018-2025
- 6.3 Pricing Outlook, 2025-2035
- 6.4 Average Selling Price and Unit Economics
- 6.5 Pricing by Product and Market Segment
- 6.6 Geographic Pricing Differences
- 6.7 Key Input, Energy, Labor and Logistics Costs
- 6.8 Contract Pricing and Purchasing Models
- 6.9 Pricing Sensitivity and Competitive Positioning
- 6.10 Price, Margin and Profitability Implications
Chapter 7 Australia Drive-by-Wire Market Dynamics
- 7.1 Market Growth Drivers
- 7.1.1 Demand-Side Drivers
- 7.1.2 Technology and Innovation Drivers
- 7.1.3 Infrastructure and Investment Drivers
- 7.1.4 Regulatory and Policy Drivers
- 7.2 Market Restraints
- 7.2.1 Cost and Affordability Constraints
- 7.2.2 Technology and Adoption Barriers
- 7.2.3 Supply Chain and Operational Constraints
- 7.3 Market Challenges
- 7.3.1 Competitive Pressure and Margin Erosion
- 7.3.2 Skills, Infrastructure and Implementation Gaps
- 7.4 Emerging Market Opportunities
- 7.5 Market Dynamics Impact and Time-Horizon Assessment
Chapter 8 Australia Drive-by-Wire Value Chain Analysis
- 8.1 Industry Value Chain Overview
- 8.2 Upstream Suppliers and Critical Inputs
- 8.3 Technology and Component Providers
- 8.4 Manufacturing or Service Delivery
- 8.5 Distribution, Channel Partners and Integrators
- 8.6 Downstream Applications and End Users
- 8.7 Value Addition and Profit Pools
- 8.8 Vertical Integration and Outsourcing
- 8.9 Supplier Concentration and Risk
- 8.10 Supply Chain Localization and Resilience
Chapter 9 Australia Drive-by-Wire Market Regulations and Policies
- 9.1 Relevant Laws, Standards and Compliance Frameworks
- 9.2 Product, Service, Safety and Quality Requirements
- 9.3 Government Policies, Incentives and Subsidies
- 9.4 Imports, Exports and Trade Barriers
- 9.5 Public Procurement and Local Content Requirements
- 9.6 Environmental and Sustainability Compliance
- 9.7 Upcoming Policy Changes and Market Implications
Chapter 10 Australia Drive-by-Wire Market Hotspots and Opportunities
- 10.1 Market Opportunity Mapping and Growth Hotspots
- 10.2 High-Growth Applications and Customer Groups
- 10.3 Underserved Markets and White-Space Opportunities
- 10.4 Emerging Technology and Product Opportunities
- 10.5 New Capacity and Investment Hotspots
- 10.6 Market Entry and Expansion Opportunities
- 10.7 Distribution and Partnership Opportunities
- 10.8 Near-Term and Long-Term Commercial Potential
- 10.9 Opportunity Attractiveness and Execution Risks
Chapter 11 Australia Drive-by-Wire Market Outlook, 2025-2035
- 11.1 Market Size and Analysis
- 11.1.1 Revenue (Market Measurement: 2025: USD 287.5 million → 2035: USD 680.2 million)
- 11.1.2 Market Volume and Quantity Sold
- 11.1.3 Historical Market Size, 2018-2025
- 11.1.4 Base-Year Market Size, 2025
- 11.2 Market Forecast, 2025-2035
- 11.2.1 Revenue Forecast to 2035
- 11.2.2 Volume Forecast to 2035
- 11.2.3 CAGR and Year-on-Year Growth
- 11.2.4 Incremental Revenue Opportunity
- 11.3 Forecast Assumptions and Scenario Analysis
- 11.3.1 Base-Case Forecast
- 11.3.2 Optimistic and Conservative Scenarios
- 11.3.3 Technology, Pricing and Policy Sensitivities
- 11.4 Market Attractiveness and Growth Outlook
Chapter 12 Australia Drive-by-Wire Market Segmentation and Outlook
- 12.1 Segmentation Summary and Market Shares, 2025
- 12.2 Largest and Fastest-Growing Segments
- 12.3 By Vehicle Type - Market Size and Forecast, 2025-2035
- 12.3.1 Segment Definition and Scope
- 12.3.2 Historical Market Size, 2018-2025
- 12.3.3 Revenue Forecast, 2025-2035
- 12.3.4 Volume Forecast, 2025-2035
- 12.3.5 Base-Year Market Share, 2025
- 12.3.6 Segment CAGR and Growth Drivers
- 12.3.7 Subsegment Market Size and Forecast
- 12.3.7.1 SUVs / Crossovers
- 12.3.7.2 Light Commercial Vehicles
- 12.3.7.3 Passenger Cars
- 12.3.7.4 Heavy Vehicles and Specialty Vehicles
- 12.3.8 Subsegment Pricing and Adoption Trends
- 12.3.9 Leading Suppliers and Competition
- 12.3.10 Regional Demand and Opportunities
- 12.4 By Powertrain - Market Size and Forecast, 2025-2035
- 12.4.1 Segment Definition and Scope
- 12.4.2 Historical Market Size, 2018-2025
- 12.4.3 Revenue Forecast, 2025-2035
- 12.4.4 Volume Forecast, 2025-2035
- 12.4.5 Base-Year Market Share, 2025
- 12.4.6 Segment CAGR and Growth Drivers
- 12.4.7 Subsegment Market Size and Forecast
- 12.4.7.1 Internal Combustion Vehicles
- 12.4.7.2 Hybrid Electric Vehicles
- 12.4.7.3 Plug-In Hybrid Vehicles
- 12.4.7.4 Battery Electric Vehicles
- 12.4.8 Subsegment Pricing and Adoption Trends
- 12.4.9 Leading Suppliers and Competition
- 12.4.10 Regional Demand and Opportunities
- 12.5 By Sales Channel - Market Size and Forecast, 2025-2035
- 12.5.1 Segment Definition and Scope
- 12.5.2 Historical Market Size, 2018-2025
- 12.5.3 Revenue Forecast, 2025-2035
- 12.5.4 Volume Forecast, 2025-2035
- 12.5.5 Base-Year Market Share, 2025
- 12.5.6 Segment CAGR and Growth Drivers
- 12.5.7 Subsegment Market Size and Forecast
- 12.5.7.1 OEM Embedded Supply
- 12.5.7.2 Authorized Dealer Aftermarket
- 12.5.7.3 Independent Aftermarket
- 12.5.8 Subsegment Pricing and Adoption Trends
- 12.5.9 Leading Suppliers and Competition
- 12.5.10 Regional Demand and Opportunities
- 12.6 By Customer Type - Market Size and Forecast, 2025-2035
- 12.6.1 Segment Definition and Scope
- 12.6.2 Historical Market Size, 2018-2025
- 12.6.3 Revenue Forecast, 2025-2035
- 12.6.4 Volume Forecast, 2025-2035
- 12.6.5 Base-Year Market Share, 2025
- 12.6.6 Segment CAGR and Growth Drivers
- 12.6.7 Subsegment Market Size and Forecast
- 12.6.7.1 Private Vehicle Owners
- 12.6.7.2 Business Fleets
- 12.6.7.3 Government Fleets
- 12.6.8 Subsegment Pricing and Adoption Trends
- 12.6.9 Leading Suppliers and Competition
- 12.6.10 Regional Demand and Opportunities
- 12.7 Segment Growth Comparison
- 12.8 Segment Attractiveness and Priority Matrix
Chapter 13 Australia Drive-by-Wire End-Use and Application Market Outlook
- 13.1 End-Use Industry and Customer Demand Structure
- 13.2 Leading Applications and Customer Groups
- 13.3 End-Use Market Size, Share and Forecast
- 13.4 Major End-Use Industry Deep Dives
- 13.4.1 Customer Requirements and Use Cases
- 13.4.2 Demand and Replacement Cycles
- 13.4.3 Technical and Regulatory Considerations
- 13.4.4 Purchasing and Procurement Models
- 13.4.5 Leading Vendors and Distribution Channels
- 13.4.6 Forecast and Commercial Opportunities
- 13.5 Emerging Applications and Cross-Segment Demand
- 13.6 End-Use Industry Investment Priorities
Chapter 14 Australia Drive-by-Wire Geographic Market Outlook, 2025-2035
- 14.1 Domestic Market Distribution and Demand Clusters
- 14.2 State- or Province-Wise Market Size and Forecast, 2025-2035
- 14.3 City and Metropolitan Market Outlook
- 14.4 Industrial, Manufacturing and Commercial Clusters
- 14.5 Geographic Concentration of Key End Users
- 14.6 Local Pricing and Purchasing Differences
- 14.7 Domestic Production Facilities and Capacity Map
- 14.8 Local Infrastructure and Project Pipeline
- 14.9 State-Level Policy and Incentive Differences
- 14.10 Subnational Investment Hotspots and Opportunities
- 14.11 Distribution and Logistics Networks
- 14.12 Domestic Competitive Footprint
Chapter 15 Australia Drive-by-Wire Technology, Innovation and Sustainability Outlook
- 15.1 Technology Landscape and Maturity
- 15.2 Product, Process and Service Innovation
- 15.3 AI, Automation and Digital Tools in the Industry
- 15.4 Technology Adoption and Performance Benchmarking
- 15.5 Innovation Pipeline and R&D Investment
- 15.6 Patent and Intellectual Property Trends
- 15.7 Energy Efficiency and Resource Management
- 15.8 Sustainability, Recycling and Circularity
- 15.9 Technology Roadmap, 2025-2035
- 15.10 Risks of Obsolescence and Technology Substitution
Chapter 16 Australia Drive-by-Wire Market Key Strategic Imperatives
- 16.1 Growth and Market Entry Priorities
- 16.2 High-Return Products and Segments
- 16.3 Pricing, Profitability and Cost Optimization
- 16.4 Technology Investment and Product Differentiation
- 16.5 Supply Chain Localization and Resilience
- 16.6 Distribution and Customer Acquisition
- 16.7 Partnership, Acquisition and Capacity Strategy
- 16.8 Regional Expansion Priorities
- 16.9 Short-, Medium- and Long-Term Actions
Chapter 17 Competition Outlook
- 17.1 Industry Competition Characteristics
- 17.2 Market Structure and Concentration
- 17.3 Market Share and Competitive Positioning, 2025
- 17.4 Company-Wise Revenue and Product Benchmarking
- 17.5 Production and Service Capacity Benchmarking
- 17.6 Technology, Pricing and Differentiation
- 17.7 Regional Footprint and Distribution Strength
- 17.8 Mergers, Acquisitions and Strategic Alliances
- 17.9 New Entrants and Competitive Threats
- 17.10 Porter's Five Forces and Industry Attractiveness
- 17.11 Competitive Outlook, 2025-2035
Chapter 18 Company Profiles
- 18.1 Company Coverage and Selection Criteria
- 18.2 Nexteer Automotive
- 18.2.1 Business Description
- 18.2.2 Company Ownership and Geographic Presence
- 18.2.3 Product and Service Portfolio
- 18.2.4 Manufacturing and Operating Footprint
- 18.2.5 Production Capacity and Expansion Plans
- 18.2.6 Financial Performance and Investment
- 18.2.7 Market Share and Competitive Position
- 18.2.8 Technology and Innovation Capabilities
- 18.2.9 Strategic Alliances or Partnerships
- 18.2.10 Recent Developments
- 18.2.11 Growth Strategy and Outlook
- 18.3 Robert Bosch Australia
- 18.4 DENSO Australia
- 18.5 Aptiv
- 18.6 ZF
- 18.7 Astemo
- 18.8 Haltech
- 18.9 MoTeC
- 18.10 Link Engine Management
- 18.11 Emtron Australia
- 18.12 Other Relevant Market Participants
Note: Every listed company is profiled on the structure shown under the first company. The company list is preliminary and may change based on research findings, market developments, data availability and client requirements.
Chapter 19 Disclaimer
- 19.1 Research and Forecast Disclaimer
- 19.2 Data Source and Estimation Limitations
Note: The depth of individual sections depends on data availability for this market. Volume, capacity, trade and other unit-based metrics are included where applicable.

