
Metro growth, online sales and local cells widen demand
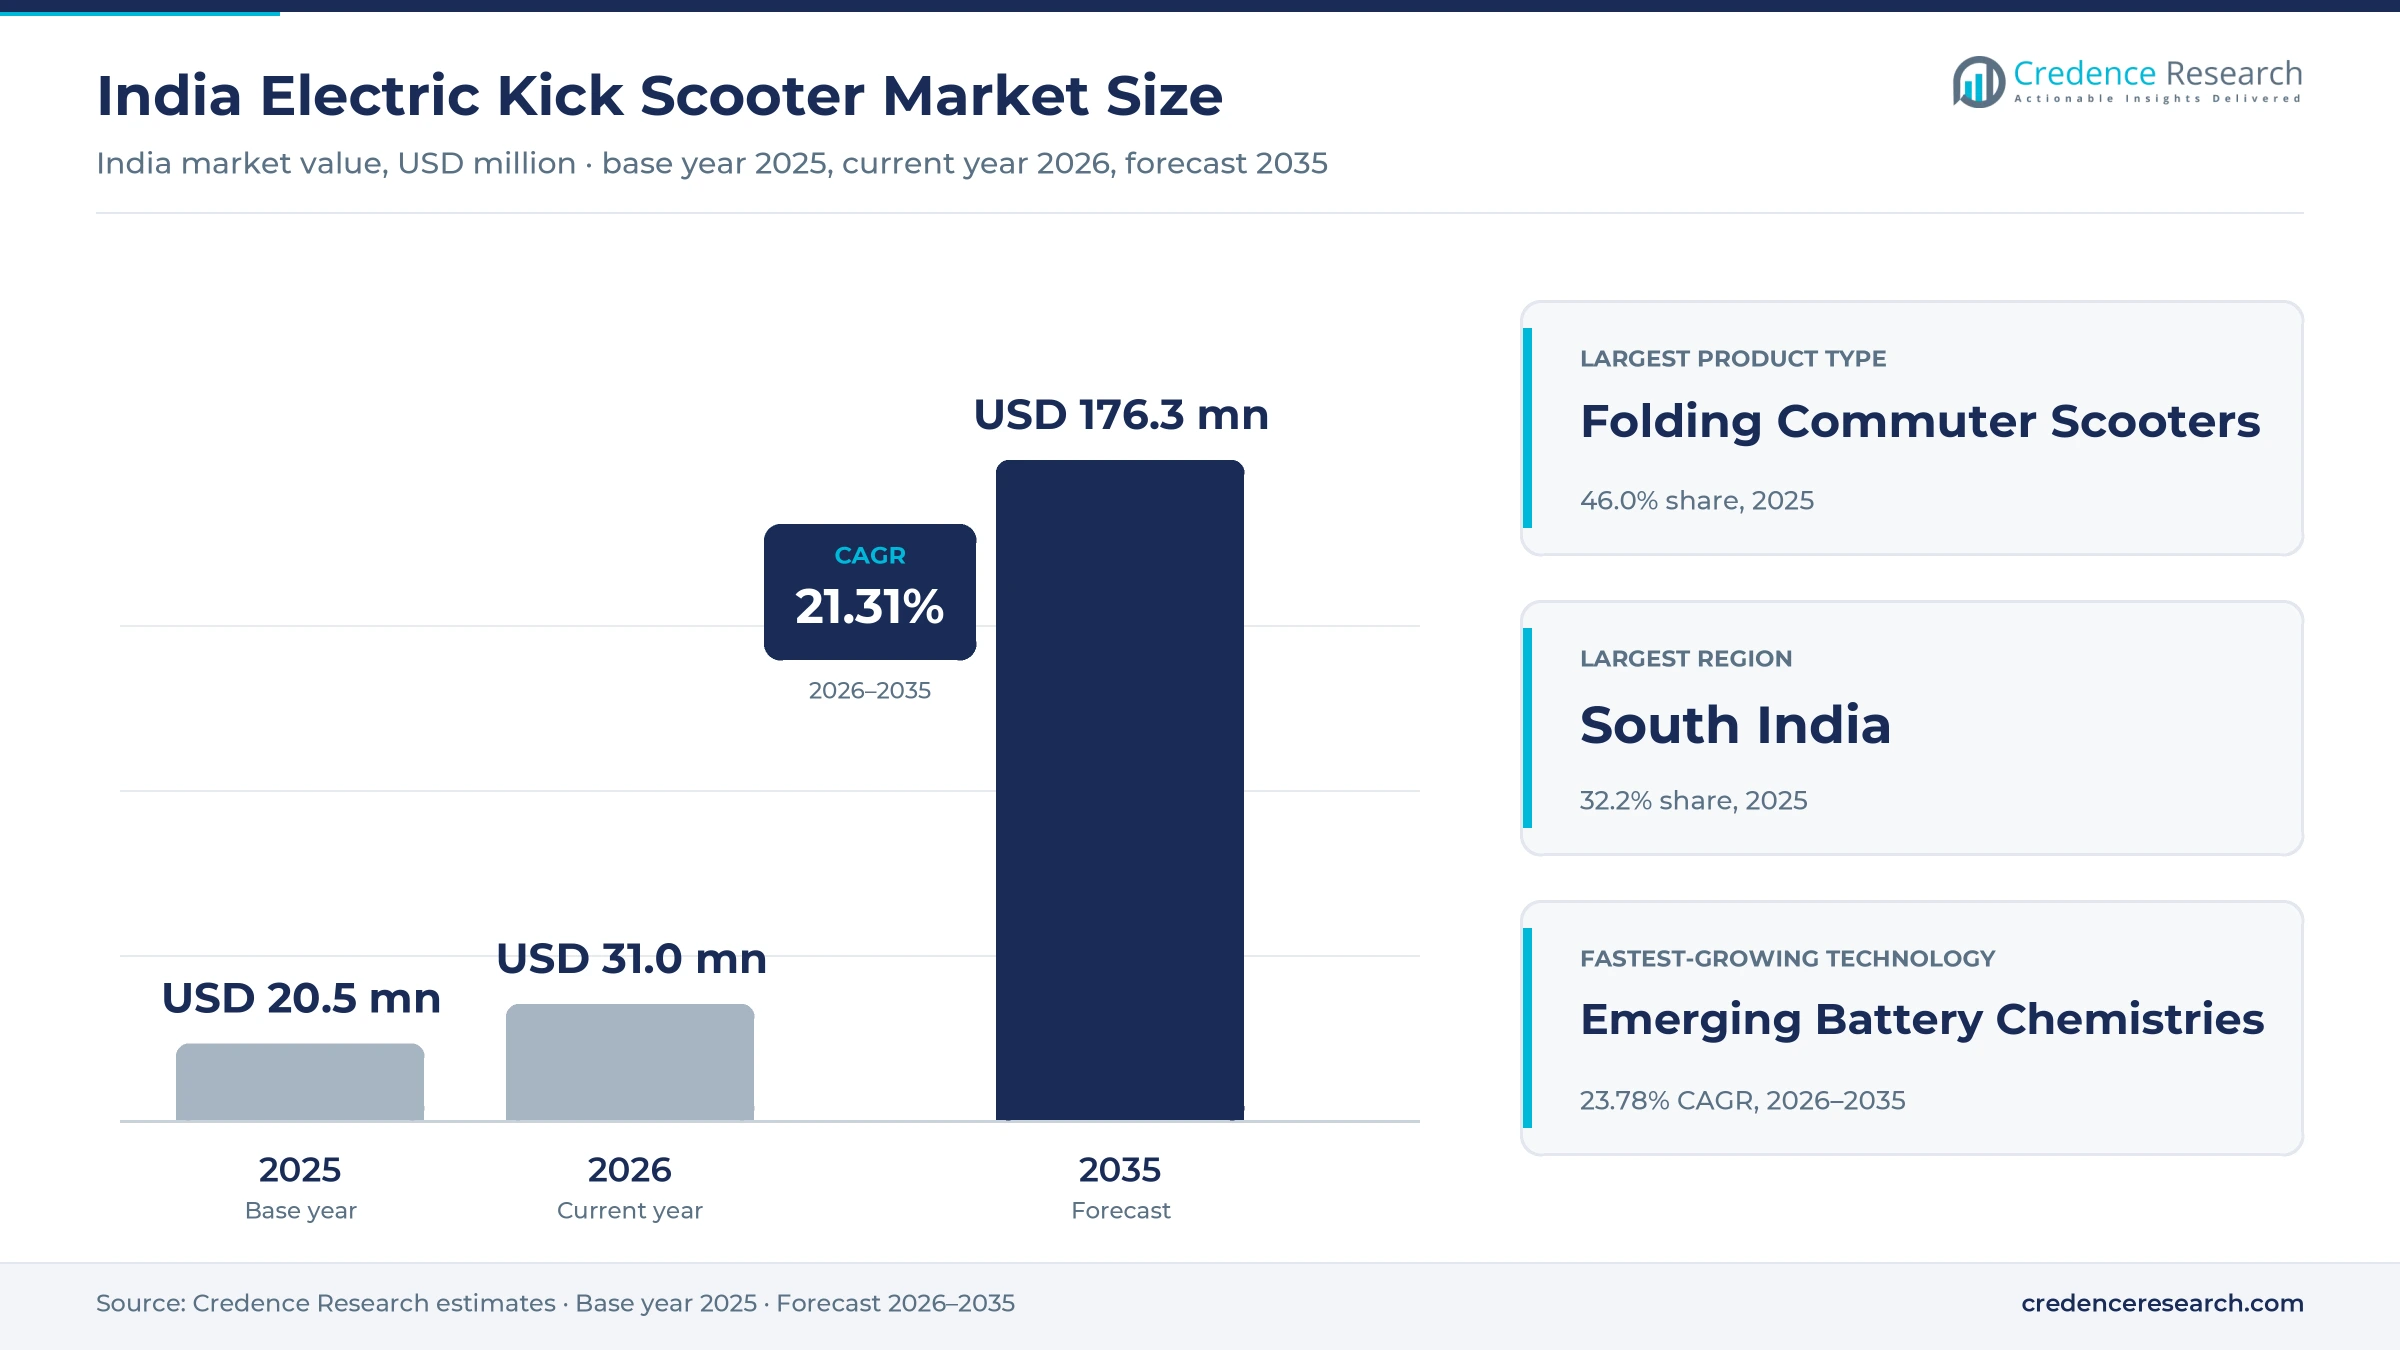
The India electric kick scooter market was valued at USD 20.5 million in 2025 and is projected to increase from USD 31.0 million in 2026 to USD 176.3 million by 2035, registering a CAGR of 21.31% during 2026–2035. Demand comes from short first- and last-mile trips around new metro lines, campus and office travel, and recreational riding by students and young adults. South India held the largest regional share, 32.2% in 2025, because Bengaluru, Chennai and Hyderabad combine metro services, large technology campuses and strong online buying. North India grows fastest at 21.79% a year, as Delhi NCR adds transit links and local brands sell direct. A draft rule issued in August 2026 would raise the motor power limit for low-speed vehicles exempt from registration from 250 W to 600 W, while keeping the 25 km/h speed cap. Lithium-ion packs now power most models sold in the country.
Which stand-up battery scooters are counted in this estimate?
The estimate measures retail and institutional sales value of stand-up, battery-powered kick scooters in India, including folding commuter models, fixed-frame performance models, compact recreational models and three-wheel stability models. It counts scooters sold through brand websites, online marketplaces, specialist retailers and institutional contracts. Values are stated in USD million at current prices, converted from Indian rupees at average annual exchange rates.
The estimate excludes seated electric scooters and motorcycles that need registration, electric bicycles, hoverboards, non-motorized kick scooters and rental fees from shared fleets. The value chain runs from cell, motor and frame suppliers through importers, assemblers and brands to marketplaces, retailers, campuses, companies and households.
India Electric Kick Scooter Market Insights
- The India electric kick scooter market was valued at USD 20.5 million in 2025 and is projected to reach USD 176.3 million by 2035, registering a CAGR of 21.31% during 2026–2035.
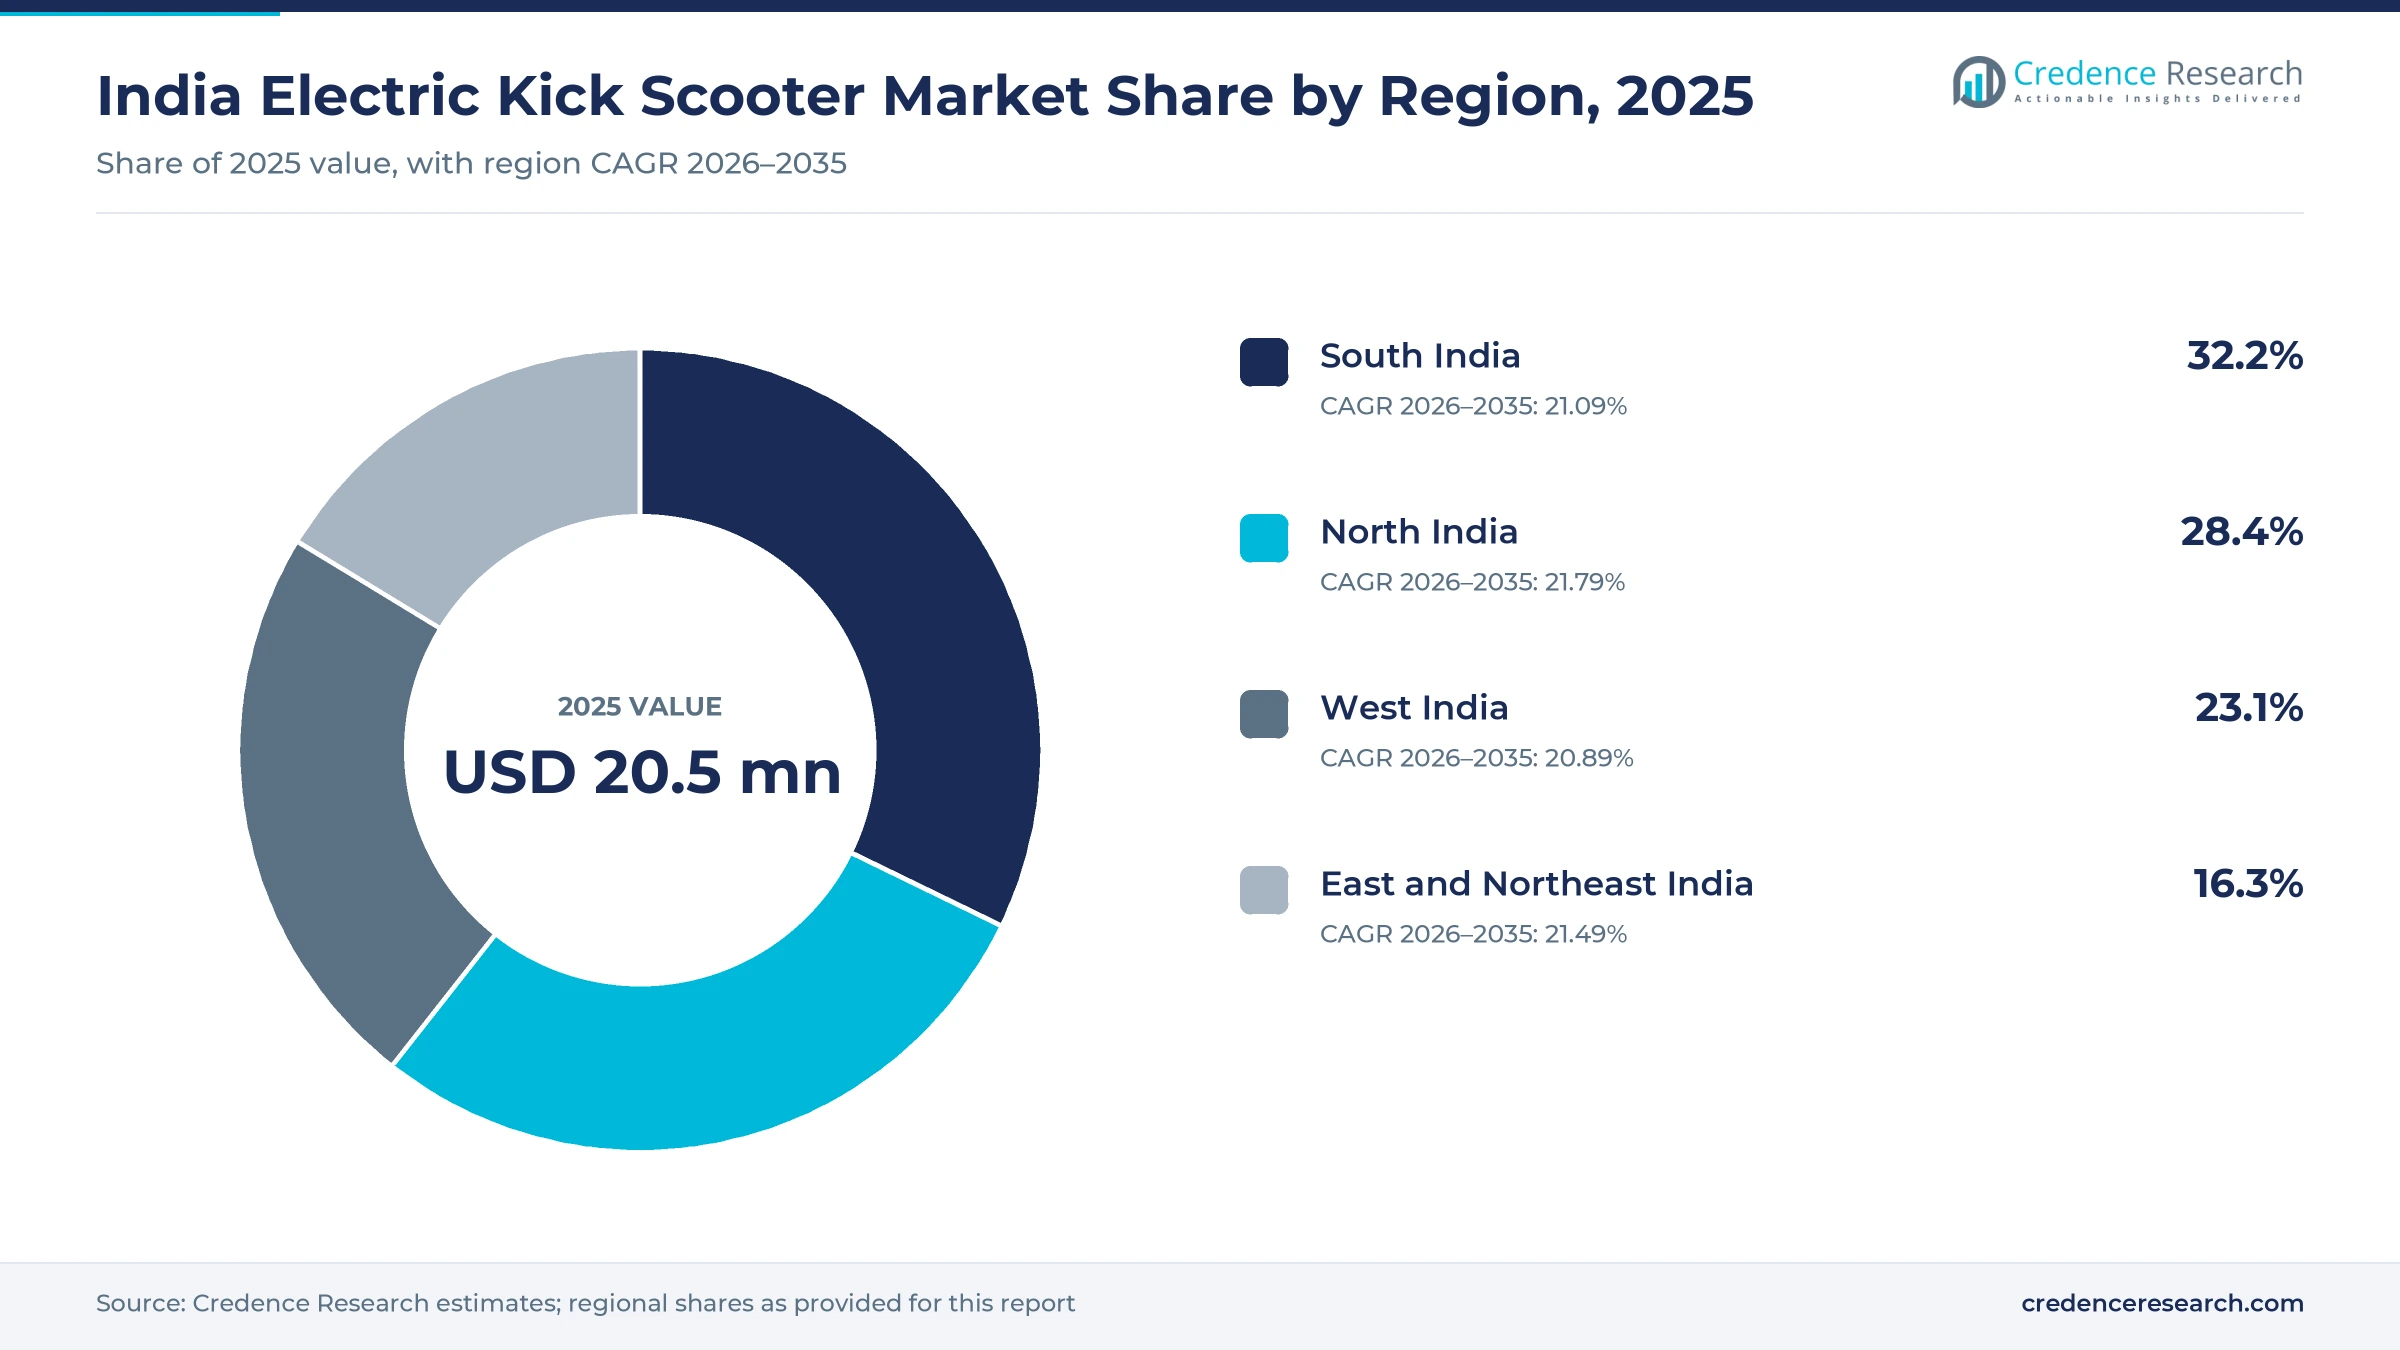
- South India held 32.2% of 2025 value, because its large technology cities combine metro services, big campuses and strong online buying.
- Folding commuter scooters led with 46.0% of 2025 value, since riders can carry them onto trains and store them in small homes.
- India's metro network reached about 1,095 km across 26 cities in 2025, which creates many short trips to and from stations.
- Campus and corporate mobility grows fastest at 22.11% a year during 2026–2035, as employers and campuses add quiet internal transport.
Folding commuter models and online marketplaces lead sales
Why do folding commuter models lead sales?
Based on product type, the market is categorized into folding commuter scooters, fixed-frame performance scooters, compact recreational scooters and three-wheel stability scooters. Folding Commuter Scooters led with 46.0% of 2025 value, because riders can fold them for trains, buses, offices and small apartments. Fixed-Frame Performance Scooters grow fastest at 22.17% a year, as stronger motors suit hills, heavier riders and longer daily commutes.
Why does first and last-mile travel drive most demand?
Based on application, the market is categorized into first and last-mile commuting, campus and corporate mobility, recreation and fitness, and short-distance errands. First and Last-Mile Commuting led with 41.0% of 2025 value, because commuters use scooters to reach metro stations and bus stops. Campus and Corporate Mobility grows fastest at 22.11% a year, as large campuses, business parks and gated communities buy small fleets for internal trips.
Why do lithium-ion packs dominate battery choices?
Based on technology, the market is categorized into lithium-ion battery systems, lead-acid battery systems and emerging battery chemistries. Lithium-Ion Battery Systems led with 82.0% of 2025 value, because they are lighter, charge faster and fit inside slim folding decks. Emerging Battery Chemistries grow fastest at 23.78% a year from a small base, as cell makers test new chemistries for safer and longer-lasting packs.
Why do online marketplaces move most units?
Based on distribution channel, the market is categorized into brand D2C websites, online marketplaces, specialist mobility retailers and institutional and corporate sales. Online Marketplaces led with 43.0% of 2025 value, because buyers compare specifications, reviews and prices in one place. Brand D2C Websites grow fastest at 22.13% a year, as domestic brands sell direct with service plans and spare parts.
| Segment Group | Leading Sub-segment | Share, 2025 | Fastest-growing Sub-segment | CAGR, 2026–2035 |
|---|---|---|---|---|
| By Product Type | Folding Commuter Scooters | 46.0% | Fixed-Frame Performance Scooters | 22.17% |
| By Application | First and Last-Mile Commuting | 41.0% | Campus and Corporate Mobility | 22.11% |
| By Technology | Lithium-Ion Battery Systems | 82.0% | Emerging Battery Chemistries | 23.78% |
| By Distribution Channel | Online Marketplaces | 43.0% | Brand D2C Websites | 22.13% |
Request a Free Sample
Fill in your details and we'll send you a free sample report.
- Sample data tables & charts
- Research methodology
Transit links, online checkout and cell plants lift demand
How does urban transit expansion create last-mile demand?
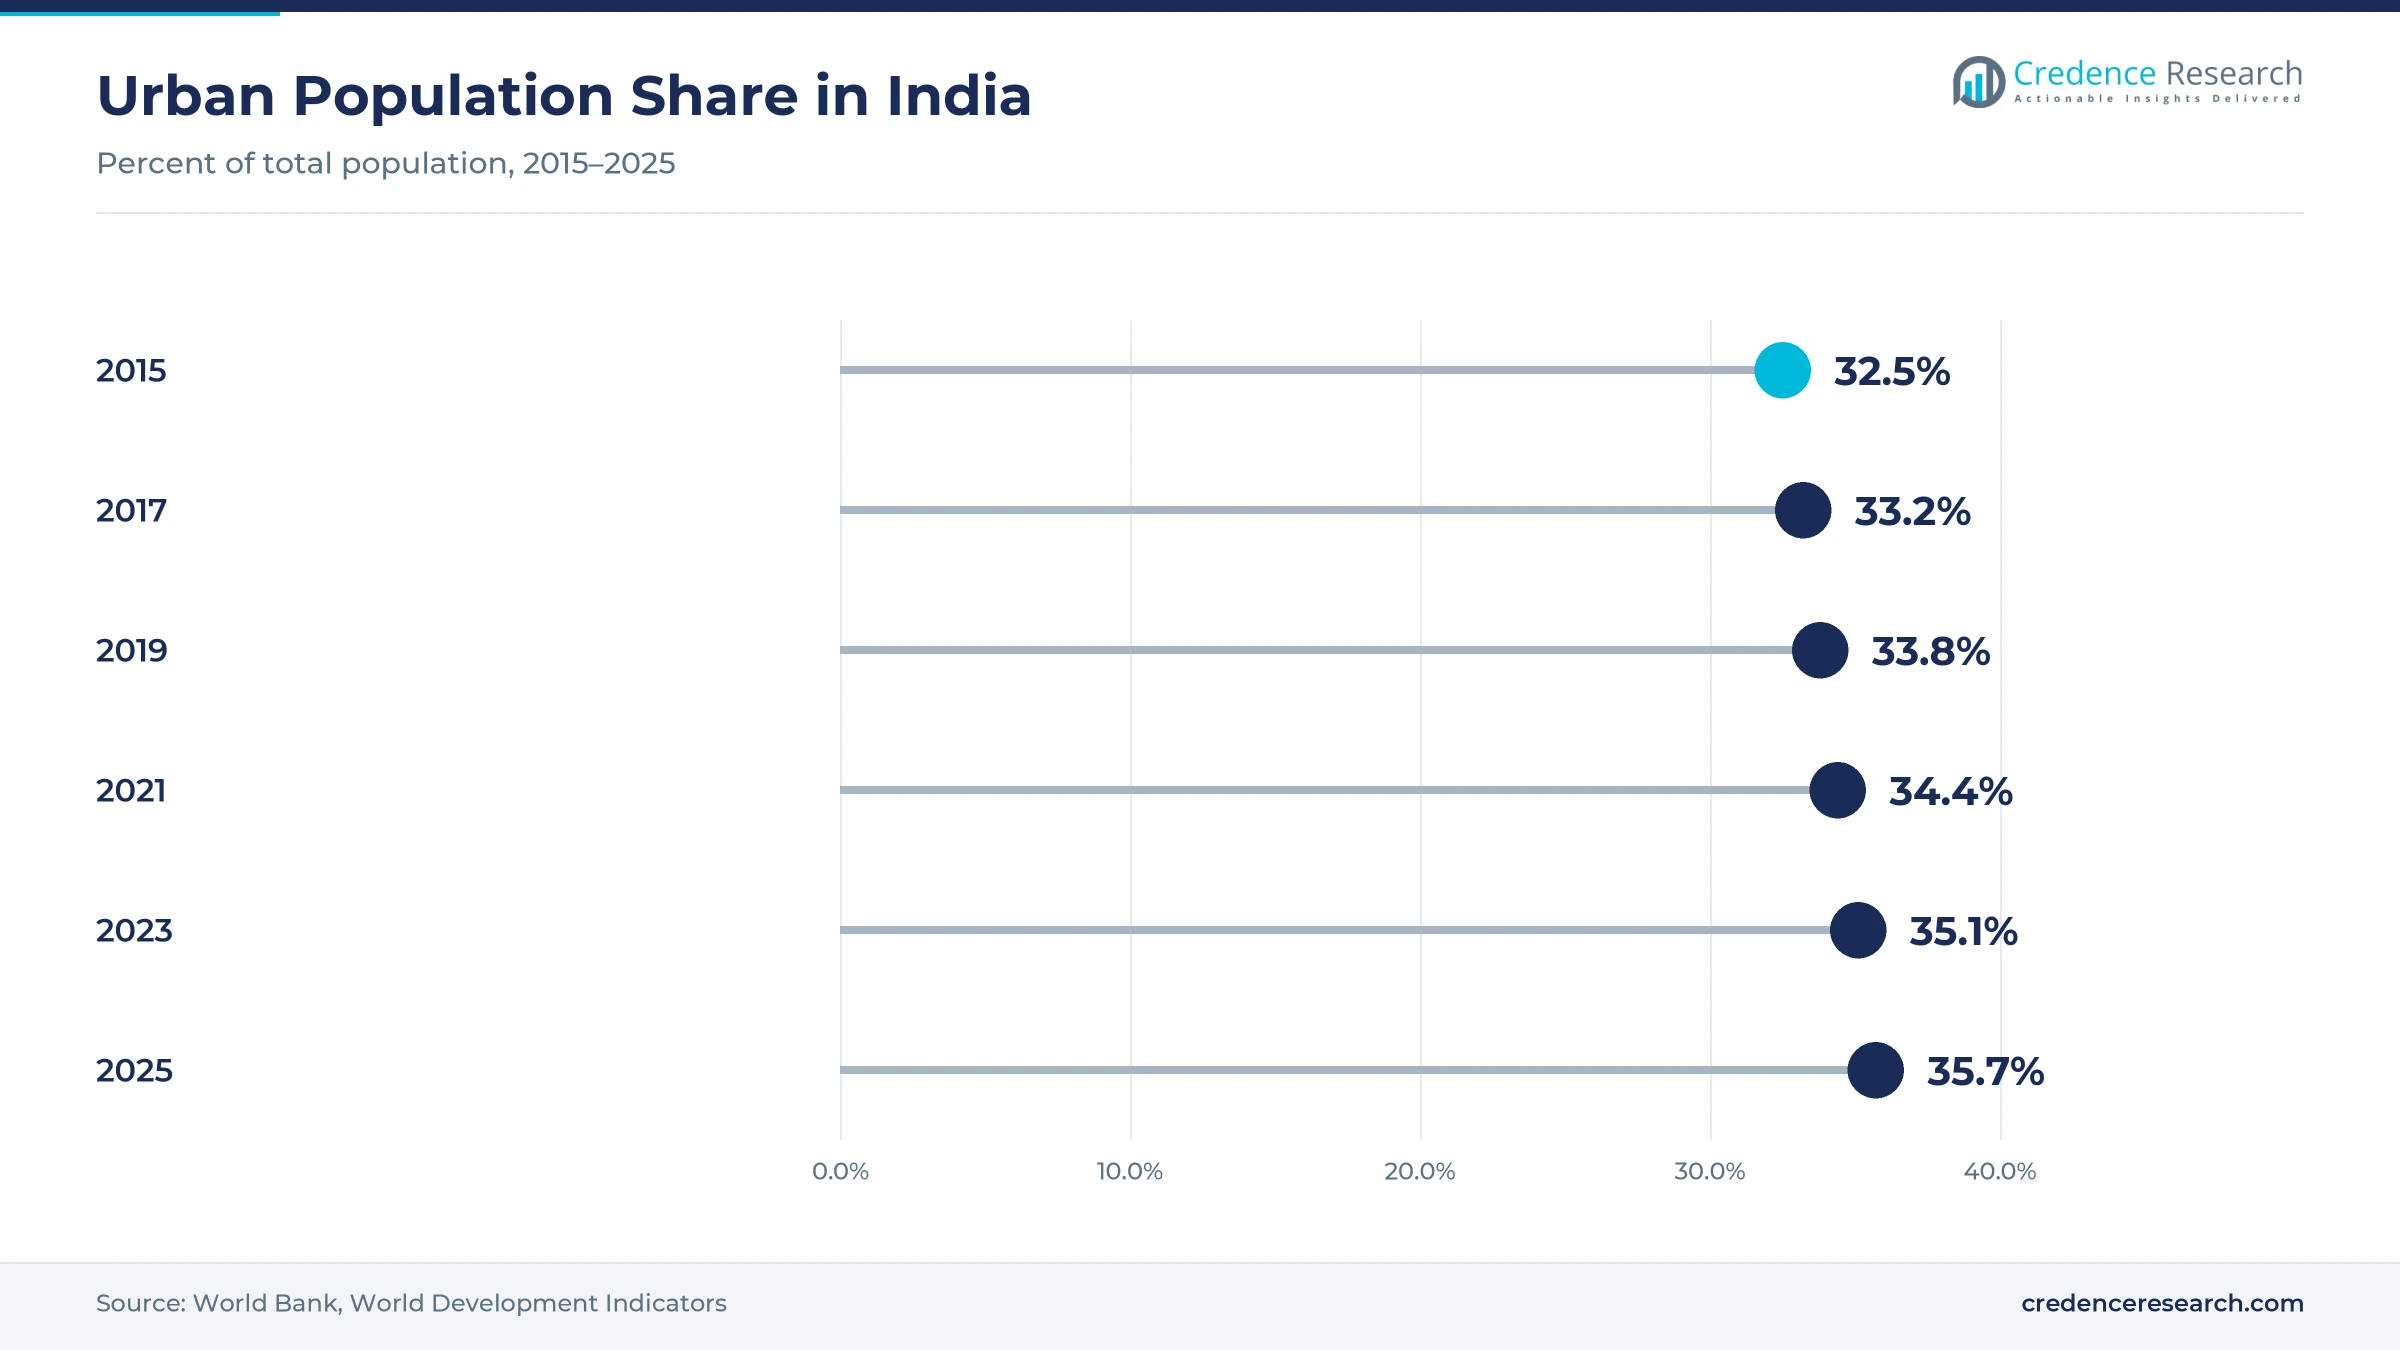
Expanding urban transit lifts demand, because each new metro line creates short first- and last-mile trips that a folding scooter can cover. India's metro network reached about 1,095 km across 26 cities in 2025, up from five cities in 2014, according to a government factsheet. The same factsheet said 38 projects covering 1,051 km had been sanctioned since 2014. Urban residents made up 35.7% of the population in 2025, and people in cities of more than 1 million made up 17.0%, according to World Bank data. As a result, first and last-mile commuting led with 41.0% of 2025 value, as riders pair trains with short scooter trips to offices, colleges and homes.
Why are digital commerce and D2C sales widening access?
Digital commerce widens market access, because most buyers research, compare and order these products online rather than in showrooms. India had more than 111.41 crore internet subscribers at the end of June 2026, according to TRAI data. UPI processed 24.07 billion transactions worth Rs 29.37 lakh crore in September 2026, up 23% in volume from a year earlier, according to Outlook Money. HUSE Mobility began selling Segway-Ninebot scooters in India through its website, Amazon and Flipkart under a partnership announced in August 2022. In turn, online marketplaces lead with 43.0% of 2025 value, and online retail growth keeps lowering the cost of reaching buyers in smaller cities.
How do battery localization and cell incentives help?
Battery localization and better cell technology support growth, because the battery sets much of the price, range and safety of each model. The production-linked incentive scheme for advanced chemistry cells carries an outlay of Rs 18,100 crore for 50 GWh of capacity, and 40 GWh had been awarded by July 2026, according to SolarQuarter. The remaining 10 GWh went out to bid in July 2026 for grid-scale battery storage. The Union Budget of Feb. 1, 2025 also proposed exempting basic customs duty on 35 more capital goods used to make EV batteries and on lithium-ion battery scrap. As a result, lithium-ion battery systems lead with 82.0% of 2025 value, while emerging chemistries grow fastest at 23.78% a year.
Why do clearer low-speed vehicle rules support demand?
Clearer rules for low-speed vehicles support demand, because buyers and fleets need to know which models can be used without registration. The Ministry of Road Transport and Highways issued a draft notification on Aug. 21, 2026, to amend Rule 2(u) of the Central Motor Vehicles Rules, according to GKToday. The draft would raise the motor power limit for exempt low-speed vehicles from 250 W to 600 W, keep the 25 km/h speed cap and remove the 60 kg weight ceiling. The exemption would continue for models that meet AIS-049 safety requirements, and the change was expected from Oct. 1, 2026. Consequently, fixed-frame performance scooters grow fastest by product type at 22.17% a year.
Certified packs, campus fleets and D2C brands gain ground
How is the shift to certified lithium-ion packs playing out?
Makers are shifting toward certified lithium-ion packs with stronger safety features, because buyers now look for tested batteries and safer chargers. AIS-156 Phase 2 has applied to electric two-wheelers since March 31, 2023, and added thermal propagation tests, thermal warnings and charger earth-leakage detection. BIS published IS 17855, a performance standard for lithium-ion traction battery packs, in June 2022. The MoRTH draft of August 2026 also ties the low-speed exemption to AIS-049 safety checks by an authorized testing agency. Lead-acid battery systems therefore lose share each year, while lithium-ion systems keep their lead and pack makers add battery management features to protect against short circuits and overcharging.
Why are campus and corporate fleets rising?
Campus and corporate fleets are rising as a sales channel, because large employers, colleges and gated communities need short internal trips without cars. Radboards showed a foldable e-kick scooter at the 27th Bengaluru Tech Summit in November 2024, with a range of 25 to 30 km per charge. The company said it had sold units in Bengaluru, Mumbai and Delhi and to various companies. India's urban population share rose from 32.5% in 2015 to 35.7% in 2025, which adds dense campuses and business parks. As a result, campus and corporate mobility grows fastest by application at 22.11% a year, alongside shared micromobility platforms.
Can domestic D2C brands open new demand?
Domestic brands that sell direct have a clear opening, because they can offer local service, spare parts and faster repairs than many imported models. Gleev Motors, founded in 2021 and based in Greater Noida, sold its Protos folding model with a 250 W motor, a 25 km/h top speed and a range of up to 55 km. The Protos was priced at Rs 44,444 with free delivery in NCR in 2022. HUSE Mobility also said in August 2022 that it planned to localize Segway-Ninebot technology and launch its own-brand products. Therefore, brand D2C websites grow fastest by channel at 22.13% a year, as local brands build service networks city by city.
Will lower-cost commuter models widen the buyer base?
Lower-cost commuter models offer a second opening, because subsidized registered electric two-wheelers set a price reference that kick scooters must beat. The PM E-DRIVE subsidy for electric two-wheelers was extended in August 2026 to March 31, 2028, at Rs 2,500 per kWh, capped at Rs 5,000 per vehicle. The subsidy covers vehicles registered from April 1, 2025, and models with an ex-factory price of up to Rs 1.5 lakh. Because low-speed kick scooters are exempt from registration, they compete on purchase price and running cost without that support. In turn, folding commuter scooters keep 46.0% of 2025 value, as students and young professionals look for low-cost daily transport.
Riding rules, imports and battery safety weigh on growth
How do unclear riding rules limit everyday use?
Unclear riding rules limit everyday use, because many cities do not say where stand-up scooters may ride, park or charge. Riders often share crowded roads with buses and motorcycles, since few cities have protected cycle lanes. As a result, parents, employers and campuses may hesitate to approve scooters for daily trips. Clear city guidelines, helmet advice and designated parking near stations would reduce this risk and help both brands and riders.
Why does import dependence raise costs?
Import dependence raises costs, because India relies heavily on imported battery materials and components, mainly from China and Hong Kong. Currency swings, freight delays and duty changes can therefore lift landed costs for cells, motors and controllers. Smaller brands that buy in low volumes feel these changes first. In turn, local cell plants and lower duties on battery inputs should ease the problem over time, although supply chains will take years to shift.
How do battery safety and after-sales gaps weigh on trust?
Battery safety and after-sales gaps weigh on trust, because low-cost packs without proper testing can overheat or fail early. Many online buyers also find it hard to get spare parts, tire repairs or battery replacements outside large cities. Consequently, some buyers stay with bicycles or public transport instead. Certified packs, clear warranties and partnerships with local repair shops help brands reduce returns and build repeat demand.
Will heat, monsoon rain and road quality limit riding?
Heat, monsoon rain and poor road surfaces limit riding, because small wheels and open decks suit dry, smooth paths best. Potholes, waterlogging and steep ramps can damage scooters and raise the risk of falls. Therefore, many riders use their scooters for only part of the year, which slows replacement demand. Larger pneumatic tires, sealed electronics and stronger brakes help brands extend the riding season and reduce warranty claims.
South India leads while North India grows fastest
| Region | Value, 2025 (USD million) | Share, 2025 | CAGR, 2026–2035 |
|---|---|---|---|
| South India | 6.6 | 32.2% | 21.09% |
| North India | 5.8 | 28.4% | 21.79% |
| West India | 4.7 | 23.1% | 20.89% |
| East and Northeast India | 3.3 | 16.3% | 21.49% |
How do southern tech cities keep the south ahead?
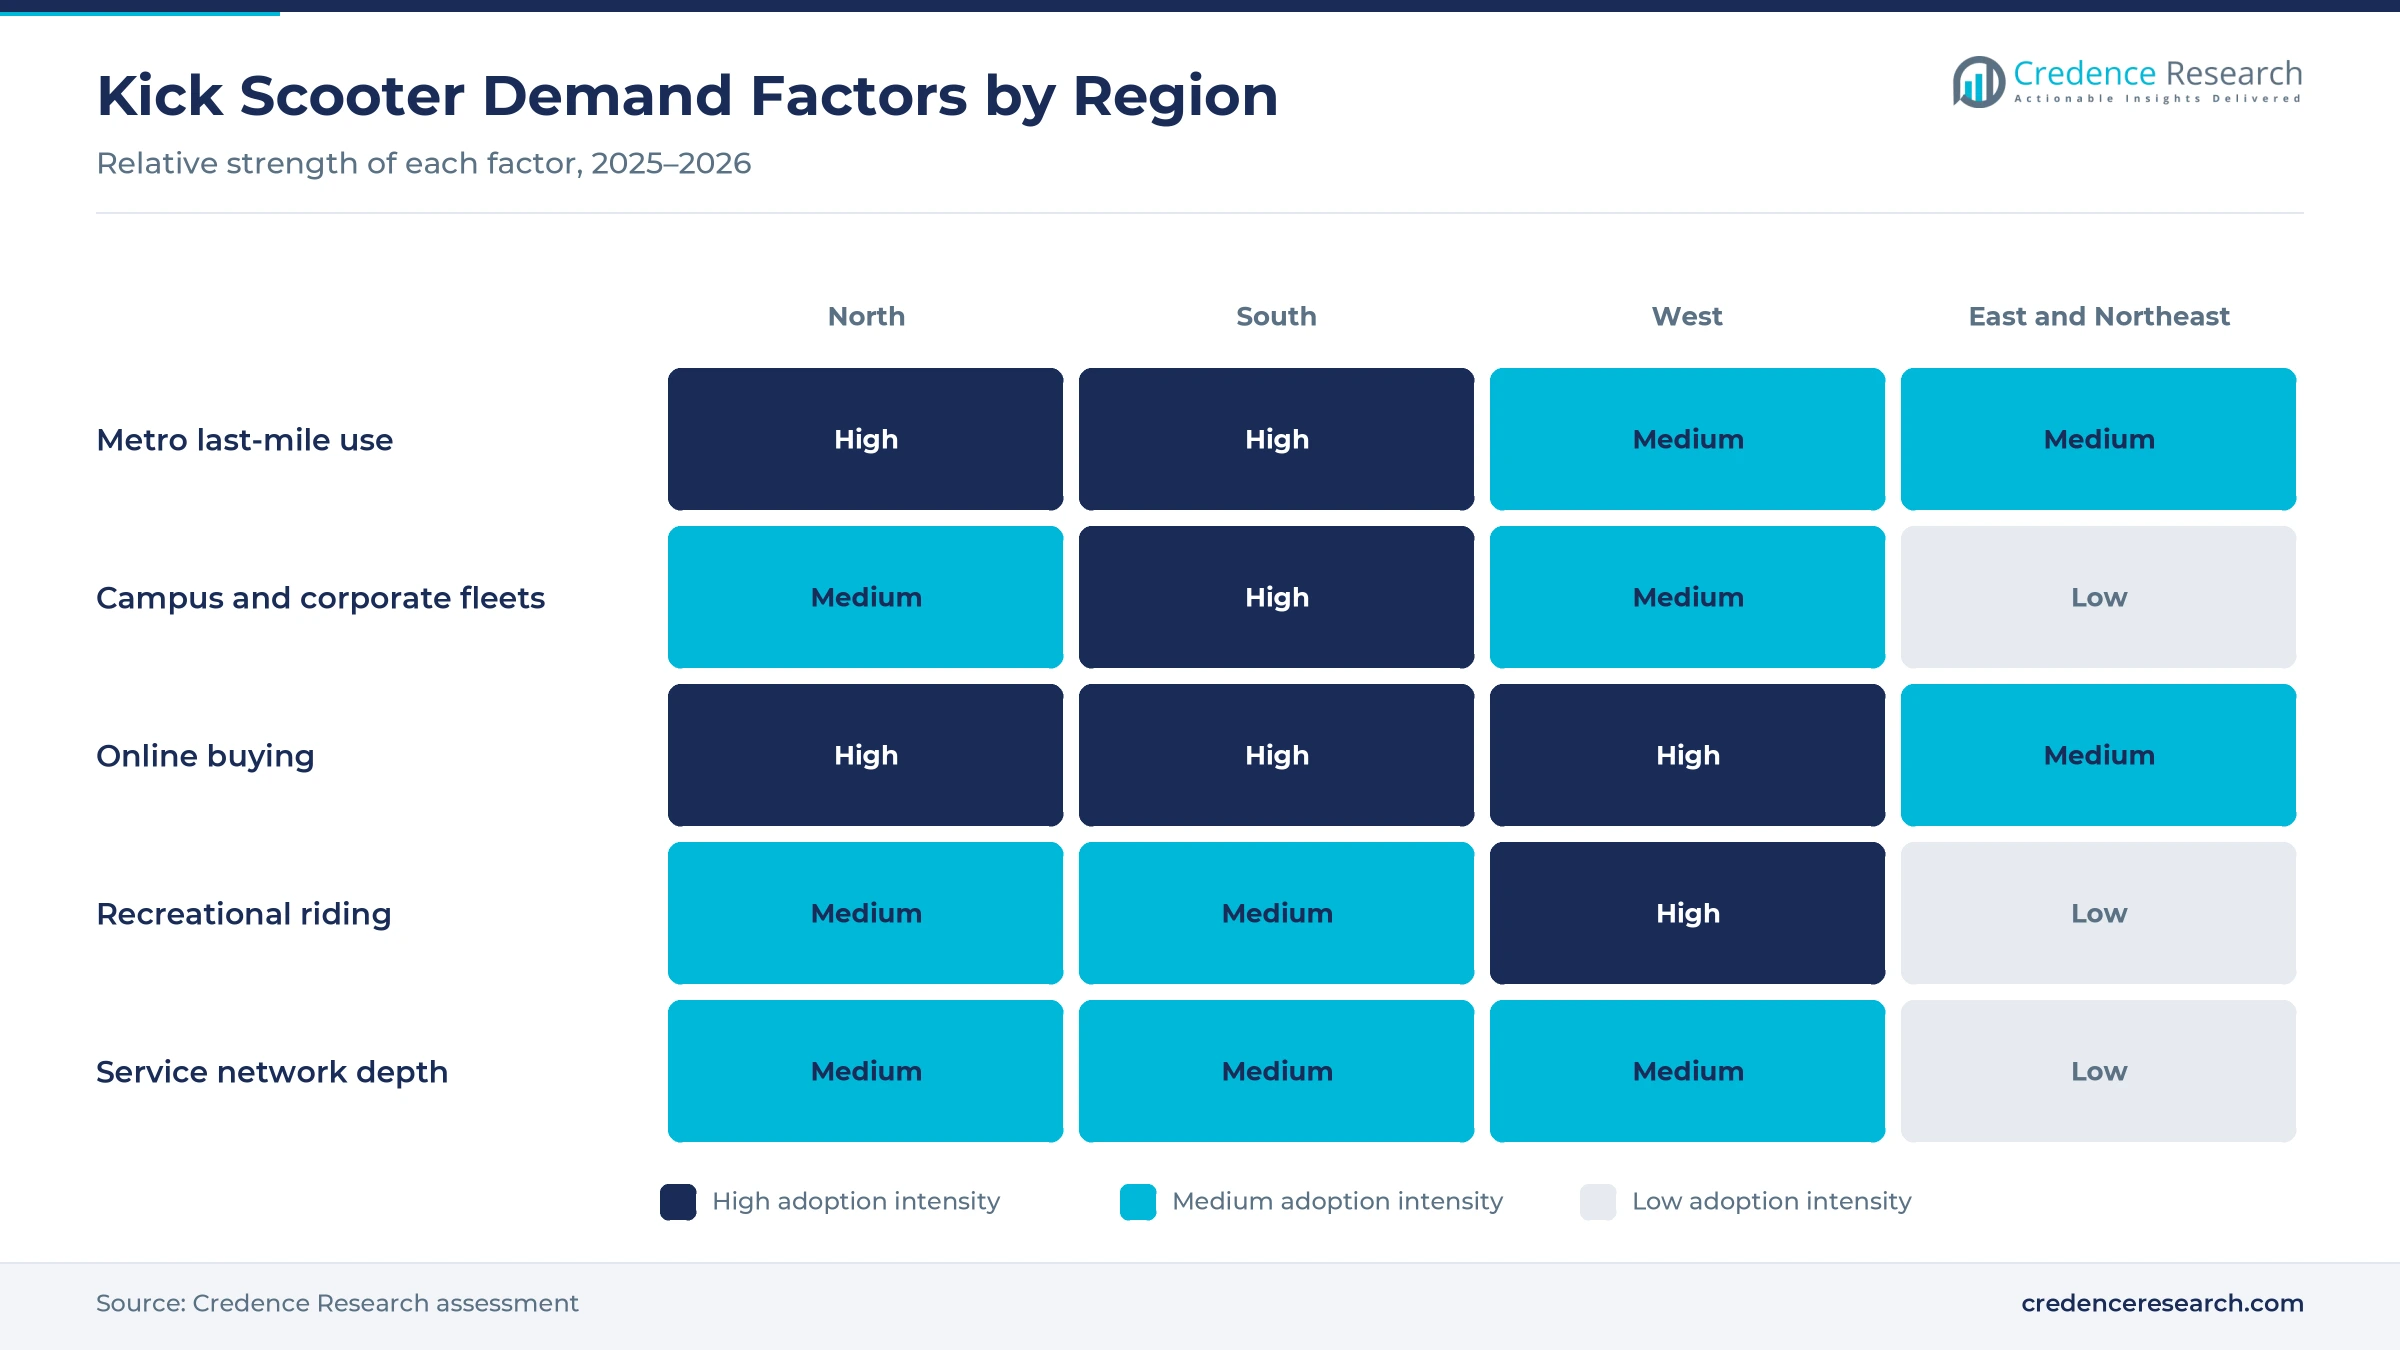
South India is the largest region, with 32.2% of 2025 kick scooter demand. The region grows at 21.09% a year, because Bengaluru, Chennai and Hyderabad combine metro services with large technology and college campuses. Radboards unveiled its foldable e-kick scooter at the Bengaluru Tech Summit in November 2024 and reported sales in the city. Southern buyers also order heavily online, which suits brands that sell through marketplaces and their own websites. As a result, South India leads in both commuter and campus use.
Why is North India the fastest-growing region?
North India held 28.4% of 2025 kick scooter demand, the second-largest regional share. The region grows fastest at 21.79% a year, because Delhi NCR has metro services and the 55 km Delhi–Meerut RRTS line, plus dense office districts. Gleev Motors, based in Greater Noida, sells folding models with free delivery in NCR. Large cities in Uttar Pradesh, Punjab and Haryana also add college and office demand. Therefore, northern demand mixes daily station trips with campus and recreational riding.
How do western cities add commuter and leisure riders?
West India held 23.1% of 2025 kick scooter demand, a share driven by large coastal cities. The region grows at 20.89% a year, because Mumbai, Pune and Ahmedabad have metro services and dense urban populations. Radboards reported sales in Mumbai, while online marketplaces deliver imported and domestic models across Maharashtra and Gujarat. Short trips along seafronts, campuses and gated communities also support recreational demand. In turn, the region balances commuter use with leisure riding.
Can East and Northeast India open new demand?
East and Northeast India held 16.3% of 2025 kick scooter demand, the smallest regional share. The region grows at 21.49% a year, because Kolkata has metro services and growing college populations. Smaller cities in the region rely more on online marketplaces, since few specialist retailers operate there.
Battery incentives, safety rules and new models
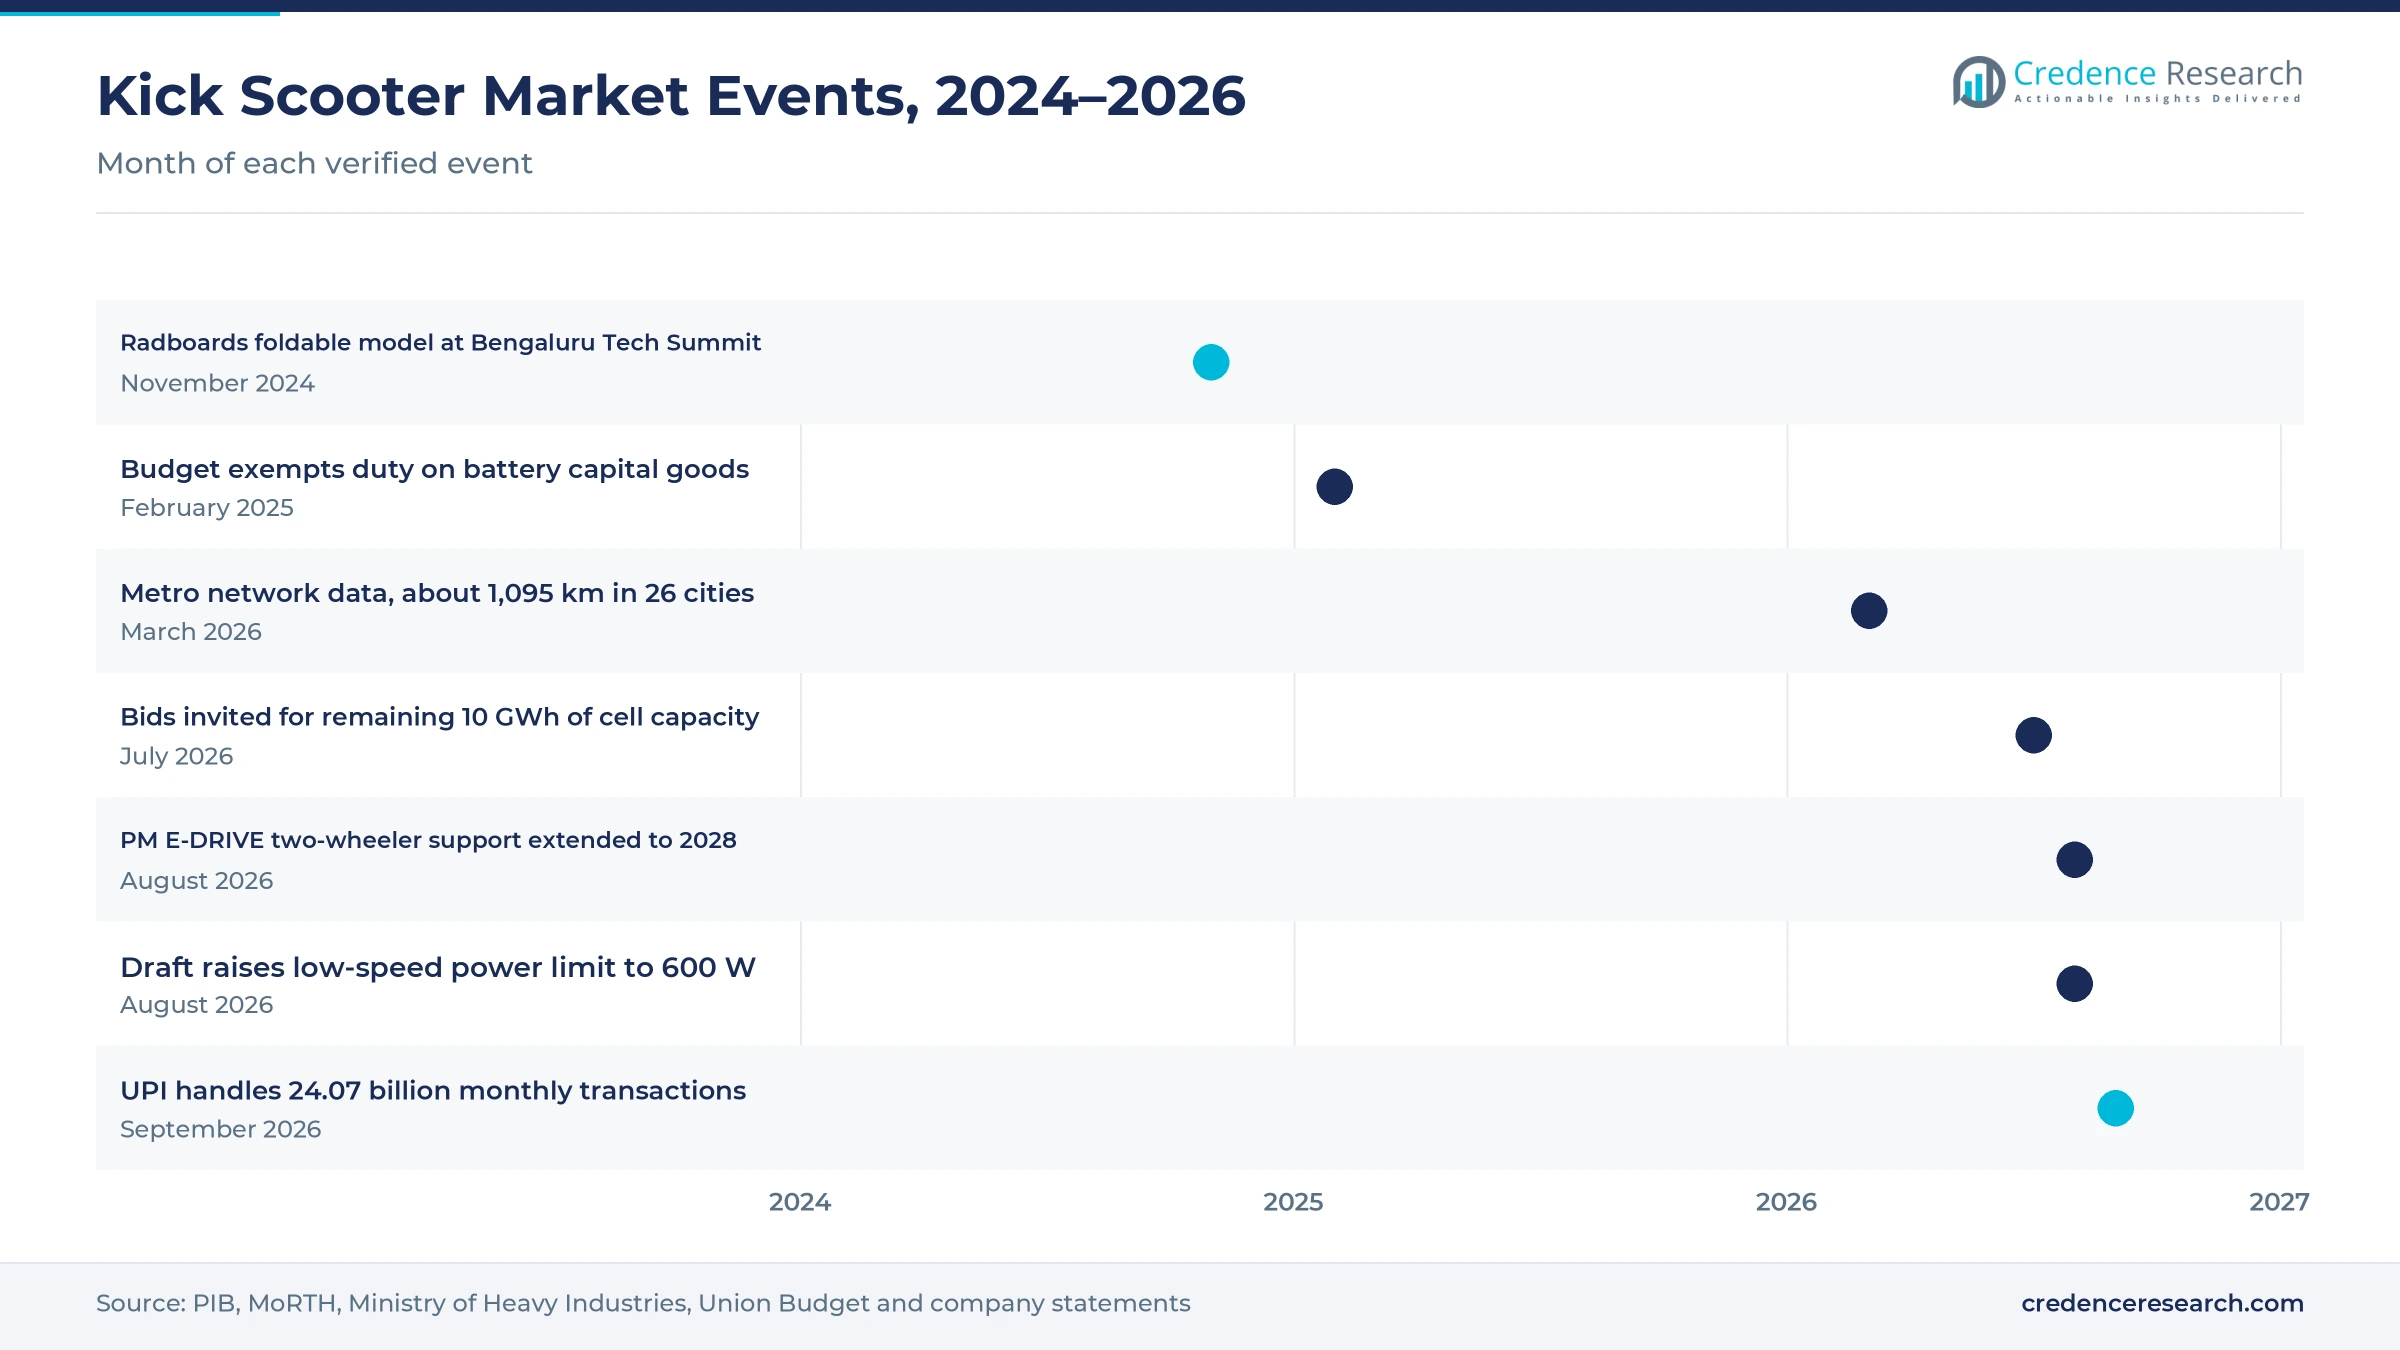
| Development | Status and market relevance |
|---|---|
| In November 2024, Radboards unveiled a foldable e-kick scooter at the 27th Bengaluru Tech Summit. | Range of 25 to 30 km; sold in Bengaluru, Mumbai and Delhi |
| In February 2025, the Union Budget proposed exempting basic customs duty on 35 more capital goods for EV battery manufacturing. | Lowers costs for local battery assembly |
| In July 2026, the Ministry of Heavy Industries invited bids for the remaining 10 GWh under the advanced chemistry cell scheme. | 40 GWh of the 50 GWh target already awarded |
| In August 2026, the government extended PM E-DRIVE support for electric two-wheelers to March 31, 2028. | Covers registered vehicles; sets a price reference for low-speed models |
| In August 2026, MoRTH issued a draft to raise the power limit for exempt low-speed vehicles from 250 W to 600 W. | Expected from Oct. 1, 2026; 25 km/h cap unchanged |
Lithium-ion packs, stronger motors and apps change models
- Lithium-ion packs with battery management systems protect against short circuits, overcurrent and overcharging, which helps brands meet AIS-156 and IS 17855 requirements.
- Higher-power hub motors of up to 600 W, if the August 2026 draft is adopted, would help riders climb ramps and flyovers while keeping the 25 km/h speed cap.
- Domestic cell supply from advanced chemistry cell plants should lower the cost of lithium-ion cells and shorten delivery times for replacement packs.
- Connected apps and UPI checkout let riders lock scooters, track rides and pay for parts or service in one step from their phones.
Need a Custom Version of This Report?
Tailor the scope, geography, or segments to your exact requirements.
- Custom geography or segment scope
- Direct access to our analyst team
Domestic startups and global brands compete online
Competition mixes domestic startups that sell direct with global brands that reach buyers through importers and online marketplaces. Radboards, based in Karnataka, showed a foldable model at the Bengaluru Tech Summit in 2024 and sells to riders and companies in Bengaluru, Mumbai and Delhi. Gleev Motors, founded in 2021 in Greater Noida, sells the Protos folding model with a 250 W motor and up to 55 km of range. Segway-Ninebot products reach Indian buyers through HUSE Mobility, which sells them on its website, Amazon and Flipkart. Other international brands such as Xiaomi, NIU, NAVEE, EMOVE and Razor are listed for this market, although their direct presence in India could not be confirmed. Companies compete on price, range, weight, service networks and certified batteries, while some also sell e-bikes to the same riders.
Companies profiled and their roles in this market
| Company | Type | Role in the market |
|---|---|---|
| Radboards | Domestic company (Karnataka) | Foldable e-kick scooter with 25 to 30 km range; sold to riders and companies |
| Gleev Motors | Domestic company (Greater Noida) | Protos folding model, 250 W motor, 25 km/h top speed, up to 55 km range |
| Segway-Ninebot | International brand | Sold in India by HUSE Mobility through its website, Amazon and Flipkart |
Credence Research view on last-mile and campus demand
Credence Research's view is that the India electric kick scooter market will grow from a small base into a steady last-mile category by 2035, as metro networks expand and campuses add internal fleets. The August 2026 draft rule, if adopted, would give brands more room to fit stronger motors without losing the registration exemption. Local cell plants and lower duties on battery inputs should also ease costs. However, unclear city riding rules and weak after-sales service will hold back adoption outside large cities.
How the low-speed scooter spending estimate was built
The report uses 2025 as the base year, with values in USD million at current prices. Market values come from the Credence Research model, which combines urban commuter numbers, campus and fleet demand, unit sales and average prices by type. Regional shares are those set for this report, and segment splits by product type, application, technology and channel are Credence Research estimates. Sources used are government factsheets, draft rules, World Bank data, telecom and payments data, company statements and news reports, and no interviews or surveys were used.
Transit links and campus fleets set the path to 2035
The market is expected to reach USD 176.3 million by 2035, a 21.31% CAGR during 2026–2035, as metro riders, students and campus fleets adopt folding and performance scooters. Growth should be strongest in North India and in campus and corporate mobility, while South India keeps the largest share. Domestic cell supply and clearer low-speed vehicle rules should support better and safer models. In contrast, battery safety problems or strict city limits on where scooters may ride would slow adoption and hurt smaller brands.
Frequently Asked Questions
How big is the India electric kick scooter market?
Which region leads kick scooter sales in India?
Which region grows fastest?
Do kick scooters need registration in India?
Which product type holds the largest share?
Which application grows fastest?
Who are the leading kick scooter companies in India?
What are the main risks to growth?
Table of Content
Chapter 1 Market Segmentation
- 1.1 Segmentation Framework
- 1.1.1 Product and Service Classification
- 1.1.2 Application and End-Use Classification
- 1.1.3 Technology and Solution Classification
- 1.1.4 Customer and Distribution Channel Classification
- 1.1.5 Geographic Segmentation
- 1.1.6 Market Segment Definitions and Boundaries
- 1.2 By Product Type
- 1.2.1 Folding Commuter Scooters
- 1.2.2 Fixed-Frame Performance Scooters
- 1.2.3 Compact Recreational Scooters
- 1.2.4 Three-Wheel Stability Scooters
- 1.3 By Application
- 1.3.1 First and Last-Mile Commuting
- 1.3.2 Campus and Corporate Mobility
- 1.3.3 Recreation and Fitness
- 1.3.4 Short-Distance Errands
- 1.4 By Technology
- 1.4.1 Lithium-Ion Battery Systems
- 1.4.2 Lead-Acid Battery Systems
- 1.4.3 Emerging Battery Chemistries
Chapter 2 Introduction
- 2.1 Report Objectives and Scope
- 2.2 Product Definition and Industry Terminology
- 2.3 Market Inclusions and Exclusions
- 2.4 Research Process
- 2.4.1 Primary Research and Expert Interviews
- 2.4.2 Secondary Research and Source Review
- 2.4.3 Top-Down and Bottom-Up Estimation
- 2.4.4 Data Triangulation and Verification
- 2.5 Market Size Measurement Basis
- 2.5.1 2025: USD 20.5 million → 2035: USD 176.3 million
- 2.6 Historical and Forecast Reference Periods
- 2.6.1 Historical Period: 2018-2025
- 2.6.2 Base Year: 2025
- 2.6.3 Forecast Period: 2025-2035
- 2.7 Research Assumptions and Limitations
Chapter 3 Executive Summary
- 3.1 Market Snapshot and Key Findings
- 3.2 Base-Year Market Size, 2025
- 3.3 Forecast Market Size, 2035
- 3.4 Revenue and Volume Growth Outlook
- 3.5 Key Demand and Supply Indicators
- 3.6 Leading Market Segments
- 3.7 Fastest-Growing Market Opportunities
- 3.8 Regional Performance Highlights
- 3.9 Technology and Industry Transformation
- 3.10 Competitive Landscape Summary
- 3.11 Analyst View and Strategic Implications
Chapter 4 India Electric Kick Scooter Market Trends and Developments
- 4.1 Historical Industry Development, 2018-2025
- 4.2 Recent Market Trends and Developments
- 4.3 Demand and Customer Behavior Trends
- 4.4 Technology and Product Innovation
- 4.5 Artificial Intelligence, Automation and Digitalization
- 4.6 Local Manufacturing and Supply Chain Realignment
- 4.7 Industry Partnerships, Mergers and Acquisitions
- 4.8 Sustainability and Circular Economy Developments
- 4.9 Government and Private Sector Investment Trends
- 4.10 Emerging Business Models and Commercialization
- 4.11 Industry Developments and Announcements
Chapter 5 India Electric Kick Scooter Market Production, Supply and Demand Analysis
- 5.1 Demand Trend and Consumption Analysis, 2018-2025
- 5.2 Demand Forecast, 2025-2035
- 5.3 Production and Output Trend, 2018-2025
- 5.4 Production and Output Forecast, 2025-2035
- 5.5 Installed Capacity and Capacity Utilization
- 5.6 Company-Wise Production Plants and Statistics
- 5.6.1 Installed Production Capacity
- 5.6.2 Actual Production
- 5.6.3 Planned Capacity and Expansion Targets
- 5.7 Supply Chain Structure and Procurement Trends
- 5.8 Supply-Demand Gap and Bottlenecks
- 5.9 Import Dependence and Sourcing Structure
- 5.10 Contract Manufacturing and Outsourcing
- 5.11 Regional Supply and Demand Concentration
Chapter 6 India Electric Kick Scooter Market Pricing Analysis
- 6.1 Pricing Structure and Measurement
- 6.2 Historical Pricing Trends, 2018-2025
- 6.3 Pricing Outlook, 2025-2035
- 6.4 Average Selling Price and Unit Economics
- 6.5 Pricing by Product and Market Segment
- 6.6 Geographic Pricing Differences
- 6.7 Key Input, Energy, Labor and Logistics Costs
- 6.8 Contract Pricing and Purchasing Models
- 6.9 Pricing Sensitivity and Competitive Positioning
- 6.10 Price, Margin and Profitability Implications
Chapter 7 India Electric Kick Scooter Market Dynamics
- 7.1 Market Growth Drivers
- 7.1.1 Demand-Side Drivers
- 7.1.2 Technology and Innovation Drivers
- 7.1.3 Infrastructure and Investment Drivers
- 7.1.4 Regulatory and Policy Drivers
- 7.2 Market Restraints
- 7.2.1 Cost and Affordability Constraints
- 7.2.2 Technology and Adoption Barriers
- 7.2.3 Supply Chain and Operational Constraints
- 7.3 Market Challenges
- 7.3.1 Competitive Pressure and Margin Erosion
- 7.3.2 Skills, Infrastructure and Implementation Gaps
- 7.4 Emerging Market Opportunities
- 7.5 Market Dynamics Impact and Time-Horizon Assessment
Chapter 8 India Electric Kick Scooter Value Chain Analysis
- 8.1 Industry Value Chain Overview
- 8.2 Upstream Suppliers and Critical Inputs
- 8.3 Technology and Component Providers
- 8.4 Manufacturing or Service Delivery
- 8.5 Distribution, Channel Partners and Integrators
- 8.6 Downstream Applications and End Users
- 8.7 Value Addition and Profit Pools
- 8.8 Vertical Integration and Outsourcing
- 8.9 Supplier Concentration and Risk
- 8.10 Supply Chain Localization and Resilience
Chapter 9 India Electric Kick Scooter Market Regulations and Policies
- 9.1 Relevant Laws, Standards and Compliance Frameworks
- 9.2 Product, Service, Safety and Quality Requirements
- 9.3 Government Policies, Incentives and Subsidies
- 9.4 Imports, Exports and Trade Barriers
- 9.5 Public Procurement and Local Content Requirements
- 9.6 Environmental and Sustainability Compliance
- 9.7 Upcoming Policy Changes and Market Implications
Chapter 10 India Electric Kick Scooter Market Hotspots and Opportunities
- 10.1 Market Opportunity Mapping and Growth Hotspots
- 10.2 High-Growth Applications and Customer Groups
- 10.3 Underserved Markets and White-Space Opportunities
- 10.4 Emerging Technology and Product Opportunities
- 10.5 New Capacity and Investment Hotspots
- 10.6 Market Entry and Expansion Opportunities
- 10.7 Distribution and Partnership Opportunities
- 10.8 Near-Term and Long-Term Commercial Potential
- 10.9 Opportunity Attractiveness and Execution Risks
Chapter 11 India Electric Kick Scooter Market Outlook, 2025-2035
- 11.1 Market Size and Analysis
- 11.1.1 Revenue (Market Measurement: 2025: USD 20.5 million → 2035: USD 176.3 million)
- 11.1.2 Market Volume and Quantity Sold
- 11.1.3 Historical Market Size, 2018-2025
- 11.1.4 Base-Year Market Size, 2025
- 11.2 Market Forecast, 2025-2035
- 11.2.1 Revenue Forecast to 2035
- 11.2.2 Volume Forecast to 2035
- 11.2.3 CAGR and Year-on-Year Growth
- 11.2.4 Incremental Revenue Opportunity
- 11.3 Forecast Assumptions and Scenario Analysis
- 11.3.1 Base-Case Forecast
- 11.3.2 Optimistic and Conservative Scenarios
- 11.3.3 Technology, Pricing and Policy Sensitivities
- 11.4 Market Attractiveness and Growth Outlook
Chapter 12 India Electric Kick Scooter Market Segmentation and Outlook
- 12.1 Segmentation Summary and Market Shares, 2025
- 12.2 Largest and Fastest-Growing Segments
- 12.3 By Product Type - Market Size and Forecast, 2025-2035
- 12.3.1 Segment Definition and Scope
- 12.3.2 Historical Market Size, 2018-2025
- 12.3.3 Revenue Forecast, 2025-2035
- 12.3.4 Volume Forecast, 2025-2035
- 12.3.5 Base-Year Market Share, 2025
- 12.3.6 Segment CAGR and Growth Drivers
- 12.3.7 Subsegment Market Size and Forecast
- 12.3.7.1 Folding Commuter Scooters
- 12.3.7.2 Fixed-Frame Performance Scooters
- 12.3.7.3 Compact Recreational Scooters
- 12.3.7.4 Three-Wheel Stability Scooters
- 12.3.8 Subsegment Pricing and Adoption Trends
- 12.3.9 Leading Suppliers and Competition
- 12.3.10 Regional Demand and Opportunities
- 12.4 By Application - Market Size and Forecast, 2025-2035
- 12.4.1 Segment Definition and Scope
- 12.4.2 Historical Market Size, 2018-2025
- 12.4.3 Revenue Forecast, 2025-2035
- 12.4.4 Volume Forecast, 2025-2035
- 12.4.5 Base-Year Market Share, 2025
- 12.4.6 Segment CAGR and Growth Drivers
- 12.4.7 Subsegment Market Size and Forecast
- 12.4.7.1 First and Last-Mile Commuting
- 12.4.7.2 Campus and Corporate Mobility
- 12.4.7.3 Recreation and Fitness
- 12.4.7.4 Short-Distance Errands
- 12.4.8 Subsegment Pricing and Adoption Trends
- 12.4.9 Leading Suppliers and Competition
- 12.4.10 Regional Demand and Opportunities
- 12.5 By Technology - Market Size and Forecast, 2025-2035
- 12.5.1 Segment Definition and Scope
- 12.5.2 Historical Market Size, 2018-2025
- 12.5.3 Revenue Forecast, 2025-2035
- 12.5.4 Volume Forecast, 2025-2035
- 12.5.5 Base-Year Market Share, 2025
- 12.5.6 Segment CAGR and Growth Drivers
- 12.5.7 Subsegment Market Size and Forecast
- 12.5.7.1 Lithium-Ion Battery Systems
- 12.5.7.2 Lead-Acid Battery Systems
- 12.5.7.3 Emerging Battery Chemistries
- 12.5.8 Subsegment Pricing and Adoption Trends
- 12.5.9 Leading Suppliers and Competition
- 12.5.10 Regional Demand and Opportunities
- 12.6 Segment Growth Comparison
- 12.7 Segment Attractiveness and Priority Matrix
Chapter 13 India Electric Kick Scooter End-Use and Application Market Outlook
- 13.1 End-Use Industry and Customer Demand Structure
- 13.2 Leading Applications and Customer Groups
- 13.3 End-Use Market Size, Share and Forecast
- 13.4 Major End-Use Industry Deep Dives
- 13.4.1 Customer Requirements and Use Cases
- 13.4.2 Demand and Replacement Cycles
- 13.4.3 Technical and Regulatory Considerations
- 13.4.4 Purchasing and Procurement Models
- 13.4.5 Leading Vendors and Distribution Channels
- 13.4.6 Forecast and Commercial Opportunities
- 13.5 Emerging Applications and Cross-Segment Demand
- 13.6 End-Use Industry Investment Priorities
Chapter 14 India Electric Kick Scooter Geographic Market Outlook, 2025-2035
- 14.1 Regional Market Size and Country-Level Shares, 2025
- 14.2 Country Market Size Comparison, 2025
- 14.3 Country Market Forecasts, 2025-2035
- 14.4 Subregional Industrial and Demand Clusters
- 14.5 Intra-Regional Pricing and Cost Differences
- 14.6 Cross-Border Trade and Supply Networks
- 14.7 Regional Supply and Demand Balances
- 14.8 Country Opportunity Comparison and Prioritization
Note: Every listed country is covered on the structure shown under the first country.
Chapter 15 India Electric Kick Scooter Technology, Innovation and Sustainability Outlook
- 15.1 Technology Landscape and Maturity
- 15.2 Product, Process and Service Innovation
- 15.3 AI, Automation and Digital Tools in the Industry
- 15.4 Technology Adoption and Performance Benchmarking
- 15.5 Innovation Pipeline and R&D Investment
- 15.6 Patent and Intellectual Property Trends
- 15.7 Energy Efficiency and Resource Management
- 15.8 Sustainability, Recycling and Circularity
- 15.9 Technology Roadmap, 2025-2035
- 15.10 Risks of Obsolescence and Technology Substitution
Chapter 16 India Electric Kick Scooter Market Key Strategic Imperatives
- 16.1 Growth and Market Entry Priorities
- 16.2 High-Return Products and Segments
- 16.3 Pricing, Profitability and Cost Optimization
- 16.4 Technology Investment and Product Differentiation
- 16.5 Supply Chain Localization and Resilience
- 16.6 Distribution and Customer Acquisition
- 16.7 Partnership, Acquisition and Capacity Strategy
- 16.8 Regional Expansion Priorities
- 16.9 Short-, Medium- and Long-Term Actions
Chapter 17 Competition Outlook
- 17.1 Industry Competition Characteristics
- 17.2 Market Structure and Concentration
- 17.3 Market Share and Competitive Positioning, 2025
- 17.4 Company-Wise Revenue and Product Benchmarking
- 17.5 Production and Service Capacity Benchmarking
- 17.6 Technology, Pricing and Differentiation
- 17.7 Regional Footprint and Distribution Strength
- 17.8 Mergers, Acquisitions and Strategic Alliances
- 17.9 New Entrants and Competitive Threats
- 17.10 Porter's Five Forces and Industry Attractiveness
- 17.11 Competitive Outlook, 2025-2035
Chapter 18 Company Profiles
- 18.1 Company Coverage and Selection Criteria
- 18.2 GSC Electronics Pvt. Ltd. (Tygatec)
- 18.2.1 Business Description
- 18.2.2 Company Ownership and Geographic Presence
- 18.2.3 Product and Service Portfolio
- 18.2.4 Manufacturing and Operating Footprint
- 18.2.5 Production Capacity and Expansion Plans
- 18.2.6 Financial Performance and Investment
- 18.2.7 Market Share and Competitive Position
- 18.2.8 Technology and Innovation Capabilities
- 18.2.9 Strategic Alliances or Partnerships
- 18.2.10 Recent Developments
- 18.2.11 Growth Strategy and Outlook
- 18.3 Radboards
- 18.4 Gleev Motors
- 18.5 Segway-Ninebot
- 18.6 NIU Technologies
- 18.7 Xiaomi Corporation
- 18.8 Circooter
- 18.9 VORO MOTORS (EMOVE)
- 18.10 NAVEE Technology
- 18.11 Razor USA LLC
- 18.12 Other Relevant Market Participants
Note: Every listed company is profiled on the structure shown under the first company. The company list is preliminary and may change based on research findings, market developments, data availability and client requirements.
Chapter 19 Disclaimer
- 19.1 Research and Forecast Disclaimer
- 19.2 Data Source and Estimation Limitations
Note: The depth of individual sections depends on data availability for this market. Volume, capacity, trade and other unit-based metrics are included where applicable.

