
Aging vehicles and tough terrain keep parts demand steady
The Australia driveline components market was valued at USD 609.5 million in 2025 and is projected to increase from USD 639.0 million in 2026 to USD 890.8 million by 2035, registering a CAGR of 3.76% during 2026–2035. Demand comes from workshops, dealers, fleet operators and vehicle owners that replace clutches, tailshafts, constant velocity joints, differentials, axles and transfer case parts as vehicles age and work on rough roads. New South Wales and the Australian Capital Territory held the largest regional share, 33.7% in 2025, because the zone has the largest population and registered fleet. Western Australia, South Australia and the Northern Territory form the fastest-growing zone at 4.09% a year, as resource work and population growth add severe-duty vehicles. Repair access also changed when the national information sharing scheme began in July 2022, which lets independent workshops buy the same service data as dealers.
Which driveline parts and buyers does the estimate cover?
The estimate measures the value of replacement and upgrade driveline parts sold for use in Australia, including clutches, flywheels, tailshafts, universal joints, constant velocity joints, axles, differentials, lockers and transfer case parts. Values are stated at the prices that workshops, fleets and owners pay through wholesale, specialist and retail channels across the country.
The estimate excludes parts fitted on new vehicles at the factory, complete gearboxes sold as new units, labor charges and engine parts. The value chain runs from global part makers and local engineering firms through national wholesalers, brand specialists and rebuilders to independent workshops, dealer service bays, fleet depots and owners who fit their own parts.
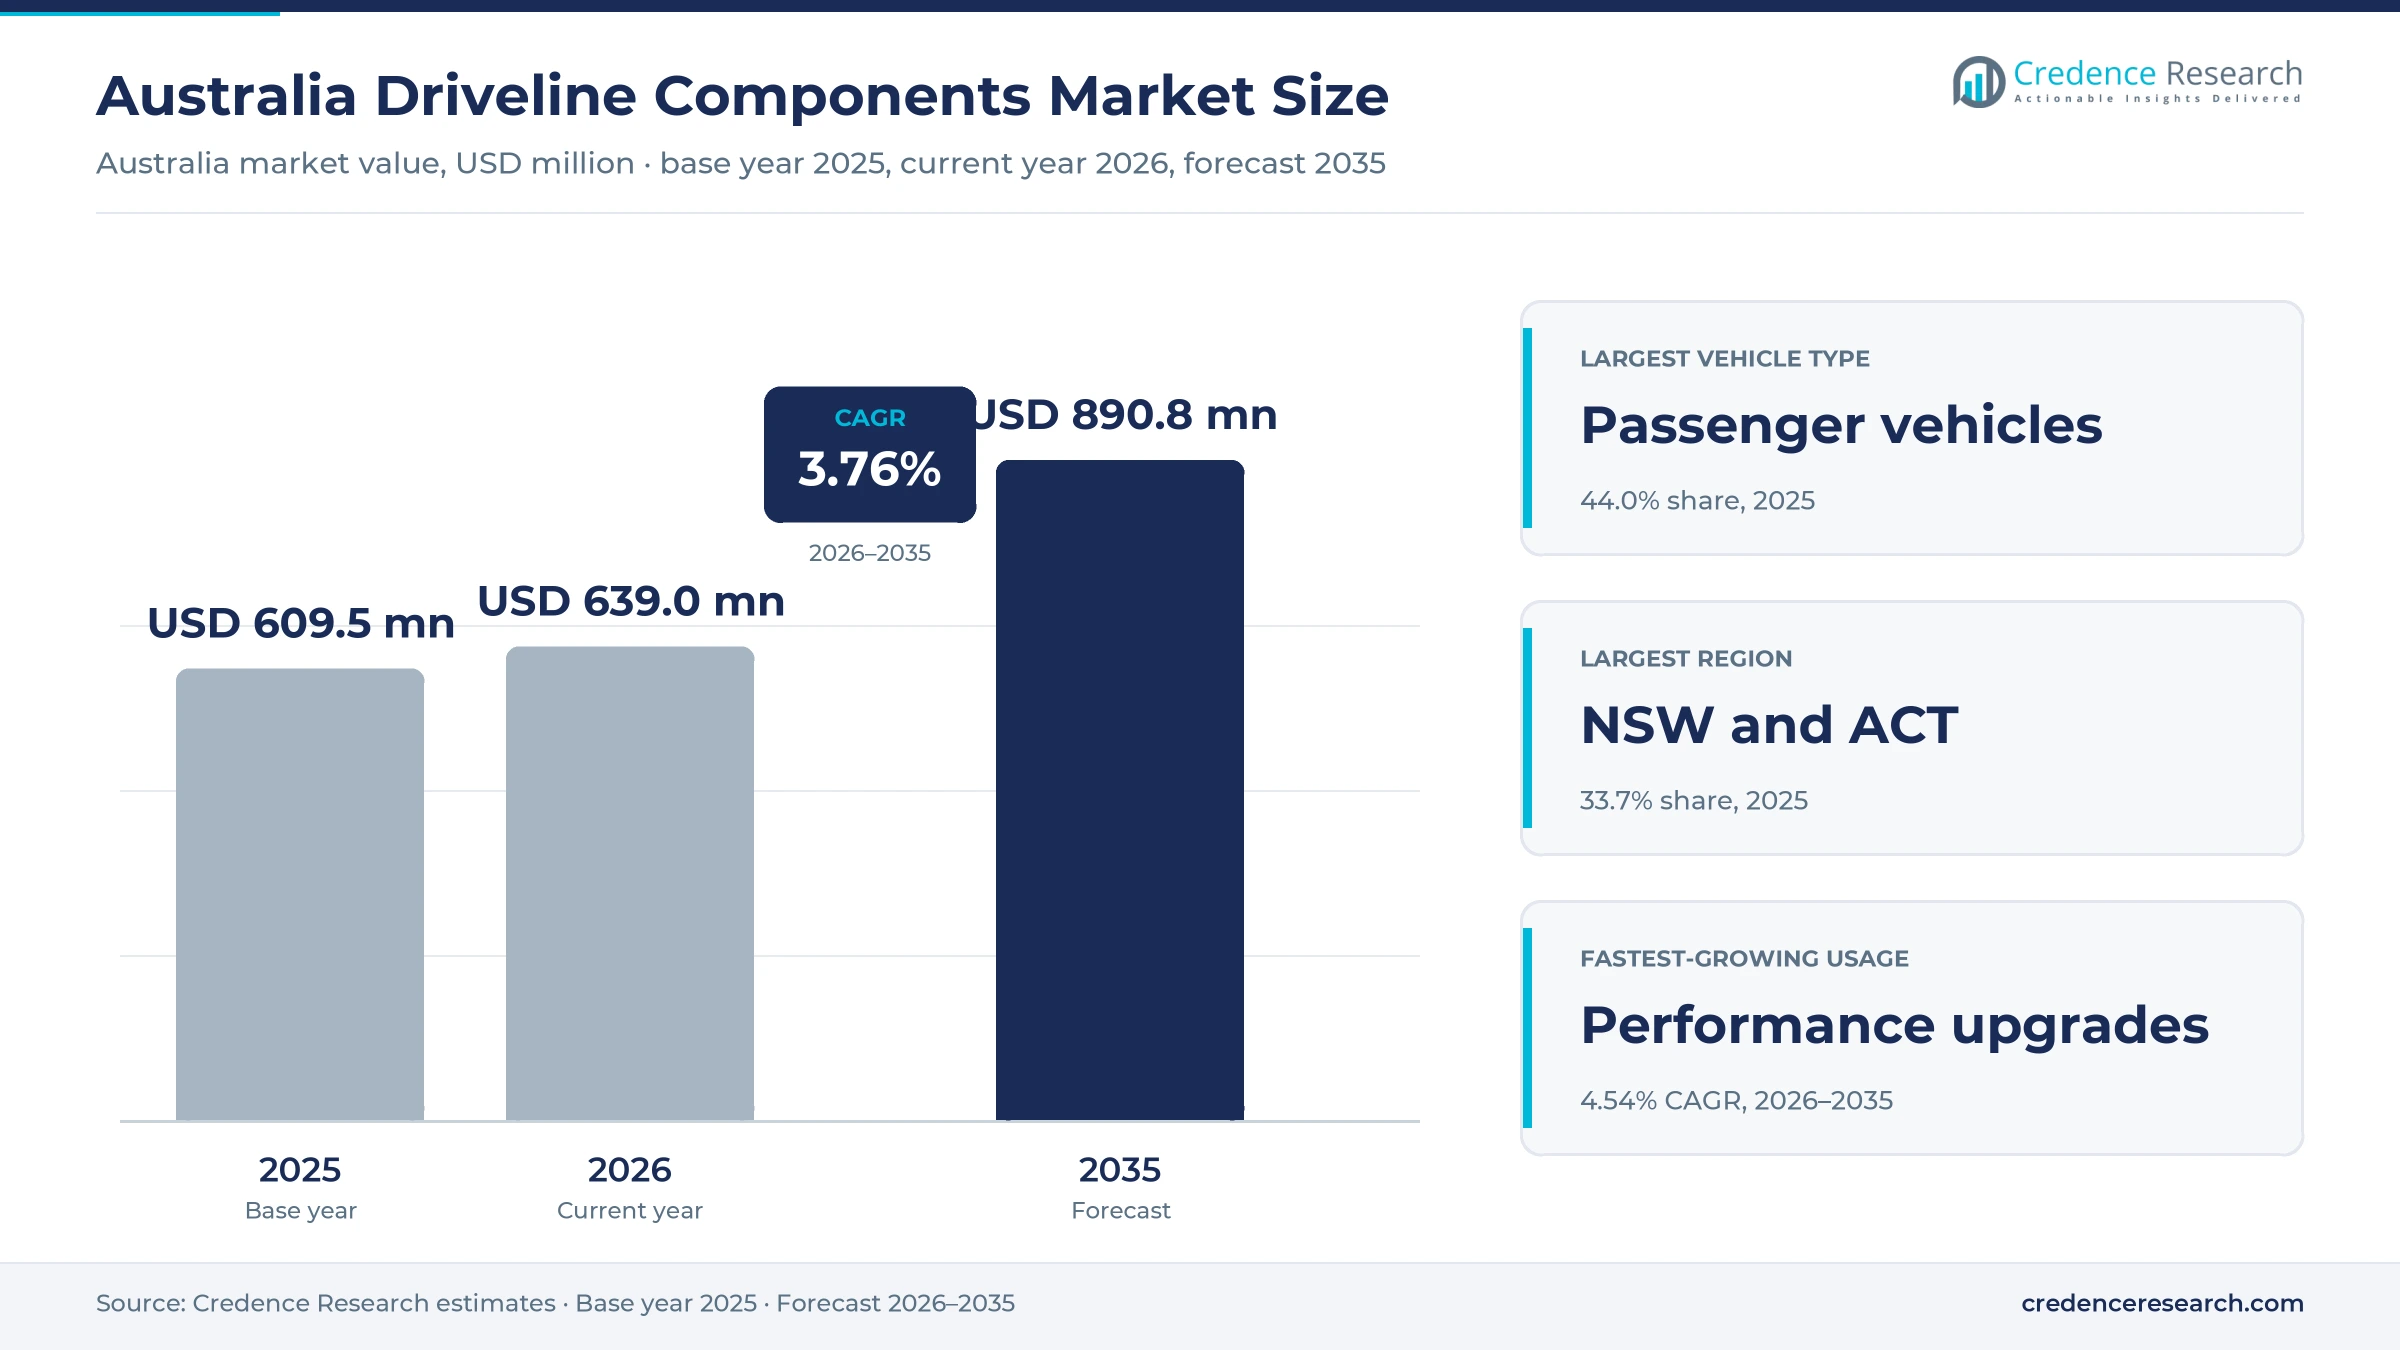
Australia Driveline Components Market Insights
- The Australia driveline components market was valued at USD 609.5 million in 2025 and is projected to reach USD 890.8 million by 2035, registering a CAGR of 3.76% during 2026–2035.
- New South Wales and the Australian Capital Territory held a 33.7% share of 2025 value, because the zone has the largest population and vehicle fleet.
- Passenger vehicles led with a 44.0% share of 2025 value, because cars and SUVs make up most registered vehicles and wear clutches and joints over long service lives.
- The ACCC reported court action against Subaru Australia in August 2026, its first court case under the scheme that gives independent repairers access to service data.
- ARB reported 77 branded stores in its August 2025 annual report and planned three more stores in fiscal 2026, which widens fitting capacity for 4x4 driveline upgrades.
Passenger cars lead while off-highway parts grow fastest
Why do passenger vehicles lead driveline parts demand?
Based on vehicle type, the market is categorized into passenger vehicles, light commercial vehicles, heavy commercial vehicles and off-highway vehicles. Passenger Vehicles led with a 44.0% share of 2025 value, because cars and SUVs dominate the registered fleet and need clutches and joints as they age. Off-Highway Vehicles grow fastest at 4.21% a year, as mines, farms and construction sites run heavy machines hard.
How does the powertrain mix shift parts demand?
Based on powertrain, the market is categorized into combustion only, hybrid electric, plug-in hybrid and battery electric vehicles. Combustion Only led with 86.0% of 2025 value, because petrol and diesel models still make up almost all registered vehicles. Battery Electric grows fastest at 8.55% a year, as newer battery models reach the age at which reduction gears and drive shafts need service.
Why does failure replacement lead usage?
Based on usage type, the market is categorized into scheduled maintenance, failure replacement, overhaul supply and performance upgrades. Failure Replacement led with a 38.0% share of 2025 value, because worn clutches, joints and bearings are usually replaced once they fail. Performance Upgrades grow fastest at 4.54% a year, as 4x4 owners fit lockers and heavy-duty clutches for touring and towing.
How do independent workshops dominate buying?
Based on customer type, the market is categorized into independent workshops, dealer workshops, fleet maintenance buyers and consumer buyers. Independent Workshops led with a 46.0% share of 2025 value, because most vehicles leave dealer service once warranties end. Consumer Buyers grow fastest at 4.02% a year, as owners buy upgrade parts through specialist stores and online retailers.
| Segment Group | Leading Sub-segment | Share, 2025 | Fastest-growing Sub-segment | CAGR, 2026–2035 |
|---|---|---|---|---|
| By Vehicle Type | Passenger Vehicles | 44.0% | Off-Highway Vehicles | 4.21% |
| By Powertrain | Combustion Only | 86.0% | Battery Electric | 8.55% |
| By Usage Type | Failure Replacement | 38.0% | Performance Upgrades | 4.54% |
| By Customer Type | Independent Workshops | 46.0% | Consumer Buyers | 4.02% |
Request a Free Sample
Fill in your details and we'll send you a free sample report.
- Sample data tables & charts
- Research methodology
Fleet age, 4x4 duty and repair access lift parts demand
How does an aging installed fleet lift replacement demand?
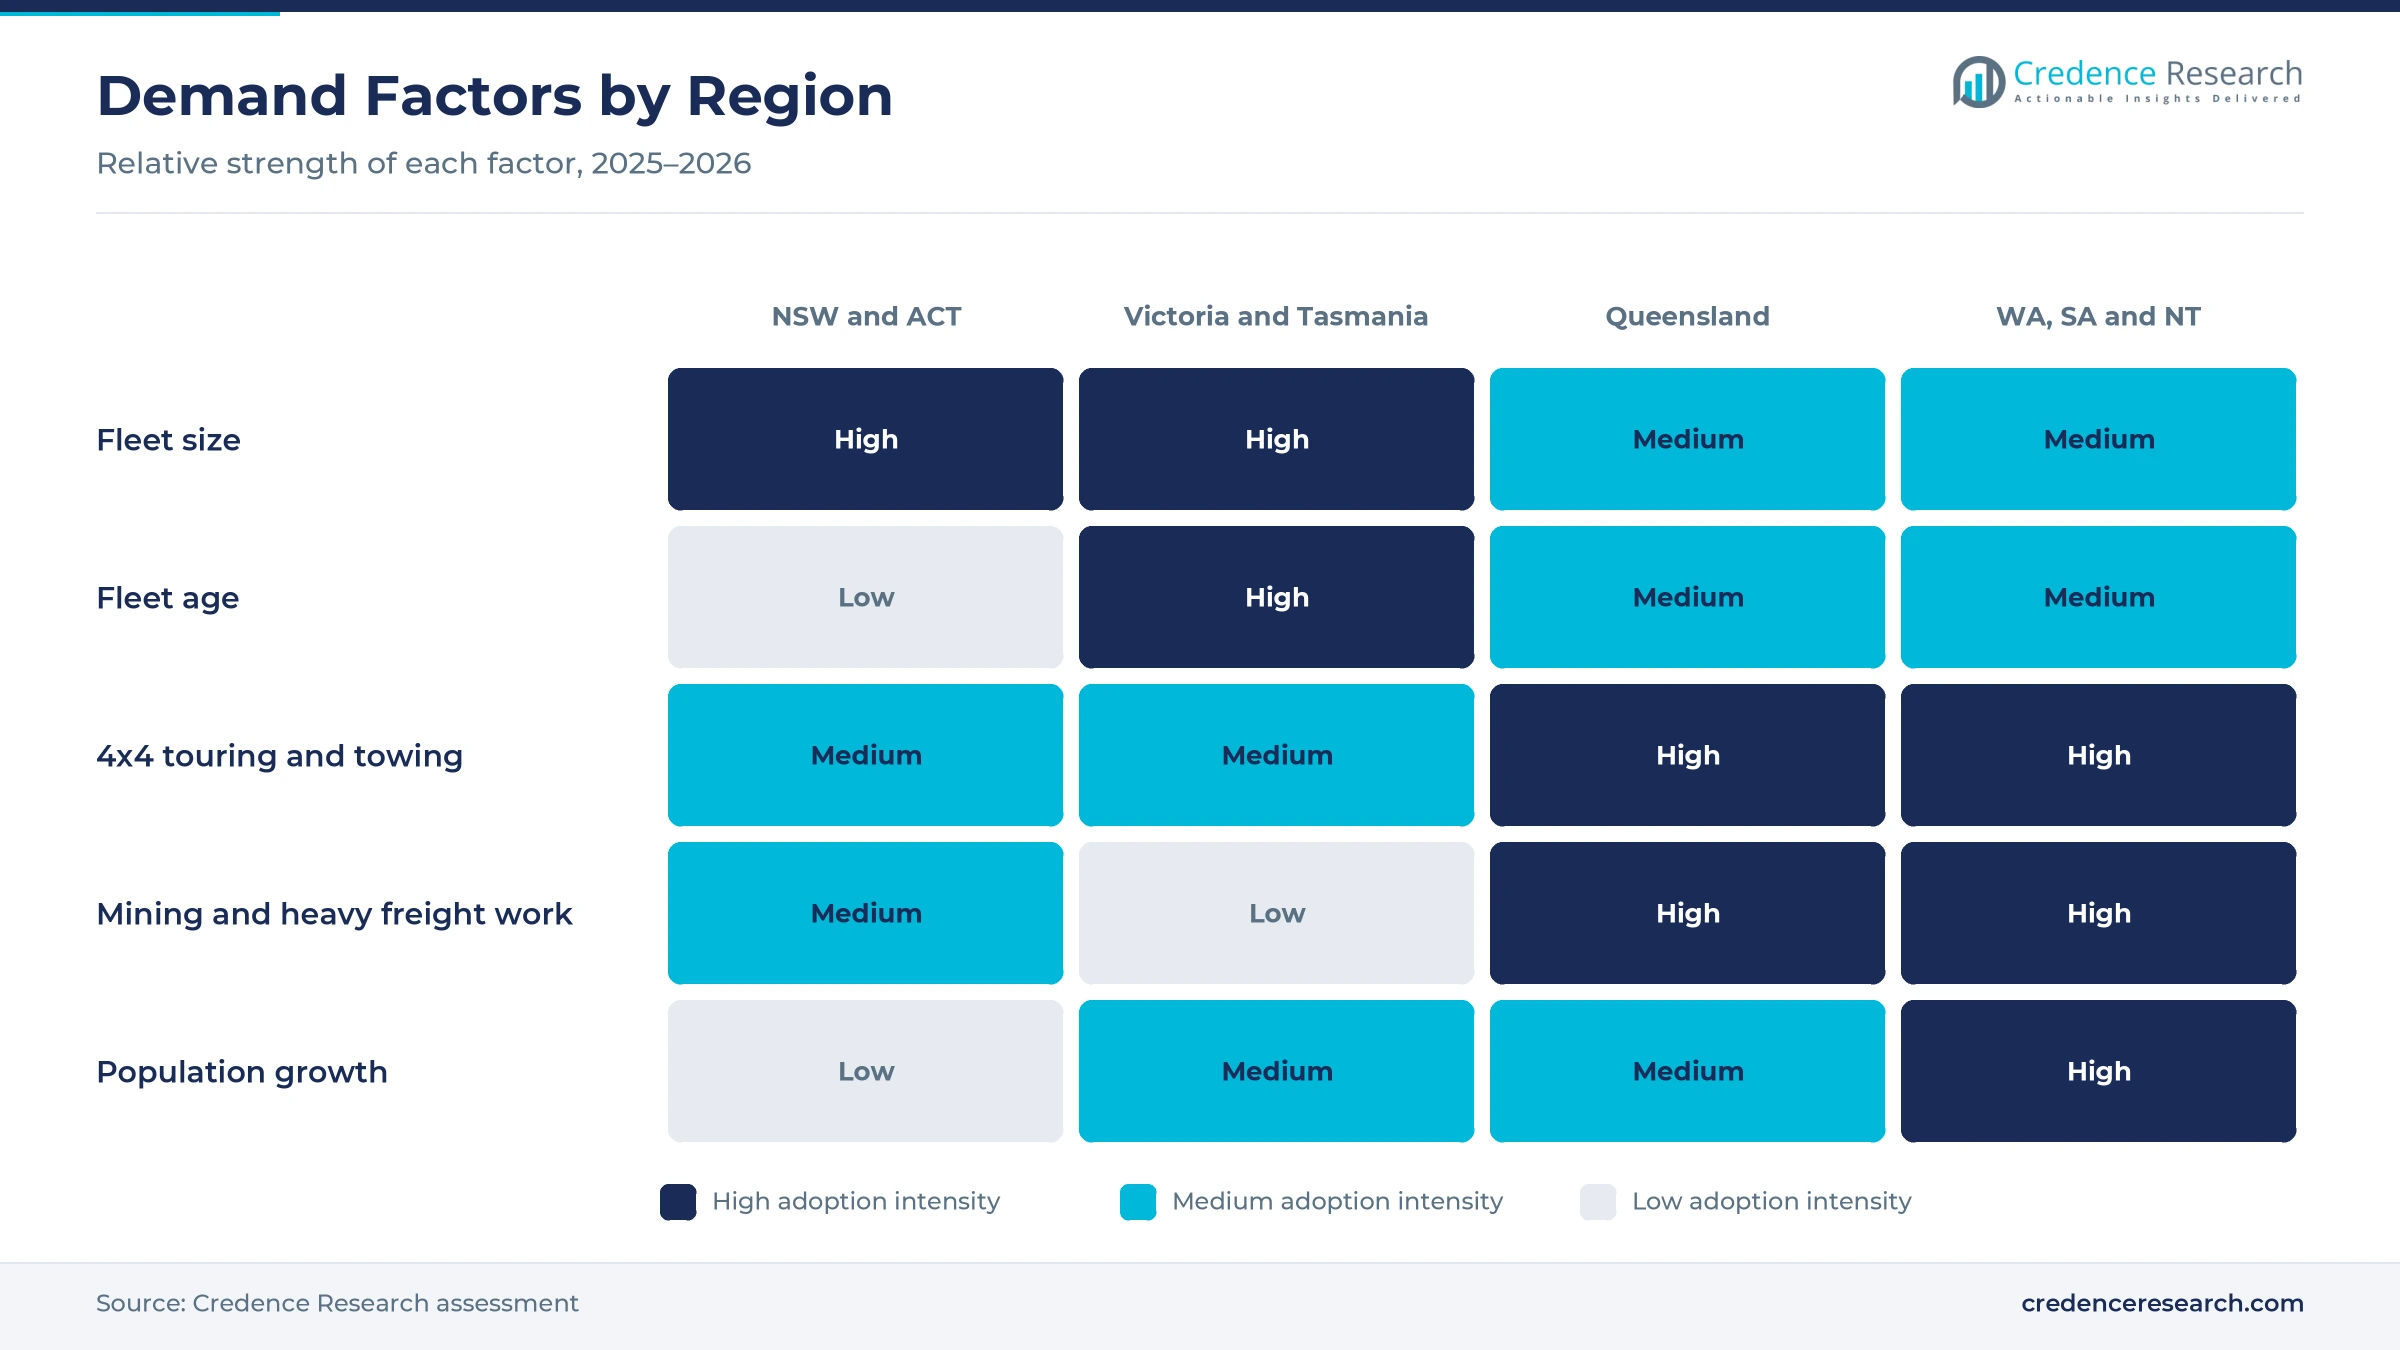
An aging installed fleet lifts replacement demand, because clutches, joints and bearings wear out with distance and time. Passenger vehicles averaged 11.1 years, light commercial vehicles 11.4 years and trucks 16.2 years in 2024 data, according to GoAuto analysis of federal fleet statistics. The same analysis shows Tasmania with the oldest fleet at 13.5 years and the Australian Capital Territory with the youngest at 10.4 years. Australia also had about 27.6 million residents in 2025, according to World Bank data, which keeps the number of cars on the road rising. As a result, failure replacement holds a 38.0% share of 2025 value, as workshops replace worn parts and quote related aftermarket parts together.
Why do severe-duty and four-wheel-drive uses raise value?
Severe-duty and four-wheel-drive use raises part value, because towing, touring and unsealed roads load clutches, axles and differentials far harder than city driving. ARB reported 77 branded stores, 31 of them company owned, in its August 2025 annual report, and it sells Air Locker differentials through that network. The same report said sales of key pick-ups, including the Toyota HiLux 4x4, Ford Ranger and Isuzu D-Max, fell 17%, while Ford Everest sales rose 33%. Under the New Vehicle Efficiency Standard that began on Jan. 1, 2025, models such as the Toyota LandCruiser and Nissan Patrol moved into the light commercial category. In turn, off-highway vehicles grow at 4.21% a year, as hard-working machines need regular axle and propeller shaft repairs.
How does independent repair information access widen buying?
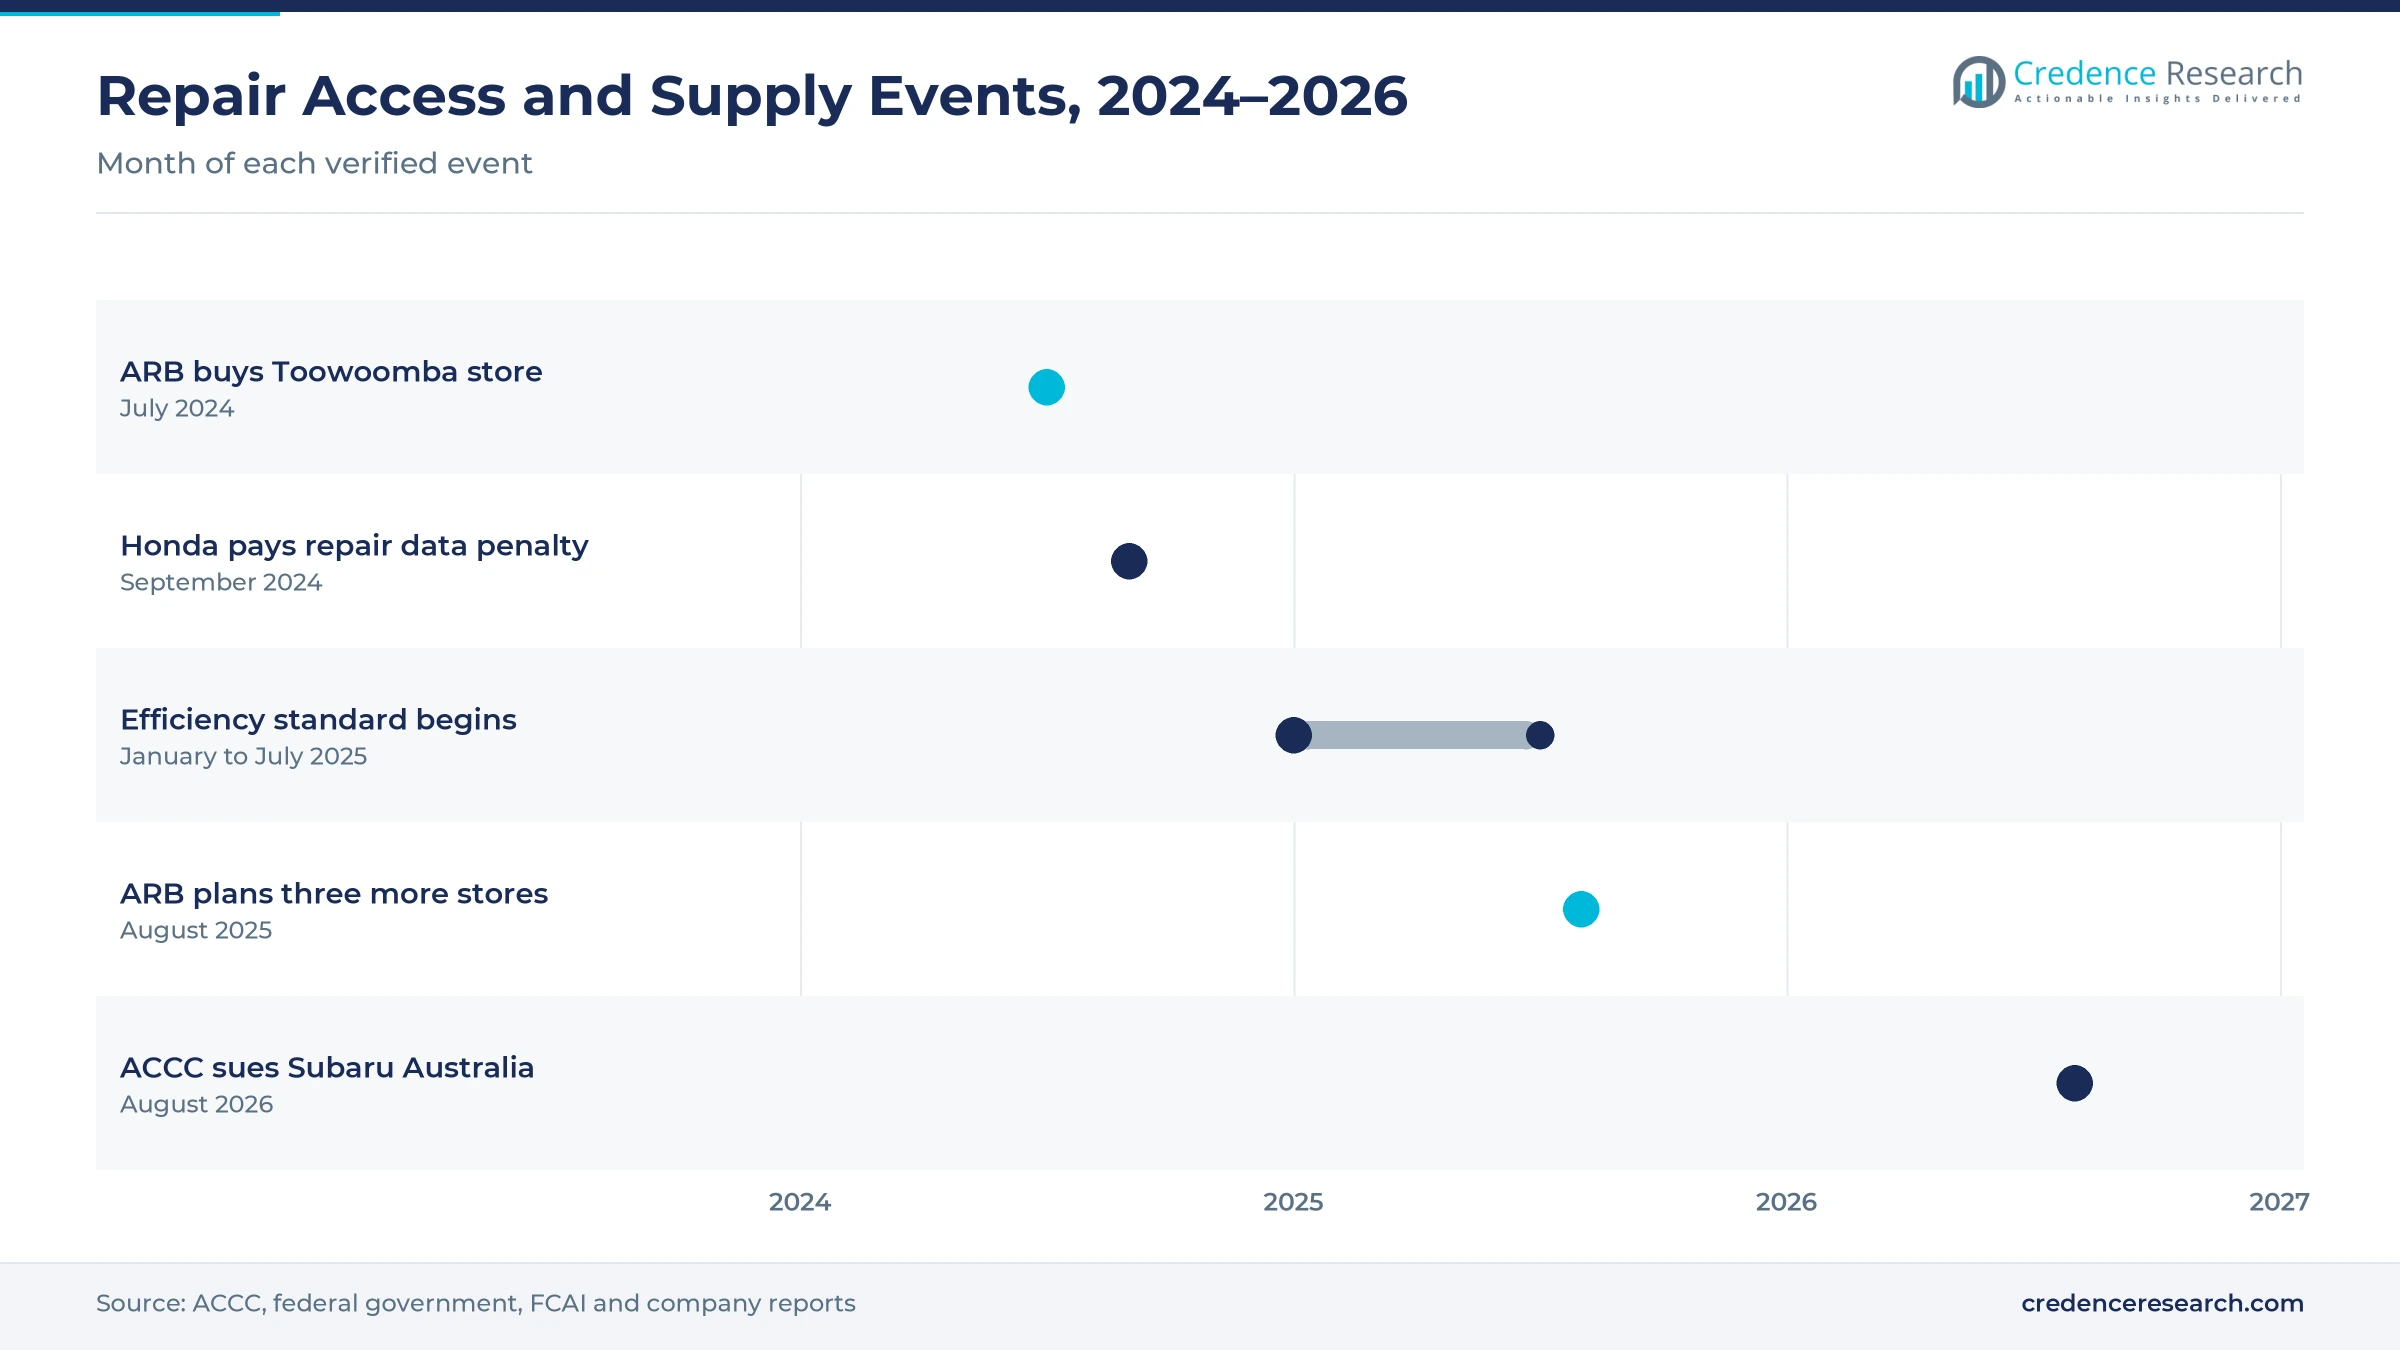
Independent repair information access widens buying, because workshops can now diagnose and fit driveline parts on late-model vehicles without sending them back to dealers. The national scheme covers passenger and light goods vehicles made on or after Jan. 1, 2002, and gives repairers access to service data, codes and software updates, according to the ACCC. Honda Australia paid an $18,780 penalty in September 2024 after the regulator alleged it offered diagnostic software only on yearly subscriptions. The regulator then began court action against Subaru Australia in August 2026, its first court case under the scheme. As a result, independent workshops hold a 46.0% share of 2025 value, as they compete for late-model service work.
Why does the electrified sales mix add new part needs?
The electrified sales mix adds new part needs, because hybrid and battery models use different gear sets, drive shafts and axle units than older combustion vehicles. Hybrids took 17.4% of new sales in January 2026, while battery electric vehicles held 8.4%, according to FCAI sales data. Plug-in hybrid sales reached 5,161 that month, up 170.5% from January 2025, while petrol vehicle sales fell 14%. The Ford Ranger was still the top seller with 3,403 sales, which keeps diesel 4x4 parts in demand. In turn, battery electric vehicles grow at 8.55% a year, the fastest powertrain rate, as electric drivetrain units age.
Electrified sales and locker upgrades reshape the parts mix
How is the shift to electrified fleets changing the parts mix?
The shift toward electrified fleets is slowly changing the parts mix, because new hybrid and battery models add gear and shaft designs that workshops must stock. The registered fleet was still 67.3% petrol and 29% diesel in 2024 data, while hybrids made up only 2.2% and battery or fuel cell vehicles 0.7%. However, hybrids reached 17.4% of new sales in January 2026, which means that share of the fleet will keep climbing each year. Plug-in hybrid sales also rose 170.5% from a year earlier in that month. As a result, combustion-only vehicles keep 86.0% of 2025 value, while hybrid electric vehicles gain as newer models leave warranty and enter independent service.
Why is the rise of flagship fitting networks reshaping sales?
The rise of flagship fitting networks is reshaping sales, because owners increasingly buy driveline upgrades as fitted packages rather than loose parts. ARB planned to open three more stores and upgrade six existing stores to its flagship format during fiscal 2026, adding to a network of 77 branded stores. Ford Everest sales also rose 33% in fiscal 2025, which widened the base for fitted packages. The company bought its Toowoomba store in Queensland in July 2024, and it acquired MITS Alloy in Newcastle in October 2024. However, ARB also reported a shortage of fitter technicians that limits how much fitting work it can complete. In turn, consumer buyers grow at 4.02% a year, the fastest customer rate, as fitted upgrade packages reach more towns.
Can locker and heavy-duty clutch upgrades open premium demand?
Locker and heavy-duty clutch upgrades open premium demand, because touring and towing owners pay more for parts that survive sand, mud and heavy loads. Harrop Engineering, which has built parts since 1955, sells E-Locker, Truetrac and Detroit Locker differentials alongside rebuild kits. EXEDY Australia sells Safari Tuff and Safari Extra Tuff clutch ranges for 4x4 vehicles, along with Truck Tuff and Agri Tuff ranges for work vehicles. Terrain Tamer, founded in 1969 in Melbourne, offers more than 40,000 4WD parts tested for Australian conditions. As a result, performance upgrades grow at 4.54% a year, the fastest usage rate, as owners add limited-slip differential options.
Is there room to grow in heavy and off-highway overhaul work?
Heavy and off-highway overhaul work leaves room to grow, because trucks and machines stay in service far longer than cars and need repeated rebuilds. Trucks averaged 16.2 years in 2024 data, compared with 11.1 years for passenger vehicles. The repair information scheme excludes heavy, farm and construction vehicles, so operators rely on specialist rebuilders and brand distributors for technical support. Western Australia also had the fastest population growth at 2.1% in the year to March 2026, which adds freight and resource work. In turn, overhaul supply grows faster than scheduled maintenance, as fleets in mining and freight keep rebuilding older trucks and machines.
Fitter shortages and softer 4x4 sales weigh on suppliers
How does the fitter shortage slow installed sales?
A shortage of fitter technicians slows installed sales, because many driveline parts need skilled work on hoists before the buyer receives any value. ARB reported this shortage as a constraint on its own fitting operations in its fiscal 2025 report. As a result, owners wait longer for upgrades, and some jobs are deferred or cancelled entirely. Suppliers respond with training, fitting partnerships and parts that are easier and faster to install.
Why do softer 4x4 pick-up sales weigh on upgrades?
Softer 4x4 pick-up sales weigh on upgrade demand, because many owners buy lockers, clutches and suspension soon after purchase. Sales of the Toyota HiLux 4x4, Ford Ranger and Isuzu D-Max fell 17% in ARB's fiscal 2025, while inflation constrained spending on extras. In turn, fewer new utes reach the accessory stage in the following year. Suppliers respond by building ranges for growing models such as the Ford Everest and the new Toyota Prado.
How do diagnostic access costs burden small workshops?
Diagnostic access costs burden small workshops, because late-model driveline repairs often need manufacturer software to calibrate or code new parts. The regulator alleged that Honda offered its diagnostic software only on yearly subscriptions until May 2024, without daily or monthly options. As a result, small repairers face higher fixed costs than dealers spread across many jobs. Industry groups respond by pressing for fair pricing under the scheme.
Why does the electrified transition narrow some part lines?
The electrified transition narrows some part lines over time, because battery electric vehicles held 8.4% of new sales in January 2026, up from earlier years. Suppliers of manual clutches and flywheels therefore face a smaller future base of new vehicles to serve. However, the existing fleet is still mostly petrol and diesel, which delays the impact for several years. Suppliers respond by adding drive shafts, bearings and gear parts for electrified models.
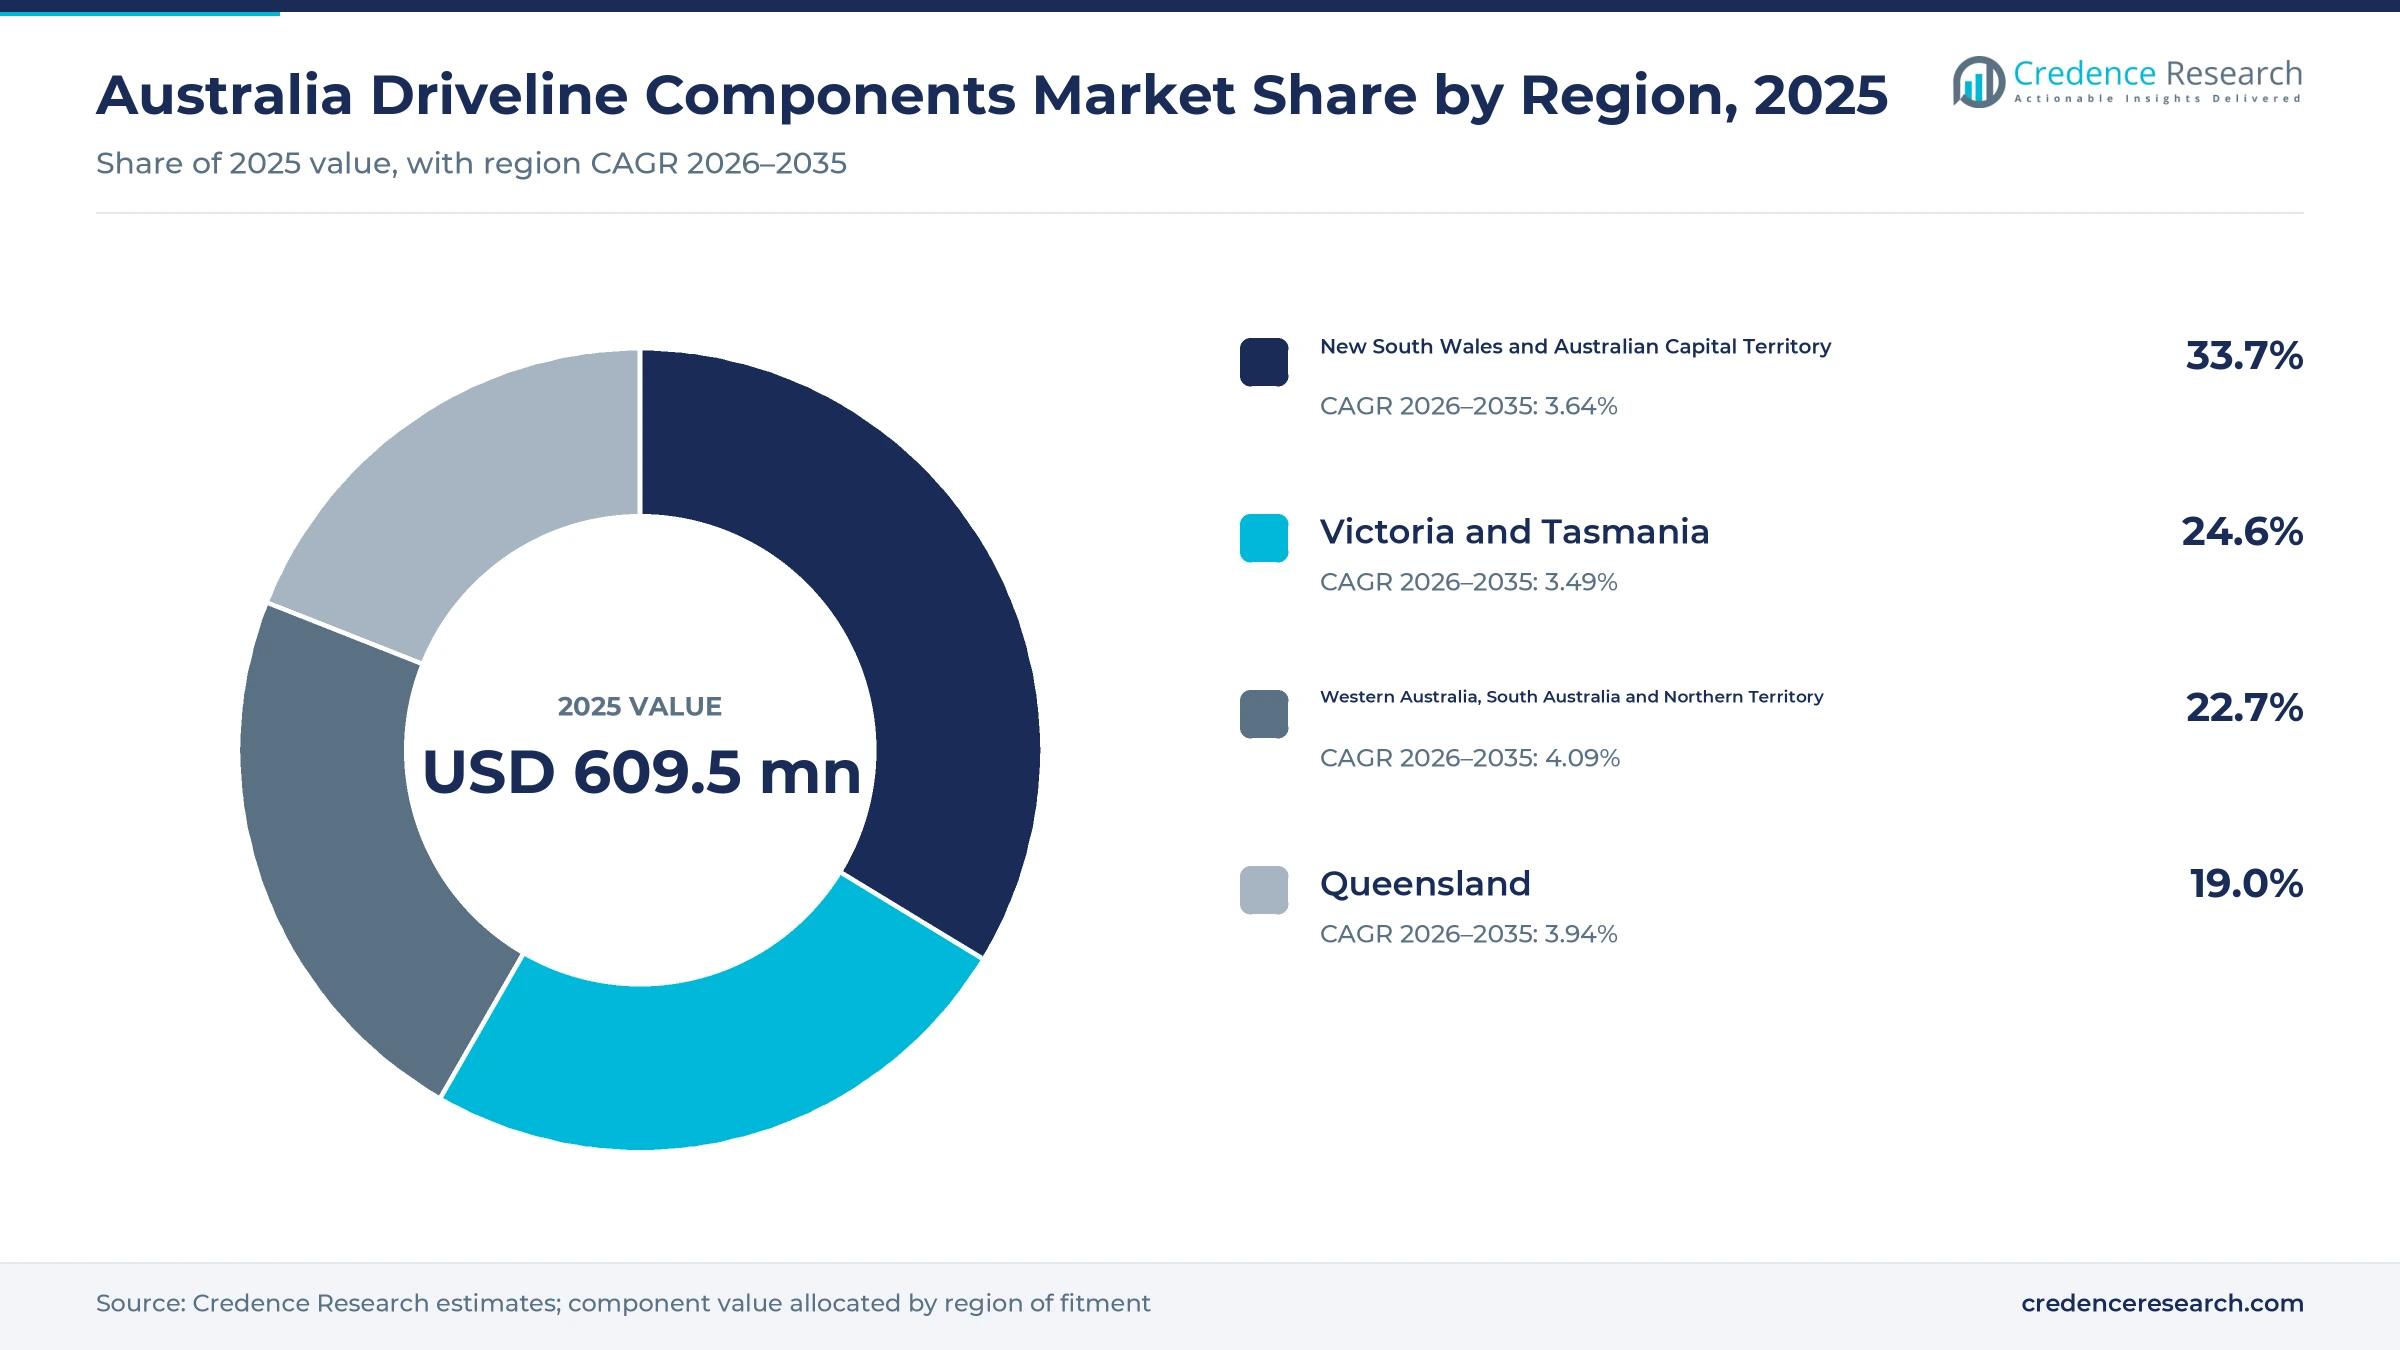
New South Wales leads while the west grows fastest
| Region | Value, 2025 (USD million) | Share, 2025 | CAGR, 2026–2035 |
|---|---|---|---|
| New South Wales and Australian Capital Territory | 205.4 | 33.7% | 3.64% |
| Victoria and Tasmania | 149.9 | 24.6% | 3.49% |
| Western Australia, South Australia and Northern Territory | 138.4 | 22.7% | 4.09% |
| Queensland | 115.8 | 19.0% | 3.94% |
Why do new South Wales and the ACT hold the largest share?
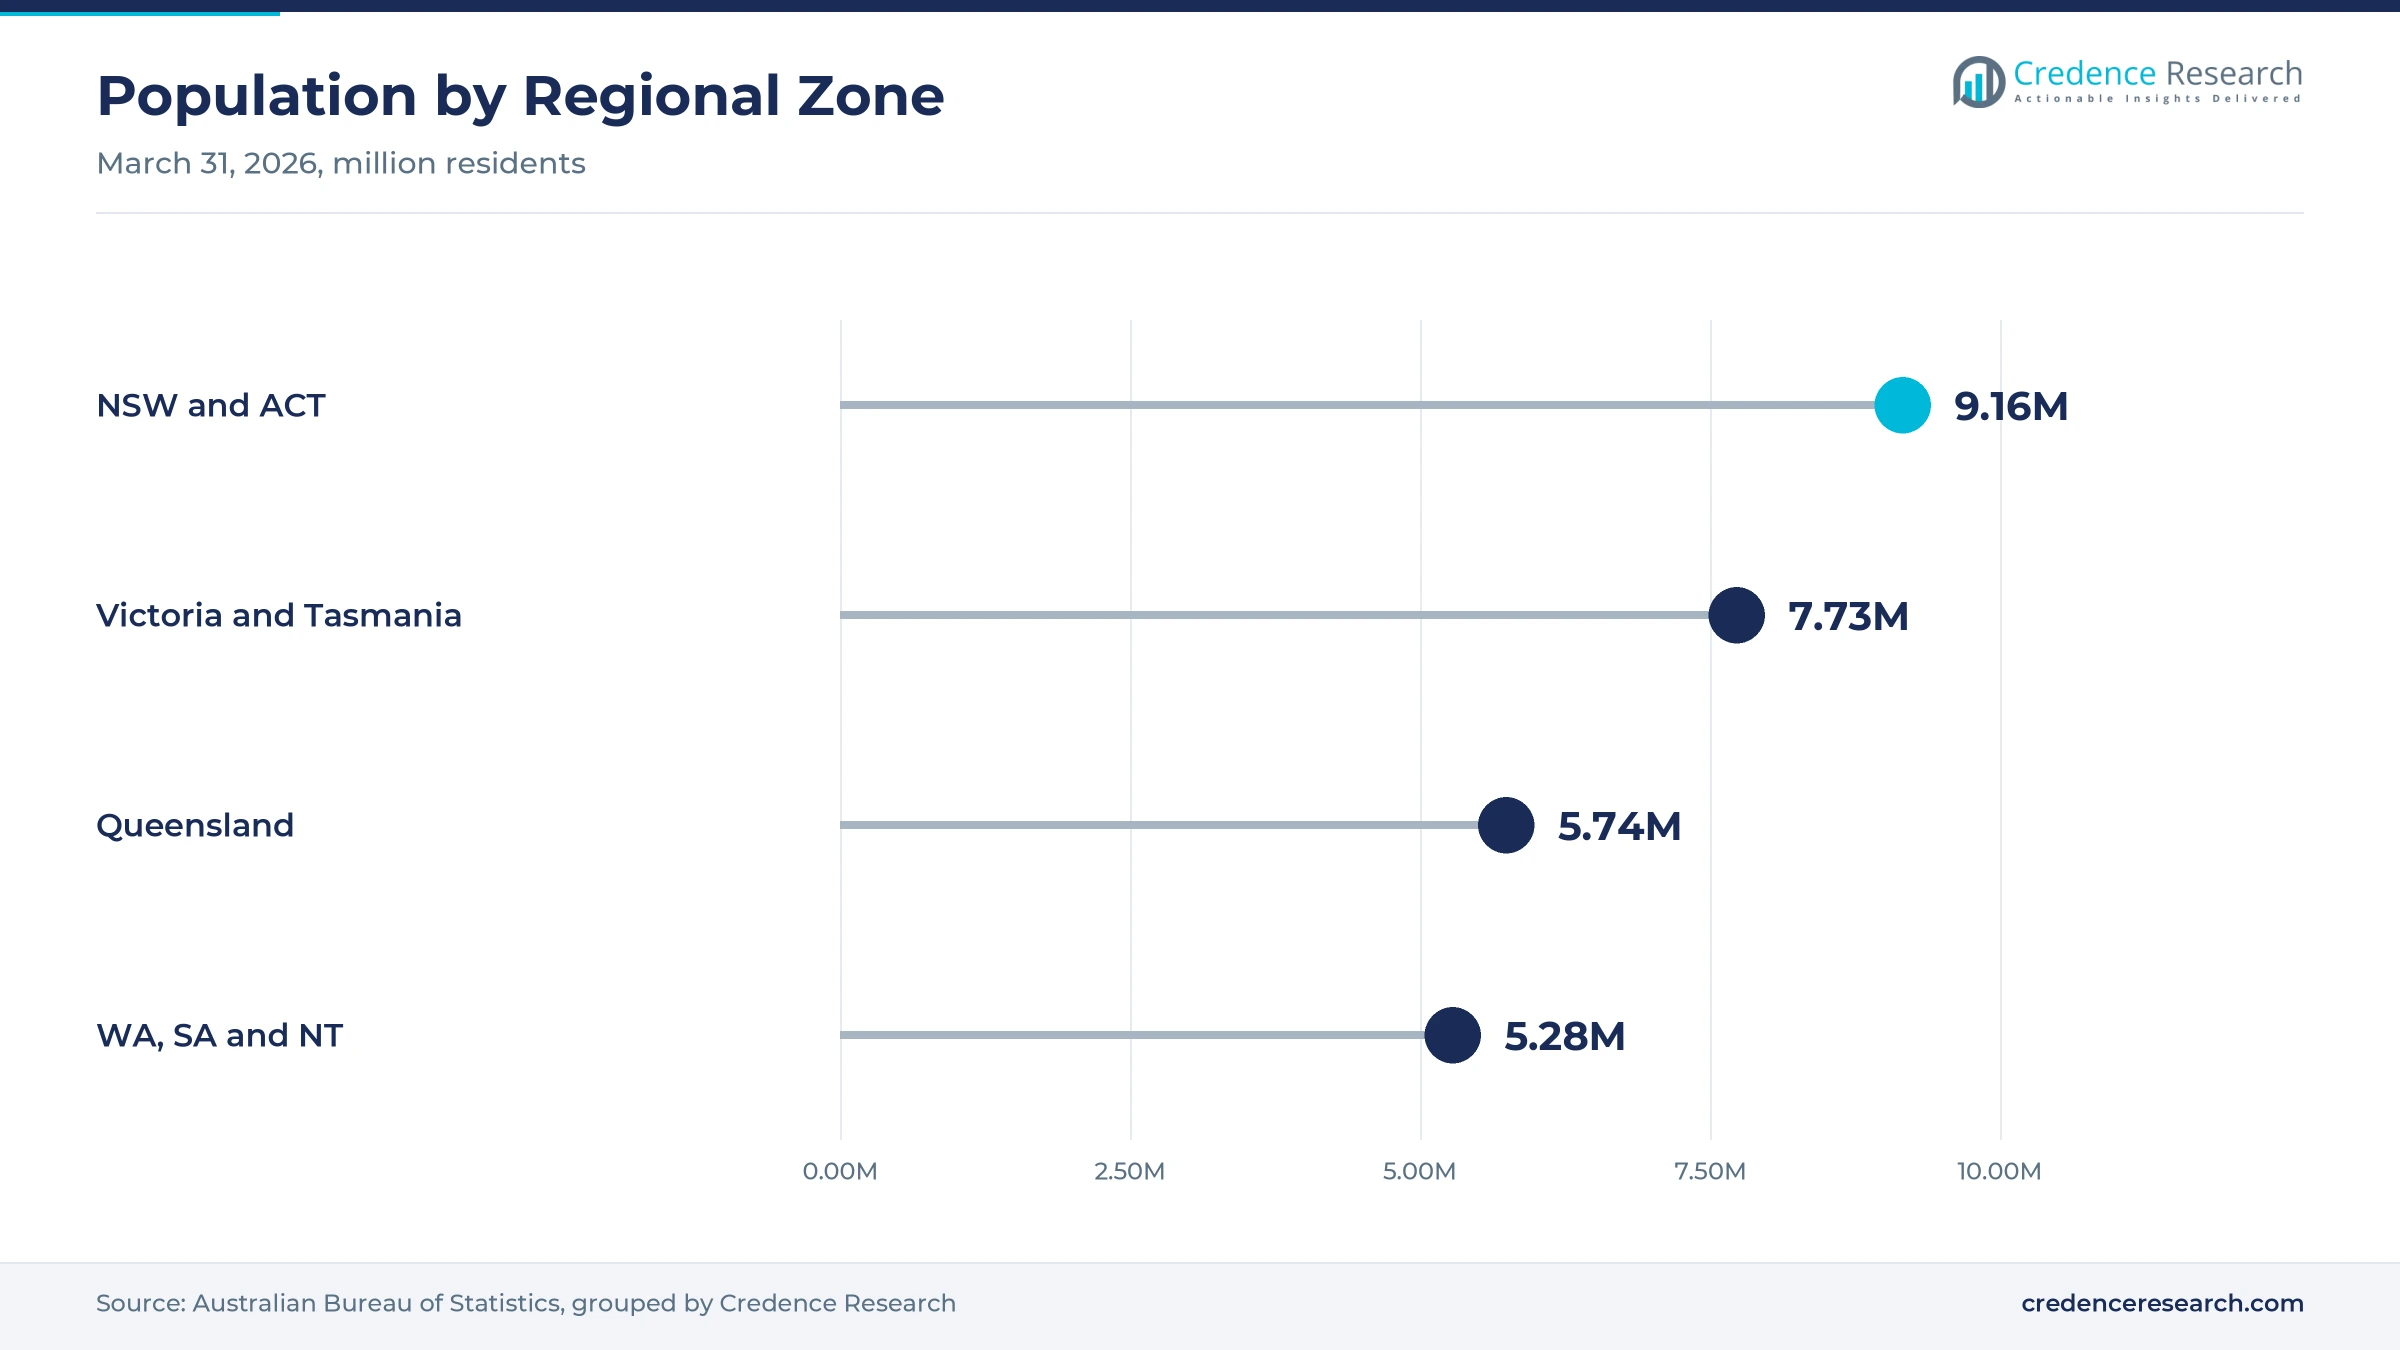
New South Wales and the Australian Capital Territory held 33.7% of 2025 value and grow at 3.64% a year, because the zone has the largest population and fleet. New South Wales had about 8.67 million residents and the territory about 490,000 at March 31, 2026. However, the state grew only 1.1% over the year, and the territory has the youngest fleet at 10.4 years, which tempers replacement demand.
How do Victoria and Tasmania sustain replacement work?
Victoria and Tasmania held 24.6% of 2025 value and grow at 3.49% a year, because dense workshop networks and old vehicles keep replacement work steady. Victoria added about 109,500 residents in the year to March 2026, the largest increase of any state. Tasmania has the oldest fleet at 13.5 years, which lifts failure replacement. However, Tasmania grew only 0.6% over the year, which keeps zone growth below the national rate.
Why is Queensland gaining from population and touring?
Queensland held 19.0% of 2025 value and grows at 3.94% a year, because population growth and 4x4 touring raise driveline wear. The state had about 5.74 million residents at March 31, 2026, after adding about 90,100 people over the year. ARB bought its Toowoomba store in July 2024, which shows the value of regional fitting capacity. As a result, workshops in regional centers keep a steady flow of clutch and axle work.
What makes the western zone the fastest region?
Western Australia, South Australia and the Northern Territory held 22.7% of 2025 value and grow fastest at 4.09% a year, because resource work and long distances load vehicles heavily. Western Australia had the fastest population growth at 2.1% in the year to March 2026. South Australia had about 1.92 million residents and the Northern Territory about 269,000, where remote roads raise wear.
Repair data rulings and store growth marked 2024 to 2026
| Development | Status and market relevance |
|---|---|
| In July 2024, ARB Corporation acquired its previously independent Toowoomba store in Queensland. | Added company-owned fitting capacity in a regional 4x4 center |
| In September 2024, Honda Australia paid an $18,780 penalty over diagnostic software access for independent repairers. | Signaled enforcement of the repair information scheme |
| In January 2025, the New Vehicle Efficiency Standard began, with credits and penalties applying from July 2025. | Moved some large 4WD models into the light commercial category |
| In August 2025, ARB Corporation reported 77 branded stores and planned three more for fiscal 2026. | Widens the fitting network for driveline upgrades |
| In August 2026, the ACCC began court action against Subaru Australia under the repair information scheme. | First court case under the scheme; allegations not yet decided |
Lockers, tough clutches and diagnostics shape the range
- Selectable differential lockers let 4x4 owners lock both wheels on an axle when traction is poor, which supports premium upgrade sales through specialist stores.
- Heavy-duty clutch packages use stronger plates and pressure plates for towing, touring and farm work, which raises the value of each replacement job.
- Diagnostic software access allows independent workshops to code and calibrate new parts on late-model vehicles, which widens the base of qualified installers.
- Electrified drive units combine motors, reduction gears and drive shafts in hybrid and battery vehicles, which adds new service lines as those vehicles age.
Need a Custom Version of This Report?
Tailor the scope, geography, or segments to your exact requirements.
- Custom geography or segment scope
- Direct access to our analyst team
Specialist brands and wide fitting networks set rivalry
Competition centers on specialist brands with deep 4x4 ranges and on the wholesale and fitting networks that reach workshops across a large country. ARB Corporation runs 77 branded stores and five state distribution centers, and it sells Air Locker differentials alongside a wide accessory range. Harrop Engineering has built parts since 1955 and sells E-Locker, Truetrac and Detroit Locker differentials with rebuild kits. EXEDY Australia supplies replacement and heavy-duty clutch ranges for cars, 4x4 vehicles, trucks and farm machines. Terrain Tamer, founded in Melbourne in 1969, offers more than 40,000 4WD parts tested for local conditions. Rivals compete on durability, fitment coverage for popular utes and wagons, stock depth in regional towns, technical support for workshops and warranty terms. ARB also acquired MITS Alloy, a Newcastle maker of aluminum service bodies, in October 2024, which expanded its ute accessory range.
Companies profiled and their roles in this market
| Company | Type | Role in the market |
|---|---|---|
| ARB Corporation | 4x4 specialist | Runs 77 branded stores and sells Air Locker differentials |
| Harrop Engineering | Local engineering firm | Sells E-Locker, Truetrac and Detroit Locker differentials since 1955 |
| EXEDY Australia | Clutch supplier | Offers Safari Tuff, Truck Tuff and Agri Tuff clutch ranges |
| Terrain Tamer | 4WD parts supplier | Offers more than 40,000 4WD parts from Melbourne |
Credence Research view on Australian driveline parts
Credence Research's view is that Australian driveline parts demand will grow steadily because an aging fleet and hard 4x4 use keep replacement work flowing. Passenger vehicles keep the largest share, while off-highway machines and performance upgrades gain ground. Wider repair data access helps independent workshops win late-model jobs, and electrified models add new parts lines. However, fitter shortages and softer pick-up sales will slow installed upgrades. Suppliers with broad fitment coverage, regional stock and workshop support should gain share fastest.
Fleet data and company filings anchor the parts model
The report uses 2025 as the base year on a calendar basis, and market values come from the Credence Research model. That model combines fleet age and fuel mix statistics, new vehicle sales data, population statistics, World Bank data, regulator findings on repair information access and company annual reports and product information. Segment splits and regional growth rates are Credence Research estimates, while regional shares follow the client-defined split. Sources used are public reports, official statistics, trade press, government releases and company releases, and no interviews or surveys were used.
Replacement work and electrified models carry demand to 2035
Driveline parts sales are expected to reach USD 890.8 million by 2035, a 3.76% CAGR during 2026–2035, as aging vehicles, severe-duty work and upgrade spending keep demand rising. Growth should hold steady through 2027 as pick-up sales settle and independent workshops gain wider data access. After that, hybrid and battery models will add more service work as they leave warranty. A long fall in 4x4 sales would lower this outlook, while faster resource and freight activity would raise it.
Frequently Asked Questions
How big is the Australia driveline components market?
Which vehicle type leads driveline parts demand in Australia?
Which region leads the Australia driveline components market?
Why do independent workshops lead buying?
How does the repair information scheme affect the market?
Which usage type grows fastest?
Who are the leading driveline parts suppliers in Australia?
What are the main challenges for driveline parts suppliers?
Table of Content
Chapter 1 Market Segmentation
- 1.1 Segmentation Framework
- 1.1.1 Product and Service Classification
- 1.1.2 Application and End-Use Classification
- 1.1.3 Technology and Solution Classification
- 1.1.4 Customer and Distribution Channel Classification
- 1.1.5 Geographic Segmentation
- 1.1.6 Market Segment Definitions and Boundaries
- 1.2 By Vehicle Type
- 1.2.1 Passenger Vehicles
- 1.2.2 Light Commercial Vehicles
- 1.2.3 Heavy Commercial Vehicles
- 1.2.4 Off-Highway Vehicles
- 1.3 By Powertrain
- 1.3.1 Combustion Only
- 1.3.2 Hybrid Electric
- 1.3.3 Plug-In Hybrid
- 1.3.4 Battery Electric
- 1.4 By Usage Type
- 1.4.1 Scheduled Maintenance
- 1.4.2 Failure Replacement
- 1.4.3 Overhaul Supply
- 1.4.4 Performance Upgrades
- 1.5 By Customer Type
- 1.5.1 Independent Workshops
- 1.5.2 Dealer Workshops
- 1.5.3 Fleet Maintenance Buyers
- 1.5.4 Consumer Buyers
Chapter 2 Introduction
- 2.1 Report Objectives and Scope
- 2.2 Product Definition and Industry Terminology
- 2.3 Market Inclusions and Exclusions
- 2.4 Research Process
- 2.4.1 Primary Research and Expert Interviews
- 2.4.2 Secondary Research and Source Review
- 2.4.3 Top-Down and Bottom-Up Estimation
- 2.4.4 Data Triangulation and Verification
- 2.5 Market Size Measurement Basis
- 2.5.1 2025: USD 609.5 million → 2035: USD 890.8 million
- 2.6 Historical and Forecast Reference Periods
- 2.6.1 Historical Period: 2018-2025
- 2.6.2 Base Year: 2025
- 2.6.3 Forecast Period: 2025-2035
- 2.7 Research Assumptions and Limitations
Chapter 3 Executive Summary
- 3.1 Market Snapshot and Key Findings
- 3.2 Base-Year Market Size, 2025
- 3.3 Forecast Market Size, 2035
- 3.4 Revenue and Volume Growth Outlook
- 3.5 Key Demand and Supply Indicators
- 3.6 Leading Market Segments
- 3.7 Fastest-Growing Market Opportunities
- 3.8 Regional Performance Highlights
- 3.9 Technology and Industry Transformation
- 3.10 Competitive Landscape Summary
- 3.11 Analyst View and Strategic Implications
Chapter 4 Australia Driveline Components Market Trends and Developments
- 4.1 Historical Industry Development, 2018-2025
- 4.2 Recent Market Trends and Developments
- 4.3 Demand and Customer Behavior Trends
- 4.4 Technology and Product Innovation
- 4.5 Artificial Intelligence, Automation and Digitalization
- 4.6 Local Manufacturing and Supply Chain Realignment
- 4.7 Industry Partnerships, Mergers and Acquisitions
- 4.8 Sustainability and Circular Economy Developments
- 4.9 Government and Private Sector Investment Trends
- 4.10 Emerging Business Models and Commercialization
- 4.11 Industry Developments and Announcements
Chapter 5 Australia Driveline Components Market Production, Supply and Demand Analysis
- 5.1 Demand Trend and Consumption Analysis, 2018-2025
- 5.2 Demand Forecast, 2025-2035
- 5.3 Production and Output Trend, 2018-2025
- 5.4 Production and Output Forecast, 2025-2035
- 5.5 Installed Capacity and Capacity Utilization
- 5.6 Company-Wise Production Plants and Statistics
- 5.6.1 Installed Production Capacity
- 5.6.2 Actual Production
- 5.6.3 Planned Capacity and Expansion Targets
- 5.7 Supply Chain Structure and Procurement Trends
- 5.8 Supply-Demand Gap and Bottlenecks
- 5.9 Import Dependence and Sourcing Structure
- 5.10 Contract Manufacturing and Outsourcing
- 5.11 Regional Supply and Demand Concentration
Chapter 6 Australia Driveline Components Market Pricing Analysis
- 6.1 Pricing Structure and Measurement
- 6.2 Historical Pricing Trends, 2018-2025
- 6.3 Pricing Outlook, 2025-2035
- 6.4 Average Selling Price and Unit Economics
- 6.5 Pricing by Product and Market Segment
- 6.6 Geographic Pricing Differences
- 6.7 Key Input, Energy, Labor and Logistics Costs
- 6.8 Contract Pricing and Purchasing Models
- 6.9 Pricing Sensitivity and Competitive Positioning
- 6.10 Price, Margin and Profitability Implications
Chapter 7 Australia Driveline Components Market Dynamics
- 7.1 Market Growth Drivers
- 7.1.1 Demand-Side Drivers
- 7.1.2 Technology and Innovation Drivers
- 7.1.3 Infrastructure and Investment Drivers
- 7.1.4 Regulatory and Policy Drivers
- 7.2 Market Restraints
- 7.2.1 Cost and Affordability Constraints
- 7.2.2 Technology and Adoption Barriers
- 7.2.3 Supply Chain and Operational Constraints
- 7.3 Market Challenges
- 7.3.1 Competitive Pressure and Margin Erosion
- 7.3.2 Skills, Infrastructure and Implementation Gaps
- 7.4 Emerging Market Opportunities
- 7.5 Market Dynamics Impact and Time-Horizon Assessment
Chapter 8 Australia Driveline Components Value Chain Analysis
- 8.1 Industry Value Chain Overview
- 8.2 Upstream Suppliers and Critical Inputs
- 8.3 Technology and Component Providers
- 8.4 Manufacturing or Service Delivery
- 8.5 Distribution, Channel Partners and Integrators
- 8.6 Downstream Applications and End Users
- 8.7 Value Addition and Profit Pools
- 8.8 Vertical Integration and Outsourcing
- 8.9 Supplier Concentration and Risk
- 8.10 Supply Chain Localization and Resilience
Chapter 9 Australia Driveline Components Market Regulations and Policies
- 9.1 Relevant Laws, Standards and Compliance Frameworks
- 9.2 Product, Service, Safety and Quality Requirements
- 9.3 Government Policies, Incentives and Subsidies
- 9.4 Imports, Exports and Trade Barriers
- 9.5 Public Procurement and Local Content Requirements
- 9.6 Environmental and Sustainability Compliance
- 9.7 Upcoming Policy Changes and Market Implications
Chapter 10 Australia Driveline Components Market Hotspots and Opportunities
- 10.1 Market Opportunity Mapping and Growth Hotspots
- 10.2 High-Growth Applications and Customer Groups
- 10.3 Underserved Markets and White-Space Opportunities
- 10.4 Emerging Technology and Product Opportunities
- 10.5 New Capacity and Investment Hotspots
- 10.6 Market Entry and Expansion Opportunities
- 10.7 Distribution and Partnership Opportunities
- 10.8 Near-Term and Long-Term Commercial Potential
- 10.9 Opportunity Attractiveness and Execution Risks
Chapter 11 Australia Driveline Components Market Outlook, 2025-2035
- 11.1 Market Size and Analysis
- 11.1.1 Revenue (Market Measurement: 2025: USD 609.5 million → 2035: USD 890.8 million)
- 11.1.2 Market Volume and Quantity Sold
- 11.1.3 Historical Market Size, 2018-2025
- 11.1.4 Base-Year Market Size, 2025
- 11.2 Market Forecast, 2025-2035
- 11.2.1 Revenue Forecast to 2035
- 11.2.2 Volume Forecast to 2035
- 11.2.3 CAGR and Year-on-Year Growth
- 11.2.4 Incremental Revenue Opportunity
- 11.3 Forecast Assumptions and Scenario Analysis
- 11.3.1 Base-Case Forecast
- 11.3.2 Optimistic and Conservative Scenarios
- 11.3.3 Technology, Pricing and Policy Sensitivities
- 11.4 Market Attractiveness and Growth Outlook
Chapter 12 Australia Driveline Components Market Segmentation and Outlook
- 12.1 Segmentation Summary and Market Shares, 2025
- 12.2 Largest and Fastest-Growing Segments
- 12.3 By Vehicle Type - Market Size and Forecast, 2025-2035
- 12.3.1 Segment Definition and Scope
- 12.3.2 Historical Market Size, 2018-2025
- 12.3.3 Revenue Forecast, 2025-2035
- 12.3.4 Volume Forecast, 2025-2035
- 12.3.5 Base-Year Market Share, 2025
- 12.3.6 Segment CAGR and Growth Drivers
- 12.3.7 Subsegment Market Size and Forecast
- 12.3.7.1 Passenger Vehicles
- 12.3.7.2 Light Commercial Vehicles
- 12.3.7.3 Heavy Commercial Vehicles
- 12.3.7.4 Off-Highway Vehicles
- 12.3.8 Subsegment Pricing and Adoption Trends
- 12.3.9 Leading Suppliers and Competition
- 12.3.10 Regional Demand and Opportunities
- 12.4 By Powertrain - Market Size and Forecast, 2025-2035
- 12.4.1 Segment Definition and Scope
- 12.4.2 Historical Market Size, 2018-2025
- 12.4.3 Revenue Forecast, 2025-2035
- 12.4.4 Volume Forecast, 2025-2035
- 12.4.5 Base-Year Market Share, 2025
- 12.4.6 Segment CAGR and Growth Drivers
- 12.4.7 Subsegment Market Size and Forecast
- 12.4.7.1 Combustion Only
- 12.4.7.2 Hybrid Electric
- 12.4.7.3 Plug-In Hybrid
- 12.4.7.4 Battery Electric
- 12.4.8 Subsegment Pricing and Adoption Trends
- 12.4.9 Leading Suppliers and Competition
- 12.4.10 Regional Demand and Opportunities
- 12.5 By Usage Type - Market Size and Forecast, 2025-2035
- 12.5.1 Segment Definition and Scope
- 12.5.2 Historical Market Size, 2018-2025
- 12.5.3 Revenue Forecast, 2025-2035
- 12.5.4 Volume Forecast, 2025-2035
- 12.5.5 Base-Year Market Share, 2025
- 12.5.6 Segment CAGR and Growth Drivers
- 12.5.7 Subsegment Market Size and Forecast
- 12.5.7.1 Scheduled Maintenance
- 12.5.7.2 Failure Replacement
- 12.5.7.3 Overhaul Supply
- 12.5.7.4 Performance Upgrades
- 12.5.8 Subsegment Pricing and Adoption Trends
- 12.5.9 Leading Suppliers and Competition
- 12.5.10 Regional Demand and Opportunities
- 12.6 By Customer Type - Market Size and Forecast, 2025-2035
- 12.6.1 Segment Definition and Scope
- 12.6.2 Historical Market Size, 2018-2025
- 12.6.3 Revenue Forecast, 2025-2035
- 12.6.4 Volume Forecast, 2025-2035
- 12.6.5 Base-Year Market Share, 2025
- 12.6.6 Segment CAGR and Growth Drivers
- 12.6.7 Subsegment Market Size and Forecast
- 12.6.7.1 Independent Workshops
- 12.6.7.2 Dealer Workshops
- 12.6.7.3 Fleet Maintenance Buyers
- 12.6.7.4 Consumer Buyers
- 12.6.8 Subsegment Pricing and Adoption Trends
- 12.6.9 Leading Suppliers and Competition
- 12.6.10 Regional Demand and Opportunities
- 12.7 Segment Growth Comparison
- 12.8 Segment Attractiveness and Priority Matrix
Chapter 13 Australia Driveline Components End-Use and Application Market Outlook
- 13.1 End-Use Industry and Customer Demand Structure
- 13.2 Leading Applications and Customer Groups
- 13.3 End-Use Market Size, Share and Forecast
- 13.4 Major End-Use Industry Deep Dives
- 13.4.1 Customer Requirements and Use Cases
- 13.4.2 Demand and Replacement Cycles
- 13.4.3 Technical and Regulatory Considerations
- 13.4.4 Purchasing and Procurement Models
- 13.4.5 Leading Vendors and Distribution Channels
- 13.4.6 Forecast and Commercial Opportunities
- 13.5 Emerging Applications and Cross-Segment Demand
- 13.6 End-Use Industry Investment Priorities
Chapter 14 Australia Driveline Components Geographic Market Outlook, 2025-2035
- 14.1 Domestic Market Distribution and Demand Clusters
- 14.2 State- or Province-Wise Market Size and Forecast, 2025-2035
- 14.3 City and Metropolitan Market Outlook
- 14.4 Industrial, Manufacturing and Commercial Clusters
- 14.5 Geographic Concentration of Key End Users
- 14.6 Local Pricing and Purchasing Differences
- 14.7 Domestic Production Facilities and Capacity Map
- 14.8 Local Infrastructure and Project Pipeline
- 14.9 State-Level Policy and Incentive Differences
- 14.10 Subnational Investment Hotspots and Opportunities
- 14.11 Distribution and Logistics Networks
- 14.12 Domestic Competitive Footprint
Chapter 15 Australia Driveline Components Technology, Innovation and Sustainability Outlook
- 15.1 Technology Landscape and Maturity
- 15.2 Product, Process and Service Innovation
- 15.3 AI, Automation and Digital Tools in the Industry
- 15.4 Technology Adoption and Performance Benchmarking
- 15.5 Innovation Pipeline and R&D Investment
- 15.6 Patent and Intellectual Property Trends
- 15.7 Energy Efficiency and Resource Management
- 15.8 Sustainability, Recycling and Circularity
- 15.9 Technology Roadmap, 2025-2035
- 15.10 Risks of Obsolescence and Technology Substitution
Chapter 16 Australia Driveline Components Market Key Strategic Imperatives
- 16.1 Growth and Market Entry Priorities
- 16.2 High-Return Products and Segments
- 16.3 Pricing, Profitability and Cost Optimization
- 16.4 Technology Investment and Product Differentiation
- 16.5 Supply Chain Localization and Resilience
- 16.6 Distribution and Customer Acquisition
- 16.7 Partnership, Acquisition and Capacity Strategy
- 16.8 Regional Expansion Priorities
- 16.9 Short-, Medium- and Long-Term Actions
Chapter 17 Competition Outlook
- 17.1 Industry Competition Characteristics
- 17.2 Market Structure and Concentration
- 17.3 Market Share and Competitive Positioning, 2025
- 17.4 Company-Wise Revenue and Product Benchmarking
- 17.5 Production and Service Capacity Benchmarking
- 17.6 Technology, Pricing and Differentiation
- 17.7 Regional Footprint and Distribution Strength
- 17.8 Mergers, Acquisitions and Strategic Alliances
- 17.9 New Entrants and Competitive Threats
- 17.10 Porter's Five Forces and Industry Attractiveness
- 17.11 Competitive Outlook, 2025-2035
Chapter 18 Company Profiles
- 18.1 Company Coverage and Selection Criteria
- 18.2 EXEDY Australia
- 18.2.1 Business Description
- 18.2.2 Company Ownership and Geographic Presence
- 18.2.3 Product and Service Portfolio
- 18.2.4 Manufacturing and Operating Footprint
- 18.2.5 Production Capacity and Expansion Plans
- 18.2.6 Financial Performance and Investment
- 18.2.7 Market Share and Competitive Position
- 18.2.8 Technology and Innovation Capabilities
- 18.2.9 Strategic Alliances or Partnerships
- 18.2.10 Recent Developments
- 18.2.11 Growth Strategy and Outlook
- 18.3 ZF Aftermarket Australia
- 18.4 Dana Australia
- 18.5 ARB Corporation
- 18.6 GKN Automotive
- 18.7 Driveline Services Australia
- 18.8 Hardy Spicer
- 18.9 Harrop Engineering
- 18.10 Terrain Tamer
- 18.11 Mal Wood Automotive
- 18.12 Other Relevant Market Participants
Note: Every listed company is profiled on the structure shown under the first company. The company list is preliminary and may change based on research findings, market developments, data availability and client requirements.
Chapter 19 Disclaimer
- 19.1 Research and Forecast Disclaimer
- 19.2 Data Source and Estimation Limitations
Note: The depth of individual sections depends on data availability for this market. Volume, capacity, trade and other unit-based metrics are included where applicable.

