
Electric cars and salary packaging reshape vehicle leasing
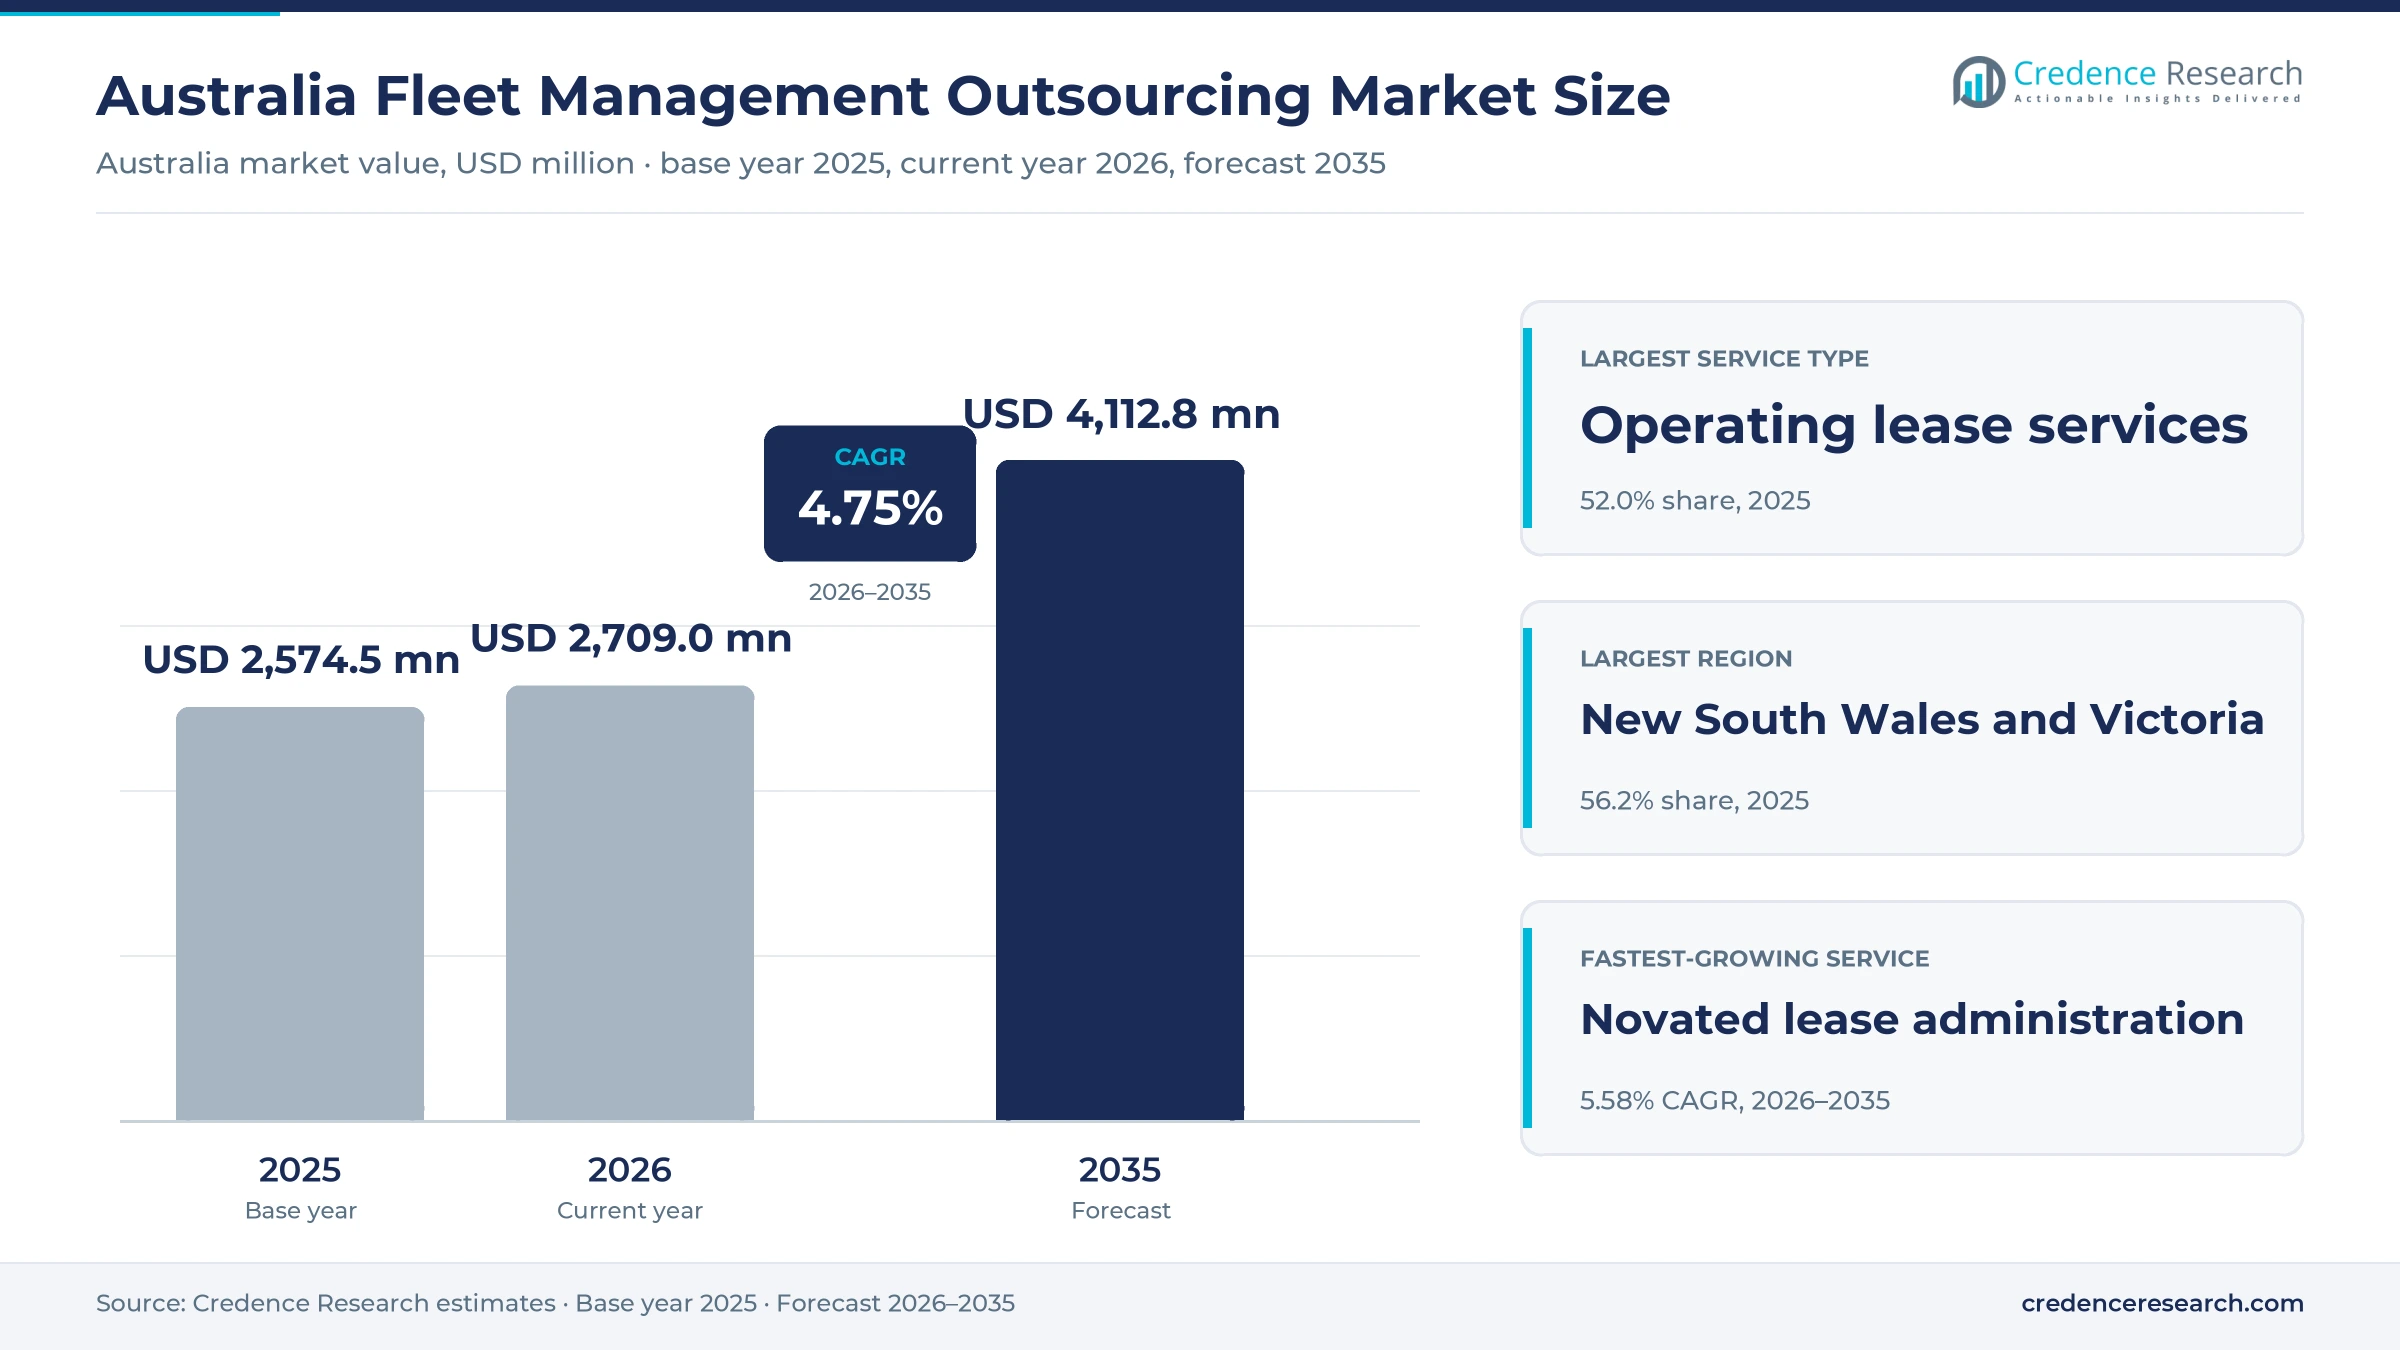
The Australia fleet management outsourcing market was valued at USD 2.57 billion in 2025 and is projected to increase from USD 2.71 billion in 2026 to USD 4.11 billion by 2035, registering a CAGR of 4.75% during 2026–2035. Demand comes from employers that lease cars and light commercial vehicles instead of owning them, and from employees who package electric cars through salary sacrifice. New South Wales and Victoria held the largest regional share, 56.2% in 2025, because Sydney and Melbourne host most corporate head offices and large public employers. Queensland and Western Australia grow fastest at 5.00% a year, as both states add residents and field-service fleets. Since July 2022, eligible electric cars have been exempt from fringe benefits tax, which lifted novated orders. In May 2026, the federal government announced a phased change that keeps the full exemption until March 31, 2027.
Which vehicle services are counted in Australia?
The estimate measures fees and rentals that organizations in Australia pay to outside providers for leasing, administering and managing cars and light commercial vehicles. It covers operating leases, novated lease administration and management-only services such as maintenance control, fuel cards, registration and accident handling. Values are stated in USD million at current prices and exclude goods and services tax.
The estimate excludes vehicles that organizations buy outright and manage with their own staff, short-term rentals and heavy trucks. The value chain runs from vehicle makers and dealers through lessors, funders and novated specialists to employers, public agencies and drivers.
Australia Fleet Management Outsourcing Market Insights
- The Australia fleet management outsourcing market was valued at USD 2.57 billion in 2025 and is projected to reach USD 4.11 billion by 2035, at a 4.75% CAGR during 2026–2035.
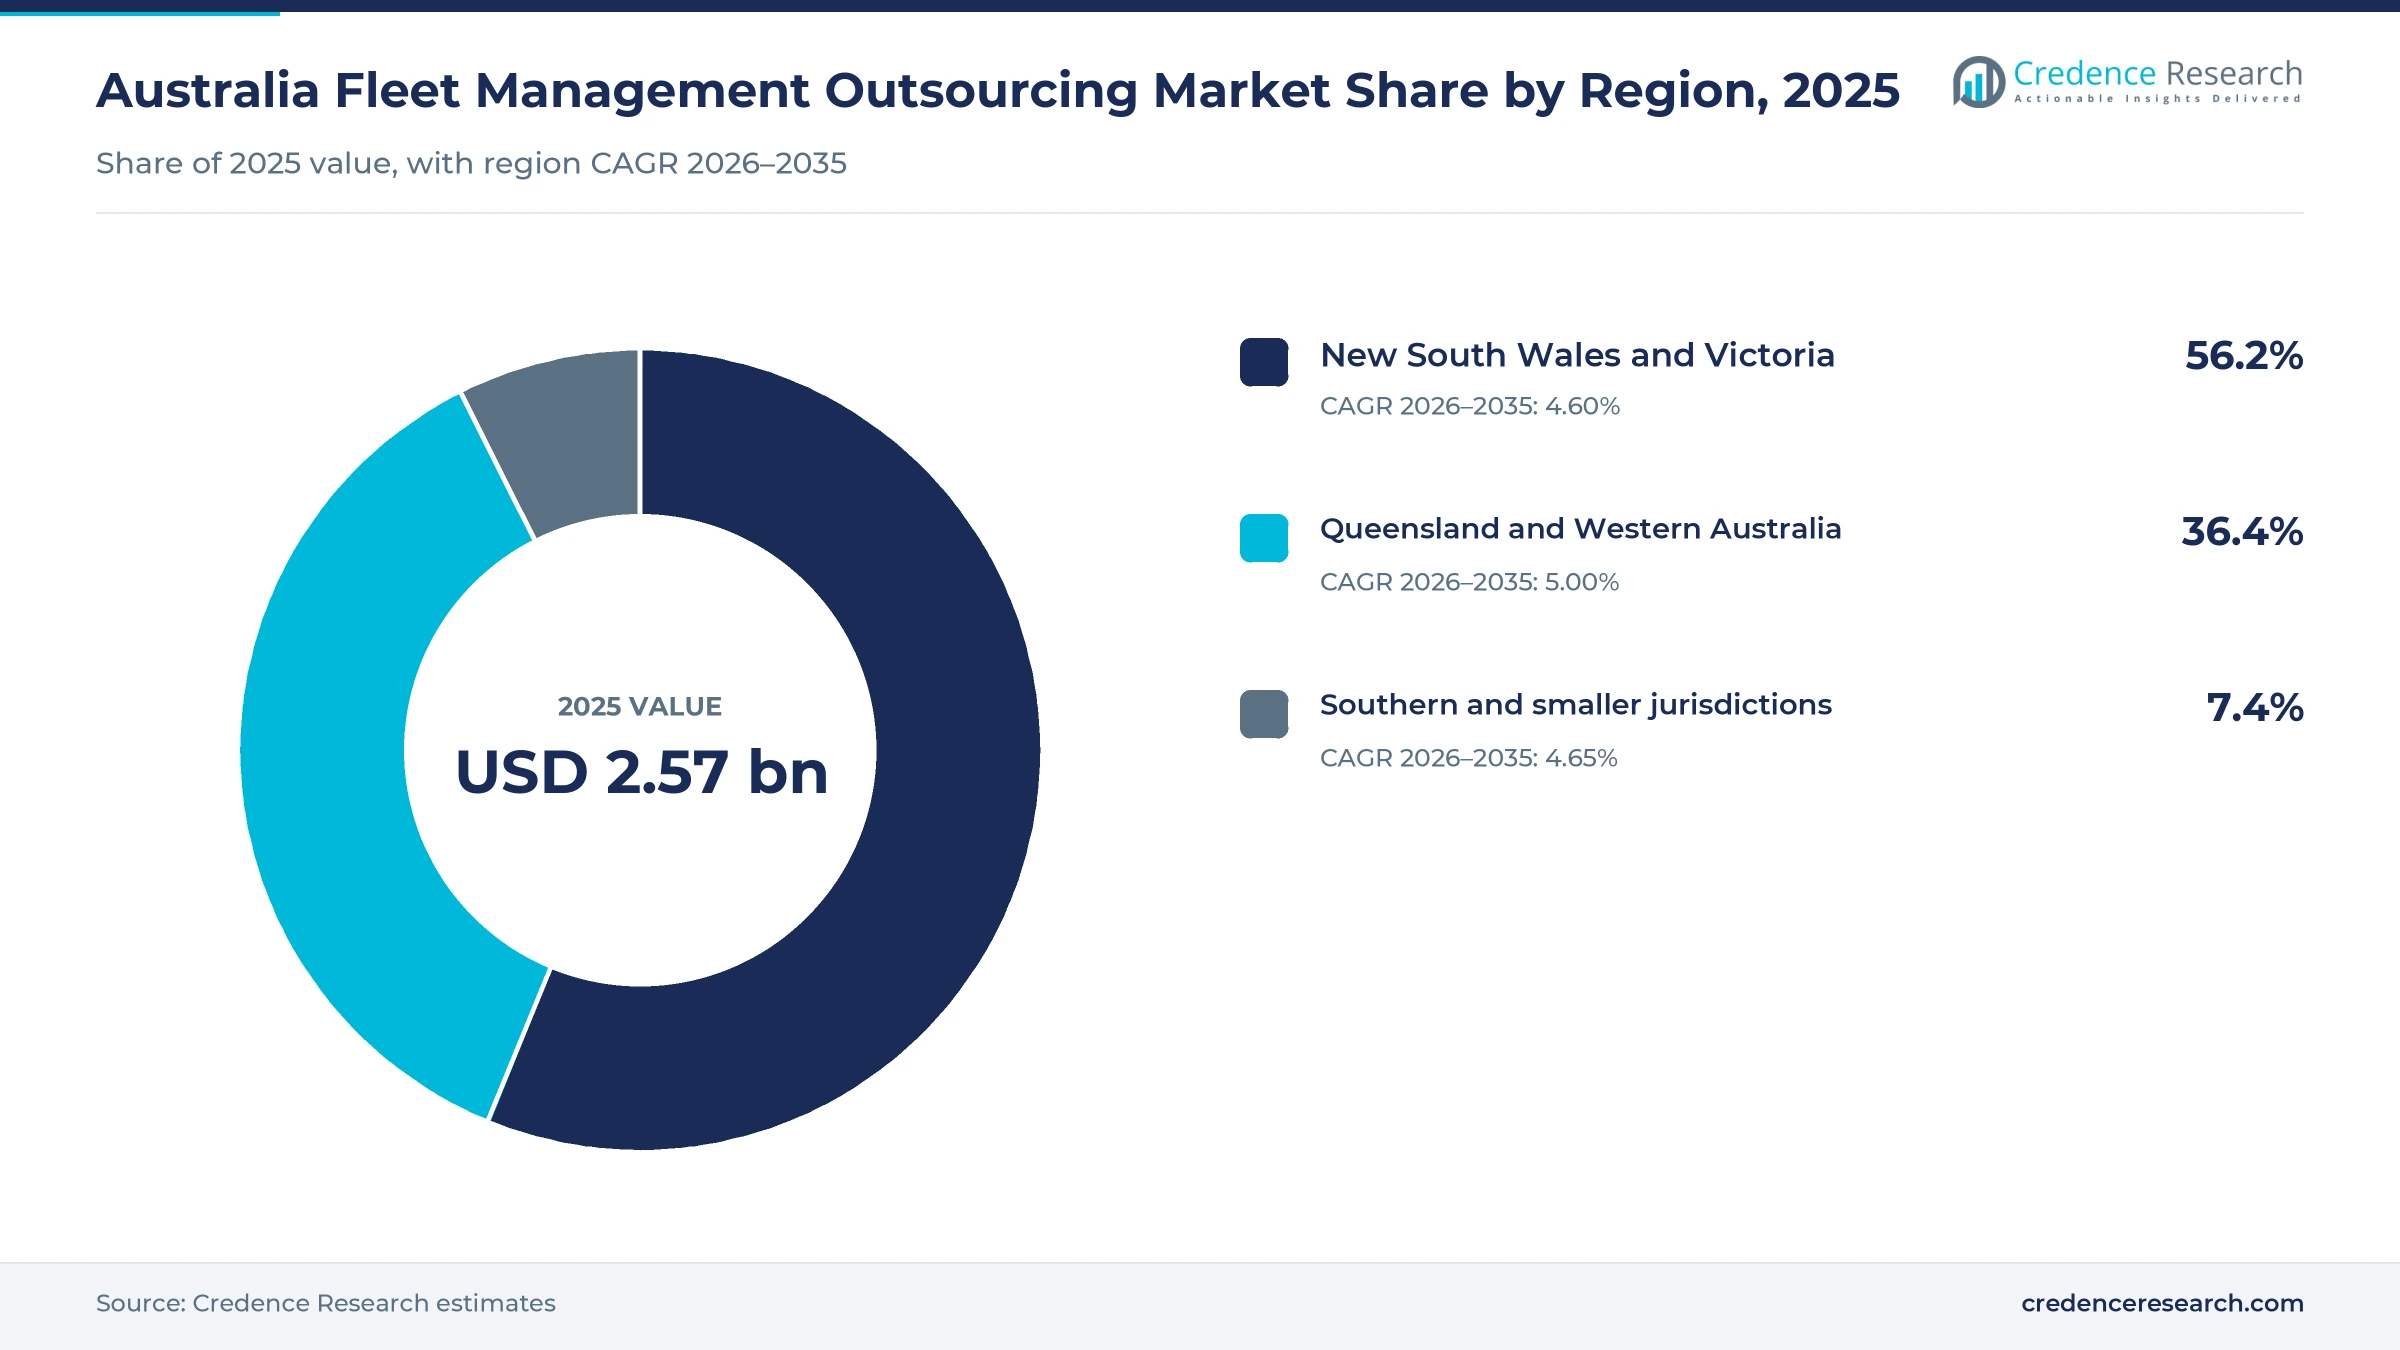
- New South Wales and Victoria held 56.2% of 2025 value, because Sydney and Melbourne host most corporate and public employers.
- Operating lease services led with 52.0% of 2025 value, since employers prefer fixed monthly rentals that bundle funding and upkeep.
- Plug-in hybrids lost the fringe benefits tax exemption from April 1, 2025, which shifted novated demand toward battery electric cars.
- Novated lease administration grows fastest at 5.58% a year during 2026–2035, as employees package electric cars through salary sacrifice.
Operating leases lead as novated administration grows
Why do operating leases lead vehicle services?
Based on service type, the market is categorized into operating lease services, novated lease administration and management-only services. Operating lease services led with 52.0% of 2025 value, because employers prefer fixed monthly rentals that bundle funding, maintenance and resale. Novated lease administration grows fastest at 5.58% a year, as employees package electric cars through salary sacrifice under current tax rules.
Which organizations outsource the most vehicles?
Based on customer type, the market is categorized into private-sector organizations, public-sector organizations and not-for-profit organizations. Private-sector organisations led with 68.0% of 2025 value, because large companies run the biggest car and van fleets. Not-for-profit organisations grows fastest at 5.35% a year, as charities and health providers use salary packaging benefits to attract and keep nurses, carers and other frontline staff.
How do employer programs change vehicle sales?
Based on sales channel, the market is categorized into direct enterprise sales, employer benefit programs and public procurement panels. Direct enterprise sales led with 47.0% of 2025 value, because large fleets negotiate leases directly with providers. Employer benefit programs grows fastest at 5.50% a year, as employers add novated leasing to staff benefit menus and providers sign more employers.
| Segment Group | Leading Sub-segment | Share, 2025 | Fastest-growing Sub-segment | CAGR, 2026–2035 |
|---|---|---|---|---|
| By Service Type | Operating lease services | 52.0% | Novated lease administration | 5.58% |
| By Customer Type | Private-sector organisations | 68.0% | Not-for-profit organisations | 5.35% |
| By Sales Channel | Direct enterprise sales | 47.0% | Employer benefit programs | 5.50% |
Request a Free Sample
Fill in your details and we'll send you a free sample report.
- Sample data tables & charts
- Research methodology
Tax rules, employer reach and compliance lift demand
How does electric car demand drive novated administration?
Electric car demand drives novated administration, because the tax exemption makes leased electric cars cheaper for employees. Electric cars reached around 15% of new car sales in 2025, according to the IEA. Battery electric sales passed 100,000 for the first time at 103,300 units, and total electric sales rose 38% to more than 157,000, according to the Electric Vehicle Council. At FleetPartners, 60% of novated new business in fiscal 2025 involved battery or plug-in hybrid cars, up from 53%. As a result, novated lease administration posts the fastest service CAGR at 5.58% during 2026–2035. Providers that bundle charging, insurance and servicing into one payroll deduction win more employee orders.
Why is the organizational client base expanding?
The organizational client base is expanding, because population growth and new businesses add employers that need cars and vans. The national population rose 1.4% to 27.9 million in the year to March 31, 2026. Australia also had 20.1 million registered motor vehicles at Jan. 31, 2021, which shows the size of the replacement base. New vehicle sales reached 1,220,607 units in 2024, up 0.3% on the prior year. In November 2025, FleetPartners agreed to acquire Remunerator, a salary packaging provider with about 2,300 vehicles under management. Consequently, employer benefit programs post the fastest channel CAGR at 5.50%, as providers reach smaller employers.
How do compliance rules shape institutional vehicle demand?
Compliance rules shape institutional vehicle demand, because agencies and large companies must now report and cut vehicle emissions. The New Vehicle Efficiency Standard began on Jan. 1, 2025, setting average carbon dioxide targets for each maker. Federal agencies set a goal that 75% of new passenger vehicle orders be low emission vehicles by 2025, according to the Department of Finance. Large companies also began mandatory climate reporting for periods starting on or after Jan. 1, 2025, with a second group following from July 1, 2026. As a result, organizations outsource data, charging and replacement planning to specialists. This demand supports operating lease services, which hold a 52.0% share of 2025 value.
Why do longer leases and stable portfolios support providers?
Longer leases and stable portfolios support providers, because clients that outsource vehicles rarely bring them back in-house. At FleetPartners, the average operating lease term was 3.9 years in fiscal 2025. About 80% of leases stayed on book from the start to the end of the year, which shows strong client retention. Average novated assets at the same company grew 17% in fiscal 2025, the strongest of any business unit. Consequently, providers can plan funding, resale and servicing over several years with fewer surprises for clients and drivers. This stability helps private-sector organizations keep a 68.0% share of 2025 value across customer types.
Consolidation, battery cars and public targets rise
How is the rise of provider consolidation playing out?
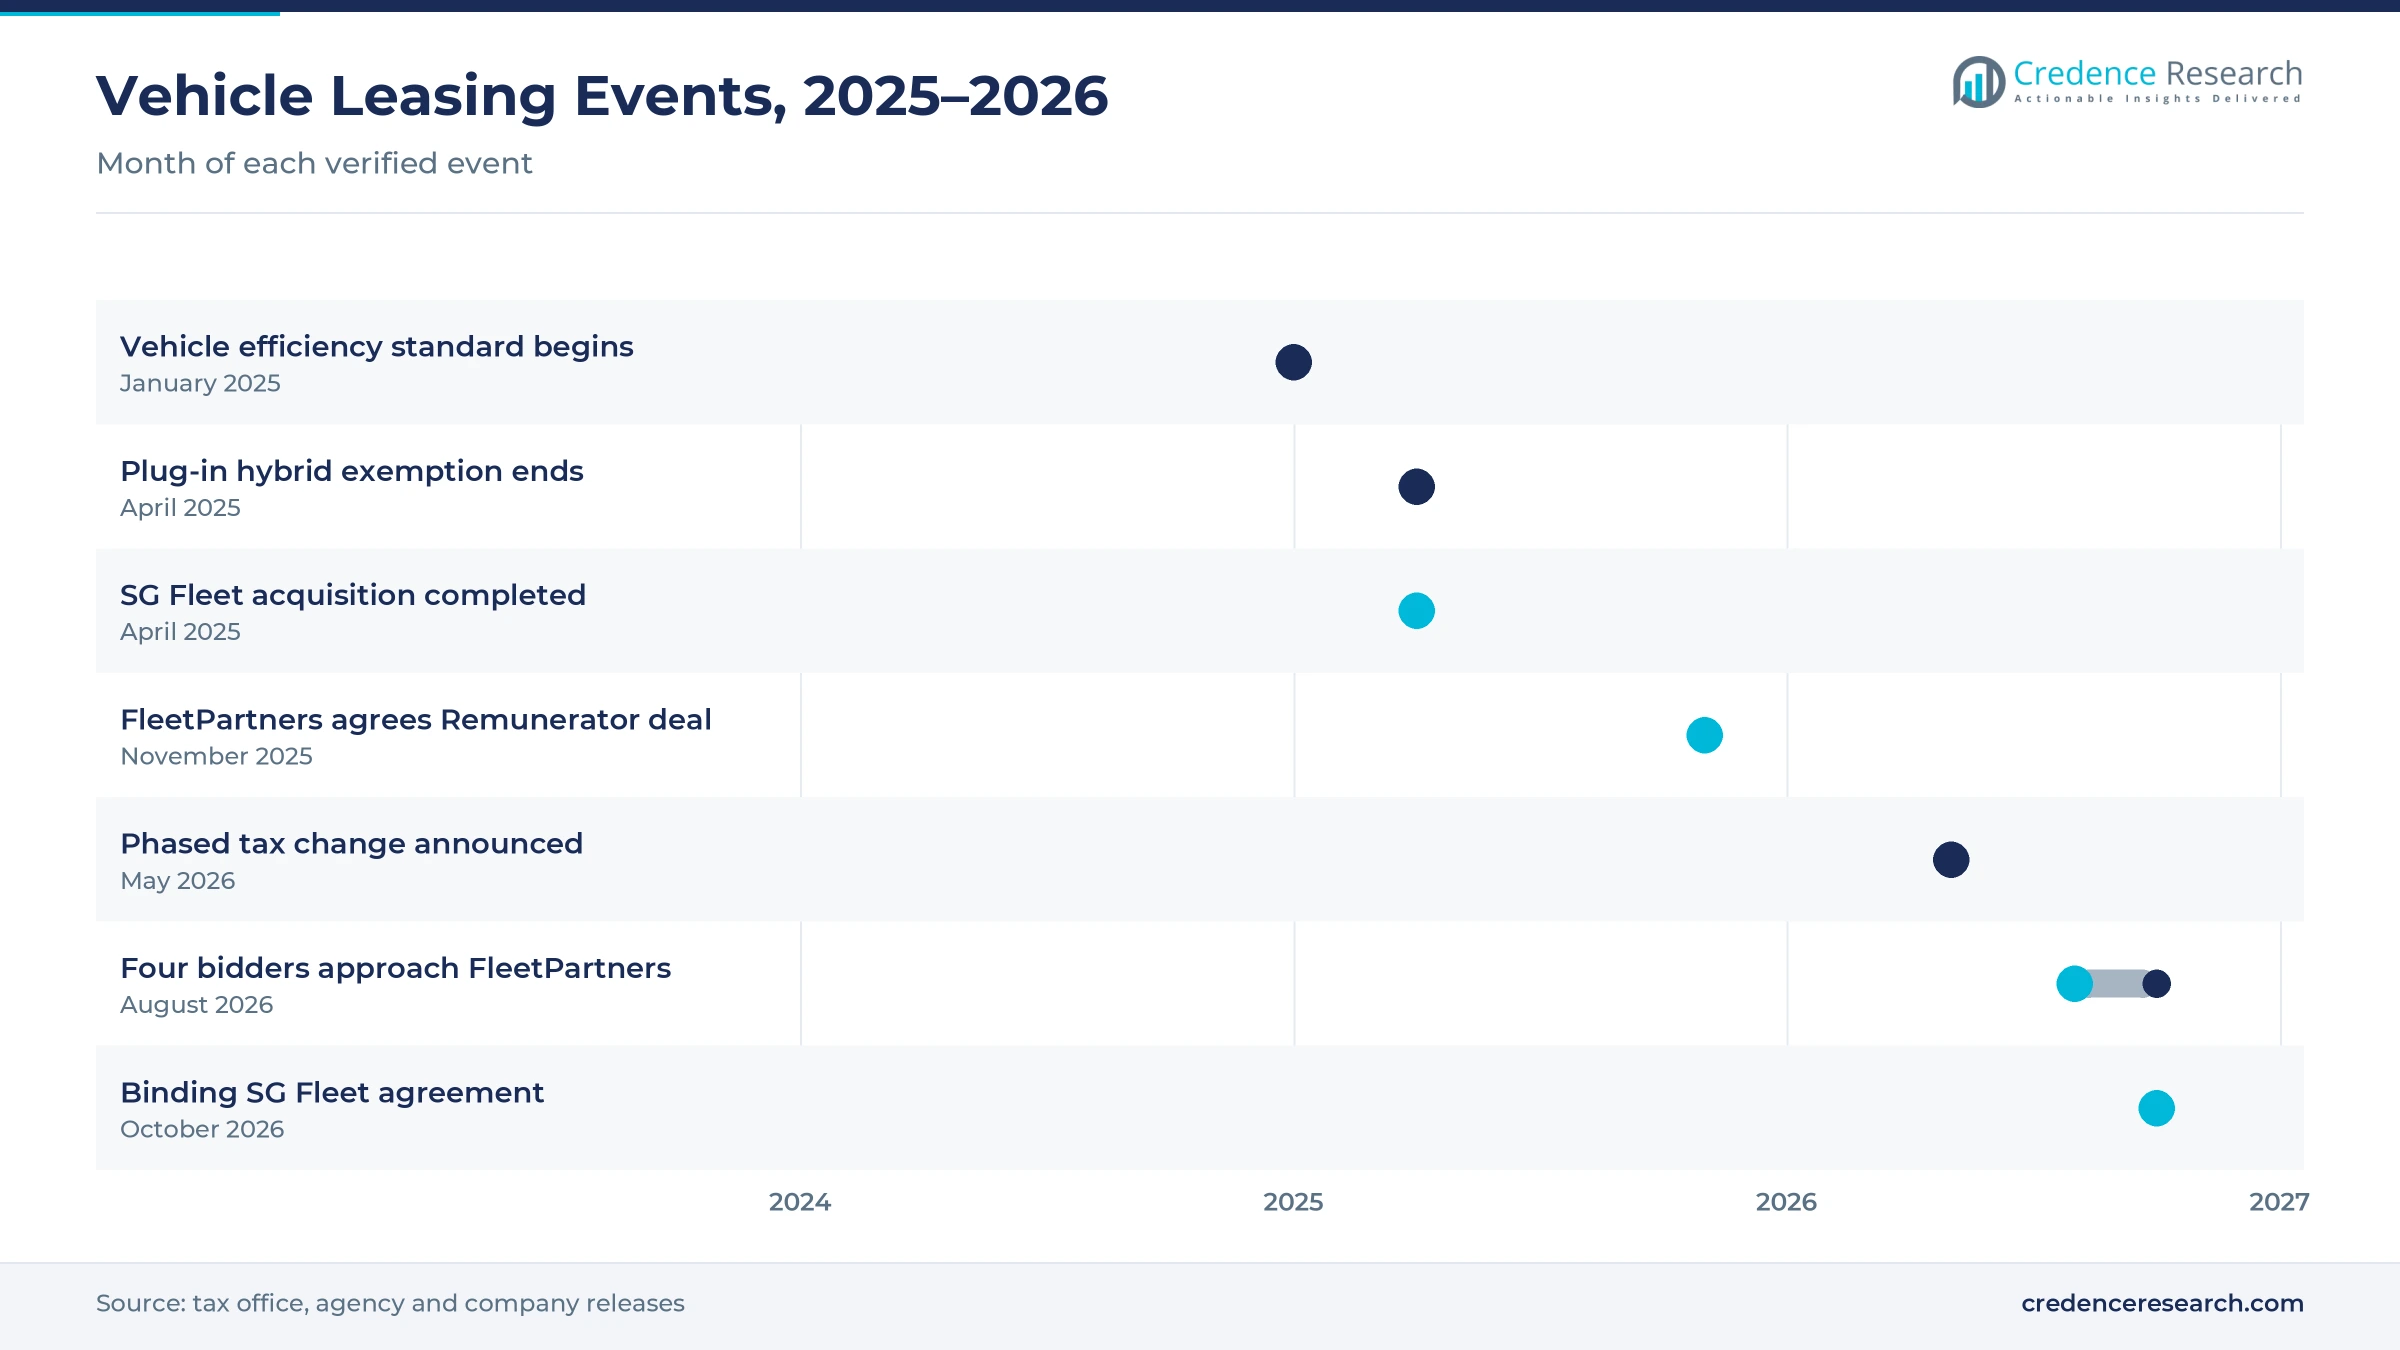
Provider consolidation is rising, because scale lowers funding costs and spreads technology spending across more vehicles. On April 30, 2025, a company controlled by Pacific Equity Partners completed its acquisition of SG Fleet. In August 2026, FleetPartners received approaches from SG Fleet, ORIX, Element Fleet and a Sumitomo-led consortium. On Oct. 19, 2026, FleetPartners signed a binding agreement with SG Fleet, and its board recommended the scheme. Earlier, in November 2025, FleetPartners agreed to buy Remunerator, which adds about 2,300 vehicles under management. As a result, a few large groups will manage a growing share of leased cars and novated packages. Clients may gain wider service networks, although fewer bidders could reduce price competition in large tenders.
Why is the shift from hybrids to battery cars rising?
The shift from plug-in hybrids to battery cars is rising, because tax rules now favor fully electric models. From April 1, 2025, plug-in hybrids no longer count as zero or low emission cars for the exemption, according to the tax office. Only hybrids with binding commitments made before that date keep the benefit. In May 2026, the government said cars under AUD 75,000 stay fully exempt from April 1, 2027, to March 31, 2029. From April 1, 2029, eligible electric cars receive a permanent 25% discount instead of the full exemption. Consequently, employees order battery cars earlier, and providers expand charging infrastructure offers.
Can connected vehicle data open new service income?
Connected vehicle data opens a clear opening, because fleets want trip, charging and safety records in one place. Battery electric sales passed 103,300 units in 2025, which adds cars that report charging data. The New Vehicle Efficiency Standard from Jan. 1, 2025, also pushes makers to supply more battery electric vehicles each year. Mandatory climate reporting for a third group of companies begins on July 1, 2027, which raises demand for verified fuel and energy records. In turn, providers that add vehicle telematics to management-only services can charge for reports and driver coaching. Clients then receive monthly records that auditors and safety managers can use directly.
Is there room to grow with public and not-for-profit employers?
Public and not-for-profit employers offer a second opening, because both groups use salary packaging to attract staff. Federal agencies aimed for 75% of new passenger vehicle orders to be low emission vehicles by 2025. Remunerator, bought by FleetPartners in November 2025, has served the salary packaging market for more than 30 years. Toyota Fleet Management marked 10 years of partnership with the national fleet association in May 2025, supporting nine scholarships from 2020 to 2025. As a result, not-for-profit organizations post the fastest customer CAGR at 5.35%. Providers that join public panels and charity benefit schemes can widen their reach.
Tax taper, resale values and integration test providers
How will the tax taper affect novated orders?
The tax taper will affect novated orders, because electric cars above AUD 75,000 lose the full exemption from April 1, 2027. From April 1, 2029, all eligible electric cars move to a 25% discount, which raises the cost for employees. As a result, orders may rise before each change and slow afterward. Providers can reduce this swing by offering lower-priced models and clear cost comparisons. Employers can also explain the new rules early so staff plan orders calmly.
Why do resale values create risk for lessors?
Resale values create risk for lessors, because operating lease prices depend on what cars sell for at the end of the term. At FleetPartners, units sold at end of lease fell 10% in fiscal 2025 as earlier new business volumes declined. Electric car prices also change quickly as new models arrive. Consequently, lessors set more cautious resale estimates, which can raise monthly rentals for clients. Better pricing data and remarketing channels help limit losses when used car prices fall.
How does consolidation raise integration risk?
Consolidation raises integration risk, because merged providers must combine systems, funding lines and client teams. The SG Fleet agreement to acquire FleetPartners in October 2026 joins two large novated businesses. In turn, clients may face changes to portals, account managers and contract terms. Careful migration plans and clear service guarantees reduce disruption for employers and drivers. Regulators and shareholders also review such deals before they complete, which adds time to the process.
Will charging access slow electric fleet adoption?
Charging access can slow electric fleet adoption, because many drivers lack home chargers and field fleets travel long distances. Regional and remote areas still have fewer public fast chargers than capital cities. As a result, some fleets keep diesel utes and vans for longer. Providers can respond with home charger installation, charging cards and route planning tools for drivers. Over time, more regional fast chargers should reduce this barrier for field fleets.
Sydney and Melbourne lead as the north and west expand
| Region | Value, 2025 (USD billion) | Share, 2025 | CAGR, 2026–2035 |
|---|---|---|---|
| New South Wales and Victoria | 1.45 | 56.2% | 4.60% |
| Queensland and Western Australia | 0.94 | 36.4% | 5.00% |
| Southern and smaller jurisdictions | 0.19 | 7.4% | 4.65% |
Why do New South Wales and Victoria lead leasing?
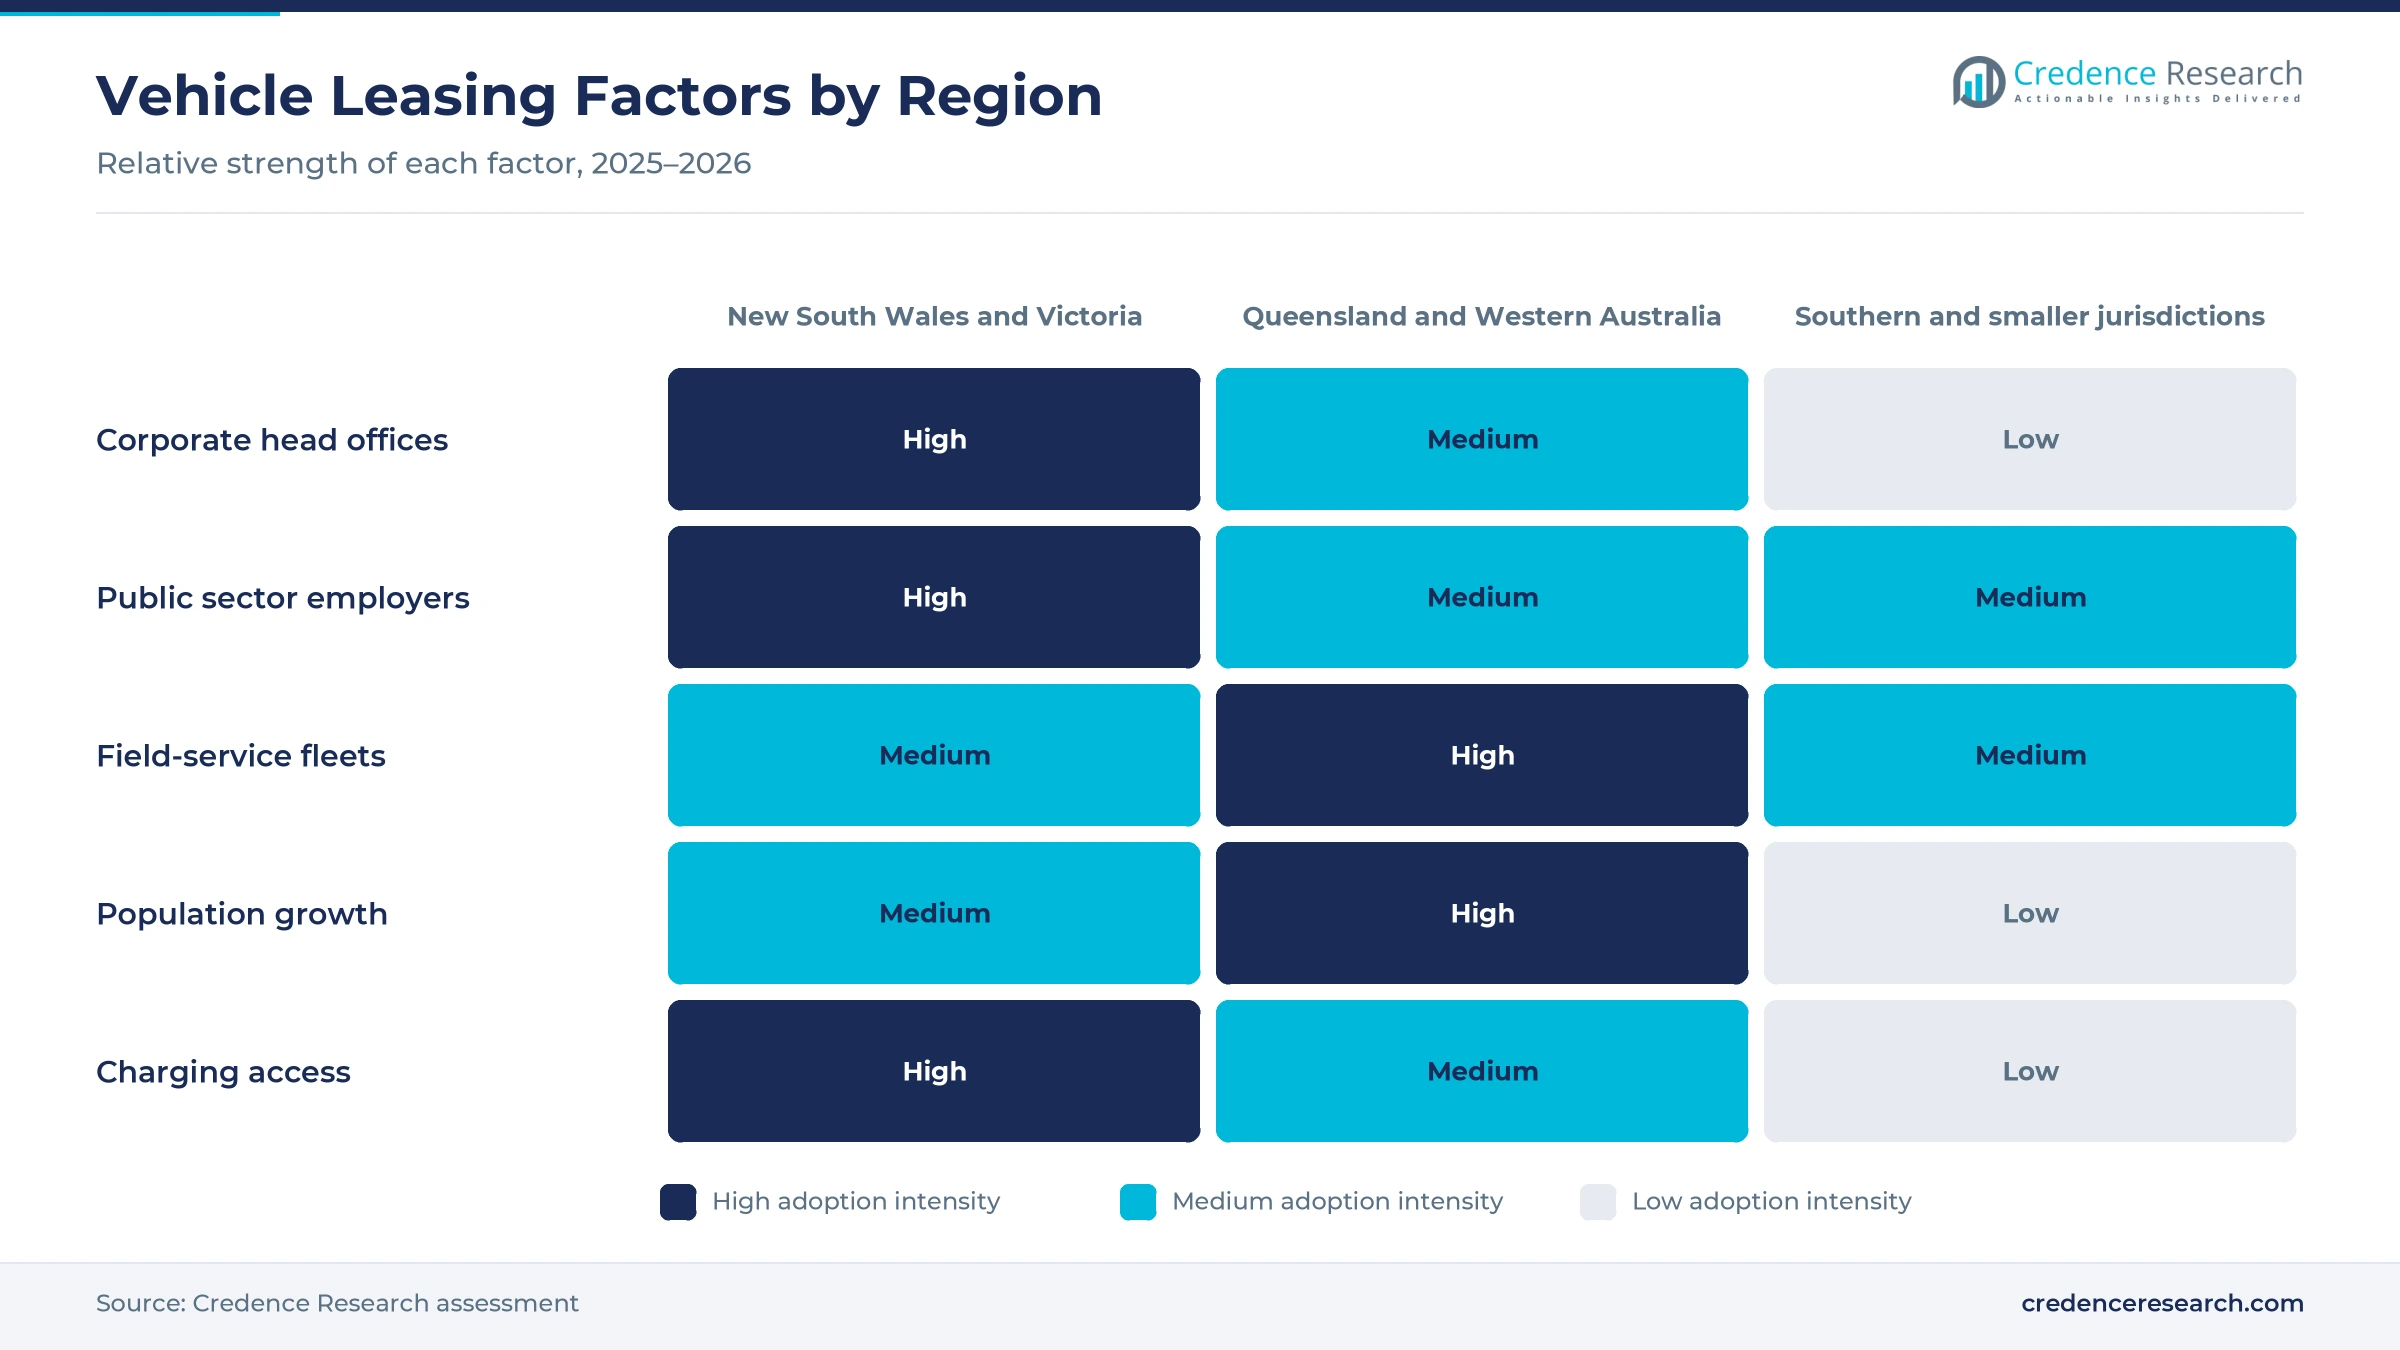
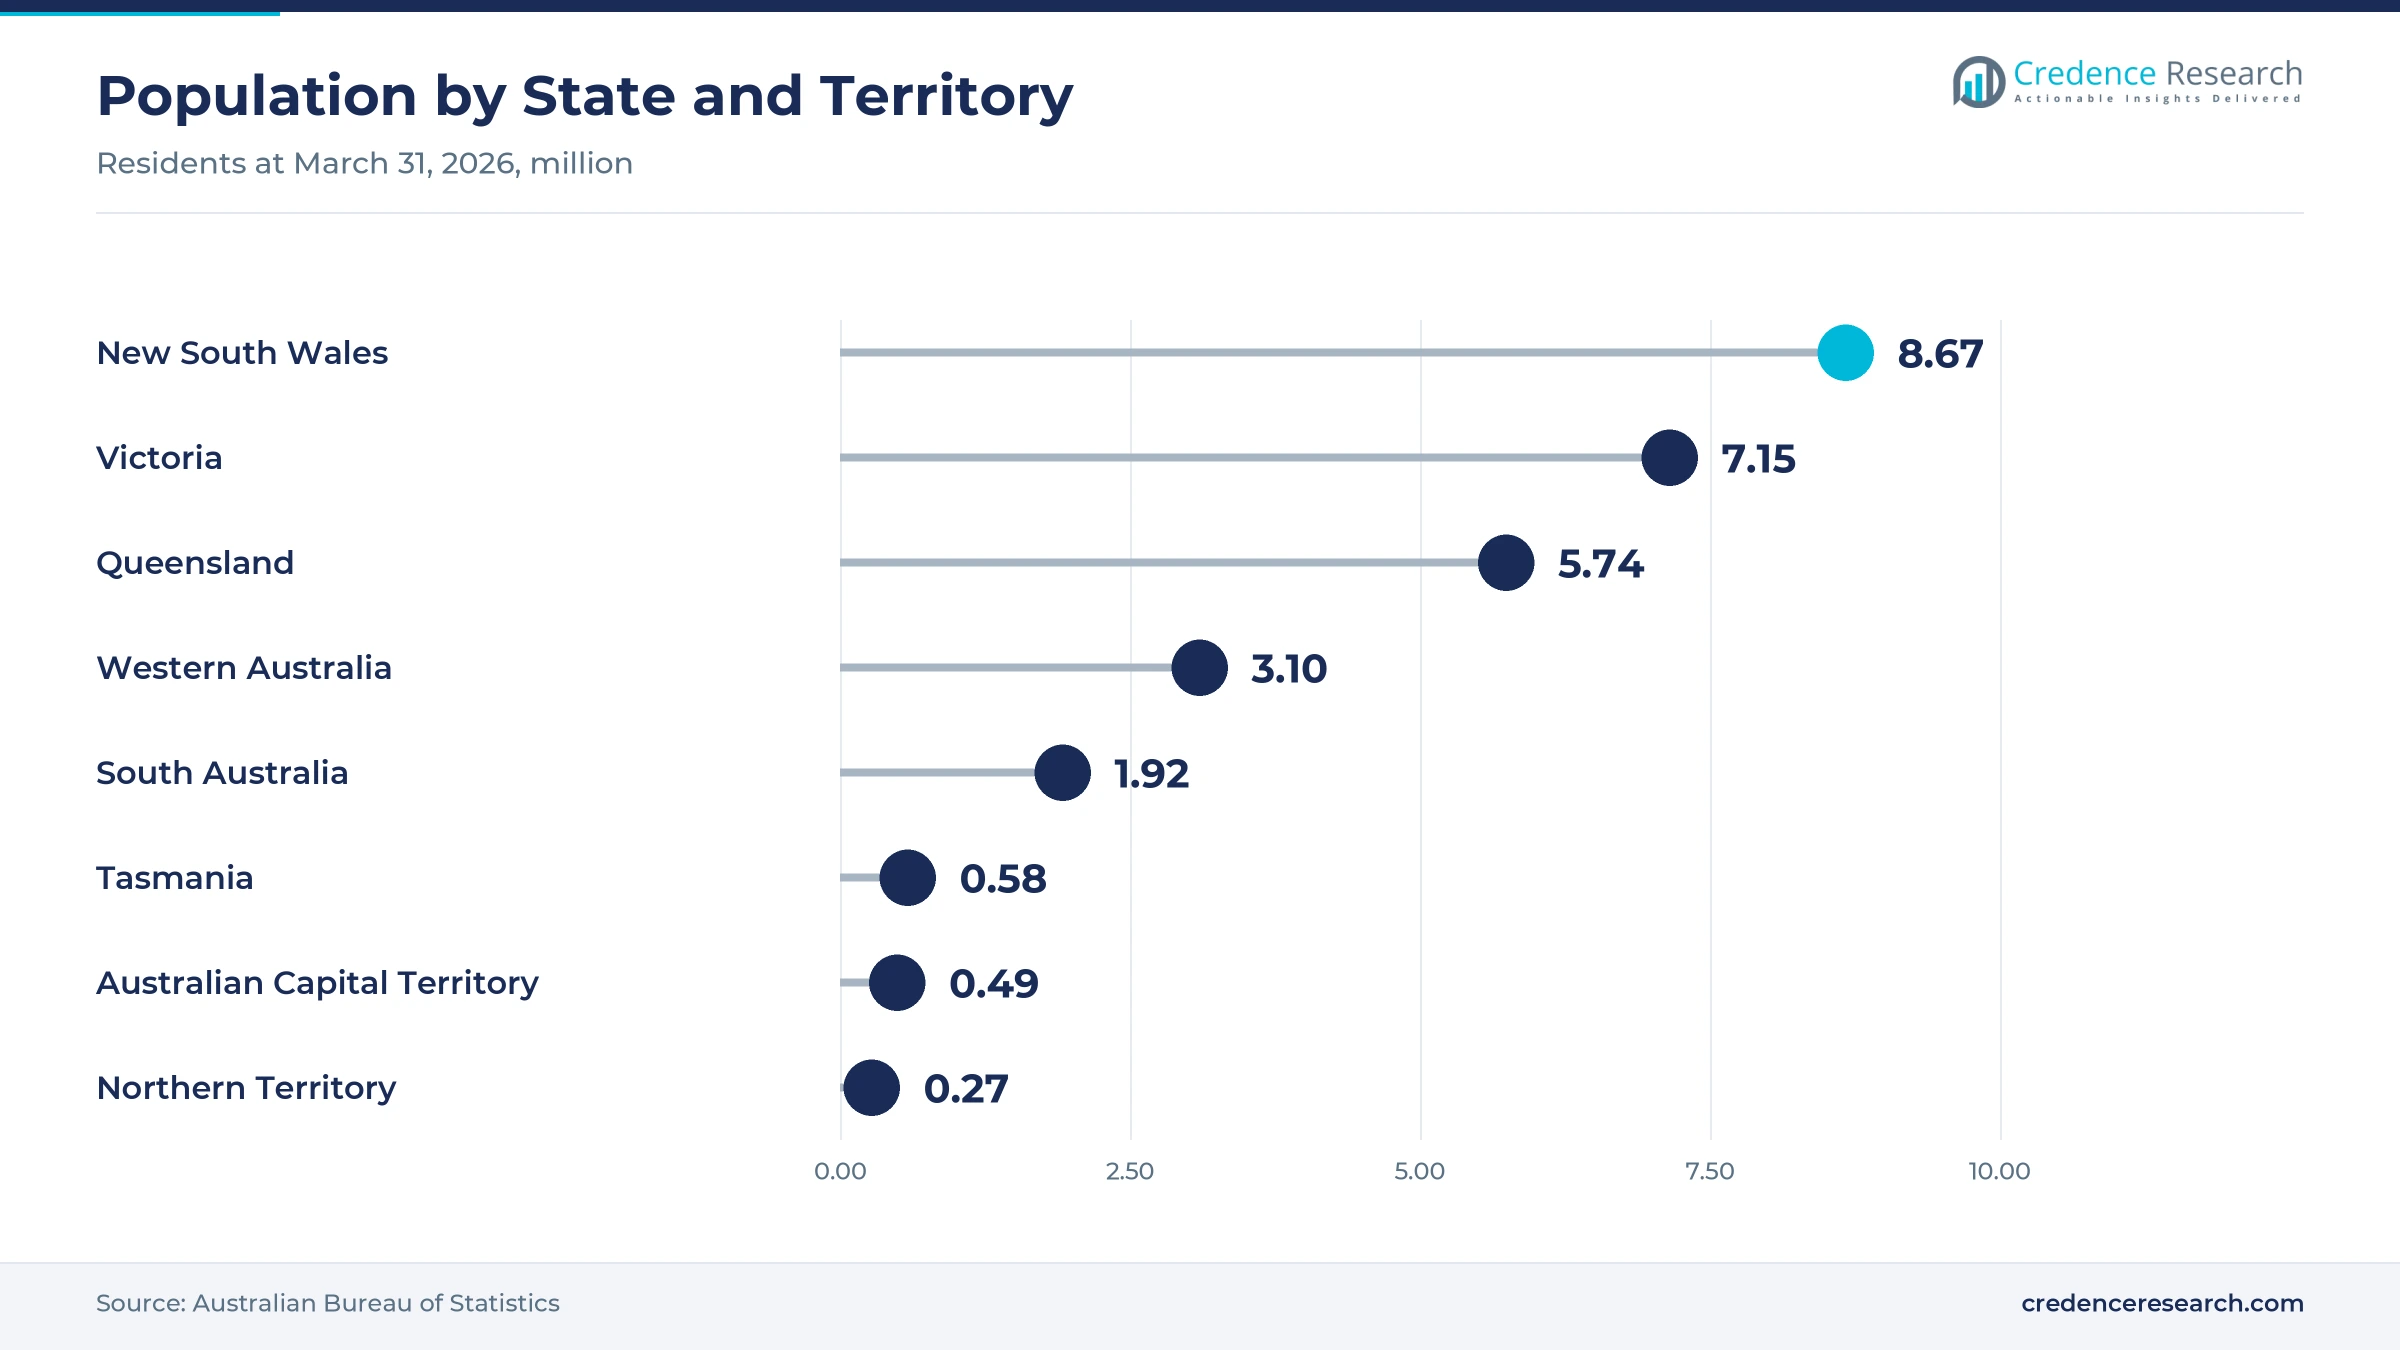
New South Wales and Victoria held a 56.2% share of 2025 value and grow at 4.60% a year. Sydney and Melbourne host most corporate head offices, federal agencies and large health employers. The two states had 8.67 million and 7.15 million residents at March 31, 2026, according to official statistics. As a result, this zone keeps the largest share through 2035. Large employers here also run the biggest novated programs for staff.
Why do Queensland and Western Australia grow fastest?
Queensland and Western Australia held a 36.4% share of 2025 value and grow fastest at 5.00% a year. Western Australia grew 2.1% to 3.10 million residents in the year to March 2026, faster than any other state. Queensland grew 1.6% over the same year to reach 5.74 million residents. In turn, mining, construction and field-service fleets add vans and utes that providers lease and maintain. Long distances between sites also raise demand for telematics and maintenance control.
How do southern and smaller jurisdictions add demand?
Southern and smaller jurisdictions held a 7.4% share of 2025 value and grow at 4.65% a year. This zone covers South Australia, Tasmania and the two territories. Tasmania grew slowest at 0.6% in the year to March 2026, while the capital territory grew 1.3%. Therefore, public agencies and car rental operators shape demand more than new residents. Canberra agencies also buy vehicles through federal procurement panels that favor low emission models.
Takeovers, tax changes and targets from 2025 to 2026
| Development | Status and market relevance |
|---|---|
| In January 2025, the New Vehicle Efficiency Standard began, setting average carbon dioxide targets for new cars. | Pushes makers to supply more electric models |
| In April 2025, Pacific Equity Partners completed its acquisition of SG Fleet, and plug-in hybrids lost the tax exemption. | Shifts novated demand toward battery cars |
| In November 2025, FleetPartners agreed to acquire Remunerator, a salary packaging and novated leasing provider. | Adds about 2,300 vehicles under management |
| In May 2026, the federal government announced a phased change to the electric car tax exemption from April 2027. | Existing leases are not affected by the change |
| In October 2026, FleetPartners signed a binding agreement to be acquired by SG Fleet after a four-way contest. | Board recommends the scheme to shareholders |
Telematics, charging data and portals change upkeep
- Connected vehicle telematics report trips, location and driver behavior, which helps clients cut fuel use, improve safety and check private use.
- Charging data platforms record home and public charging sessions, which lets providers reimburse drivers and report energy use accurately.
- Self-service driver portals let employees compare cars, sign leases and book servicing online, which shortens order times for novated packages.
- Resale pricing analytics estimate end-of-lease values for electric and fuel cars, which helps lessors set fair monthly rentals.
Need a Custom Version of This Report?
Tailor the scope, geography, or segments to your exact requirements.
- Custom geography or segment scope
- Direct access to our analyst team
Lessors and novated specialists compete for employers
Competition combines large lessors, novated specialists, maker-owned services and global fleet groups that sell funding, administration and maintenance control. SG Fleet has been owned by Pacific Equity Partners since April 2025 and signed a binding agreement to acquire FleetPartners in October 2026. FleetPartners grew novated assets 17% in fiscal 2025 and bought Remunerator in November 2025. ORIX Australia bid for FleetPartners in August 2026, which shows its interest in novated scale. Toyota Fleet Management serves fleets of all sizes through dealers and corporate account teams. Custom Fleet, the Australian unit of Element Fleet Management, competes for large corporate fleets, and its parent also bid in 2026. Companies compete on funding costs, resale skill, electric car range, driver portals, employer reach and service networks across states.
Companies profiled and their roles in this market
| Company | Type | Role in the market |
|---|---|---|
| SG Fleet | Lessor and novated provider | Owned by Pacific Equity Partners; agreed to acquire FleetPartners in 2026 |
| FleetPartners Group | Lessor and novated provider | 60% of fiscal 2025 novated new business in battery or plug-in cars |
| ORIX Australia | Lessor and novated provider | Bid for FleetPartners in August 2026 |
| Toyota Fleet Management | Maker-owned lessor | Serves fleets through dealers and corporate account teams |
| Custom Fleet | Fleet lessor and manager | Australian unit of Element Fleet Management |
Credence Research view on employer vehicle leasing
Credence Research's view is that Australian vehicle leasing will grow steadily through 2035, as employers outsource funding, administration and emissions reporting to specialists. Operating leases should keep the largest share, while novated administration gains most as employees package electric cars. Consolidation will create fewer, larger providers with lower funding costs. However, the tax taper from 2027, resale value swings and charging gaps outside cities will test pricing and demand. Providers with low funding costs and strong resale skills will be best placed for fleet management outsourcing contracts.
How the vehicle leasing estimate was built
The fleet management outsourcing report uses 2025 as the base year, with values in USD million at current prices. Market values come from the Credence Research model, which combines vehicle sales, leased fleet size, rental and fee levels and novated penetration. Regional shares and segment splits by service type, customer type and sales channel are Credence Research estimates. Sources used are official statistics, tax office and agency releases, company statements and news reports, and no interviews or surveys were used.
Electric leases and tax settings set the path to 2035
The fleet management outsourcing market is expected to reach USD 4.11 billion by 2035, a 4.75% CAGR during 2026–2035, as more employers lease vehicles and offer salary packaging to staff. Growth should be strongest in novated administration, employer benefit programs and the northern and western states, while New South Wales and Victoria keep the largest share. Electric cars, telematics and emissions reporting will add services each year. In contrast, a sharp tax change or weak resale prices could slow new leases.
Frequently Asked Questions
How big is the Australia fleet management outsourcing market?
Which region leads vehicle leasing in Australia?
Which region grows fastest?
Which service type holds the largest share?
What changed for plug-in hybrid novated leases?
Which service type grows fastest?
Who are the leading companies in this market?
What are the main risks to growth?
Table of Content
Chapter 1 Market Segmentation
- 1.1 Segmentation Framework
- 1.1.1 Product and Service Classification
- 1.1.2 Application and End-Use Classification
- 1.1.3 Technology and Solution Classification
- 1.1.4 Customer and Distribution Channel Classification
- 1.1.5 Geographic Segmentation
- 1.1.6 Market Segment Definitions and Boundaries
- 1.2 By Service Type
- 1.2.1 Operating lease services
- 1.2.2 Novated lease administration
- 1.2.3 Management-only services
- 1.3 By Customer Type
- 1.3.1 Private-sector organisations
- 1.3.2 Public-sector organisations
- 1.3.3 Not-for-profit organisations
- 1.4 By Sales Channel
- 1.4.1 Direct enterprise sales
- 1.4.2 Employer benefit programs
- 1.4.3 Public procurement panels
Chapter 2 Introduction
- 2.1 Report Objectives and Scope
- 2.2 Product Definition and Industry Terminology
- 2.3 Market Inclusions and Exclusions
- 2.4 Research Process
- 2.4.1 Primary Research and Expert Interviews
- 2.4.2 Secondary Research and Source Review
- 2.4.3 Top-Down and Bottom-Up Estimation
- 2.4.4 Data Triangulation and Verification
- 2.5 Market Size Measurement Basis
- 2.5.1 2025: USD 2.57 billion → 2035: USD 4.11 billion
- 2.6 Historical and Forecast Reference Periods
- 2.6.1 Historical Period: 2018-2025
- 2.6.2 Base Year: 2025
- 2.6.3 Forecast Period: 2025-2035
- 2.7 Research Assumptions and Limitations
Chapter 3 Executive Summary
- 3.1 Market Snapshot and Key Findings
- 3.2 Base-Year Market Size, 2025
- 3.3 Forecast Market Size, 2035
- 3.4 Revenue and Volume Growth Outlook
- 3.5 Key Demand and Supply Indicators
- 3.6 Leading Market Segments
- 3.7 Fastest-Growing Market Opportunities
- 3.8 Regional Performance Highlights
- 3.9 Technology and Industry Transformation
- 3.10 Competitive Landscape Summary
- 3.11 Analyst View and Strategic Implications
Chapter 4 Australia Fleet Management Outsourcing Market Trends and Developments
- 4.1 Historical Industry Development, 2018-2025
- 4.2 Recent Market Trends and Developments
- 4.3 Demand and Customer Behavior Trends
- 4.4 Technology and Product Innovation
- 4.5 Artificial Intelligence, Automation and Digitalization
- 4.6 Local Manufacturing and Supply Chain Realignment
- 4.7 Industry Partnerships, Mergers and Acquisitions
- 4.8 Sustainability and Circular Economy Developments
- 4.9 Government and Private Sector Investment Trends
- 4.10 Emerging Business Models and Commercialization
- 4.11 Industry Developments and Announcements
Chapter 5 Australia Fleet Management Outsourcing Market Supply and Demand Analysis
- 5.1 Demand Trend and Consumption Analysis, 2018-2025
- 5.2 Demand Forecast, 2025-2035
- 5.3 Supply Chain Structure and Procurement Trends
- 5.4 Supply-Demand Gap and Bottlenecks
- 5.5 Import Dependence and Sourcing Structure
- 5.6 Regional Supply and Demand Concentration
Chapter 6 Australia Fleet Management Outsourcing Market Pricing Analysis
- 6.1 Pricing Structure and Measurement
- 6.2 Historical Pricing Trends, 2018-2025
- 6.3 Pricing Outlook, 2025-2035
- 6.4 Pricing by Product and Market Segment
- 6.5 Geographic Pricing Differences
- 6.6 Key Input, Energy, Labor and Logistics Costs
- 6.7 Contract Pricing and Purchasing Models
- 6.8 Pricing Sensitivity and Competitive Positioning
- 6.9 Price, Margin and Profitability Implications
Chapter 7 Australia Fleet Management Outsourcing Market Dynamics
- 7.1 Market Growth Drivers
- 7.1.1 Demand-Side Drivers
- 7.1.2 Technology and Innovation Drivers
- 7.1.3 Infrastructure and Investment Drivers
- 7.1.4 Regulatory and Policy Drivers
- 7.2 Market Restraints
- 7.2.1 Cost and Affordability Constraints
- 7.2.2 Technology and Adoption Barriers
- 7.2.3 Supply Chain and Operational Constraints
- 7.3 Market Challenges
- 7.3.1 Competitive Pressure and Margin Erosion
- 7.3.2 Skills, Infrastructure and Implementation Gaps
- 7.4 Emerging Market Opportunities
- 7.5 Market Dynamics Impact and Time-Horizon Assessment
Chapter 8 Australia Fleet Management Outsourcing Value Chain Analysis
- 8.1 Industry Value Chain Overview
- 8.2 Upstream Suppliers and Critical Inputs
- 8.3 Technology and Component Providers
- 8.4 Manufacturing or Service Delivery
- 8.5 Distribution, Channel Partners and Integrators
- 8.6 Downstream Applications and End Users
- 8.7 Value Addition and Profit Pools
- 8.8 Vertical Integration and Outsourcing
- 8.9 Supplier Concentration and Risk
- 8.10 Supply Chain Localization and Resilience
Chapter 9 Australia Fleet Management Outsourcing Market Regulations and Policies
- 9.1 Relevant Laws, Standards and Compliance Frameworks
- 9.2 Product, Service, Safety and Quality Requirements
- 9.3 Government Policies, Incentives and Subsidies
- 9.4 Imports, Exports and Trade Barriers
- 9.5 Public Procurement and Local Content Requirements
- 9.6 Data Protection, AI and Cybersecurity Compliance
- 9.7 Upcoming Policy Changes and Market Implications
Chapter 10 Australia Fleet Management Outsourcing Market Hotspots and Opportunities
- 10.1 Market Opportunity Mapping and Growth Hotspots
- 10.2 High-Growth Applications and Customer Groups
- 10.3 Underserved Markets and White-Space Opportunities
- 10.4 Emerging Technology and Product Opportunities
- 10.5 New Capacity and Investment Hotspots
- 10.6 Market Entry and Expansion Opportunities
- 10.7 Distribution and Partnership Opportunities
- 10.8 Near-Term and Long-Term Commercial Potential
- 10.9 Opportunity Attractiveness and Execution Risks
Chapter 11 Australia Fleet Management Outsourcing Market Outlook, 2025-2035
- 11.1 Market Size and Analysis
- 11.1.1 Revenue (Market Measurement: 2025: USD 2.57 billion → 2035: USD 4.11 billion)
- 11.1.2 Historical Market Size, 2018-2025
- 11.1.3 Base-Year Market Size, 2025
- 11.2 Market Forecast, 2025-2035
- 11.2.1 Revenue Forecast to 2035
- 11.2.2 CAGR and Year-on-Year Growth
- 11.2.3 Incremental Revenue Opportunity
- 11.3 Forecast Assumptions and Scenario Analysis
- 11.3.1 Base-Case Forecast
- 11.3.2 Optimistic and Conservative Scenarios
- 11.3.3 Technology, Pricing and Policy Sensitivities
- 11.4 Market Attractiveness and Growth Outlook
Chapter 12 Australia Fleet Management Outsourcing Market Segmentation and Outlook
- 12.1 Segmentation Summary and Market Shares, 2025
- 12.2 Largest and Fastest-Growing Segments
- 12.3 By Service Type - Market Size and Forecast, 2025-2035
- 12.3.1 Segment Definition and Scope
- 12.3.2 Historical Market Size, 2018-2025
- 12.3.3 Revenue Forecast, 2025-2035
- 12.3.4 Base-Year Market Share, 2025
- 12.3.5 Segment CAGR and Growth Drivers
- 12.3.6 Subsegment Market Size and Forecast
- 12.3.6.1 Operating lease services
- 12.3.6.2 Novated lease administration
- 12.3.6.3 Management-only services
- 12.3.7 Subsegment Pricing and Adoption Trends
- 12.3.8 Leading Suppliers and Competition
- 12.3.9 Regional Demand and Opportunities
- 12.4 By Customer Type - Market Size and Forecast, 2025-2035
- 12.4.1 Segment Definition and Scope
- 12.4.2 Historical Market Size, 2018-2025
- 12.4.3 Revenue Forecast, 2025-2035
- 12.4.4 Base-Year Market Share, 2025
- 12.4.5 Segment CAGR and Growth Drivers
- 12.4.6 Subsegment Market Size and Forecast
- 12.4.6.1 Private-sector organisations
- 12.4.6.2 Public-sector organisations
- 12.4.6.3 Not-for-profit organisations
- 12.4.7 Subsegment Pricing and Adoption Trends
- 12.4.8 Leading Suppliers and Competition
- 12.4.9 Regional Demand and Opportunities
- 12.5 By Sales Channel - Market Size and Forecast, 2025-2035
- 12.5.1 Segment Definition and Scope
- 12.5.2 Historical Market Size, 2018-2025
- 12.5.3 Revenue Forecast, 2025-2035
- 12.5.4 Base-Year Market Share, 2025
- 12.5.5 Segment CAGR and Growth Drivers
- 12.5.6 Subsegment Market Size and Forecast
- 12.5.6.1 Direct enterprise sales
- 12.5.6.2 Employer benefit programs
- 12.5.6.3 Public procurement panels
- 12.5.7 Subsegment Pricing and Adoption Trends
- 12.5.8 Leading Suppliers and Competition
- 12.5.9 Regional Demand and Opportunities
- 12.6 Segment Growth Comparison
- 12.7 Segment Attractiveness and Priority Matrix
Chapter 13 Australia Fleet Management Outsourcing End-Use and Application Market Outlook
- 13.1 End-Use Industry and Customer Demand Structure
- 13.2 Leading Applications and Customer Groups
- 13.3 End-Use Market Size, Share and Forecast
- 13.4 Major End-Use Industry Deep Dives
- 13.4.1 Customer Requirements and Use Cases
- 13.4.2 Demand and Replacement Cycles
- 13.4.3 Technical and Regulatory Considerations
- 13.4.4 Purchasing and Procurement Models
- 13.4.5 Leading Vendors and Distribution Channels
- 13.4.6 Forecast and Commercial Opportunities
- 13.5 Emerging Applications and Cross-Segment Demand
- 13.6 End-Use Industry Investment Priorities
Chapter 14 Australia Fleet Management Outsourcing Geographic Market Outlook, 2025-2035
- 14.1 Domestic Market Distribution and Demand Clusters
- 14.2 State- or Province-Wise Market Size and Forecast, 2025-2035
- 14.3 City and Metropolitan Market Outlook
- 14.4 Industrial, Manufacturing and Commercial Clusters
- 14.5 Geographic Concentration of Key End Users
- 14.6 Local Pricing and Purchasing Differences
- 14.7 Domestic Production Facilities and Capacity Map
- 14.8 Local Infrastructure and Project Pipeline
- 14.9 State-Level Policy and Incentive Differences
- 14.10 Subnational Investment Hotspots and Opportunities
- 14.11 Distribution and Logistics Networks
- 14.12 Domestic Competitive Footprint
Chapter 15 Australia Fleet Management Outsourcing Technology, Innovation and Sustainability Outlook
- 15.1 Technology Landscape and Maturity
- 15.2 Product, Process and Service Innovation
- 15.3 AI, Automation and Digital Tools in the Industry
- 15.4 Technology Adoption and Performance Benchmarking
- 15.5 Innovation Pipeline and R&D Investment
- 15.6 Energy Efficiency and Resource Management
- 15.7 Sustainability, Recycling and Circularity
- 15.8 Technology Roadmap, 2025-2035
- 15.9 Risks of Obsolescence and Technology Substitution
Chapter 16 Australia Fleet Management Outsourcing Market Key Strategic Imperatives
- 16.1 Growth and Market Entry Priorities
- 16.2 High-Return Products and Segments
- 16.3 Pricing, Profitability and Cost Optimization
- 16.4 Technology Investment and Product Differentiation
- 16.5 Supply Chain Localization and Resilience
- 16.6 Distribution and Customer Acquisition
- 16.7 Partnership, Acquisition and Capacity Strategy
- 16.8 Regional Expansion Priorities
- 16.9 Short-, Medium- and Long-Term Actions
Chapter 17 Competition Outlook
- 17.1 Industry Competition Characteristics
- 17.2 Market Structure and Concentration
- 17.3 Market Share and Competitive Positioning, 2025
- 17.4 Company-Wise Revenue and Product Benchmarking
- 17.5 Production and Service Capacity Benchmarking
- 17.6 Technology, Pricing and Differentiation
- 17.7 Regional Footprint and Distribution Strength
- 17.8 Mergers, Acquisitions and Strategic Alliances
- 17.9 New Entrants and Competitive Threats
- 17.10 Porter's Five Forces and Industry Attractiveness
- 17.11 Competitive Outlook, 2025-2035
Chapter 18 Company Profiles
- 18.1 Company Coverage and Selection Criteria
- 18.2 SG Fleet
- 18.2.1 Business Description
- 18.2.2 Company Ownership and Geographic Presence
- 18.2.3 Product and Service Portfolio
- 18.2.4 Manufacturing and Operating Footprint
- 18.2.5 Financial Performance and Investment
- 18.2.6 Market Share and Competitive Position
- 18.2.7 Technology and Innovation Capabilities
- 18.2.8 Strategic Alliances or Partnerships
- 18.2.9 Recent Developments
- 18.2.10 Growth Strategy and Outlook
- 18.3 FleetPartners Group
- 18.4 ORIX Australia
- 18.5 Toyota Fleet Management
- 18.6 Custom Fleet
- 18.7 Other Relevant Market Participants
Note: Every listed company is profiled on the structure shown under the first company. The company list is preliminary and may change based on research findings, market developments, data availability and client requirements.
Chapter 19 Disclaimer
- 19.1 Research and Forecast Disclaimer
- 19.2 Data Source and Estimation Limitations
Note: The depth of individual sections depends on data availability for this market. Volume, capacity, trade and other unit-based metrics are included where applicable.

