
Account transfers and einvoicing reshape how billers collect
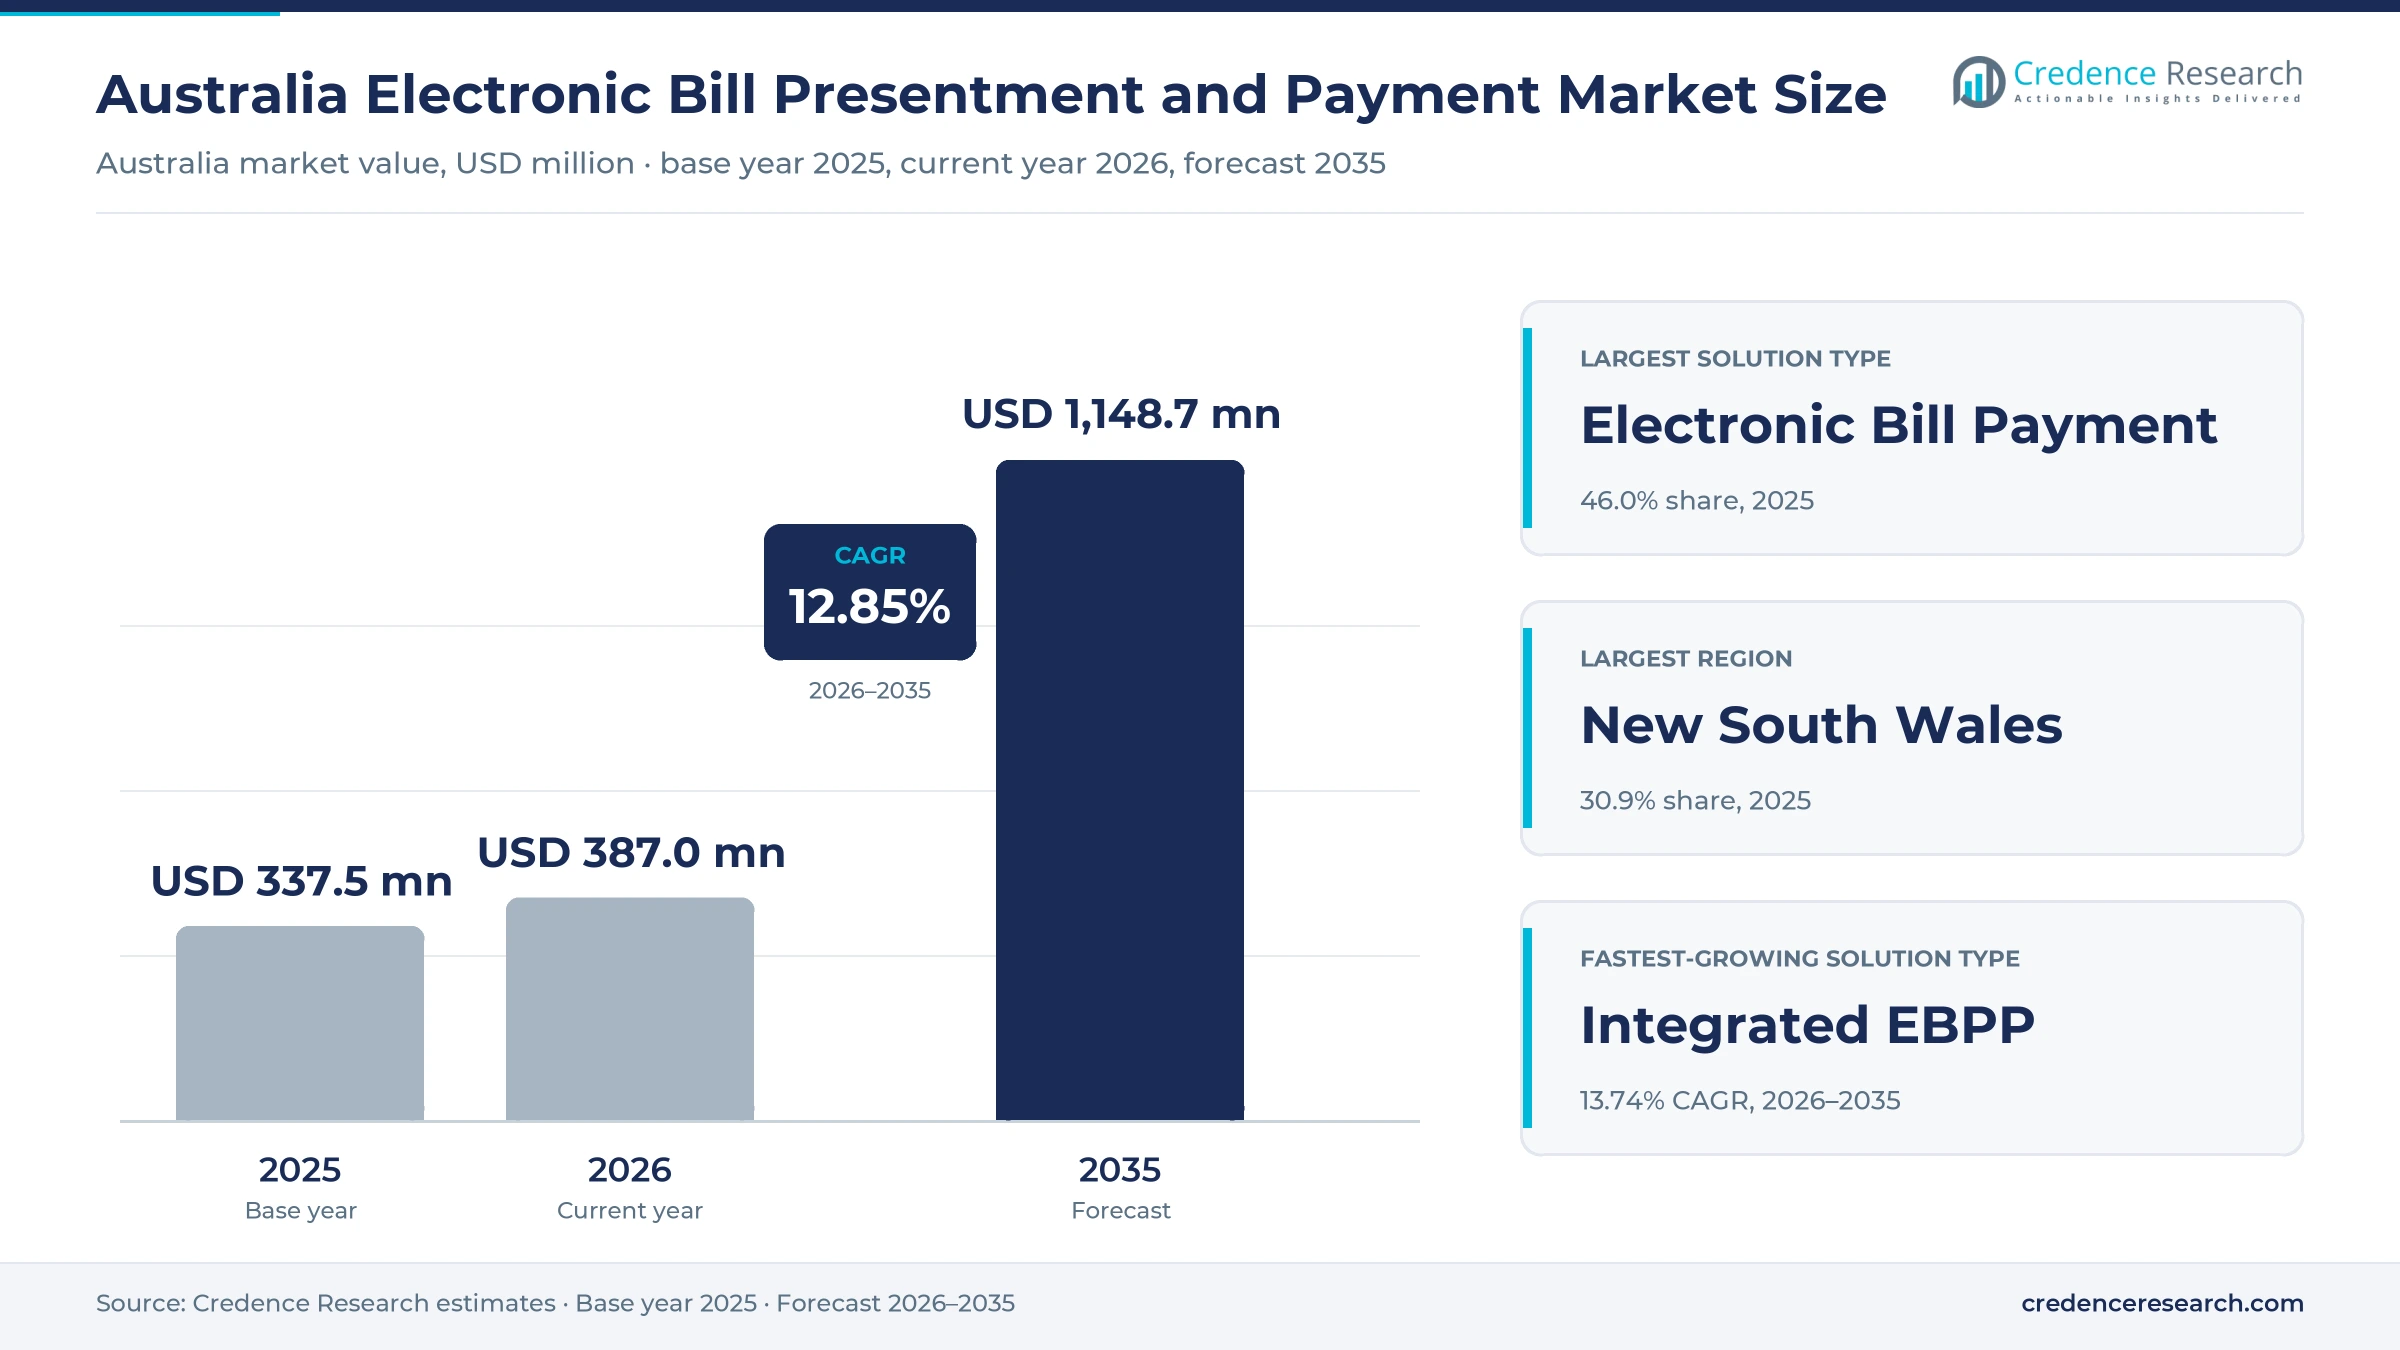
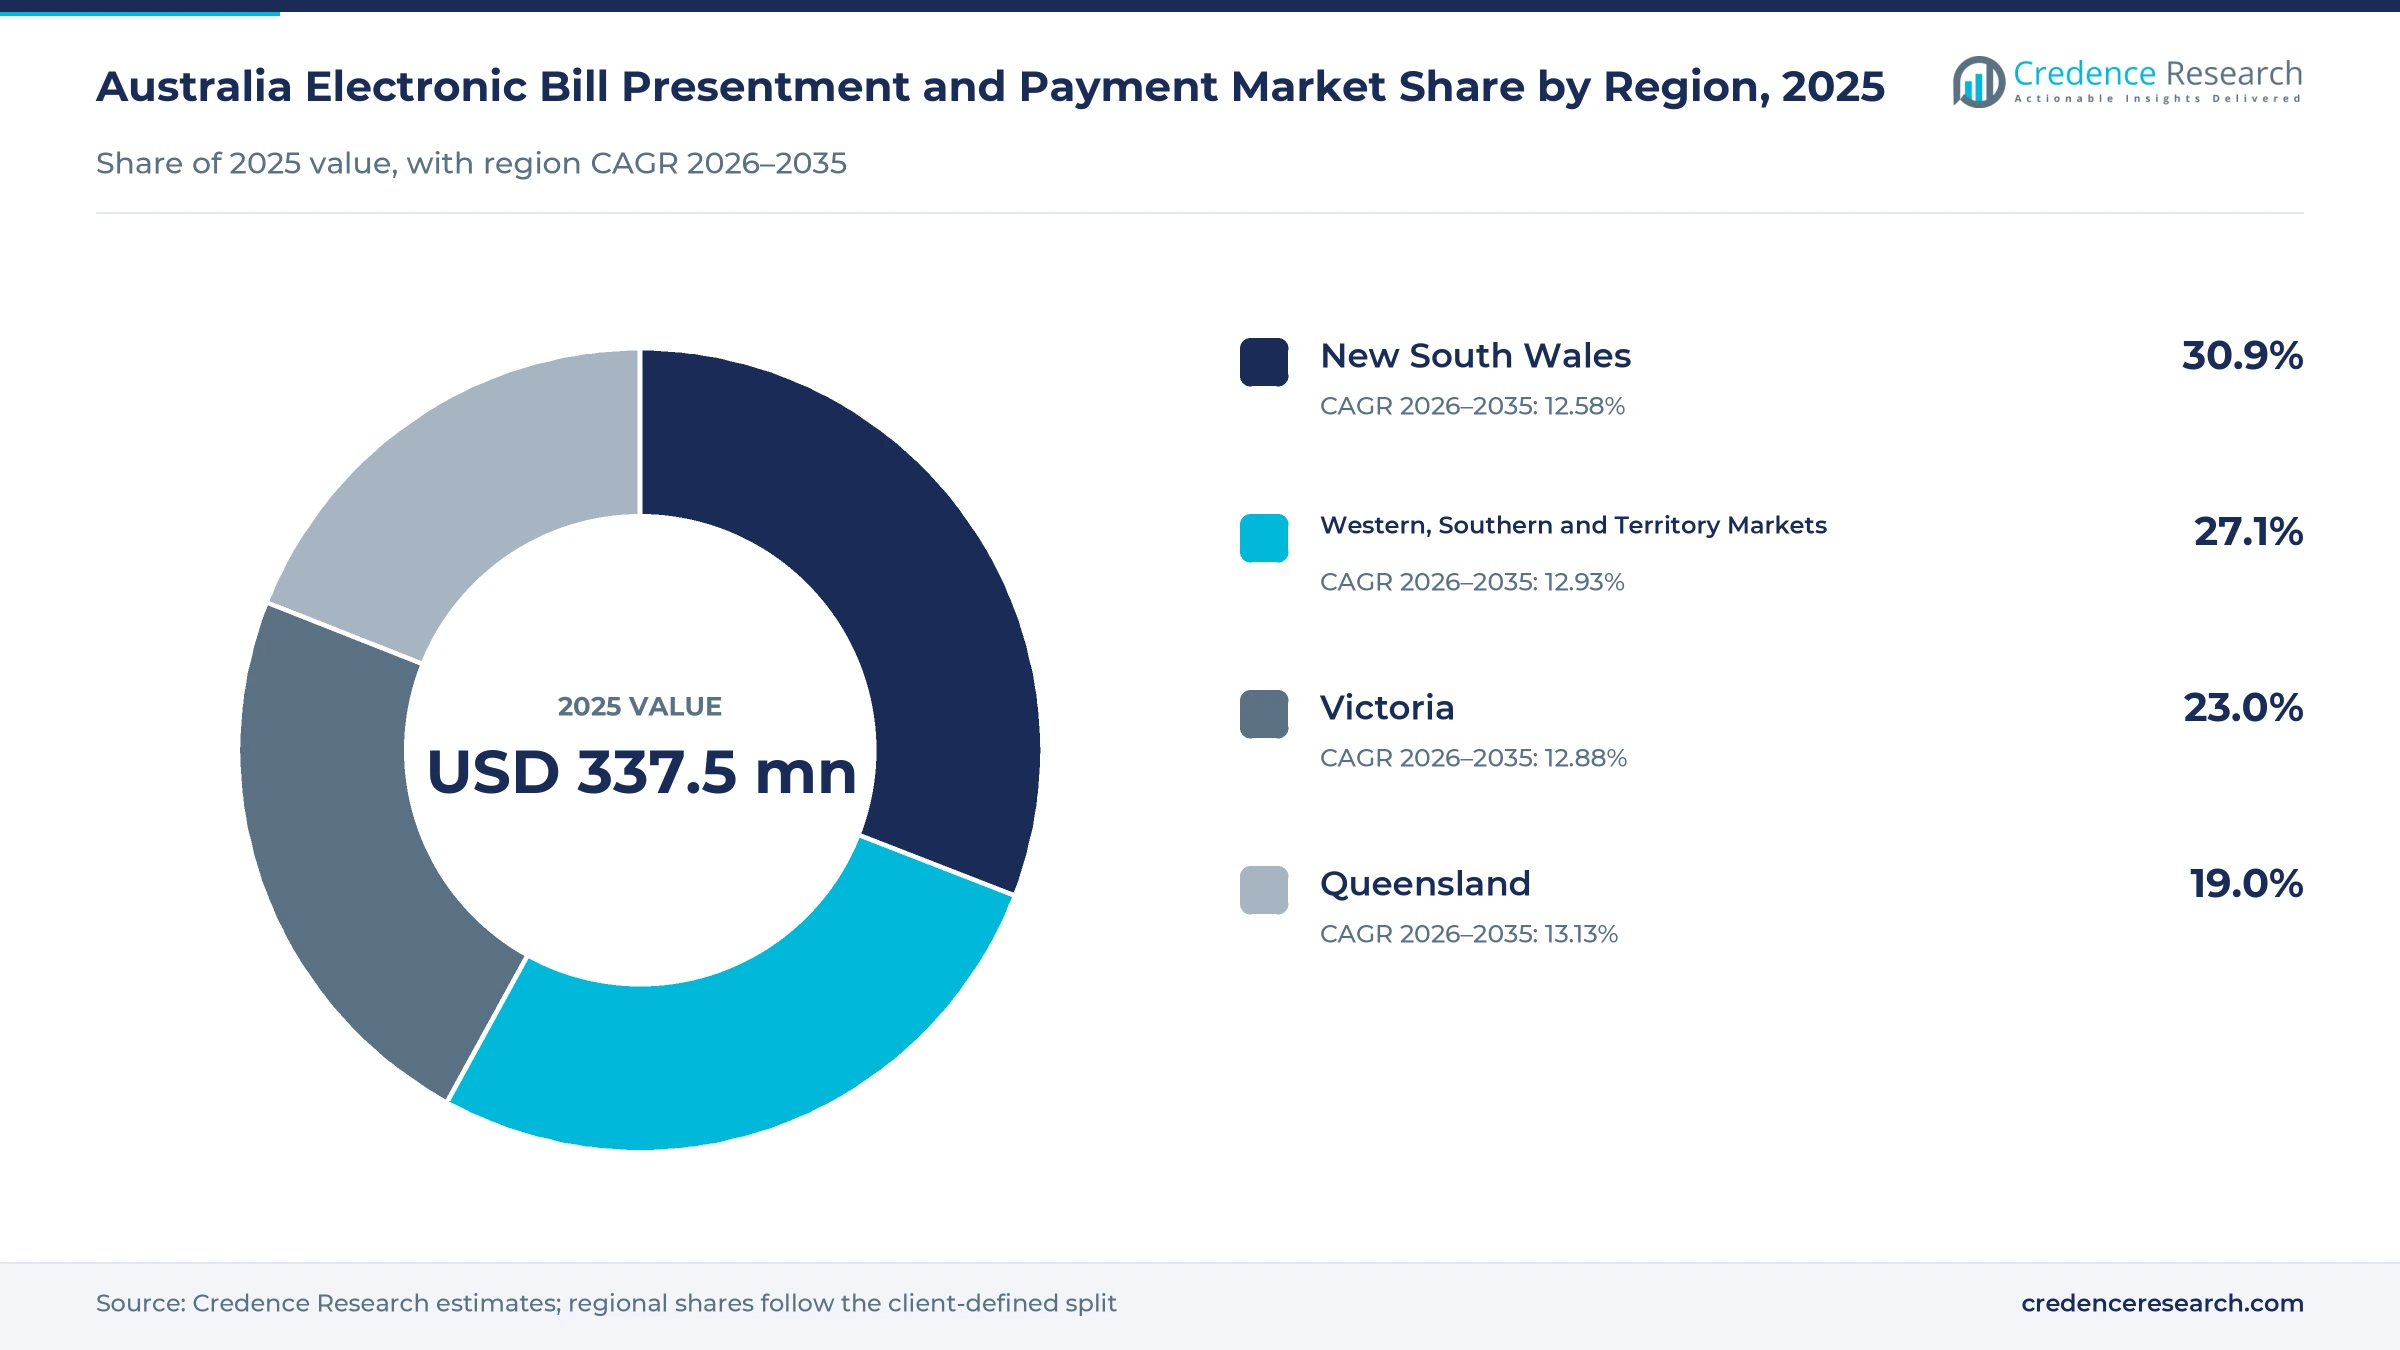
The Australia electronic bill presentment and payment market was valued at USD 337.5 million in 2025 and is projected to increase from USD 387.0 million in 2026 to USD 1.15 billion by 2035, registering a CAGR of 12.85% during 2026–2035. Spending comes from energy and water retailers, telecom and internet providers, insurers, lenders, councils and government agencies that send bills digitally and collect through BPAY, direct debit, cards and the New Payments Platform. New South Wales held the largest regional share, 30.9% in 2025, because the state has the most residents, the most head offices of large billers and the deepest pool of recurring household accounts. Queensland is the fastest-growing region at 13.13% a year, as state agencies move supplier invoices onto structured digital formats and population keeps rising. Account-based collection is also changing the cost base, because PayTo agreements let billers pull funds in real time with customer consent instead of waiting for batch direct debits to settle.
Which billing and collection services are counted?
The estimate measures revenue earned in Australia by providers of digital bill delivery, online and in-app bill payment, direct debit and PayTo collection services, and integrated platforms that combine both. It counts transaction fees, subscription and license fees, and implementation and managed service charges paid by billers of every size.
The estimate excludes the face value of bills paid, card interchange retained by issuers and the cost of paper statements and mail. The value chain runs from payment schemes and banks through gateways, billing software and accounting platforms to utilities, telecom firms, lenders, councils and households in every state and territory.
Australia Electronic Bill Presentment and Payment Market Insights
- The Australia electronic bill presentment and payment market was valued at USD 337.5 million in 2025 and is projected to reach USD 1.15 billion by 2035, registering a CAGR of 12.85% during 2026–2035.
- New South Wales held a 30.9% share of 2025 value, because the state has the largest population and the largest base of recurring billers.
- Electronic bill payment led with a 46.0% share of 2025 value, because billers pay fees on every BPAY, card, direct debit and PayTo collection.
- Non-corporate Commonwealth entities must lift eInvoicing to 30% of invoices received by July 1, 2026, which pushes suppliers onto the Peppol network.
- Integrated EBPP grows fastest at 13.74% a year during 2026–2035, as billers combine invoice delivery, reminders and real-time collection in one platform.
Payment services lead as integrated platforms grow fastest
Why does bill payment hold the largest revenue share?
Based on solution type, the market is categorized into electronic bill payment, electronic bill presentment and integrated EBPP. Electronic Bill Payment led with a 46.0% share of 2025 value, because billers pay a fee on almost every collected bill, whatever the channel. Integrated EBPP grows fastest at 13.74% a year, as billers replace separate statement and collection vendors with one platform.
How do utilities, telecom and public billers split spending?
Based on end-use industry, the market is categorized into utilities, telecommunications and internet, financial services and public and consumer services. Utilities led with a 31.0% share of 2025 value, because energy and water retailers send recurring bills to almost every household. Public and Consumer Services grow fastest at 13.65% a year, as councils and agencies digitize rates, fees and fines.
Why do enterprise billers dominate platform revenue?
Based on enterprise size, the market is categorized into micro billers, small and midsize billers, and enterprise billers. Enterprise Billers led with a 52.0% share of 2025 value, because large retailers, carriers and lenders run millions of accounts on dedicated platforms. Micro Billers grow fastest at 13.70% a year, as accounting software adds invoice delivery and payment links at low monthly prices.
How fast are billers moving to cloud platforms?
Based on deployment model, the market is categorized into cloud SaaS, on-premises and hybrid. Cloud SaaS led with 54.0% of 2025 value, because most new billing, gateway and accounting tools are sold as hosted subscriptions. Cloud SaaS is also the fastest model at 13.39% a year, as older in-house billing systems reach the end of their life.
| Segment Group | Leading Sub-segment | Share, 2025 | Fastest-growing Sub-segment | CAGR, 2026–2035 |
|---|---|---|---|---|
| By Solution Type | Electronic Bill Payment | 46.0% | Integrated EBPP | 13.74% |
| By End-Use Industry | Utilities | 31.0% | Public and Consumer Services | 13.65% |
| By Enterprise Size | Enterprise Billers | 52.0% | Micro Billers | 13.70% |
| By Deployment Model | Cloud SaaS | 54.0% | Cloud SaaS | 13.39% |
Request a Free Sample
Fill in your details and we'll send you a free sample report.
- Sample data tables & charts
- Research methodology
NPP rails, Peppol and invoice automation lift demand
How does account-based collection modernization lift demand?
Billers are moving collections onto real-time account transfers, which cuts settlement delays and failed payments compared with batch direct debit. The NPP processed nearly 2 billion real-time payments in 2025, and 128 million accounts could make and receive them, up 12% on the year, according to Australian Payments Plus. An ISO 20022 message upgrade and payment data uplifts are scheduled for delivery by the end of 2026, which lets billers send richer remittance details. PayTo now handles about 6 million transactions a year worth almost AUD 4 billion, PayDay News reported on July 14, 2026. Electronic bill payment, which earns a fee on each of these collections, holds 46.0% of 2025 value, while billers add PayTo and PayID beside BPAY and cards.
Why does structured invoice interoperability raise spending?
Businesses and governments are exchanging invoices as structured data over the Peppol network, which lets billers deliver bills straight into a payer's accounting system. The number of Australian businesses registered on the network passed 400,000 during 2025, according to the Australian Taxation Office. Non-corporate Commonwealth entities must raise eInvoices to 30% of invoices received by July 1, 2026, and more than 300 state and territory organizations and councils already use the network. Xero, citing the tax office, puts paper invoice processing at around AUD 30, against less than AUD 10 for an eInvoice. In turn, suppliers buy accounts payable software and presentment tools that send and receive Peppol documents.
How does embedded invoice-to-cash automation spread?
Small firms want invoicing, reminders and collection inside the software they already use, which embeds bill delivery and payment into daily bookkeeping. MYOB launched Smart Invoice Reminders on March 2, 2026, which recommend next steps based on each customer's history of late payment. MYOB cites about 2.61 million GST-registered small businesses in Australia, and 18% of respondents to its November 2025 Business Monitor named late payments as a cause of extreme pressure. Stripe said on Aug. 22, 2024, that more than 500,000 Australian businesses use its platform. Demand for receivables automation tools supports integrated EBPP, which grows at 13.74% a year, the fastest solution rate.
Why does automatic household payment keep volumes rising?
Households now pay most recurring bills automatically, which locks utility, telecom and insurance collections into digital channels for years. Around 70% of household bill payments were made automatically in 2025, six percentage points more than in 2022, according to the Reserve Bank of Australia. The bank found card use was lowest for household bills, where consumers relied more on bank transfers and BPAY. More than 95,000 businesses offer BPAY through over 140 banks and financial institutions, according to its scheme manager. Account ownership reached 98.0% of adults in 2024, according to the World Bank. Utilities, which bill almost every household on automatic schedules, hold 31.0% of 2025 value.
PayTo migration, prompt-pay rules and cloud tools
How is the shift from direct debit to PayTo unfolding?
Billers are moving recurring direct debits onto PayTo agreements, which customers approve in their banking apps and can pause or cancel at any time. Global Payments, the owner of Ezidebit, went live with PayTo on May 22, 2023, serving a base of more than 60,000 merchants through Ezidebit, Banking Day reported. GoCardless launched PayTo in December 2022, and Stripe announced PayTo for Australian businesses on Aug. 22, 2024. Revolut launched PayTo for its more than 1 million Australian customers in March 2026, eCommerceNews reported. PayTo accounted for 4 percentage points of account-to-account payments in 2025, according to the central bank. As a result, gateways and billing platforms sell migration tools, mandate management and real-time reconciliation to recurring billers.
Why is the rise of government prompt-pay rules significant?
Governments are tying faster supplier payment to digital invoices, which makes eInvoicing a commercial advantage for firms that bill the public sector. Commonwealth policy asks agencies to pay eligible eInvoices within five days when both supplier and buyer use Peppol. The New South Wales government must pay registered small business suppliers within five business days of a correctly rendered invoice. Victorian agencies reported paying 81.5% of relevant invoices on time in 2024–25, the state auditor-general said on March 18, 2026. Non-corporate Commonwealth entities must also enable automated processing and sending of eInvoices by December 2026. Public and consumer services, which include these agencies and councils, grow at 13.65% a year, the fastest industry rate.
Can cloud billing tools open the micro biller segment?
Sole traders and small firms can now send structured bills and collect payments from low-cost subscriptions, which leaves room for providers that bundle presentment and payment. Xero includes eInvoicing in its Grow, Comprehensive and Ultimate plans, and registration is free with an ABN from inside the software. Payreq, founded in 2015, offers Bill and Pay services, digital mailboxes and Peppol eInvoicing for enterprise and government senders. Stripe also lets Australian businesses transfer up to AUD 9,999 within minutes of a card transaction through Instant Payouts. Micro billers, which gain most from these low-cost tools, grow at 13.70% a year, as small-business accounting software becomes the main billing channel.
Is there room for real-time public revenue collection?
Councils and agencies still collect rates, fees and fines through slow channels, which leaves room for real-time and in-person digital options. Azupay builds real-time payment services for governments, banks and billers on the NPP, PayID and PayTo, and it launched an early pilot with the NSW Department of Customer Service in July 2020. Australia Post lets customers pay more than 1,000 types of bills, including council rates and tax, online, in its app, by phone or at a Post Office. Cheques made up just 0.02% of all payments in 2025, against 2% for BPAY, according to the central bank, while a government transition plan winds the cheque system down. In turn, public revenue collection becomes a growing pool for platform vendors.
Rail uncertainty, surcharge limits and migration friction
How does an open-ended BECS timeline slow migration?
Billers face uncertainty over when the old direct entry system will close, which weakens the case for early migration to new rails. AusPayNet removed its June 2030 target end date for BECS in December 2025 and has not set a new date, according to the central bank. BECS also remains the largest retail system by value, about six to seven times the NPP. As a result, many billers run two collection systems at once, which raises costs until a firm date is set.
Why does the end of card surcharges pressure billers?
Councils, utilities and other billers that pass card costs to customers will have to absorb them, which squeezes margins on card-funded bill payments. The central bank decided on March 31, 2026, to remove surcharging on the designated eftpos, Mastercard and Visa networks, with most changes taking effect on Oct. 1, 2026. Interchange caps on domestic cards fall from the same date. In turn, billers steer customers toward cheaper account-based methods, which shifts fee income between payment providers.
How does migration friction delay PayTo adoption?
Moving existing direct debit customers to PayTo takes notice periods and customer action, which slows conversion for large recurring billers. Australian Payments Plus says customers first receive 14 days' advance notice, and businesses must allow five days after an agreement reaches online banking before debiting. Customers can also opt out during the notice period and stay on direct debit. As a result, billers budget for parallel processing, customer messaging and support, which stretches project timelines.
Why does small business readiness remain uneven?
Many small firms still lack the knowledge or software settings to send structured bills, which slows network effects for presentment platforms. A MYOB survey reported by SmartCompany found in July 2022 that just 64% of small businesses had heard of eInvoicing. Just over half of firms yet to adopt it said they were waiting because they did not know enough about it. In turn, vendors spend on onboarding, education and adviser channels, which raises acquisition costs for the smallest billers.
New South Wales leads while Queensland grows fastest
| Region | Value, 2025 (USD million) | Share, 2025 | CAGR, 2026–2035 |
|---|---|---|---|
| New South Wales | 104.3 | 30.9% | 12.58% |
| Western, Southern and Territory Markets | 91.5 | 27.1% | 12.93% |
| Victoria | 77.6 | 23.0% | 12.88% |
| Queensland | 64.1 | 19.0% | 13.13% |
New South Wales leads on population and biller depth
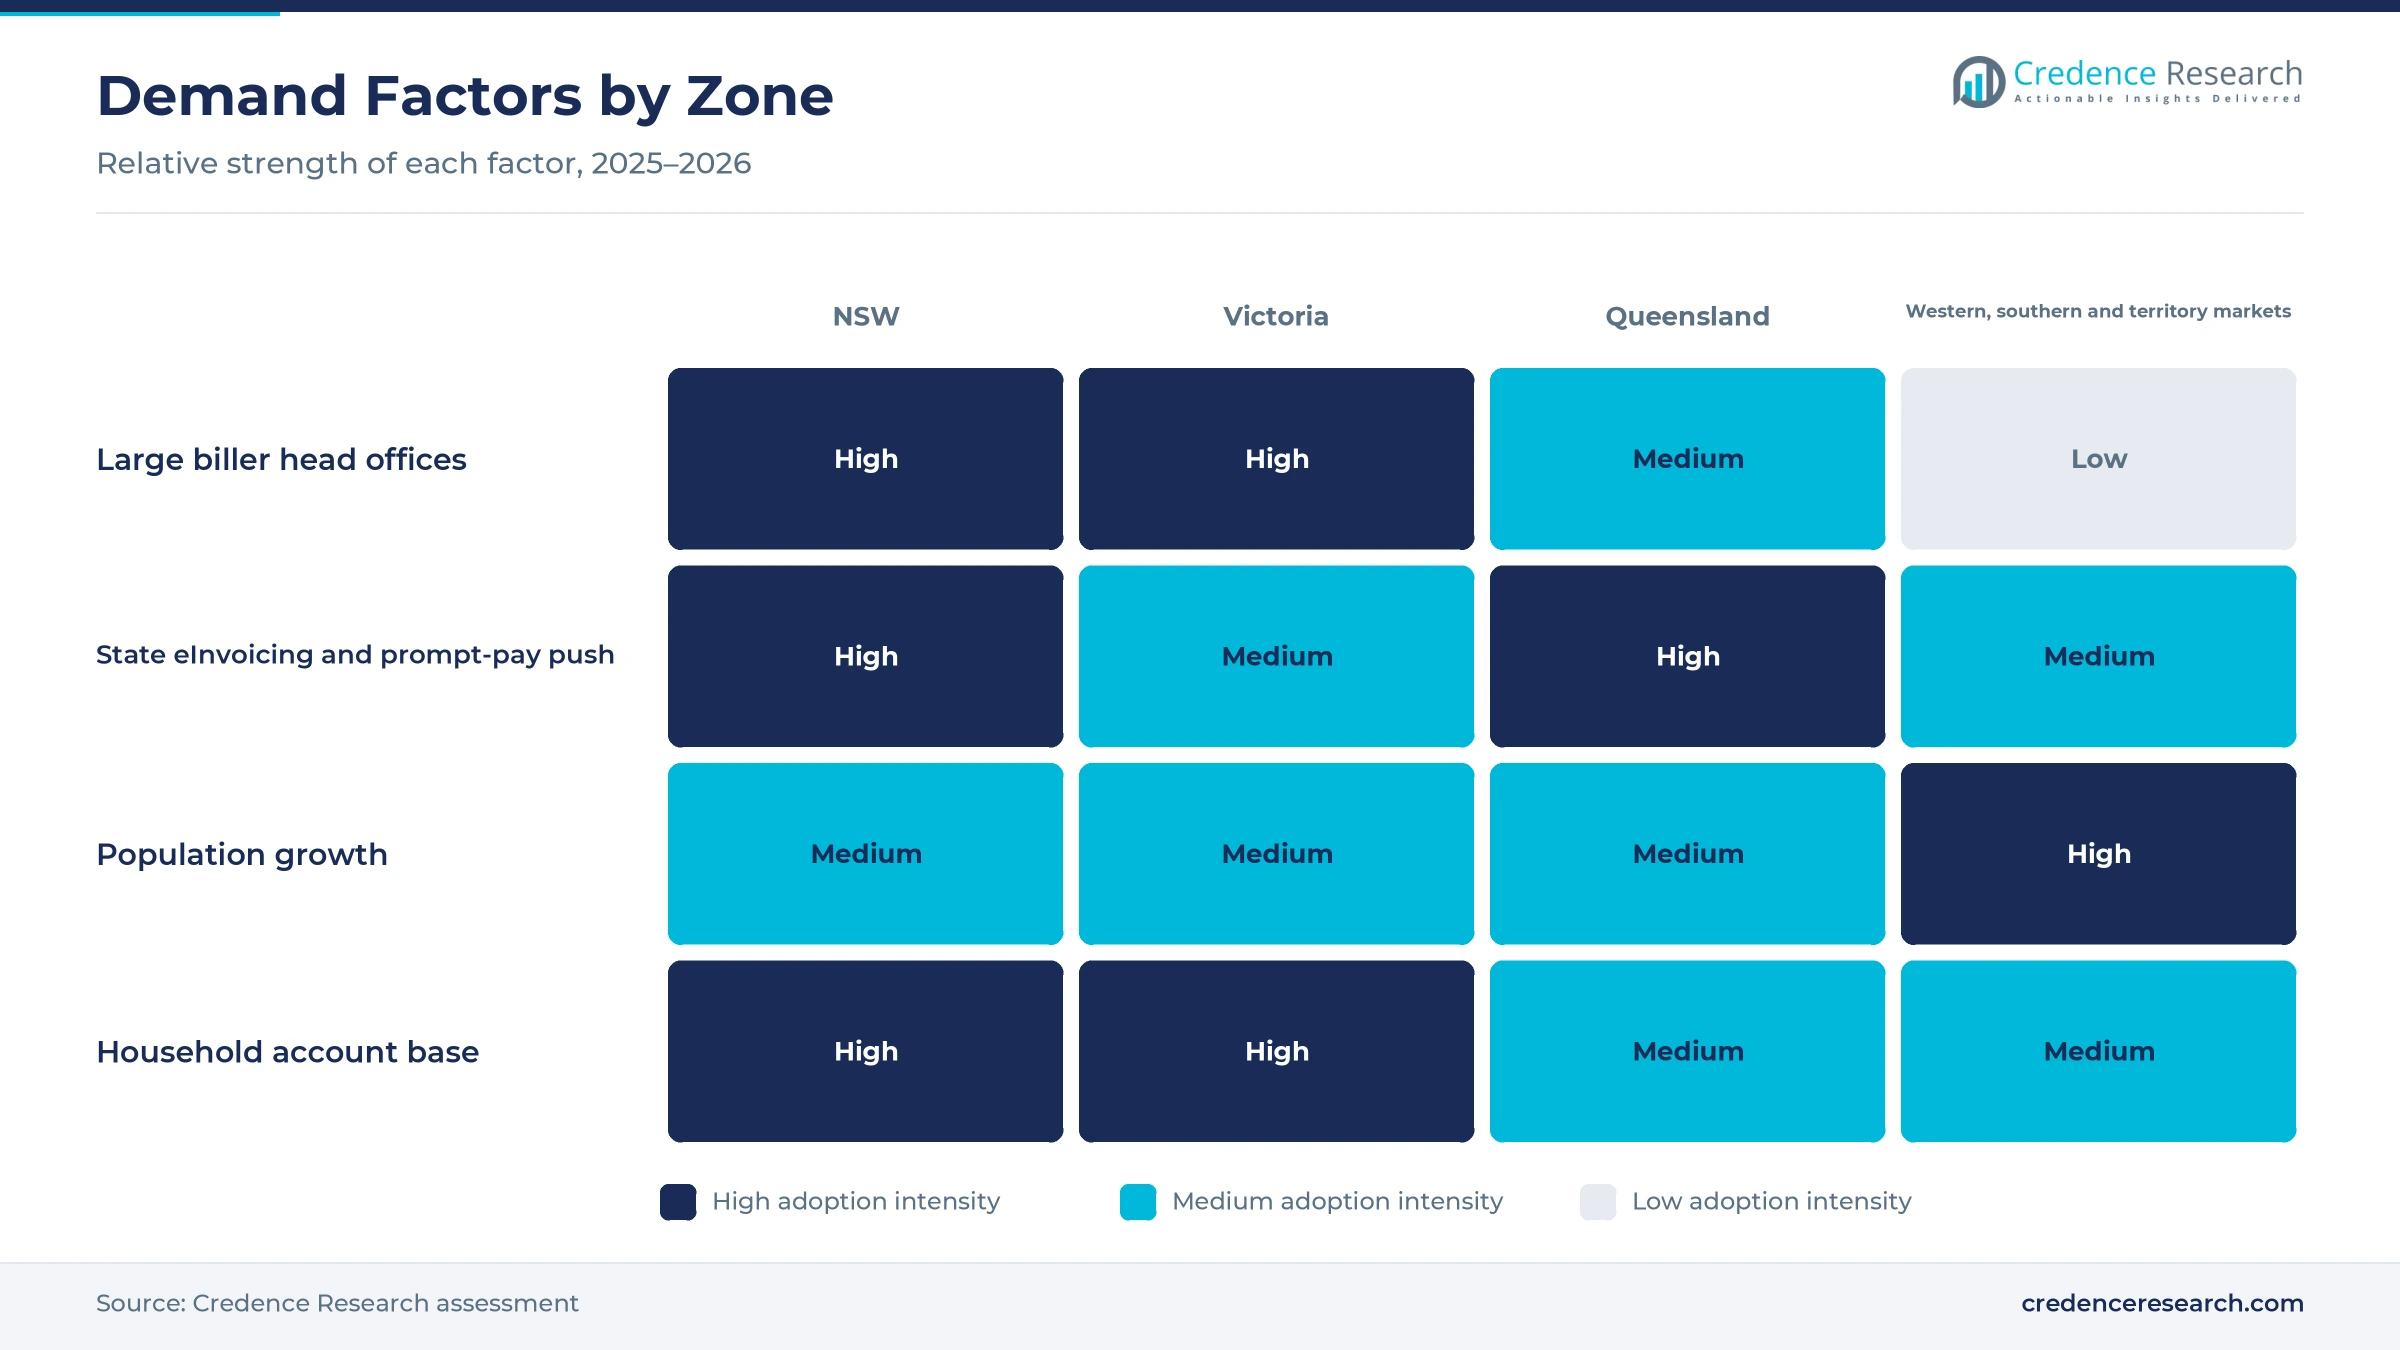
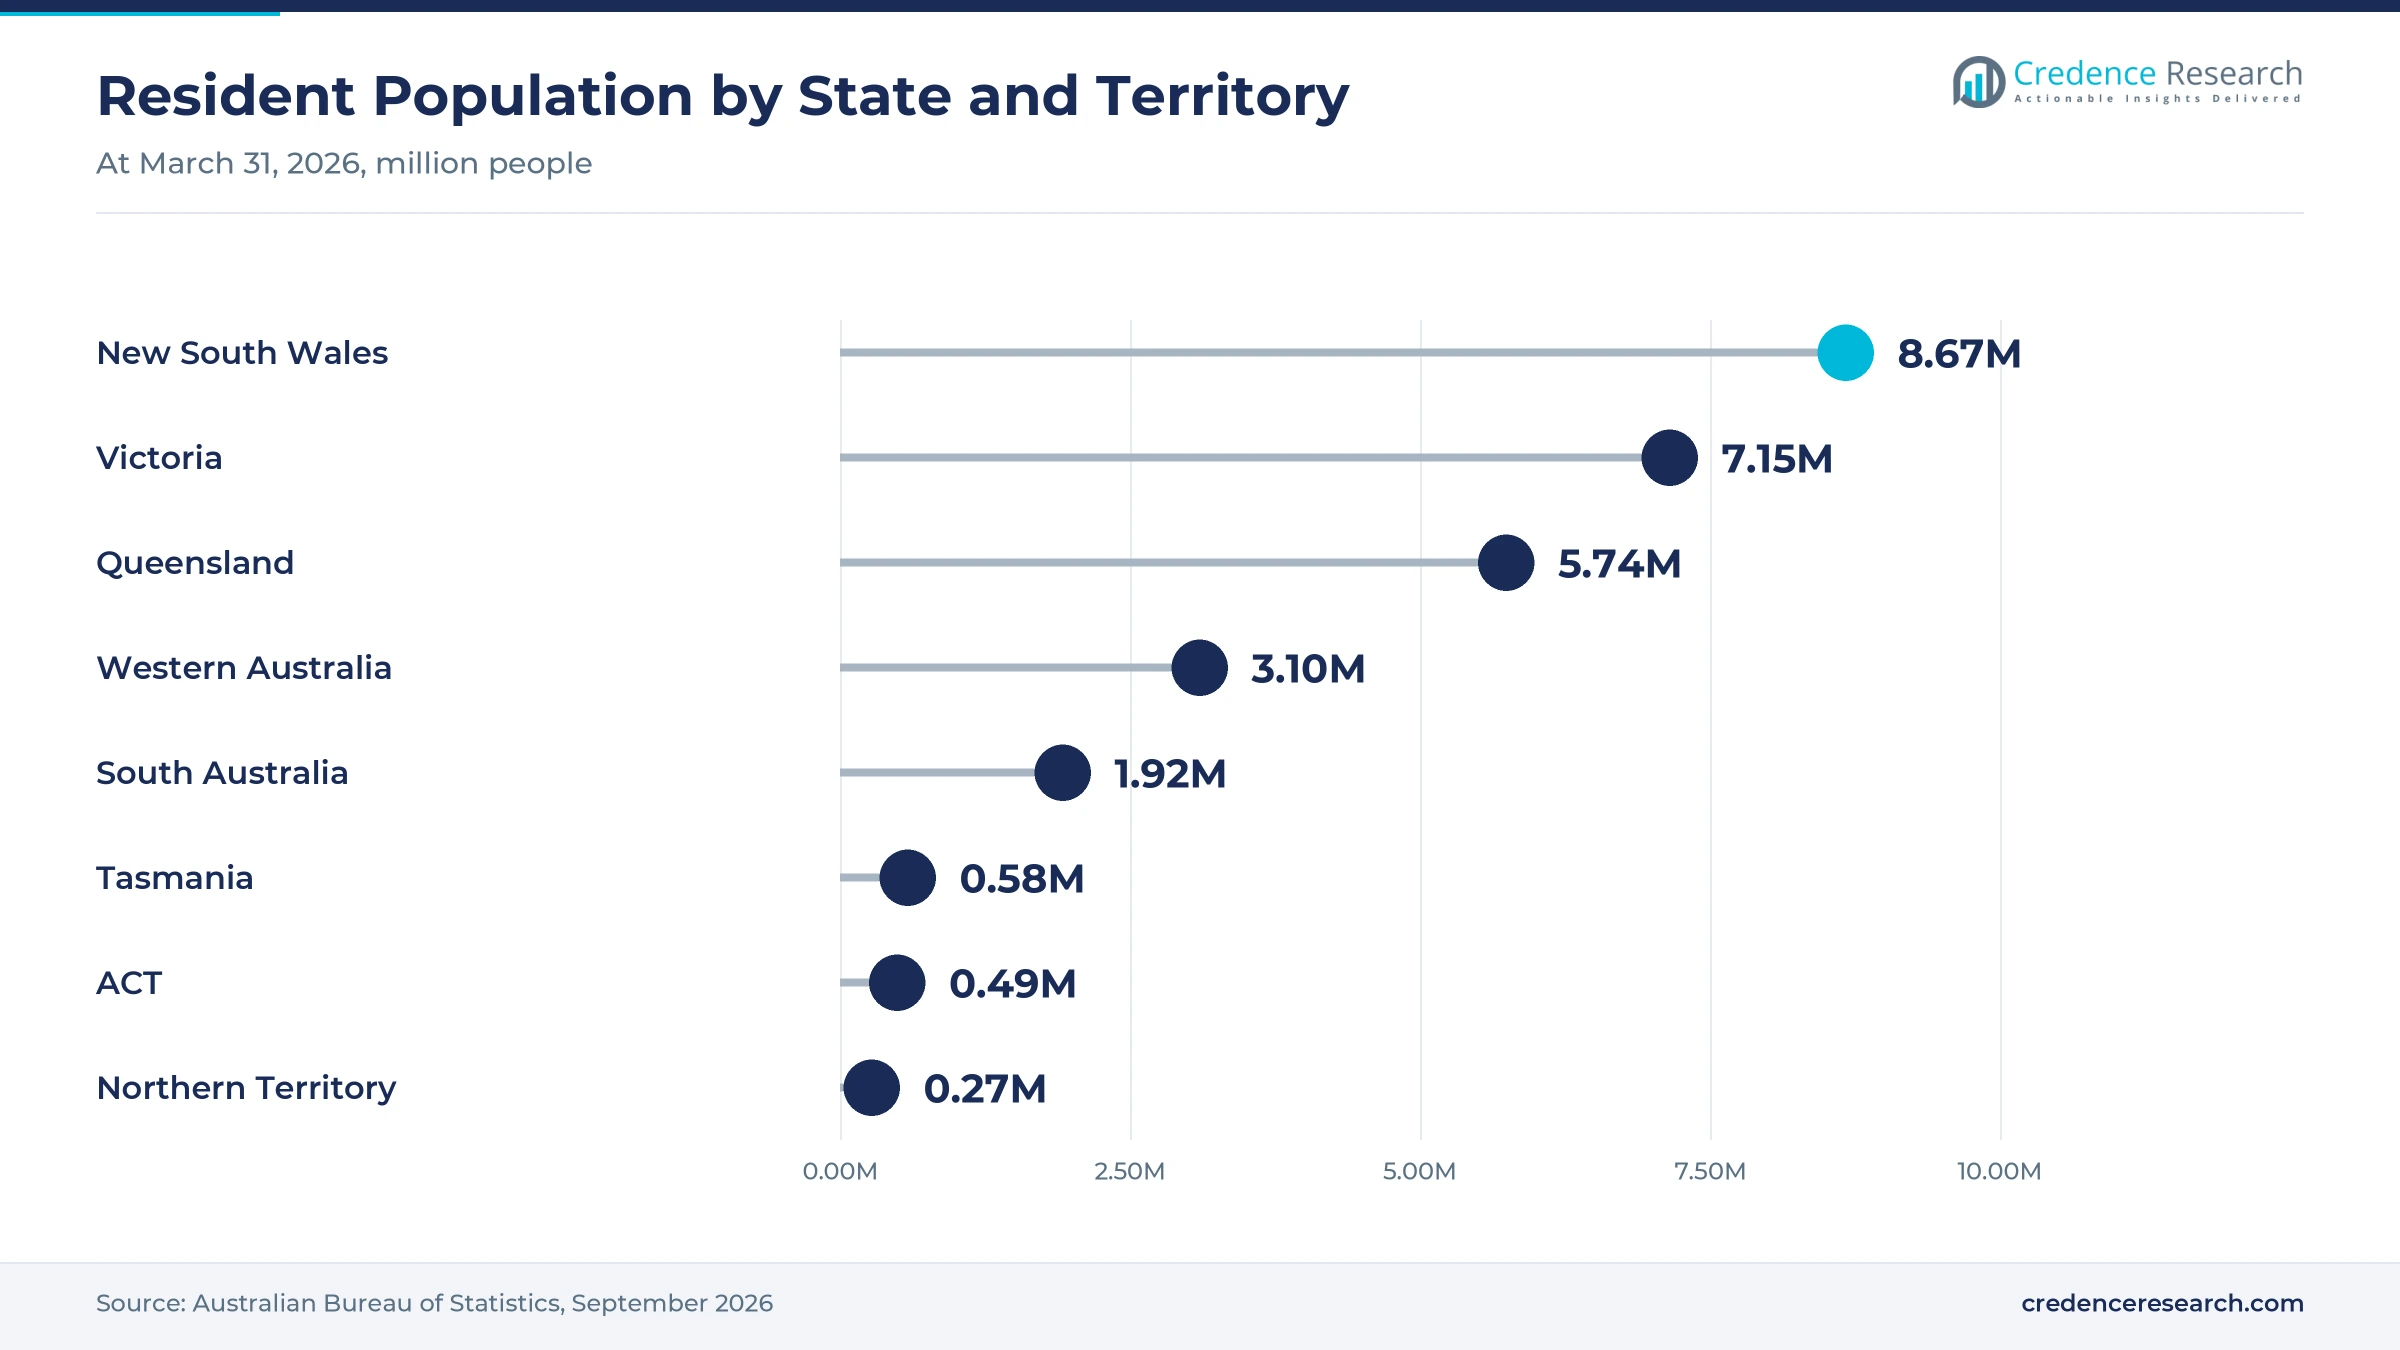
New South Wales held a 30.9% share of 2025 value and grows at 12.58% a year, because the state has the largest population and the most head offices of large utilities, carriers and lenders. The state had about 8.67 million residents at March 31, 2026, the most of any state. Its government also pays registered small business suppliers within five business days, which encourages digital invoicing. As a result, the state keeps the largest pool of recurring accounts through 2035.
How do payment rules support demand in Victoria?
Victoria held a 23.0% share of 2025 value and grows at 12.88% a year, because the state has the second-largest population and a dense base of utility, telecom and council billers. Victoria counted about 7.15 million residents at March 31, 2026. Its Fair Payment Policy requires 39 agencies to pay invoices under contracts below AUD 3 million within 10 business days. As a result, suppliers that bill the state gain from faster digital invoice processing.
Why does Queensland grow fastest?
Queensland held a 19.0% share of 2025 value and grows fastest at 13.13% a year, because state agencies are moving supplier invoices onto Peppol while its population keeps rising. Queensland Shared Services began enabling eInvoicing for 17 customer agencies on the state SAP system from July 1, 2025, including police, fire and ambulance services. Queensland counted about 5.74 million residents at March 31, 2026. As a result, presentment and collection platforms win new public and private billers across Brisbane and regional cities.
What drives Western, Southern and Territory Markets?
Western, Southern and Territory Markets accounted for 27.1% of 2025 value and grow at 12.93% a year. Western Australia recorded the fastest population growth of any state, 2.1% in the year to March 2026, and it counted about 3.10 million residents. South Australia contributed about 1.92 million residents to the zone. As a result, utility and council billers in Perth and Adelaide add digital accounts from a broad base.
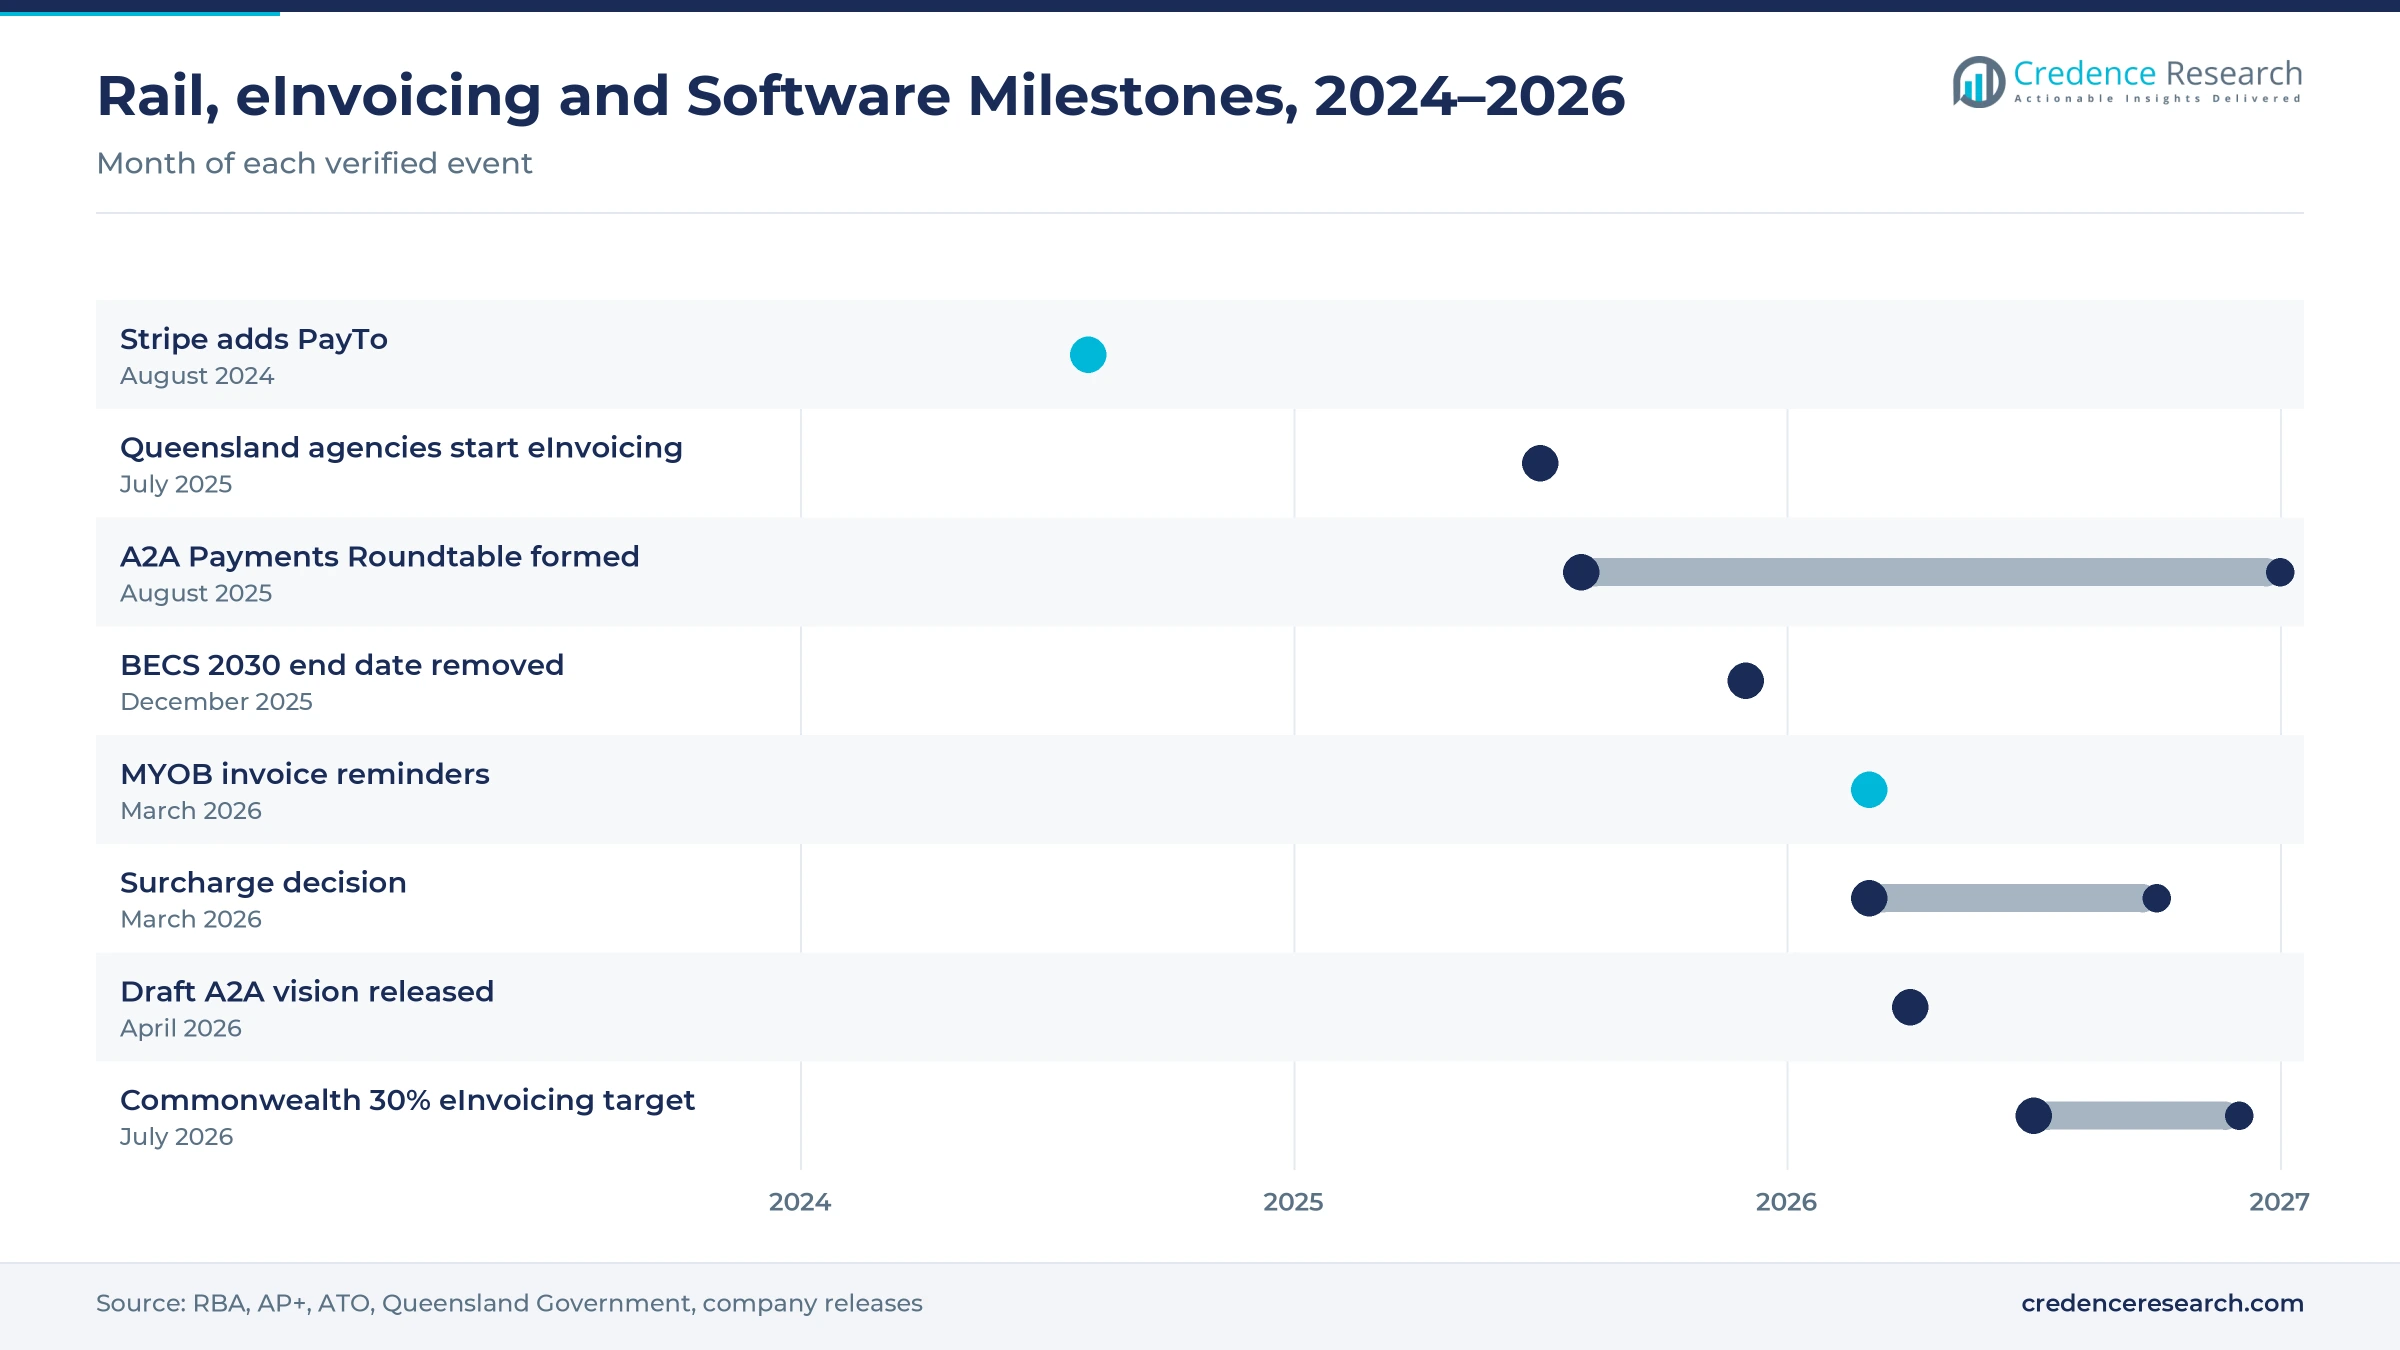
Rail, einvoicing and software moves, 2024–2026
| Development | Status and market relevance |
|---|---|
| In August 2024, Stripe added PayTo for Australian businesses, alongside Instant Payouts of up to AUD 9,999. | Brought real-time account debits to online billers |
| In July 2025, Queensland Shared Services began enabling eInvoicing for 17 state agencies on its SAP system. | Moved state supplier invoices onto Peppol |
| In December 2025, AusPayNet removed its June 2030 target end date for the BECS direct entry system. | Extended the period of parallel collection rails |
| In March 2026, MYOB began rolling out Smart Invoice Reminders as part of an AI suite for small businesses. | Embedded collection prompts into accounting software |
| In March 2026, the Reserve Bank of Australia decided to remove card surcharging from Oct. 1, 2026. | Changes the cost of card-funded bill payments |
Real-time rails, Peppol and APIs change biller systems
- Real-time account rails such as the NPP, PayID and PayTo settle transfers in seconds and let billers pull funds under customer-approved agreements, which replaces slower batch direct debit files.
- Peppol eInvoicing sends invoices as structured data between accounting systems through accredited access points, which removes manual keying and lets eligible government suppliers get paid within days.
- Billing and gateway APIs connect invoice creation, reminders, card and account payments and reconciliation, which lets accounting software and billing platforms embed collection in one workflow.
Need a Custom Version of This Report?
Tailor the scope, geography, or segments to your exact requirements.
- Custom geography or segment scope
- Direct access to our analyst team
Scheme operators, gateways and accounting software compete
Competition is split between scheme operators, payment gateways, accounting software and specialist billing platforms. Australian Payments Plus runs BPAY, the NPP and PayTo, which gives it a central role in biller collection. Australia Post offers Post Billpay across online, app, phone and counter channels. Ezidebit, owned by Global Payments, serves recurring billers with direct debit and PayTo, while Stripe and GoCardless sell PayTo and card collection to online businesses. Xero and MYOB embed eInvoicing and reminders in small business software. Payreq focuses on digital mailboxes and Peppol eInvoicing, and Azupay builds real-time services for governments and billers. Vendors compete on collection cost, settlement speed, integrations and support for migration from direct debit. Because international vendors also sell EBPP platforms worldwide, local scheme connections and Peppol accreditation matter for winning Australian billers.
Which providers lead Australian biller platforms?
| Company | Type | Role in the market |
|---|---|---|
| Australian Payments Plus | Payment scheme operator | Runs BPAY, the NPP and PayTo; NPP reached 128 million accounts |
| Australia Post | Bill payment network | Post Billpay covers more than 1,000 types of bills |
| Ezidebit | Recurring payment provider | Owned by Global Payments; live with PayTo since May 2023 |
| Stripe | Payment gateway | Added PayTo in August 2024; more than 500,000 Australian businesses |
| Xero | Accounting software vendor | eInvoicing included in Grow, Comprehensive and Ultimate plans |
| MYOB | Accounting software vendor | Rolled out Smart Invoice Reminders from March 2026 |
| GoCardless | Account-to-account payment provider | Went live with PayTo in December 2022 |
| Payreq | Billing and eInvoicing platform | Digital mailboxes, Bill and Pay and Peppol eInvoicing since 2015 |
| Azupay | Real-time payment specialist | NPP, PayID and PayTo services for governments and billers |
Credence Research view on Australian biller platforms
Credence Research's view is that Australian biller platform revenue will keep growing because collection is moving onto real-time account rails and invoices are moving onto structured data. Payment services remain the largest revenue pool, but integrated platforms that combine delivery, reminders and PayTo collection will gain the most. Government prompt-pay rules and Peppol targets give public billers and their suppliers strong reasons to digitize. Providers that hold scheme connections, Peppol accreditation and deep accounting integrations should gain share across the Australia electronic bill presentment and payment base over the next decade.
How the national biller platform estimate was built
The report uses 2025 as the base year on a calendar basis, and market values come from the Credence Research model. That model combines central bank payment statistics, payment scheme operating data, tax office eInvoicing figures, population estimates, World Bank financial access data, state government policies and company disclosures. Segment splits and zone growth rates are Credence Research estimates, while zone shares follow the client-defined split. Sources used are official statistics, regulator and agency publications, company releases and named trade press, and Credence Research conducted no interviews or surveys of its own for this report.
Integrated platforms and public billers lead to 2035
Revenue is expected to reach USD 1.15 billion by 2035, a 12.85% CAGR during 2026–2035, as billers move collections onto real-time rails and invoices onto Peppol. Growth should come from integrated EBPP, public and consumer services and micro billers. A firm BECS end date and steady PayTo conversion would speed migration, while slow customer switching or weak small business readiness would hold growth back. Firms with scheme access, accounting integrations and low-cost account-based collection are expected to gain the most as Australia electronic bill presentment and payment revenue grows.
Frequently Asked Questions
How big is the Australia electronic bill presentment and payment market?
Which solution type leads Australian biller platform revenue?
Which region leads the Australian market?
How does PayTo change bill collection?
Why does Peppol eInvoicing matter for billers?
Which end-use industry spends the most?
Who are the leading companies in the Australian market?
What are the main challenges for providers?
Table of Content
Chapter 1 Market Segmentation
- 1.1 Segmentation Framework
- 1.1.1 Product and Service Classification
- 1.1.2 Application and End-Use Classification
- 1.1.3 Technology and Solution Classification
- 1.1.4 Customer and Distribution Channel Classification
- 1.1.5 Geographic Segmentation
- 1.1.6 Market Segment Definitions and Boundaries
- 1.2 By Solution Type
- 1.2.1 Electronic Bill Payment
- 1.2.2 Electronic Bill Presentment
- 1.2.3 Integrated EBPP
- 1.3 By End-Use Industry
- 1.3.1 Utilities
- 1.3.2 Telecommunications and Internet
- 1.3.3 Financial Services
- 1.3.4 Public and Consumer Services
- 1.4 By Enterprise Size
- 1.4.1 Micro Billers
- 1.4.2 Small and Midsize Billers
- 1.4.3 Enterprise Billers
- 1.5 By Deployment Model
- 1.5.1 Cloud SaaS
- 1.5.2 On-Premises
- 1.5.3 Hybrid
Chapter 2 Introduction
- 2.1 Report Objectives and Scope
- 2.2 Product Definition and Industry Terminology
- 2.3 Market Inclusions and Exclusions
- 2.4 Research Process
- 2.4.1 Primary Research and Expert Interviews
- 2.4.2 Secondary Research and Source Review
- 2.4.3 Top-Down and Bottom-Up Estimation
- 2.4.4 Data Triangulation and Verification
- 2.5 Market Size Measurement Basis
- 2.5.1 2025: USD 337.5 million → 2035: USD 1.15 billion
- 2.6 Historical and Forecast Reference Periods
- 2.6.1 Historical Period: 2018-2025
- 2.6.2 Base Year: 2025
- 2.6.3 Forecast Period: 2025-2035
- 2.7 Research Assumptions and Limitations
Chapter 3 Executive Summary
- 3.1 Market Snapshot and Key Findings
- 3.2 Base-Year Market Size, 2025
- 3.3 Forecast Market Size, 2035
- 3.4 Revenue and Volume Growth Outlook
- 3.5 Key Demand and Supply Indicators
- 3.6 Leading Market Segments
- 3.7 Fastest-Growing Market Opportunities
- 3.8 Regional Performance Highlights
- 3.9 Technology and Industry Transformation
- 3.10 Competitive Landscape Summary
- 3.11 Analyst View and Strategic Implications
Chapter 4 Australia Electronic Bill Presentment and Payment Market Trends and Developments
- 4.1 Historical Industry Development, 2018-2025
- 4.2 Recent Market Trends and Developments
- 4.3 Demand and Customer Behavior Trends
- 4.4 Technology and Product Innovation
- 4.5 Artificial Intelligence, Automation and Digitalization
- 4.6 Local Manufacturing and Supply Chain Realignment
- 4.7 Industry Partnerships, Mergers and Acquisitions
- 4.8 Sustainability and Circular Economy Developments
- 4.9 Government and Private Sector Investment Trends
- 4.10 Emerging Business Models and Commercialization
- 4.11 Industry Developments and Announcements
Chapter 5 Australia Electronic Bill Presentment and Payment Market Supply and Demand Analysis
- 5.1 Demand Trend and Consumption Analysis, 2018-2025
- 5.2 Demand Forecast, 2025-2035
- 5.3 Supply Chain Structure and Procurement Trends
- 5.4 Supply-Demand Gap and Bottlenecks
- 5.5 Import Dependence and Sourcing Structure
- 5.6 Regional Supply and Demand Concentration
Chapter 6 Australia Electronic Bill Presentment and Payment Market Pricing Analysis
- 6.1 Pricing Structure and Measurement
- 6.2 Historical Pricing Trends, 2018-2025
- 6.3 Pricing Outlook, 2025-2035
- 6.4 Pricing by Product and Market Segment
- 6.5 Geographic Pricing Differences
- 6.6 Key Input, Energy, Labor and Logistics Costs
- 6.7 Contract Pricing and Purchasing Models
- 6.8 Pricing Sensitivity and Competitive Positioning
- 6.9 Price, Margin and Profitability Implications
Chapter 7 Australia Electronic Bill Presentment and Payment Market Dynamics
- 7.1 Market Growth Drivers
- 7.1.1 Demand-Side Drivers
- 7.1.2 Technology and Innovation Drivers
- 7.1.3 Infrastructure and Investment Drivers
- 7.1.4 Regulatory and Policy Drivers
- 7.2 Market Restraints
- 7.2.1 Cost and Affordability Constraints
- 7.2.2 Technology and Adoption Barriers
- 7.2.3 Supply Chain and Operational Constraints
- 7.3 Market Challenges
- 7.3.1 Competitive Pressure and Margin Erosion
- 7.3.2 Skills, Infrastructure and Implementation Gaps
- 7.4 Emerging Market Opportunities
- 7.5 Market Dynamics Impact and Time-Horizon Assessment
Chapter 8 Australia Electronic Bill Presentment and Payment Value Chain Analysis
- 8.1 Industry Value Chain Overview
- 8.2 Upstream Suppliers and Critical Inputs
- 8.3 Technology and Component Providers
- 8.4 Manufacturing or Service Delivery
- 8.5 Distribution, Channel Partners and Integrators
- 8.6 Downstream Applications and End Users
- 8.7 Value Addition and Profit Pools
- 8.8 Vertical Integration and Outsourcing
- 8.9 Supplier Concentration and Risk
- 8.10 Supply Chain Localization and Resilience
Chapter 9 Australia Electronic Bill Presentment and Payment Market Regulations and Policies
- 9.1 Relevant Laws, Standards and Compliance Frameworks
- 9.2 Product, Service, Safety and Quality Requirements
- 9.3 Government Policies, Incentives and Subsidies
- 9.4 Imports, Exports and Trade Barriers
- 9.5 Public Procurement and Local Content Requirements
- 9.6 Data Protection, AI and Cybersecurity Compliance
- 9.7 Upcoming Policy Changes and Market Implications
Chapter 10 Australia Electronic Bill Presentment and Payment Market Hotspots and Opportunities
- 10.1 Market Opportunity Mapping and Growth Hotspots
- 10.2 High-Growth Applications and Customer Groups
- 10.3 Underserved Markets and White-Space Opportunities
- 10.4 Emerging Technology and Product Opportunities
- 10.5 New Capacity and Investment Hotspots
- 10.6 Market Entry and Expansion Opportunities
- 10.7 Distribution and Partnership Opportunities
- 10.8 Near-Term and Long-Term Commercial Potential
- 10.9 Opportunity Attractiveness and Execution Risks
Chapter 11 Australia Electronic Bill Presentment and Payment Market Outlook, 2025-2035
- 11.1 Market Size and Analysis
- 11.1.1 Revenue (Market Measurement: 2025: USD 337.5 million → 2035: USD 1.15 billion)
- 11.1.2 Historical Market Size, 2018-2025
- 11.1.3 Base-Year Market Size, 2025
- 11.2 Market Forecast, 2025-2035
- 11.2.1 Revenue Forecast to 2035
- 11.2.2 CAGR and Year-on-Year Growth
- 11.2.3 Incremental Revenue Opportunity
- 11.3 Forecast Assumptions and Scenario Analysis
- 11.3.1 Base-Case Forecast
- 11.3.2 Optimistic and Conservative Scenarios
- 11.3.3 Technology, Pricing and Policy Sensitivities
- 11.4 Market Attractiveness and Growth Outlook
Chapter 12 Australia Electronic Bill Presentment and Payment Market Segmentation and Outlook
- 12.1 Segmentation Summary and Market Shares, 2025
- 12.2 Largest and Fastest-Growing Segments
- 12.3 By Solution Type - Market Size and Forecast, 2025-2035
- 12.3.1 Segment Definition and Scope
- 12.3.2 Historical Market Size, 2018-2025
- 12.3.3 Revenue Forecast, 2025-2035
- 12.3.4 Base-Year Market Share, 2025
- 12.3.5 Segment CAGR and Growth Drivers
- 12.3.6 Subsegment Market Size and Forecast
- 12.3.6.1 Electronic Bill Payment
- 12.3.6.2 Electronic Bill Presentment
- 12.3.6.3 Integrated EBPP
- 12.3.7 Subsegment Pricing and Adoption Trends
- 12.3.8 Leading Suppliers and Competition
- 12.3.9 Regional Demand and Opportunities
- 12.4 By End-Use Industry - Market Size and Forecast, 2025-2035
- 12.4.1 Segment Definition and Scope
- 12.4.2 Historical Market Size, 2018-2025
- 12.4.3 Revenue Forecast, 2025-2035
- 12.4.4 Base-Year Market Share, 2025
- 12.4.5 Segment CAGR and Growth Drivers
- 12.4.6 Subsegment Market Size and Forecast
- 12.4.6.1 Utilities
- 12.4.6.2 Telecommunications and Internet
- 12.4.6.3 Financial Services
- 12.4.6.4 Public and Consumer Services
- 12.4.7 Subsegment Pricing and Adoption Trends
- 12.4.8 Leading Suppliers and Competition
- 12.4.9 Regional Demand and Opportunities
- 12.5 By Enterprise Size - Market Size and Forecast, 2025-2035
- 12.5.1 Segment Definition and Scope
- 12.5.2 Historical Market Size, 2018-2025
- 12.5.3 Revenue Forecast, 2025-2035
- 12.5.4 Base-Year Market Share, 2025
- 12.5.5 Segment CAGR and Growth Drivers
- 12.5.6 Subsegment Market Size and Forecast
- 12.5.6.1 Micro Billers
- 12.5.6.2 Small and Midsize Billers
- 12.5.6.3 Enterprise Billers
- 12.5.7 Subsegment Pricing and Adoption Trends
- 12.5.8 Leading Suppliers and Competition
- 12.5.9 Regional Demand and Opportunities
- 12.6 By Deployment Model - Market Size and Forecast, 2025-2035
- 12.6.1 Segment Definition and Scope
- 12.6.2 Historical Market Size, 2018-2025
- 12.6.3 Revenue Forecast, 2025-2035
- 12.6.4 Base-Year Market Share, 2025
- 12.6.5 Segment CAGR and Growth Drivers
- 12.6.6 Subsegment Market Size and Forecast
- 12.6.6.1 Cloud SaaS
- 12.6.6.2 On-Premises
- 12.6.6.3 Hybrid
- 12.6.7 Subsegment Pricing and Adoption Trends
- 12.6.8 Leading Suppliers and Competition
- 12.6.9 Regional Demand and Opportunities
- 12.7 Segment Growth Comparison
- 12.8 Segment Attractiveness and Priority Matrix
Chapter 13 Australia Electronic Bill Presentment and Payment End-Use and Application Market Outlook
- 13.1 End-Use Industry and Customer Demand Structure
- 13.2 Leading Applications and Customer Groups
- 13.3 End-Use Market Size, Share and Forecast
- 13.4 Major End-Use Industry Deep Dives
- 13.4.1 Customer Requirements and Use Cases
- 13.4.2 Demand and Replacement Cycles
- 13.4.3 Technical and Regulatory Considerations
- 13.4.4 Purchasing and Procurement Models
- 13.4.5 Leading Vendors and Distribution Channels
- 13.4.6 Forecast and Commercial Opportunities
- 13.5 Emerging Applications and Cross-Segment Demand
- 13.6 End-Use Industry Investment Priorities
Chapter 14 Australia Electronic Bill Presentment and Payment Geographic Market Outlook, 2025-2035
- 14.1 Domestic Market Distribution and Demand Clusters
- 14.2 State- or Province-Wise Market Size and Forecast, 2025-2035
- 14.3 City and Metropolitan Market Outlook
- 14.4 Industrial, Manufacturing and Commercial Clusters
- 14.5 Geographic Concentration of Key End Users
- 14.6 Local Pricing and Purchasing Differences
- 14.7 Domestic Production Facilities and Capacity Map
- 14.8 Local Infrastructure and Project Pipeline
- 14.9 State-Level Policy and Incentive Differences
- 14.10 Subnational Investment Hotspots and Opportunities
- 14.11 Distribution and Logistics Networks
- 14.12 Domestic Competitive Footprint
Chapter 15 Australia Electronic Bill Presentment and Payment Technology, Innovation and Sustainability Outlook
- 15.1 Technology Landscape and Maturity
- 15.2 Product, Process and Service Innovation
- 15.3 AI, Automation and Digital Tools in the Industry
- 15.4 Technology Adoption and Performance Benchmarking
- 15.5 Innovation Pipeline and R&D Investment
- 15.6 Energy Efficiency and Resource Management
- 15.7 Sustainability, Recycling and Circularity
- 15.8 Technology Roadmap, 2025-2035
- 15.9 Risks of Obsolescence and Technology Substitution
Chapter 16 Australia Electronic Bill Presentment and Payment Market Key Strategic Imperatives
- 16.1 Growth and Market Entry Priorities
- 16.2 High-Return Products and Segments
- 16.3 Pricing, Profitability and Cost Optimization
- 16.4 Technology Investment and Product Differentiation
- 16.5 Supply Chain Localization and Resilience
- 16.6 Distribution and Customer Acquisition
- 16.7 Partnership, Acquisition and Capacity Strategy
- 16.8 Regional Expansion Priorities
- 16.9 Short-, Medium- and Long-Term Actions
Chapter 17 Competition Outlook
- 17.1 Industry Competition Characteristics
- 17.2 Market Structure and Concentration
- 17.3 Market Share and Competitive Positioning, 2025
- 17.4 Company-Wise Revenue and Product Benchmarking
- 17.5 Production and Service Capacity Benchmarking
- 17.6 Technology, Pricing and Differentiation
- 17.7 Regional Footprint and Distribution Strength
- 17.8 Mergers, Acquisitions and Strategic Alliances
- 17.9 New Entrants and Competitive Threats
- 17.10 Porter's Five Forces and Industry Attractiveness
- 17.11 Competitive Outlook, 2025-2035
Chapter 18 Company Profiles
- 18.1 Company Coverage and Selection Criteria
- 18.2 Australian Payments Plus
- 18.2.1 Business Description
- 18.2.2 Company Ownership and Geographic Presence
- 18.2.3 Product and Service Portfolio
- 18.2.4 Manufacturing and Operating Footprint
- 18.2.5 Financial Performance and Investment
- 18.2.6 Market Share and Competitive Position
- 18.2.7 Technology and Innovation Capabilities
- 18.2.8 Strategic Alliances or Partnerships
- 18.2.9 Recent Developments
- 18.2.10 Growth Strategy and Outlook
- 18.3 Australia Post
- 18.4 Ezidebit
- 18.5 ACI Worldwide
- 18.6 Stripe
- 18.7 Xero
- 18.8 MYOB
- 18.9 GoCardless
- 18.10 Payreq
- 18.11 Azupay
- 18.12 Other Relevant Market Participants
Note: Every listed company is profiled on the structure shown under the first company. The company list is preliminary and may change based on research findings, market developments, data availability and client requirements.
Chapter 19 Disclaimer
- 19.1 Research and Forecast Disclaimer
- 19.2 Data Source and Estimation Limitations
Note: The depth of individual sections depends on data availability for this market. Volume, capacity, trade and other unit-based metrics are included where applicable.

