
Payment reform, super rules and open data reshape revenue
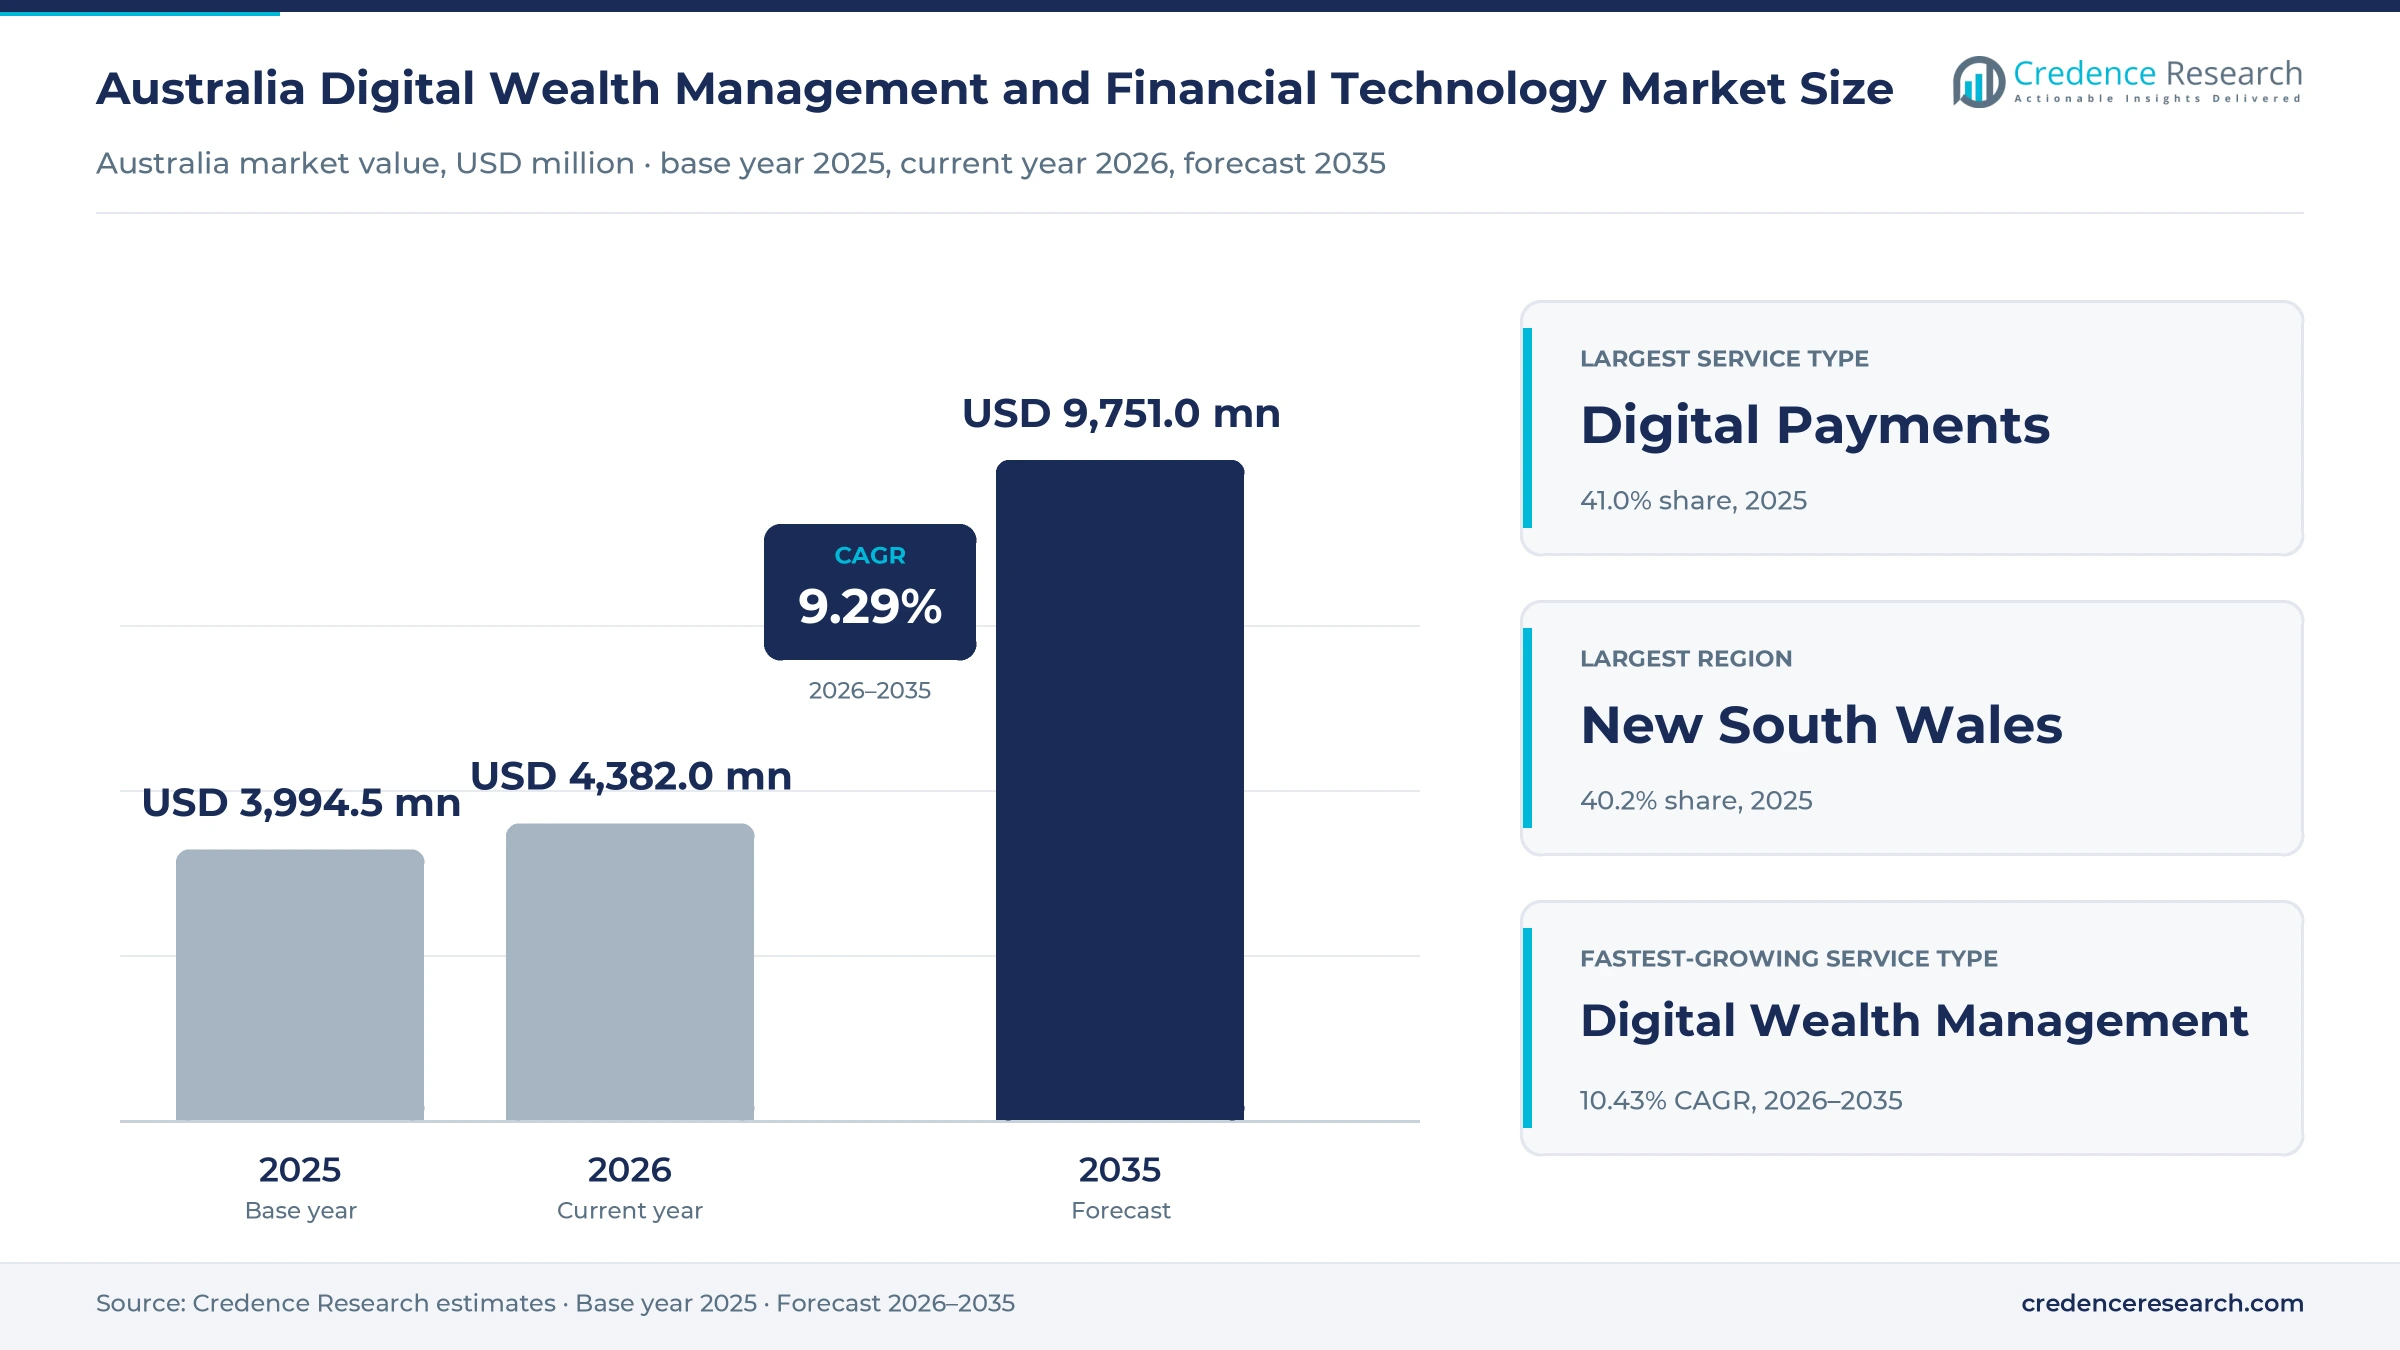
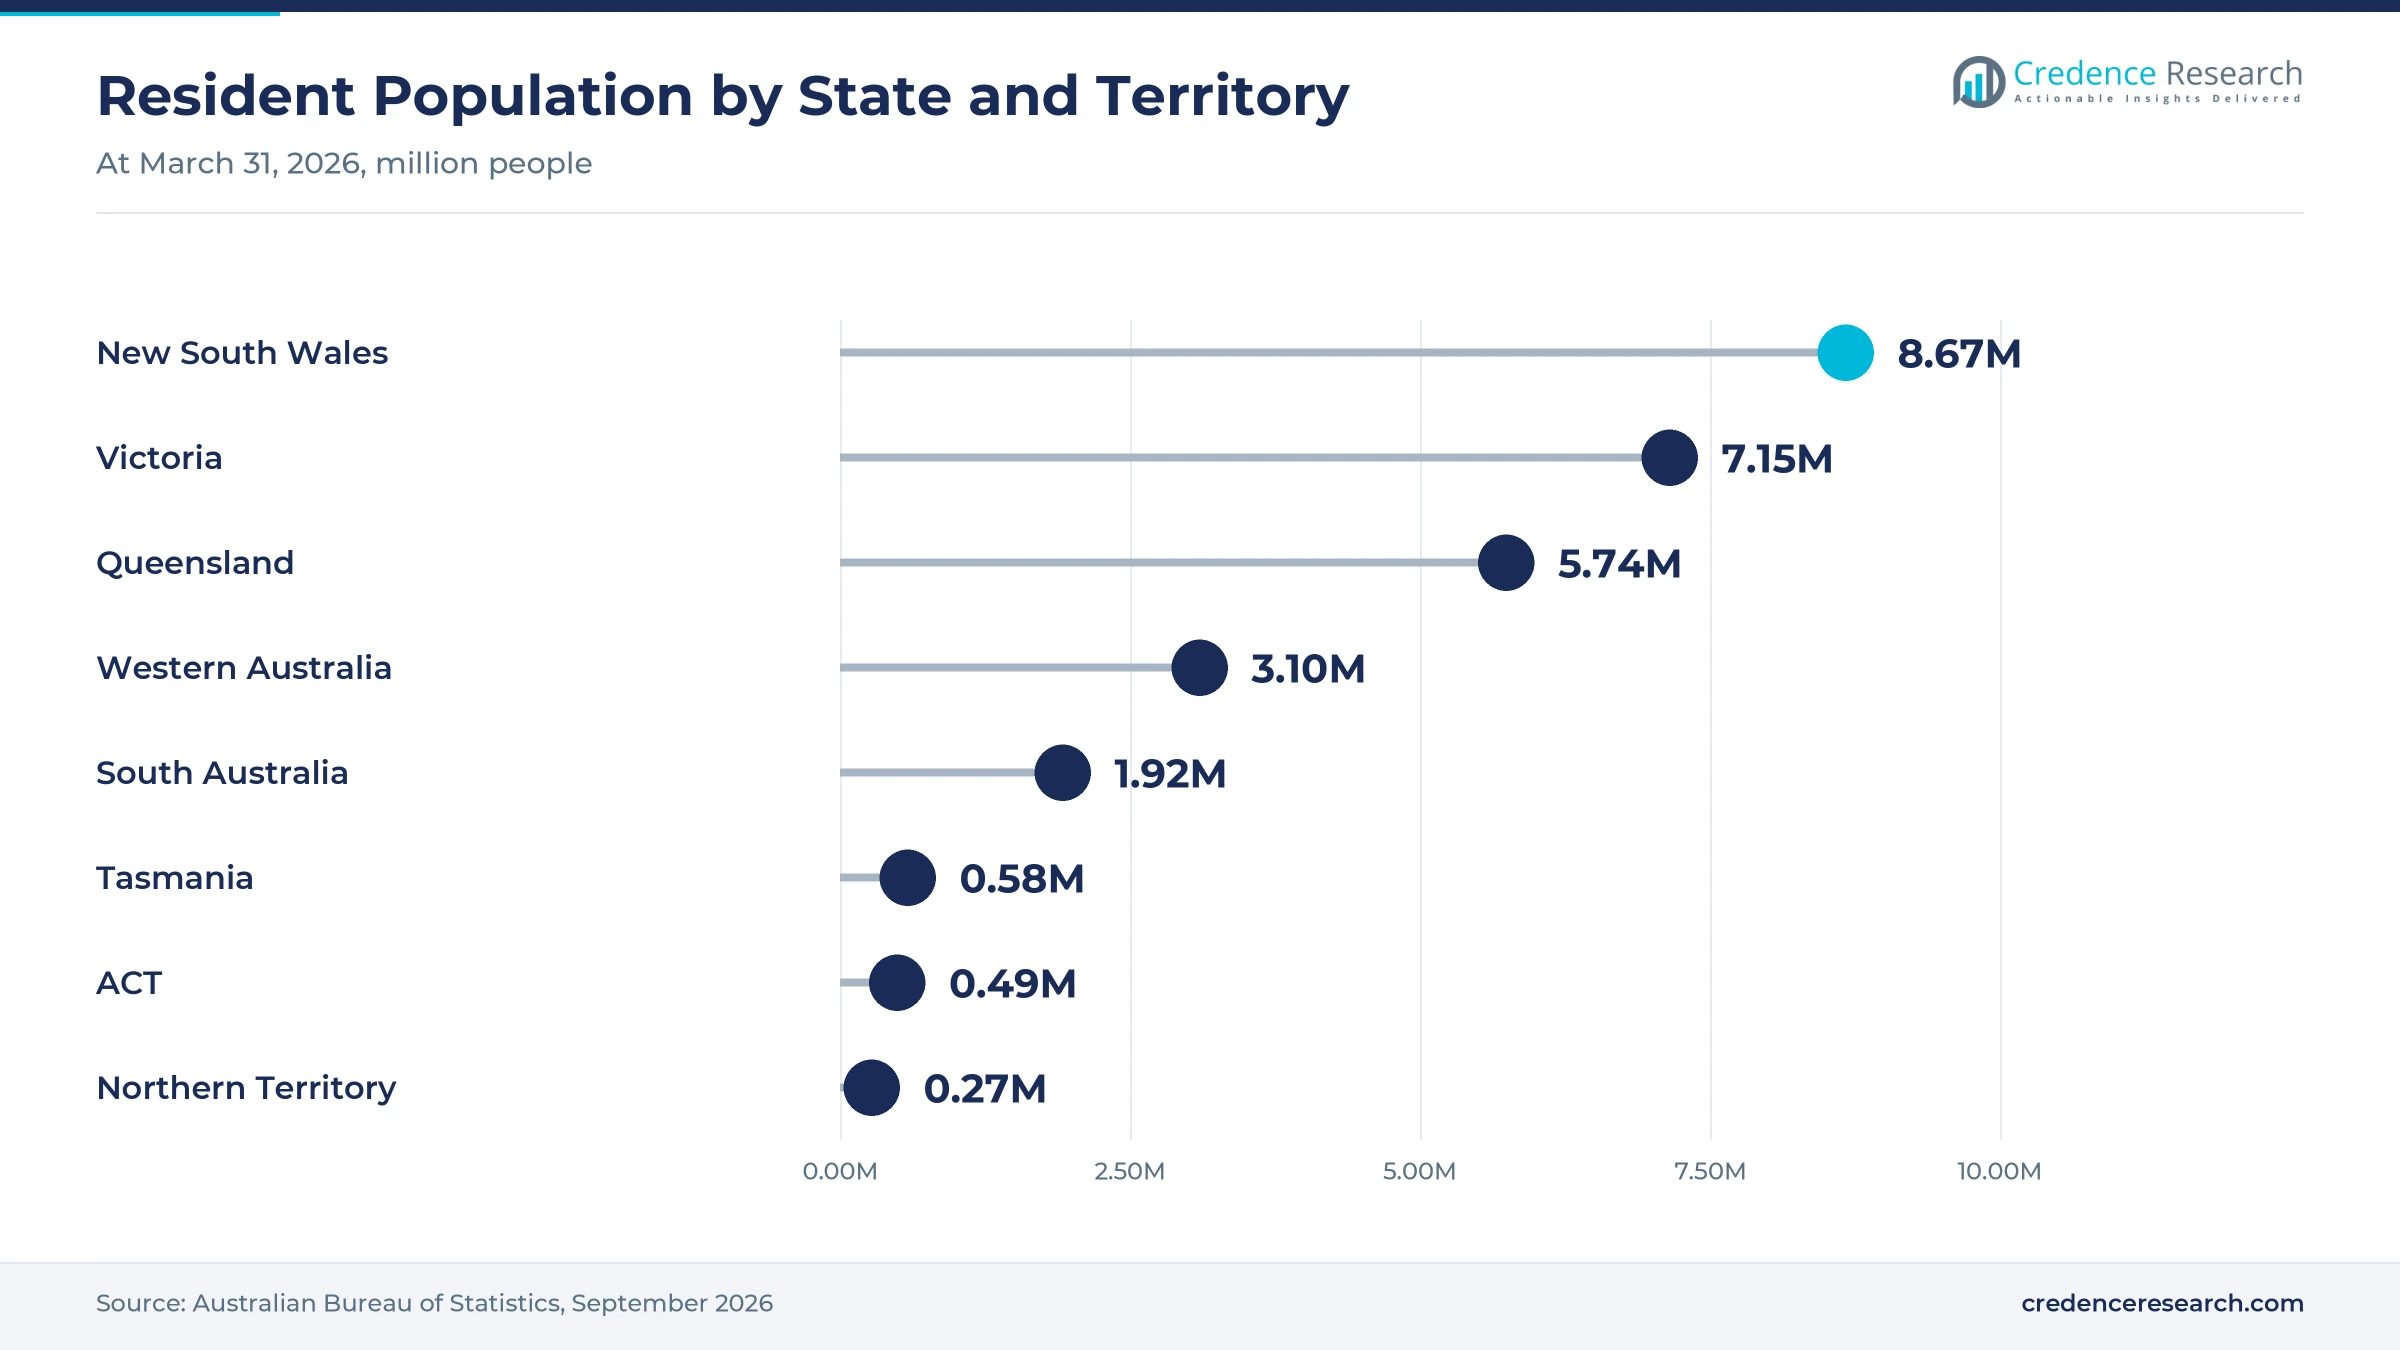
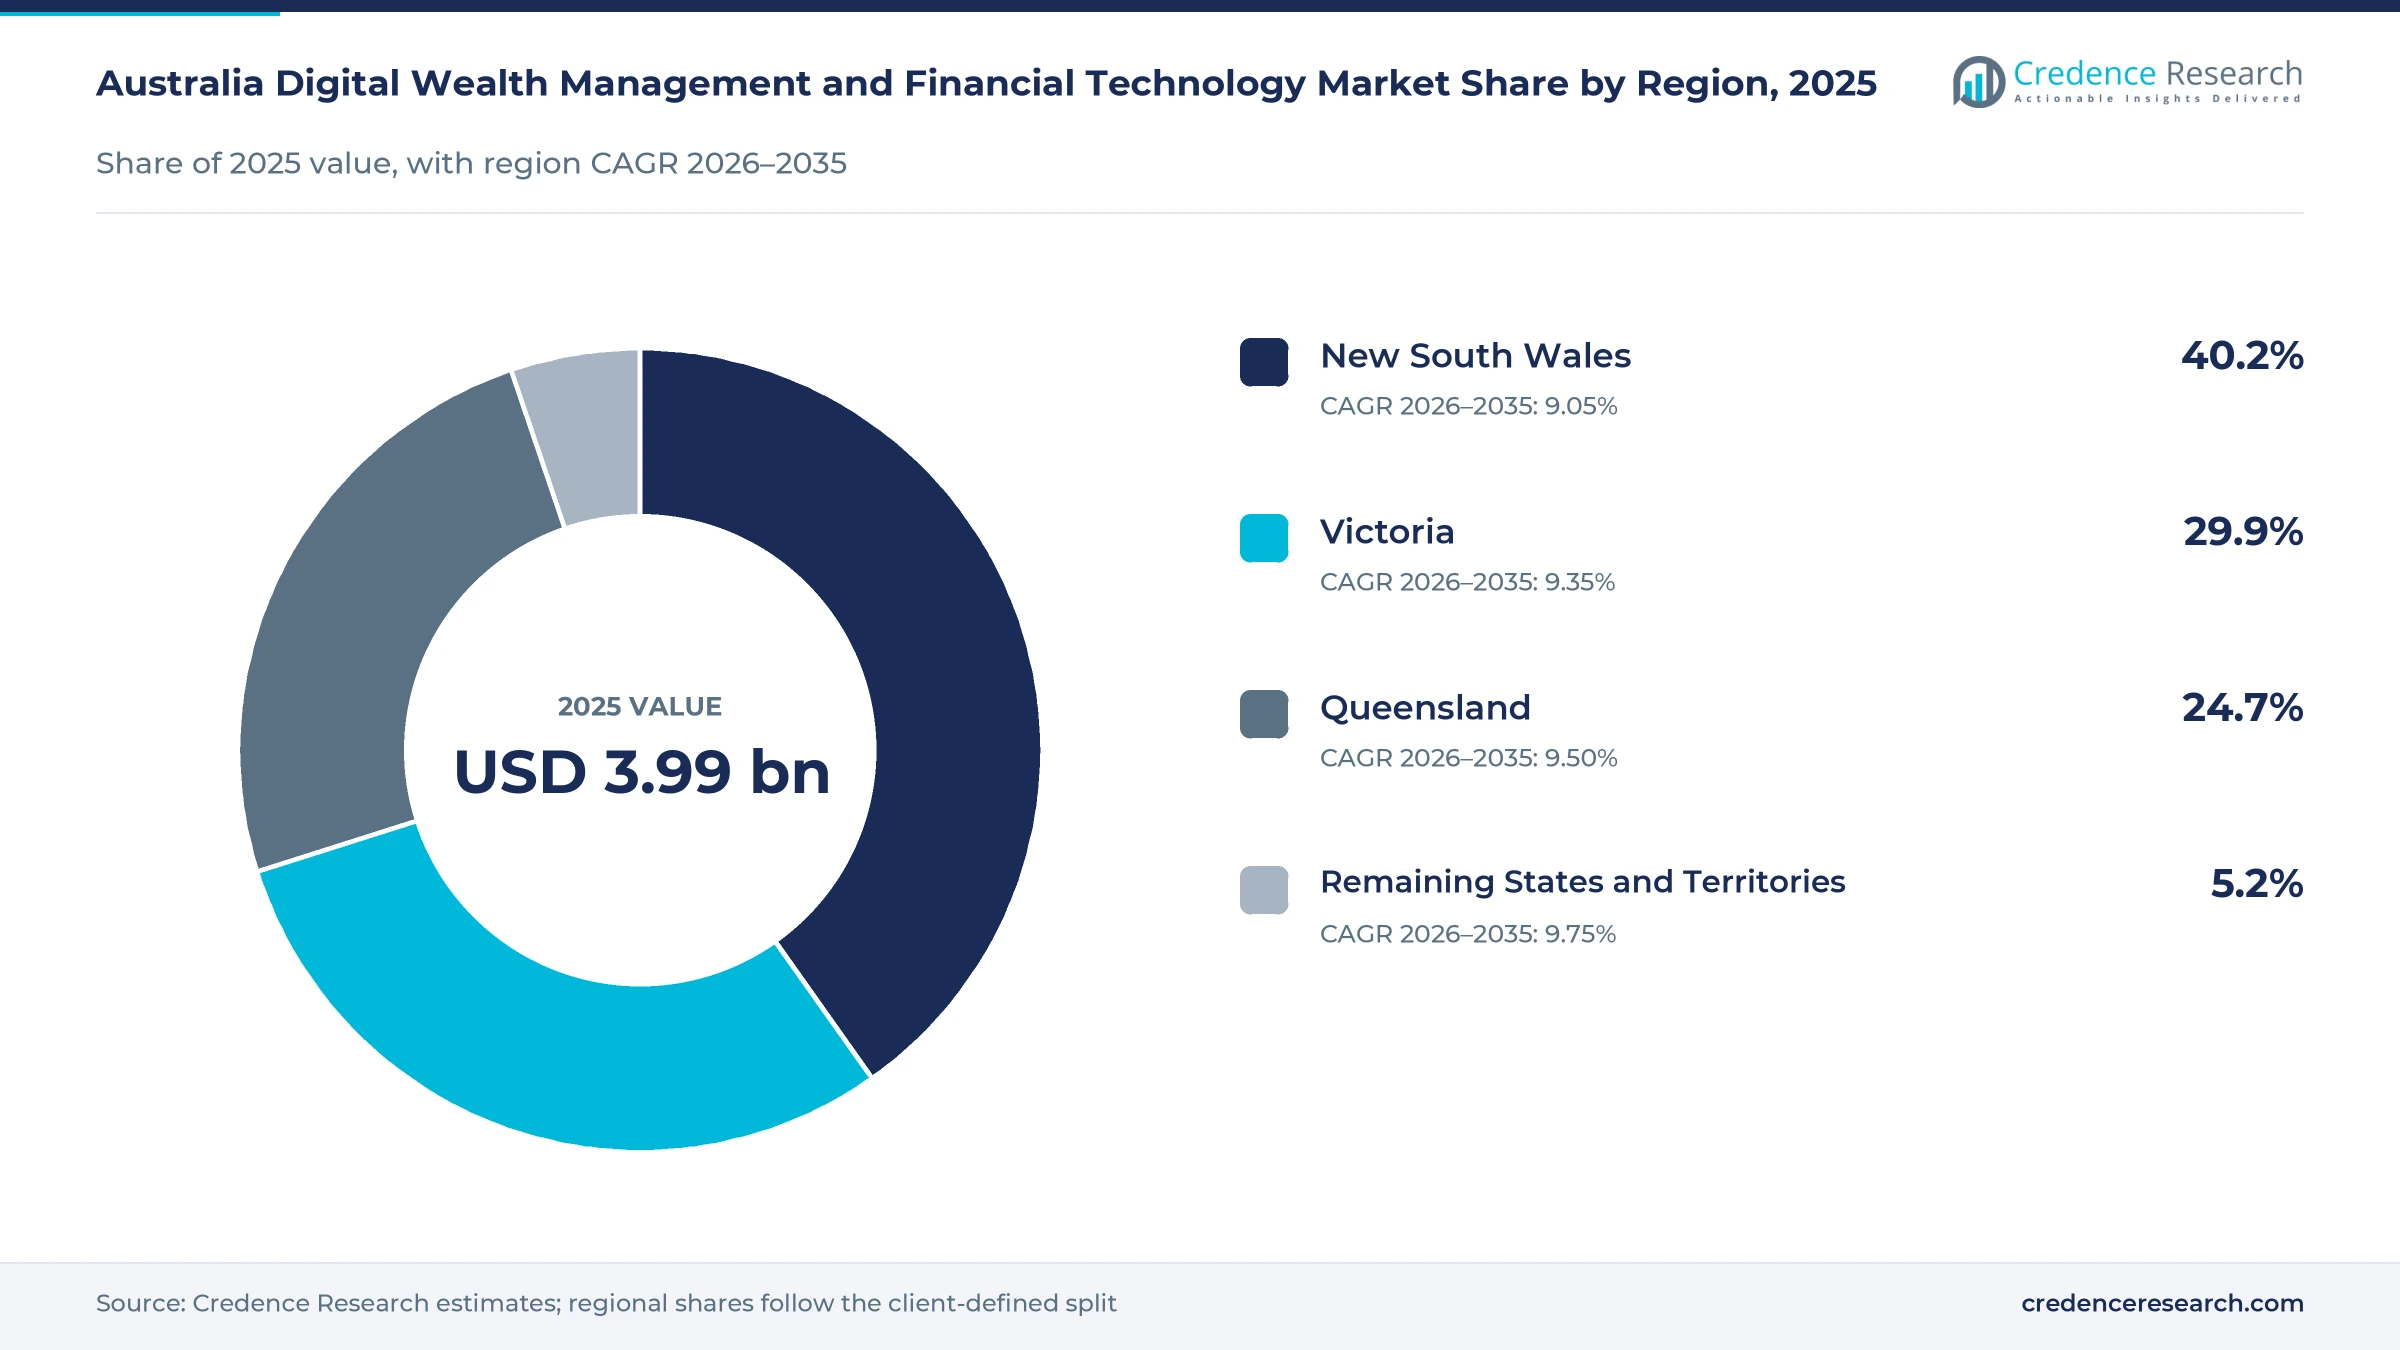
The Australia digital wealth management and financial technology market was valued at USD 3.99 billion in 2025 and is projected to increase from USD 4.38 billion in 2026 to USD 9.75 billion by 2035, registering a CAGR of 9.29% during 2026–2035. Revenue comes from merchants that pay to accept card and account-to-account payments, small businesses and households that borrow through online lenders and pay-later providers, investors who use share trading and micro-investing apps, and lenders and employers that license payments, settlement and accounting software. New South Wales held the largest regional share, 40.2% in 2025, because the state has the most residents, about 8.67 million in March 2026, and the largest pool of businesses and investors. The remaining states and territories are the fastest-growing region at 9.75% a year, as Western Australia adds residents faster than any other state. Card surcharging on designated networks also ends on Oct. 1, 2026, which shifts merchant economics across the payments segment.
Which payment, lending and investing services are counted?
The estimate measures revenue earned in Australia by technology-led providers of digital payments, online lending, digital investing and financial infrastructure software. It counts merchant and transaction fees, net interest and origination income, subscription and license fees, and asset-based fees charged to local customers.
The estimate excludes traditional branch lending, insurance premiums and the investment returns earned by clients themselves. The value chain runs from payment rails and core software through licensed platforms, brokers and accountants to households, small businesses and financial institutions in every state and territory.
Australia Digital Wealth Management and Financial Technology Market Insights
- The Australia digital wealth management and financial technology market was valued at USD 3.99 billion in 2025 and is projected to reach USD 9.75 billion by 2035, registering a CAGR of 9.29% during 2026–2035.
- New South Wales held a 40.2% share of 2025 value, because the state has the largest population and the deepest base of businesses and investors.
- Digital payments led with a 41.0% share of 2025 value, because merchants pay fees on almost every card and account-to-account transaction.
- Payday Super took effect on July 1, 2026, which requires employers to pay super contributions within seven business days of each payday.
- Digital wealth management grows fastest at 10.43% a year during 2026–2035, as investing apps add customers and funds under management.
Payments lead while investing apps grow fastest
Why do payments hold the largest share of revenue?
Based on service type, the market is categorized into digital payments, digital lending, digital wealth management and financial infrastructure software. Digital Payments led with a 41.0% share of 2025 value, because merchants pay acceptance fees on most card and account transfers. Digital Wealth Management grows fastest at 10.43% a year, as micro-investing and share trading apps add funds from younger investors.
How do businesses, households and investors split spending?
Based on customer segment, the market is categorized into retail investors, consumer borrowers and payers, business customers and financial institutions. Business Customers led with a 37.0% share of 2025 value, because small firms buy payments, accounting and working capital services together. Retail Investors grow fastest at 10.28% a year, as more households invest small amounts through apps.
Why do direct apps remain the main channel?
Based on distribution channel, the market is categorized into direct digital channels, intermediated channels and embedded distribution. Direct Digital Channels led with 58.0% of 2025 value, because most customers open accounts through provider apps and websites. Embedded Distribution grows fastest at 10.61% a year, as lenders and payment firms place their services inside accounting, payroll and point-of-sale tools.
How do fee and interest models divide revenue?
Based on revenue model, the market is categorized into transaction fees, net interest and origination income, subscription and licence fees, and asset-based management fees. Transaction Fees led with a 43.0% share of 2025 value, because payment acceptance still earns the most income. Asset-Based Management Fees grow fastest at 10.57% a year, as balances on investing apps rise.
| Segment Group | Leading Sub-segment | Share, 2025 | Fastest-growing Sub-segment | CAGR, 2026–2035 |
|---|---|---|---|---|
| By Service Type | Digital Payments | 41.0% | Digital Wealth Management | 10.43% |
| By Customer Segment | Business Customers | 37.0% | Retail Investors | 10.28% |
| By Distribution Channel | Direct Digital Channels | 58.0% | Embedded Distribution | 10.61% |
| By Revenue Model | Transaction Fees | 43.0% | Asset-Based Management Fees | 10.57% |
Request a Free Sample
Fill in your details and we'll send you a free sample report.
- Sample data tables & charts
- Research methodology
Instant payments, payday super and shared data lift demand
How does real-time payment integration lift volumes?
Merchants, billers and software providers now build services on the New Payments Platform, which settles transfers in seconds and supports PayTo debit agreements. The NPP processed 1.6 billion transactions worth AUD 1.99 trillion in 2024, up 23% on 2023, according to Australian Payments Plus. The platform already handles more than 30% of account-to-account payments, and the industry has set 2030 as the target to retire the older direct entry system. More than 114 million accounts could receive NPP payments at Sept. 30, 2024. As a result, digital payments hold 41.0% of 2025 value, while gateways and billers adopt real-time payments for refunds, payroll and collections.
Why does payday super raise payroll software demand?
Employers must now send super with every pay run instead of each quarter, which pushes payroll, clearing and fund software into continuous use. The law passed Parliament on Nov. 4, 2025, and the federal Treasurer said the tax office estimated AUD 6.25 billion of super went unpaid in the latest year. From July 1, 2026, contributions must reach funds within seven business days of payday. Total contributions rose 11.3% to AUD 226.1 billion in the year to March 2026, according to the prudential regulator APRA. In turn, financial infrastructure software gains volume as employers and funds buy integrated payroll and clearing tools.
How does permissioned data expansion open new products?
Shared account and loan data lets lenders, brokers and comparison tools assess customers faster and price credit more accurately. The competition regulator said on July 13, 2026, that non-bank lenders now share product data under the Consumer Data Right, and at least 35 new data holders will join. Consumer data sharing for these lenders is phased in from Nov. 9, 2026, depending on lender size. More than 1.3 million Australians already use the scheme, an increase of about 135% over the past year. As a result, digital lending and refinancing tools gain better data, and financial institutions buy more data and credit decision software.
Why do small business tools anchor fintech spending?
Small firms want payments, bookkeeping and short-term credit in one place, which ties several revenue streams to one software relationship. Xero reported 2.02 million Australian subscribers at Sept. 30, 2025, up 9% on the year, which makes small-business accounting software a key gateway for lenders and payment firms. Tyro served about 78,000 merchants in fiscal 2026 and launched Tyro Accounting, which brings bookkeeping into the same app as card acceptance and business banking. Prospa passed AUD 5 billion in funding to more than 45,000 small businesses in Australia and New Zealand on Feb. 4, 2026. As a result, business customers hold 37.0% of 2025 value across payments, lending and software.
Surcharge removal, embedded lending and micro-investing
How is the end of card surcharges changing payments?
Merchants can no longer pass card costs to shoppers on designated networks, which moves pricing pressure onto acquirers and pushes merchants toward cheaper rails. The Reserve Bank of Australia decided on March 31, 2026, to remove surcharging on debit, prepaid and credit cards from Oct. 1, 2026, and to cut interchange caps from the same date. The bank also set a cap on interchange for foreign-issued cards from April 1, 2027, and it will raise transparency over fees charged by card networks and payment service providers. In turn, payment providers compete on bundled software and least-cost routing, while transaction fees keep 43.0% of 2025 value.
Why is the rise of phone-based payments significant?
Shoppers now pay with phones and watches more often, which favors providers with modern terminals and tokenized wallets. Device-based payments made up around 40% of card payments in the 2025 Consumer Payments Survey, up from 31% in 2022, according to the central bank. Cards still accounted for about 73% of payments, while cash use stabilized at around 15%. About 43% of consumers used a mobile device for a contactless payment during the survey week. Account ownership reached 98.0% of adults in 2024, according to the World Bank, so nearly every adult can use app-based services. As a result, direct digital channels hold 58.0% of 2025 value.
Can micro-investing apps widen the investor base?
Younger Australians start investing with small, regular amounts through phone apps, which gives digital wealth services a long runway. Raiz Invest reported funds under management of AUD 2.32 billion at June 30, 2026, up 27.5% on the year, and 351,362 active customers, up 6.7%. CommSec processes about 40,000 trades a day, nearly half of them on mobile, and 48% of its users are under 40. Total super assets reached AUD 4.4 trillion at March 2026, according to APRA, which creates a large base for investing tools. As a result, asset-based management fees grow at 10.57% a year, the fastest revenue rate.
Is there room for embedded credit and payment services?
Lenders and payment firms now reach customers inside software and checkout flows they already use, which lowers acquisition costs and leaves room for embedded products. Prospa added Tap to Pay, Bill Pay and Xero integration in an 18-month product push, and it works with more than 20,000 brokers, accountants and aggregators. Afterpay agreed on May 20, 2026, to rename a Sydney indoor arena under a five-year deal, with ticket buyers able to split purchases into four installments. Melbourne-founded Airwallex raised USD 300 million at a USD 6.2 billion valuation on May 21, 2025. In turn, embedded distribution grows at 10.61% a year, alongside embedded finance models.
Credit losses, scam rules and fee reviews test providers
How do rising arrears test online lenders?
Small business and consumer borrowers face tighter cash flow, which raises loan losses for online lenders. Judo Bank reported loans 90 or more days past due and impaired at 2.90% of gross lending assets in fiscal 2026, up from 2.43% a year earlier. Zip reported net bad debts of 1.77% of transaction value, up from 1.52%. As a result, lenders tighten approvals and raise provisions, which slows loan growth in weaker sectors.
Why do scam rules add compliance costs?
Banks and payment firms must now prevent, detect and respond to scams under a national framework, which adds systems and staff costs. The Scams Prevention Framework Bill passed both Houses on Feb. 13, 2025, and the maximum civil penalty for a company starts at about AUD 52.7 million. In turn, providers invest in payee checks and transaction monitoring. Larger platforms spread these costs, while smaller firms rely on shared tools.
How does new licensing reshape pay-later and payments?
Pay-later and payment providers now face the same credit and financial services rules as banks, which raises entry costs for small firms. National Credit Code rules for buy now, pay later contracts took effect on June 10, 2025, according to the corporate regulator ASIC. A draft payments modernization bill released for consultation in March 2026 would bring payment services under licensing. As a result, providers budget for compliance and capital earlier.
Why do fee reviews pressure settlement platforms?
Regulators are reviewing what digital settlement platforms may charge, which creates uncertainty for infrastructure software income. PEXA Group lodged its response in August 2026 to a New South Wales pricing tribunal draft report on electronic lodgment fees. The company processed 4.2 million exchange transactions in fiscal 2026 and expects volumes to decline in fiscal 2027. In turn, platform operators diversify into data and refinancing services.
New South Wales leads while smaller states grow fastest
| Region | Value, 2025 (USD billion) | Share, 2025 | CAGR, 2026–2035 |
|---|---|---|---|
| New South Wales | 1.61 | 40.2% | 9.05% |
| Victoria | 1.19 | 29.9% | 9.35% |
| Queensland | 0.99 | 24.7% | 9.50% |
| Remaining States and Territories | 0.21 | 5.2% | 9.75% |
New South Wales leads on population and investor depth
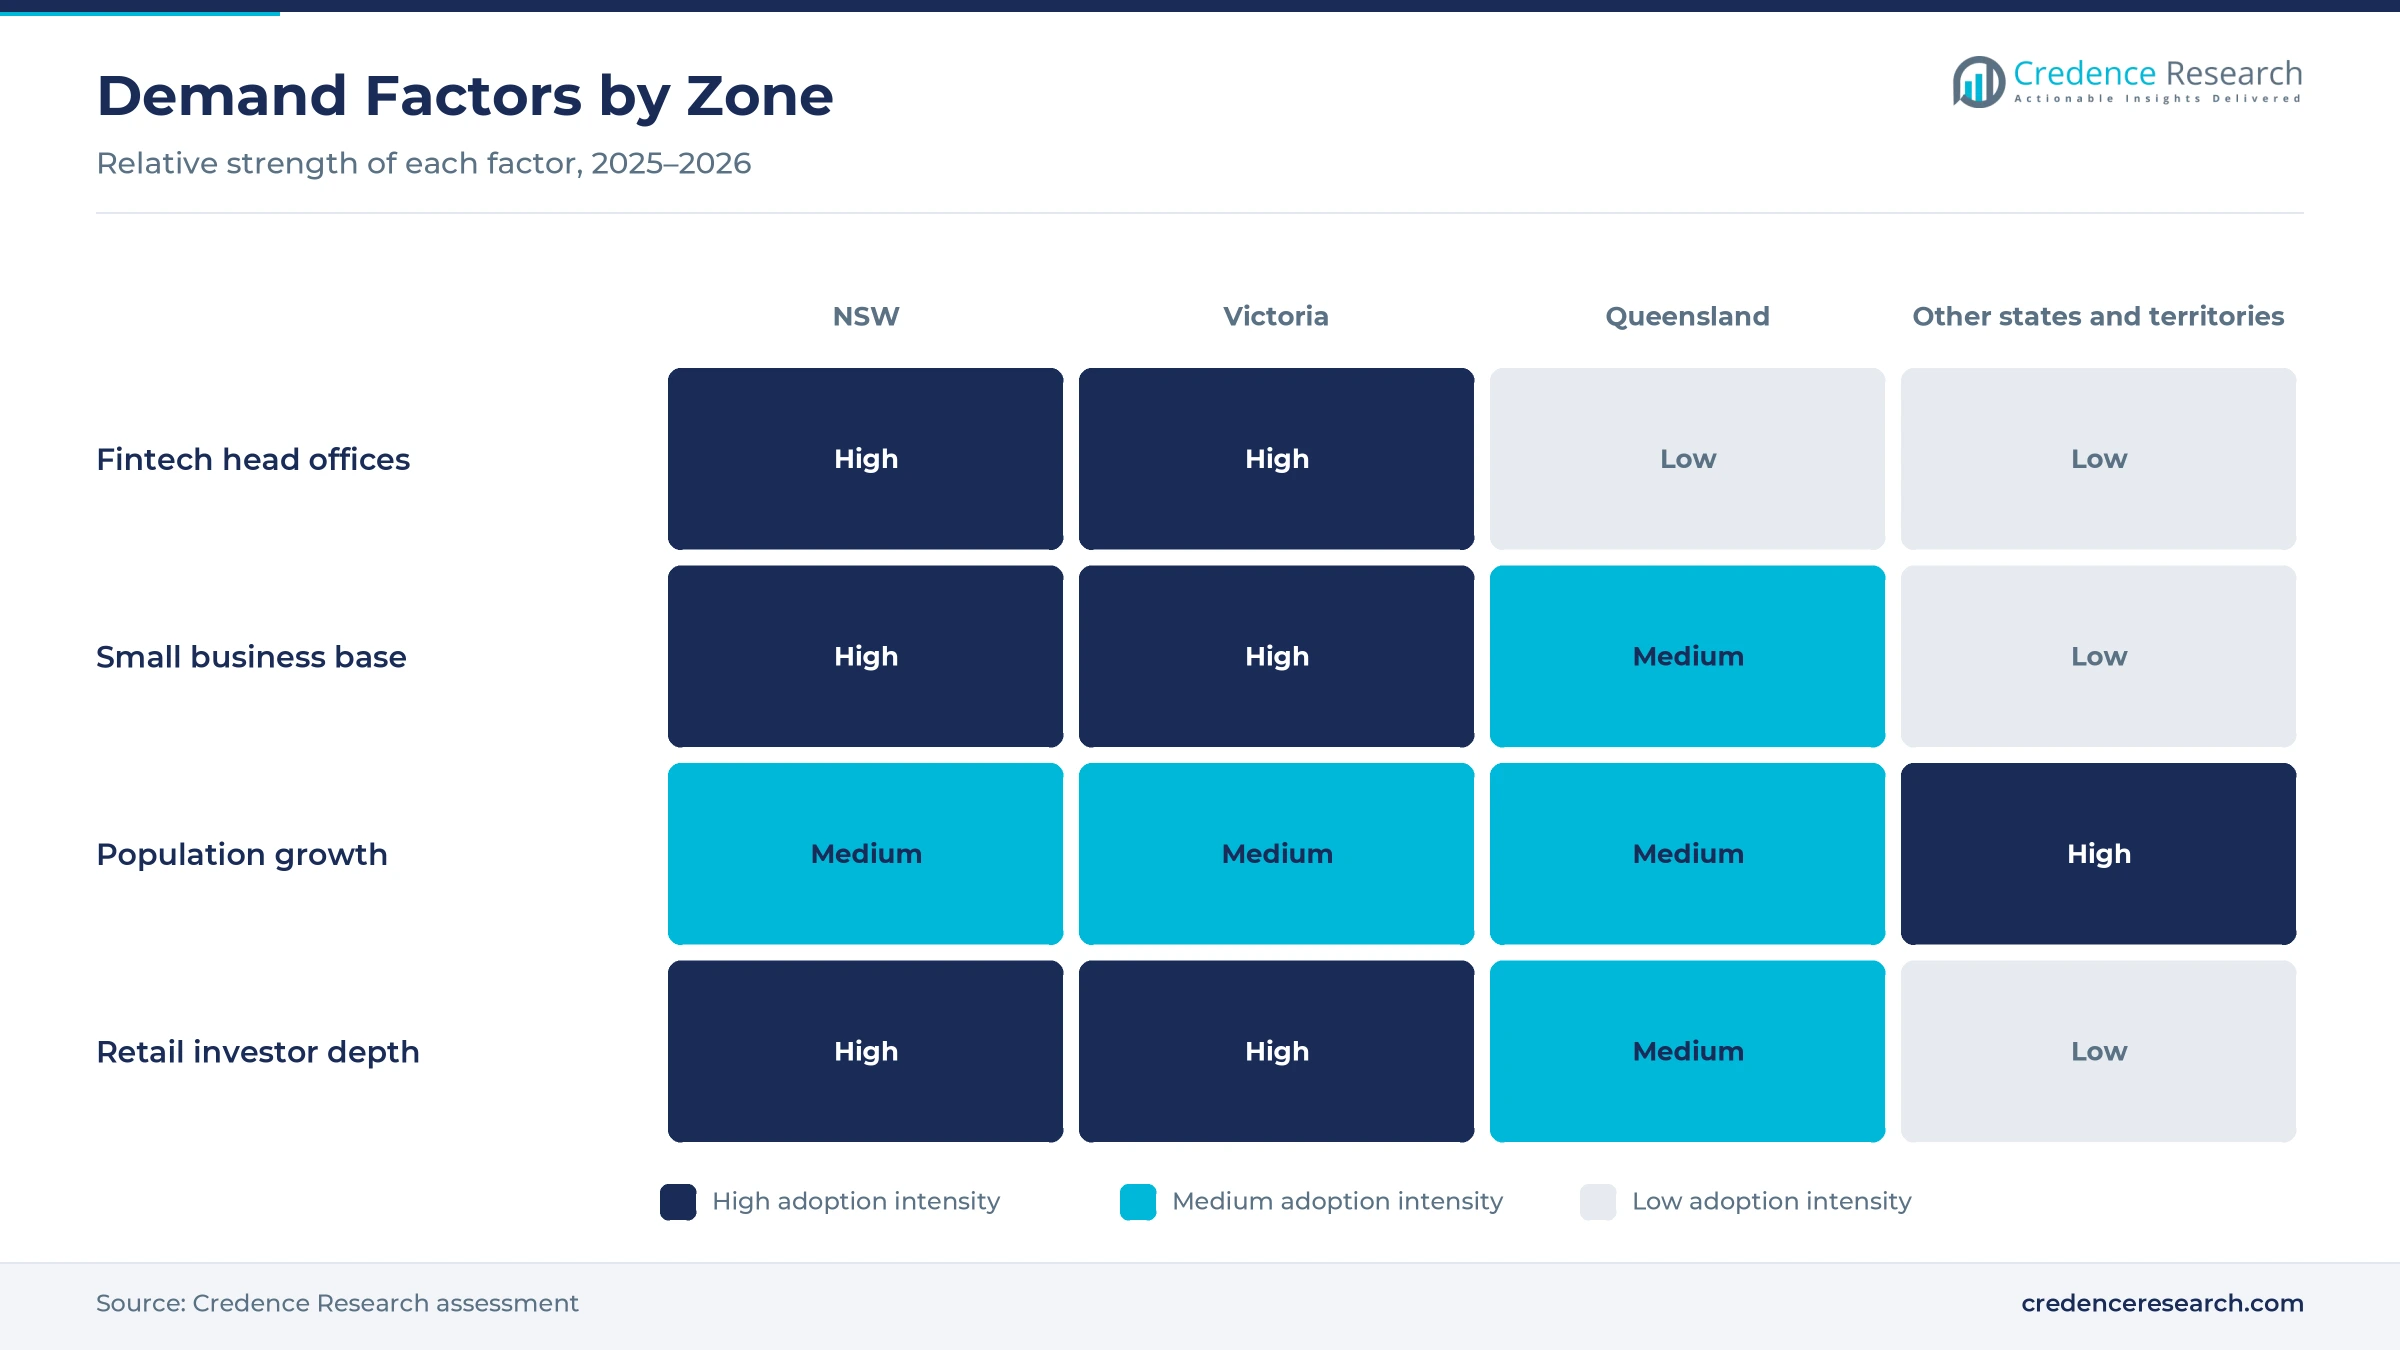
New South Wales held a 40.2% share of 2025 value and grows at 9.05% a year, because the state has the largest population and the deepest pool of businesses and investors. The state had about 8.67 million residents at March 31, 2026, the most of any state, after 1.1% annual growth. As a result, the state holds the largest pool of merchants, borrowers and app-based investors, which keeps it ahead through 2035.
How does Victoria support business payments and lending?
Victoria held a 29.9% share of 2025 value and grows at 9.35% a year, because the state has the second-largest population and a broad base of small businesses and investors. Victoria counted about 7.15 million residents at March 31, 2026, after 1.6% annual growth, faster than New South Wales. As a result, faster population growth adds new households, payers and borrowers each year, which lifts payment and lending volumes from a large base.
What lifts demand in Queensland?
Queensland held a 24.7% share of 2025 value and grows at 9.50% a year, because its population grows faster than that of New South Wales. Queensland counted about 5.74 million residents at March 31, 2026, also after 1.6% annual growth, which adds new households, payers and borrowers each year. As a result, merchant payments, pay-later use and small business lending expand in Brisbane, regional cities and tourism centers.
Why do the remaining states and territories grow fastest?
The remaining states and territories accounted for 5.2% of 2025 value and grow fastest at 9.75% a year. Western Australia recorded the fastest population growth, 2.1% in the year to March 2026, which adds new payers, borrowers and investors faster than the eastern states. As a result, app-based investing and payments gain from a small base.
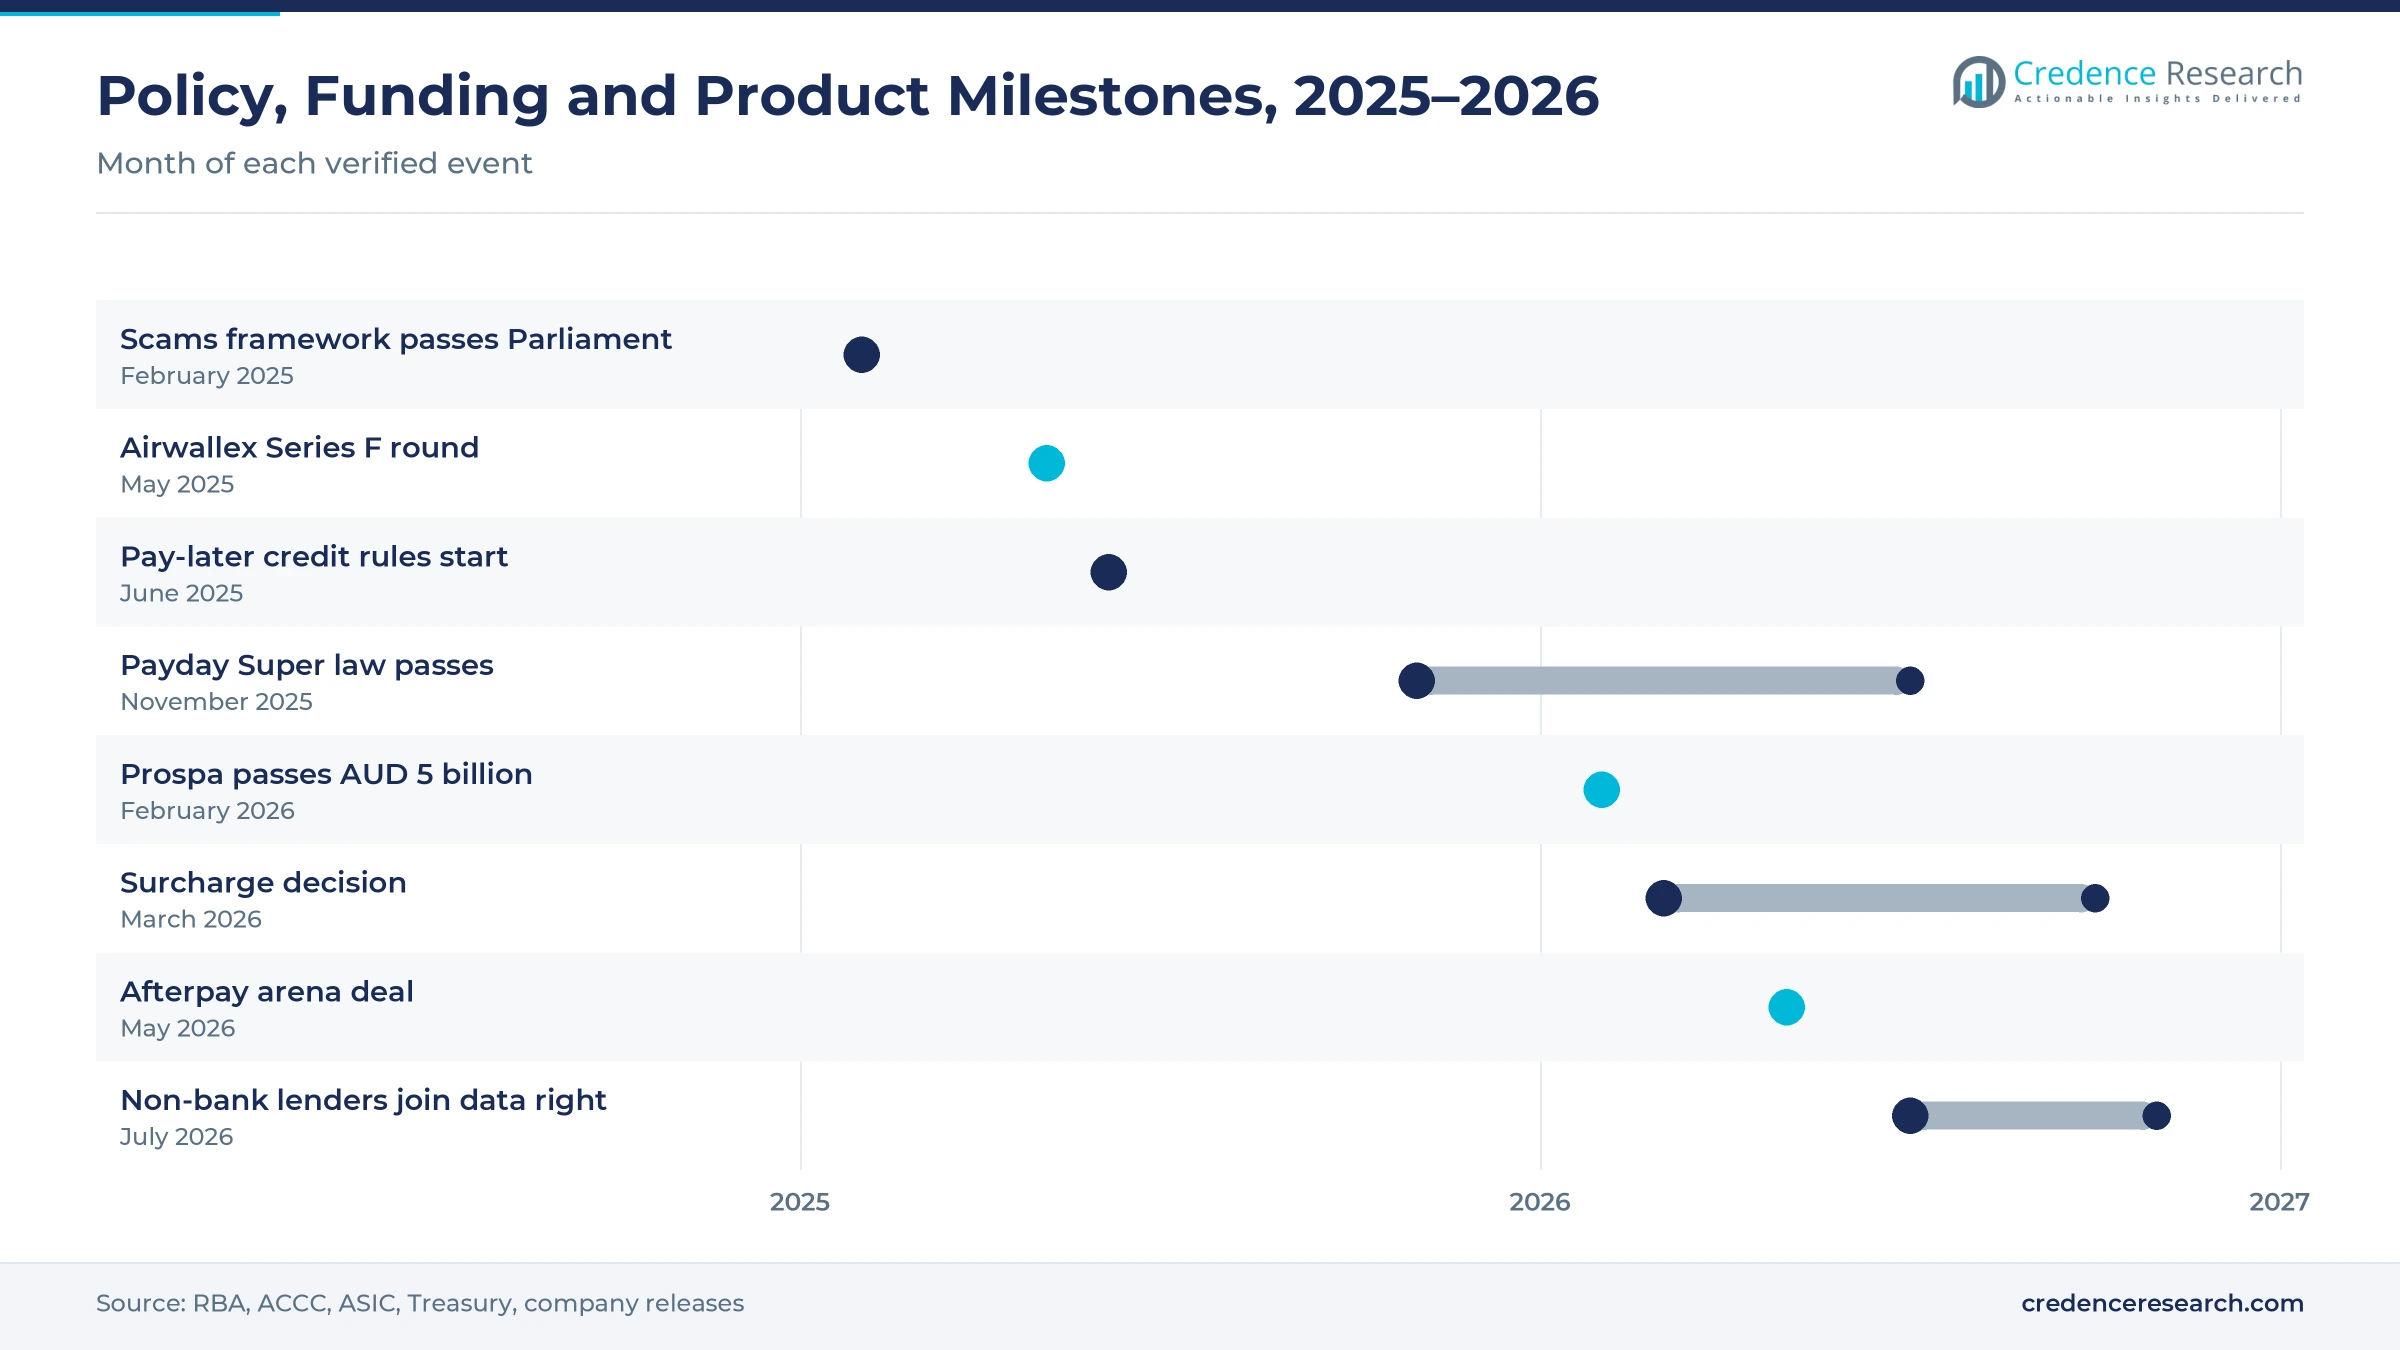
Licensing, funding and product moves, 2025–2026
| Development | Status and market relevance |
|---|---|
| In May 2025, Airwallex raised USD 300 million at a USD 6.2 billion valuation, with several Australian pension funds investing. | Funded expansion of cross-border business accounts |
| In November 2025, Parliament passed Payday Super laws, which took effect on July 1, 2026. | Moves super contributions onto every pay cycle |
| In February 2026, Prospa passed AUD 5 billion in funding to small businesses in Australia and New Zealand. | Shows scale in online small business lending |
| In March 2026, the Reserve Bank of Australia decided to remove card surcharging and cut interchange caps from Oct. 1, 2026. | Resets merchant payment economics |
| In July 2026, non-bank lenders began sharing product data under the Consumer Data Right. | Widens permissioned data for credit decisions |
Payment rails, ledgers and data APIs change supply
- Real-time payment rails such as the New Payments Platform, PayID and PayTo settle transfers in seconds, which lets billers, lenders and payroll tools replace slower direct entry files.
- Open data interfaces under the Consumer Data Right give accredited firms permissioned access to bank and lender data, which shortens loan approvals and supports switching tools.
- Cloud accounting and payroll ledgers connect invoices, wages and super contributions, which lets lenders and lending platforms offer credit inside the tools small firms already use.
Need a Custom Version of This Report?
Tailor the scope, geography, or segments to your exact requirements.
- Custom geography or segment scope
- Direct access to our analyst team
Listed specialists compete with bank-owned platforms
Competition is split between listed specialists, bank-owned platforms and global software vendors. Tyro competes in merchant acquiring with integrated terminals and banking, and it served about 78,000 merchants in fiscal 2026. Zip and Afterpay compete in pay-later, while Zip reported Australia and New Zealand transaction value up 6.2% in fiscal 2026. Judo Bank and Prospa target small business credit through brokers and accountants. Xero anchors small business software with 2.02 million local subscribers. PEXA runs electronic property settlement, and Airwallex serves cross-border businesses. CommSec, owned by Commonwealth Bank, leads online share trading, while Raiz Invest targets micro-investors. Rivals compete on price, payment speed, software integrations and credit quality. Because surcharging ends and licensing widens, scale and compliance capacity now matter more.
Which providers lead Australian payments and investing?
| Company | Type | Role in the market |
|---|---|---|
| Xero | Financial software vendor | 2.02 million Australian subscribers at Sept. 30, 2025 |
| Tyro Payments | Independent operator | About 78,000 merchants; launched Tyro Accounting in fiscal 2026 |
| Zip Co | Independent operator | Exiting New Zealand; local transaction value up 6.2% in fiscal 2026 |
| PEXA Group | Financial software vendor | 4.2 million exchange transactions in fiscal 2026 |
| Judo Bank | Specialist business bank | Lending book of AUD 14.7 billion at June 2026, 71% broker-originated |
| Prospa | Independent operator | Passed AUD 5 billion in small business funding in February 2026 |
| Afterpay | Pay-later provider | Five-year arena naming rights deal announced May 20, 2026 |
| Airwallex | Independent operator | Raised USD 300 million in May 2025; founded in Melbourne |
| CommSec | Bank-owned digital specialist | About 40,000 trades a day, nearly half on mobile |
| Raiz Invest | Independent operator | AUD 2.32 billion funds under management at June 30, 2026 |
Credence Research view on Australian fintech revenue
Credence Research's view is that Australian fintech revenue will keep growing because payments, payroll and credit are moving onto real-time rails and shared data. Payments remain the largest revenue pool, but the end of card surcharging will squeeze margins and reward providers that bundle software and banking. Investing apps and infrastructure software add the fastest growth, helped by Payday Super and a large superannuation base. Providers that combine licensed scale, strong credit control and deep accounting integrations should gain share across the Australia digital wealth management and financial technology base over the next decade.
How the national fintech revenue estimate was built
The report uses 2025 as the base year on a calendar basis, and market values come from the Credence Research model. That model combines central bank payment statistics, prudential superannuation data, population estimates, World Bank financial access data, regulator releases and listed-company operating disclosures. Segment splits and zone growth rates are Credence Research estimates, while zone shares follow the client-defined split. Sources used are official statistics, regulator publications, exchange filings and company releases, and Credence Research conducted no interviews or surveys of its own for this report.
Investing, software and embedded channels lead to 2035
Revenue is expected to reach USD 9.75 billion by 2035, a 9.29% CAGR during 2026–2035, as payments, payroll, lending and investing move onto real-time rails and shared data. Growth should come from digital wealth management, retail investors and embedded distribution. A smooth shift away from card surcharges and steady credit quality would support payments and lending, while higher arrears or stricter licensing would slow smaller providers. Firms with licensed scale, accounting integrations and low-cost payment routing are expected to gain the most as Australia digital wealth management and financial technology revenue grows.
Frequently Asked Questions
How big is the Australia digital wealth management and financial technology market?
Which service type leads Australian fintech revenue?
Which region leads the Australian market?
How does the end of card surcharging affect providers?
What is Payday Super and why does it matter?
How does the Consumer Data Right affect lenders?
Who are the leading companies in the Australian market?
What are the main challenges for providers?
Table of Content
Chapter 1 Market Segmentation
- 1.1 Segmentation Framework
- 1.1.1 Product and Service Classification
- 1.1.2 Application and End-Use Classification
- 1.1.3 Technology and Solution Classification
- 1.1.4 Customer and Distribution Channel Classification
- 1.1.5 Geographic Segmentation
- 1.1.6 Market Segment Definitions and Boundaries
- 1.2 By Service Type
- 1.2.1 Digital Payments
- 1.2.2 Digital Lending
- 1.2.3 Digital Wealth Management
- 1.2.4 Financial Infrastructure Software
- 1.3 By Customer Segment
- 1.3.1 Retail Investors
- 1.3.2 Consumer Borrowers and Payers
- 1.3.3 Business Customers
- 1.3.4 Financial Institutions
- 1.4 By Revenue Model
- 1.4.1 Transaction Fees
- 1.4.2 Net Interest and Origination Income
- 1.4.3 Subscription and Licence Fees
- 1.4.4 Asset-Based Management Fees
Chapter 2 Introduction
- 2.1 Report Objectives and Scope
- 2.2 Product Definition and Industry Terminology
- 2.3 Market Inclusions and Exclusions
- 2.4 Research Process
- 2.4.1 Primary Research and Expert Interviews
- 2.4.2 Secondary Research and Source Review
- 2.4.3 Top-Down and Bottom-Up Estimation
- 2.4.4 Data Triangulation and Verification
- 2.5 Market Size Measurement Basis
- 2.5.1 2025: USD 3.99 billion → 2035: USD 9.75 billion
- 2.6 Historical and Forecast Reference Periods
- 2.6.1 Historical Period: 2018-2025
- 2.6.2 Base Year: 2025
- 2.6.3 Forecast Period: 2025-2035
- 2.7 Research Assumptions and Limitations
Chapter 3 Executive Summary
- 3.1 Market Snapshot and Key Findings
- 3.2 Base-Year Market Size, 2025
- 3.3 Forecast Market Size, 2035
- 3.4 Revenue and Volume Growth Outlook
- 3.5 Key Demand and Supply Indicators
- 3.6 Leading Market Segments
- 3.7 Fastest-Growing Market Opportunities
- 3.8 Regional Performance Highlights
- 3.9 Technology and Industry Transformation
- 3.10 Competitive Landscape Summary
- 3.11 Analyst View and Strategic Implications
Chapter 4 Australia Digital Wealth Management and Financial Technology Market Trends and Developments
- 4.1 Historical Industry Development, 2018-2025
- 4.2 Recent Market Trends and Developments
- 4.3 Demand and Customer Behavior Trends
- 4.4 Technology and Product Innovation
- 4.5 Artificial Intelligence, Automation and Digitalization
- 4.6 Local Manufacturing and Supply Chain Realignment
- 4.7 Industry Partnerships, Mergers and Acquisitions
- 4.8 Sustainability and Circular Economy Developments
- 4.9 Government and Private Sector Investment Trends
- 4.10 Emerging Business Models and Commercialization
- 4.11 Industry Developments and Announcements
Chapter 5 Australia Digital Wealth Management and Financial Technology Market Supply and Demand Analysis
- 5.1 Demand Trend and Consumption Analysis, 2018-2025
- 5.2 Demand Forecast, 2025-2035
- 5.3 Supply Chain Structure and Procurement Trends
- 5.4 Supply-Demand Gap and Bottlenecks
- 5.5 Import Dependence and Sourcing Structure
- 5.6 Regional Supply and Demand Concentration
Chapter 6 Australia Digital Wealth Management and Financial Technology Market Pricing Analysis
- 6.1 Pricing Structure and Measurement
- 6.2 Historical Pricing Trends, 2018-2025
- 6.3 Pricing Outlook, 2025-2035
- 6.4 Pricing by Product and Market Segment
- 6.5 Geographic Pricing Differences
- 6.6 Key Input, Energy, Labor and Logistics Costs
- 6.7 Contract Pricing and Purchasing Models
- 6.8 Pricing Sensitivity and Competitive Positioning
- 6.9 Price, Margin and Profitability Implications
Chapter 7 Australia Digital Wealth Management and Financial Technology Market Dynamics
- 7.1 Market Growth Drivers
- 7.1.1 Demand-Side Drivers
- 7.1.2 Technology and Innovation Drivers
- 7.1.3 Infrastructure and Investment Drivers
- 7.1.4 Regulatory and Policy Drivers
- 7.2 Market Restraints
- 7.2.1 Cost and Affordability Constraints
- 7.2.2 Technology and Adoption Barriers
- 7.2.3 Supply Chain and Operational Constraints
- 7.3 Market Challenges
- 7.3.1 Competitive Pressure and Margin Erosion
- 7.3.2 Skills, Infrastructure and Implementation Gaps
- 7.4 Emerging Market Opportunities
- 7.5 Market Dynamics Impact and Time-Horizon Assessment
Chapter 8 Australia Digital Wealth Management and Financial Technology Value Chain Analysis
- 8.1 Industry Value Chain Overview
- 8.2 Upstream Suppliers and Critical Inputs
- 8.3 Technology and Component Providers
- 8.4 Manufacturing or Service Delivery
- 8.5 Distribution, Channel Partners and Integrators
- 8.6 Downstream Applications and End Users
- 8.7 Value Addition and Profit Pools
- 8.8 Vertical Integration and Outsourcing
- 8.9 Supplier Concentration and Risk
- 8.10 Supply Chain Localization and Resilience
Chapter 9 Australia Digital Wealth Management and Financial Technology Market Regulations and Policies
- 9.1 Relevant Laws, Standards and Compliance Frameworks
- 9.2 Product, Service, Safety and Quality Requirements
- 9.3 Government Policies, Incentives and Subsidies
- 9.4 Imports, Exports and Trade Barriers
- 9.5 Public Procurement and Local Content Requirements
- 9.6 Data Protection, AI and Cybersecurity Compliance
- 9.7 Upcoming Policy Changes and Market Implications
Chapter 10 Australia Digital Wealth Management and Financial Technology Market Hotspots and Opportunities
- 10.1 Market Opportunity Mapping and Growth Hotspots
- 10.2 High-Growth Applications and Customer Groups
- 10.3 Underserved Markets and White-Space Opportunities
- 10.4 Emerging Technology and Product Opportunities
- 10.5 New Capacity and Investment Hotspots
- 10.6 Market Entry and Expansion Opportunities
- 10.7 Distribution and Partnership Opportunities
- 10.8 Near-Term and Long-Term Commercial Potential
- 10.9 Opportunity Attractiveness and Execution Risks
Chapter 11 Australia Digital Wealth Management and Financial Technology Market Outlook, 2025-2035
- 11.1 Market Size and Analysis
- 11.1.1 Revenue (Market Measurement: 2025: USD 3.99 billion → 2035: USD 9.75 billion)
- 11.1.2 Historical Market Size, 2018-2025
- 11.1.3 Base-Year Market Size, 2025
- 11.2 Market Forecast, 2025-2035
- 11.2.1 Revenue Forecast to 2035
- 11.2.2 CAGR and Year-on-Year Growth
- 11.2.3 Incremental Revenue Opportunity
- 11.3 Forecast Assumptions and Scenario Analysis
- 11.3.1 Base-Case Forecast
- 11.3.2 Optimistic and Conservative Scenarios
- 11.3.3 Technology, Pricing and Policy Sensitivities
- 11.4 Market Attractiveness and Growth Outlook
Chapter 12 Australia Digital Wealth Management and Financial Technology Market Segmentation and Outlook
- 12.1 Segmentation Summary and Market Shares, 2025
- 12.2 Largest and Fastest-Growing Segments
- 12.3 By Service Type - Market Size and Forecast, 2025-2035
- 12.3.1 Segment Definition and Scope
- 12.3.2 Historical Market Size, 2018-2025
- 12.3.3 Revenue Forecast, 2025-2035
- 12.3.4 Base-Year Market Share, 2025
- 12.3.5 Segment CAGR and Growth Drivers
- 12.3.6 Subsegment Market Size and Forecast
- 12.3.6.1 Digital Payments
- 12.3.6.2 Digital Lending
- 12.3.6.3 Digital Wealth Management
- 12.3.6.4 Financial Infrastructure Software
- 12.3.7 Subsegment Pricing and Adoption Trends
- 12.3.8 Leading Suppliers and Competition
- 12.3.9 Regional Demand and Opportunities
- 12.4 By Customer Segment - Market Size and Forecast, 2025-2035
- 12.4.1 Segment Definition and Scope
- 12.4.2 Historical Market Size, 2018-2025
- 12.4.3 Revenue Forecast, 2025-2035
- 12.4.4 Base-Year Market Share, 2025
- 12.4.5 Segment CAGR and Growth Drivers
- 12.4.6 Subsegment Market Size and Forecast
- 12.4.6.1 Retail Investors
- 12.4.6.2 Consumer Borrowers and Payers
- 12.4.6.3 Business Customers
- 12.4.6.4 Financial Institutions
- 12.4.7 Subsegment Pricing and Adoption Trends
- 12.4.8 Leading Suppliers and Competition
- 12.4.9 Regional Demand and Opportunities
- 12.5 By Revenue Model - Market Size and Forecast, 2025-2035
- 12.5.1 Segment Definition and Scope
- 12.5.2 Historical Market Size, 2018-2025
- 12.5.3 Revenue Forecast, 2025-2035
- 12.5.4 Base-Year Market Share, 2025
- 12.5.5 Segment CAGR and Growth Drivers
- 12.5.6 Subsegment Market Size and Forecast
- 12.5.6.1 Transaction Fees
- 12.5.6.2 Net Interest and Origination Income
- 12.5.6.3 Subscription and Licence Fees
- 12.5.6.4 Asset-Based Management Fees
- 12.5.7 Subsegment Pricing and Adoption Trends
- 12.5.8 Leading Suppliers and Competition
- 12.5.9 Regional Demand and Opportunities
- 12.6 Segment Growth Comparison
- 12.7 Segment Attractiveness and Priority Matrix
Chapter 13 Australia Digital Wealth Management and Financial Technology End-Use and Application Market Outlook
- 13.1 End-Use Industry and Customer Demand Structure
- 13.2 Leading Applications and Customer Groups
- 13.3 End-Use Market Size, Share and Forecast
- 13.4 Major End-Use Industry Deep Dives
- 13.4.1 Customer Requirements and Use Cases
- 13.4.2 Demand and Replacement Cycles
- 13.4.3 Technical and Regulatory Considerations
- 13.4.4 Purchasing and Procurement Models
- 13.4.5 Leading Vendors and Distribution Channels
- 13.4.6 Forecast and Commercial Opportunities
- 13.5 Emerging Applications and Cross-Segment Demand
- 13.6 End-Use Industry Investment Priorities
Chapter 14 Australia Digital Wealth Management and Financial Technology Geographic Market Outlook, 2025-2035
- 14.1 Domestic Market Distribution and Demand Clusters
- 14.2 State- or Province-Wise Market Size and Forecast, 2025-2035
- 14.3 City and Metropolitan Market Outlook
- 14.4 Industrial, Manufacturing and Commercial Clusters
- 14.5 Geographic Concentration of Key End Users
- 14.6 Local Pricing and Purchasing Differences
- 14.7 Domestic Production Facilities and Capacity Map
- 14.8 Local Infrastructure and Project Pipeline
- 14.9 State-Level Policy and Incentive Differences
- 14.10 Subnational Investment Hotspots and Opportunities
- 14.11 Distribution and Logistics Networks
- 14.12 Domestic Competitive Footprint
Chapter 15 Australia Digital Wealth Management and Financial Technology Technology, Innovation and Sustainability Outlook
- 15.1 Technology Landscape and Maturity
- 15.2 Product, Process and Service Innovation
- 15.3 AI, Automation and Digital Tools in the Industry
- 15.4 Technology Adoption and Performance Benchmarking
- 15.5 Innovation Pipeline and R&D Investment
- 15.6 Energy Efficiency and Resource Management
- 15.7 Sustainability, Recycling and Circularity
- 15.8 Technology Roadmap, 2025-2035
- 15.9 Risks of Obsolescence and Technology Substitution
Chapter 16 Australia Digital Wealth Management and Financial Technology Market Key Strategic Imperatives
- 16.1 Growth and Market Entry Priorities
- 16.2 High-Return Products and Segments
- 16.3 Pricing, Profitability and Cost Optimization
- 16.4 Technology Investment and Product Differentiation
- 16.5 Supply Chain Localization and Resilience
- 16.6 Distribution and Customer Acquisition
- 16.7 Partnership, Acquisition and Capacity Strategy
- 16.8 Regional Expansion Priorities
- 16.9 Short-, Medium- and Long-Term Actions
Chapter 17 Competition Outlook
- 17.1 Industry Competition Characteristics
- 17.2 Market Structure and Concentration
- 17.3 Market Share and Competitive Positioning, 2025
- 17.4 Company-Wise Revenue and Product Benchmarking
- 17.5 Production and Service Capacity Benchmarking
- 17.6 Technology, Pricing and Differentiation
- 17.7 Regional Footprint and Distribution Strength
- 17.8 Mergers, Acquisitions and Strategic Alliances
- 17.9 New Entrants and Competitive Threats
- 17.10 Porter's Five Forces and Industry Attractiveness
- 17.11 Competitive Outlook, 2025-2035
Chapter 18 Company Profiles
- 18.1 Company Coverage and Selection Criteria
- 18.2 Xero
- 18.2.1 Business Description
- 18.2.2 Company Ownership and Geographic Presence
- 18.2.3 Product and Service Portfolio
- 18.2.4 Manufacturing and Operating Footprint
- 18.2.5 Financial Performance and Investment
- 18.2.6 Market Share and Competitive Position
- 18.2.7 Technology and Innovation Capabilities
- 18.2.8 Strategic Alliances or Partnerships
- 18.2.9 Recent Developments
- 18.2.10 Growth Strategy and Outlook
- 18.3 Tyro Payments
- 18.4 Zip Co
- 18.5 PEXA Group
- 18.6 Judo Bank
- 18.7 Prospa
- 18.8 Afterpay
- 18.9 Airwallex
- 18.10 CommSec
- 18.11 Raiz Invest
- 18.12 Other Relevant Market Participants
Note: Every listed company is profiled on the structure shown under the first company. The company list is preliminary and may change based on research findings, market developments, data availability and client requirements.
Chapter 19 Disclaimer
- 19.1 Research and Forecast Disclaimer
- 19.2 Data Source and Estimation Limitations
Note: The depth of individual sections depends on data availability for this market. Volume, capacity, trade and other unit-based metrics are included where applicable.

