
Platform flows and online cover lift fee revenue
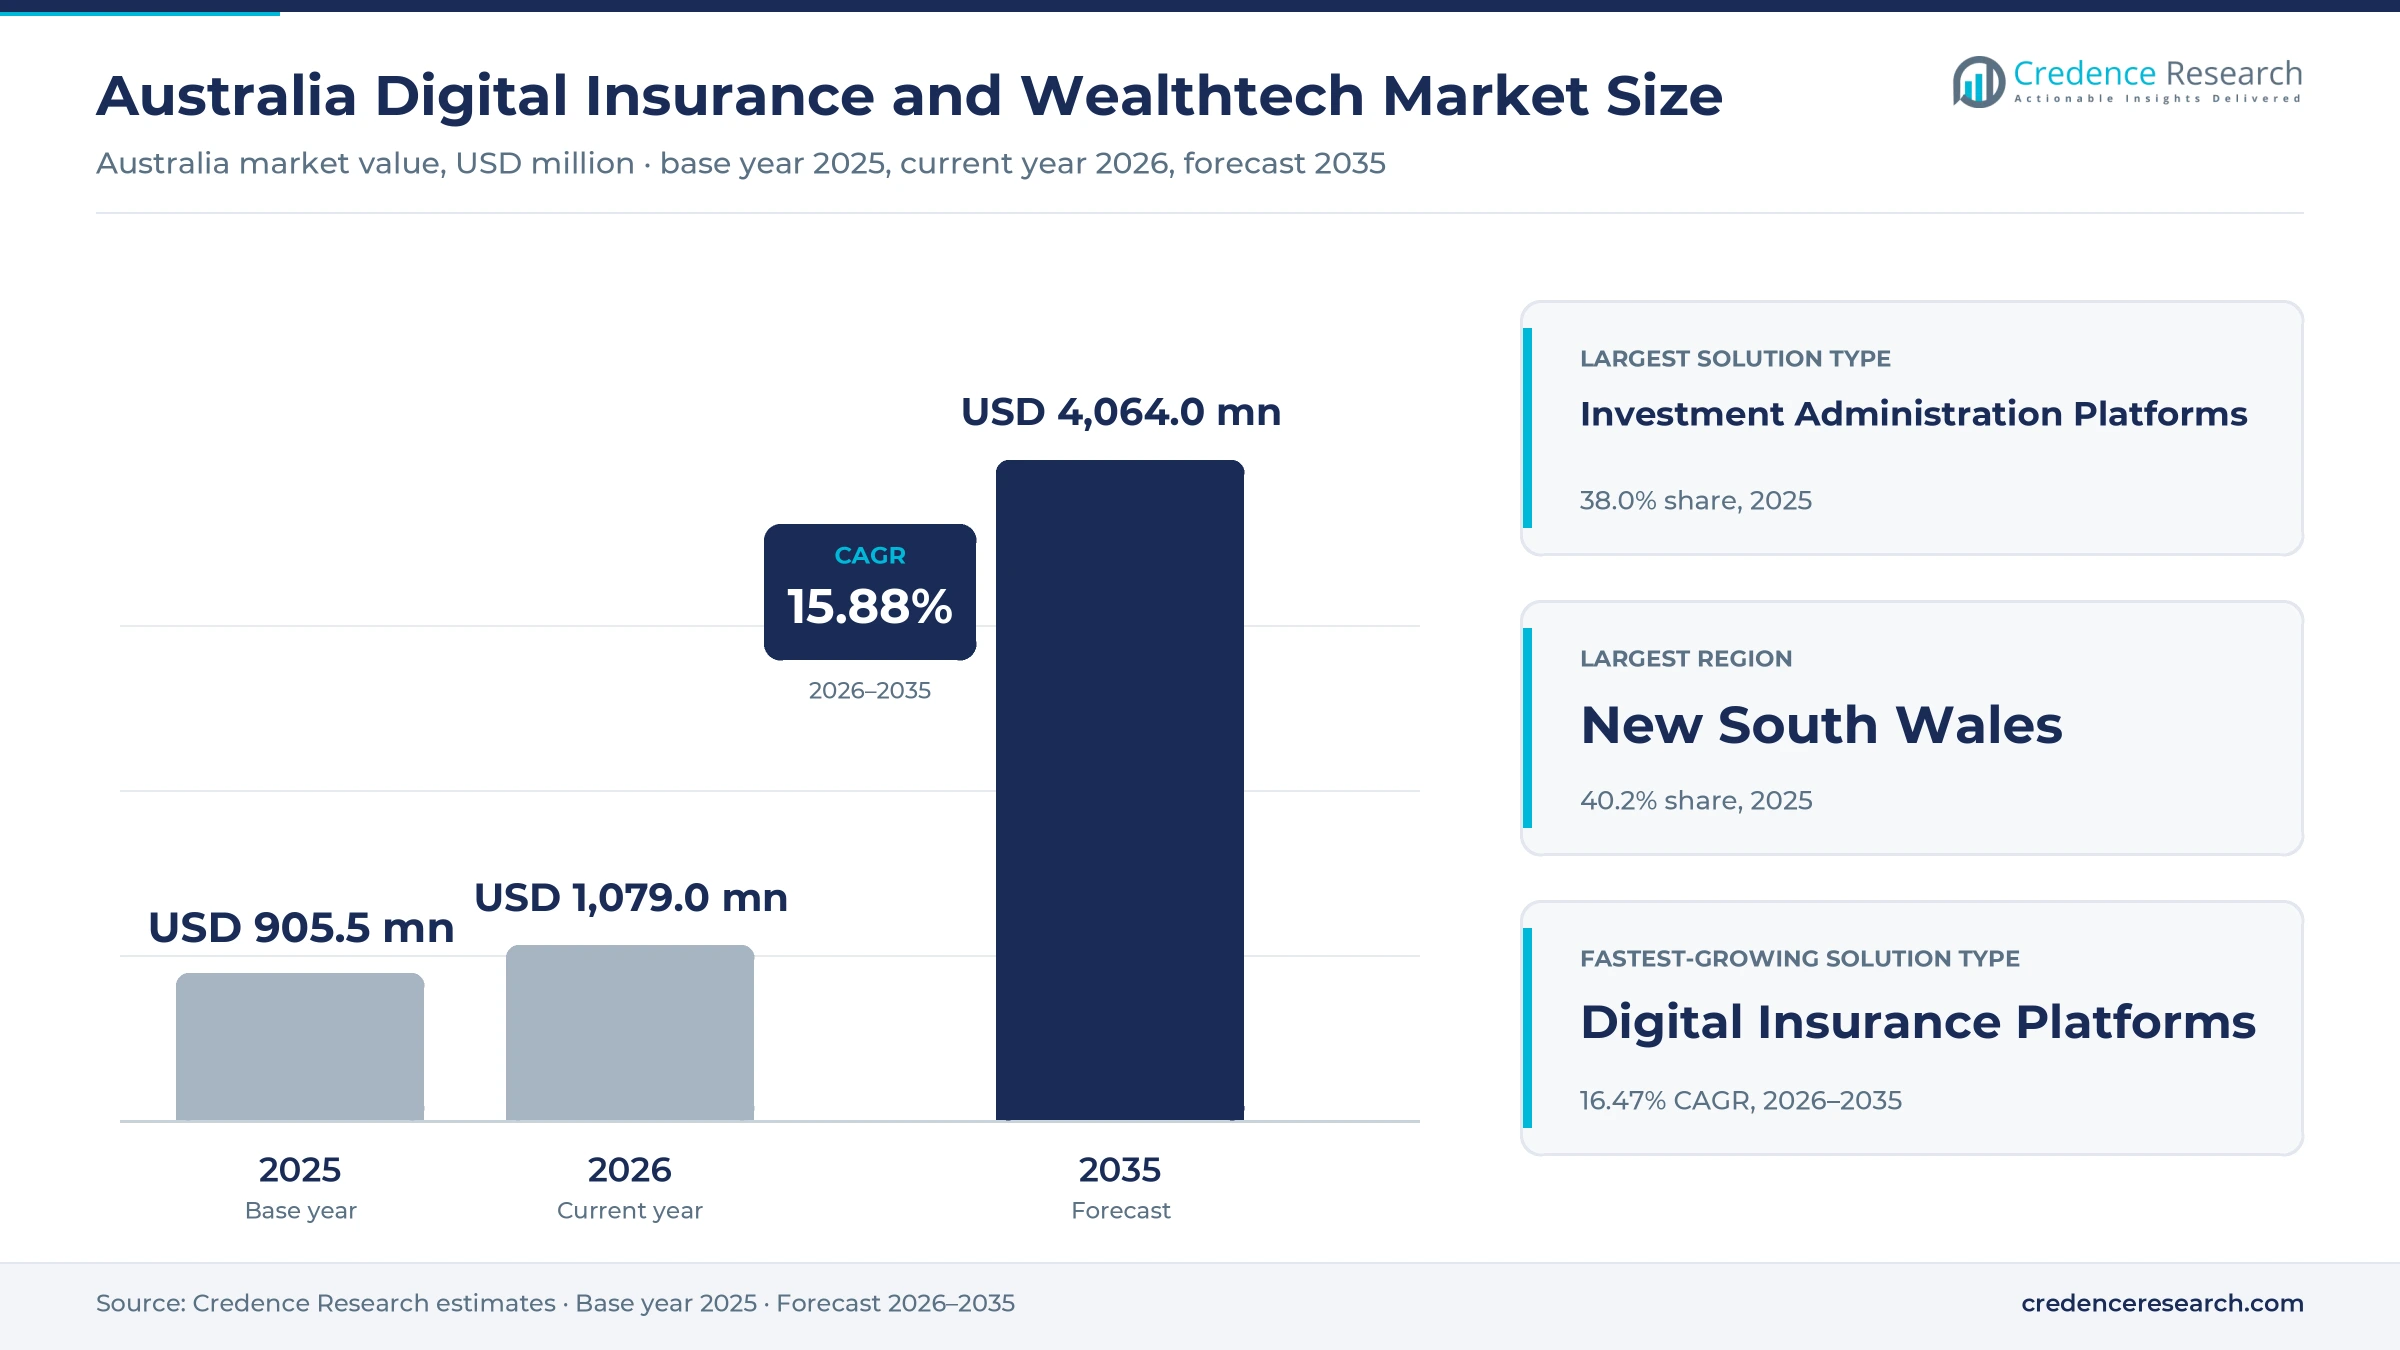
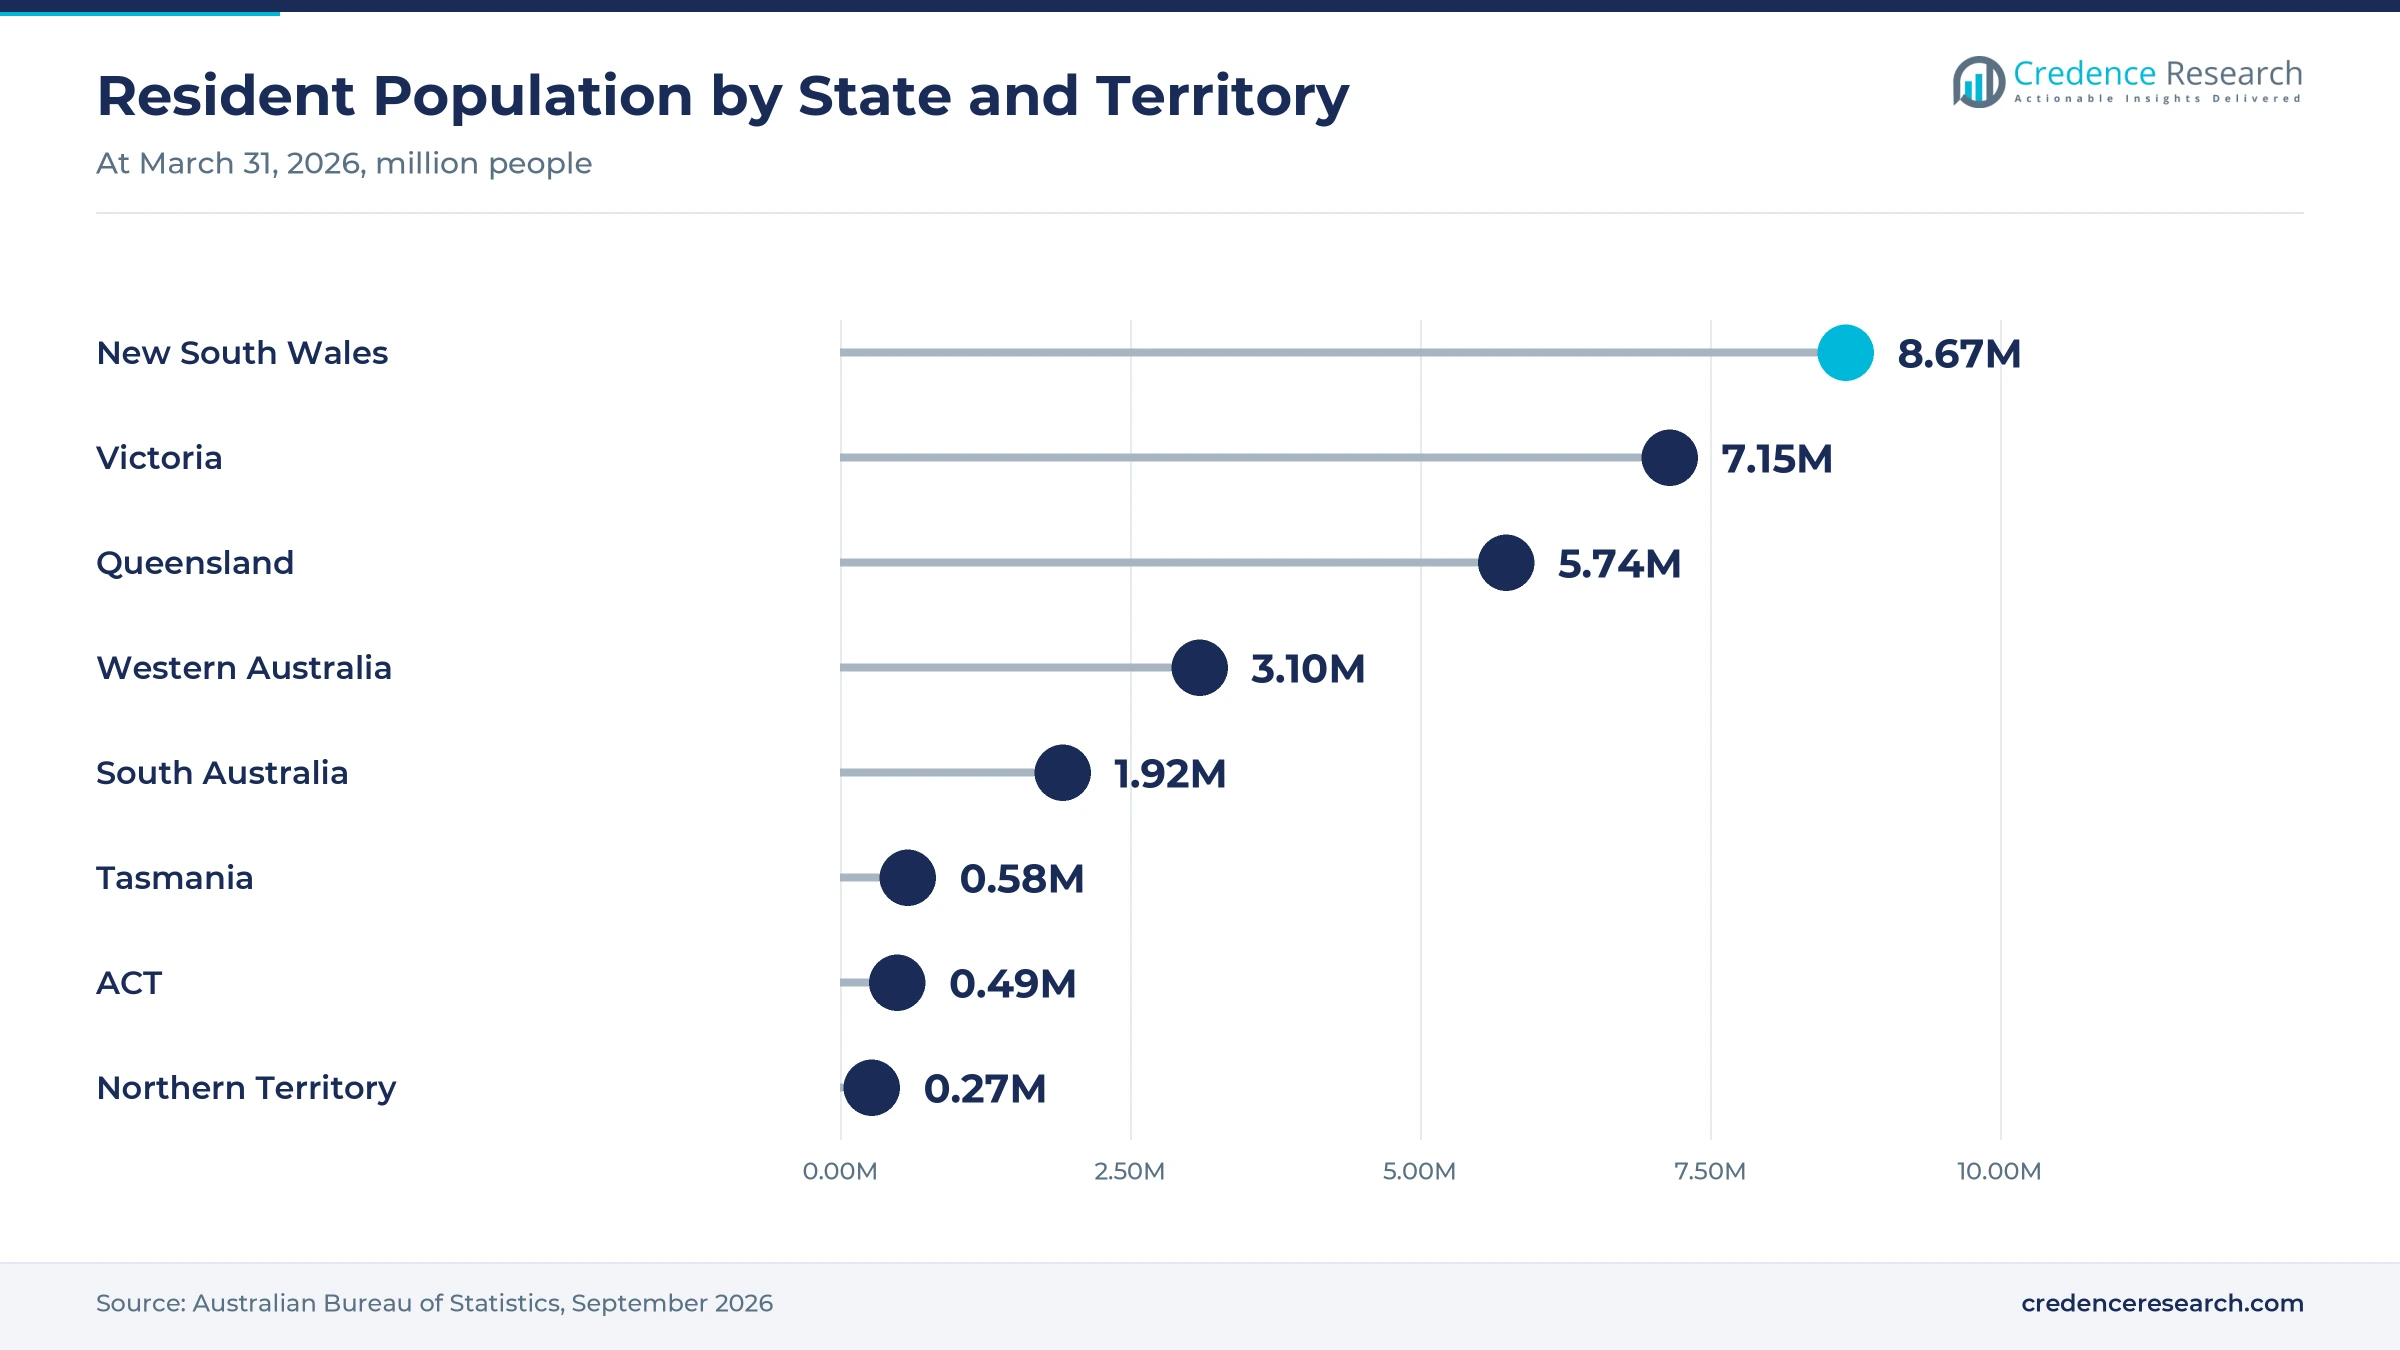
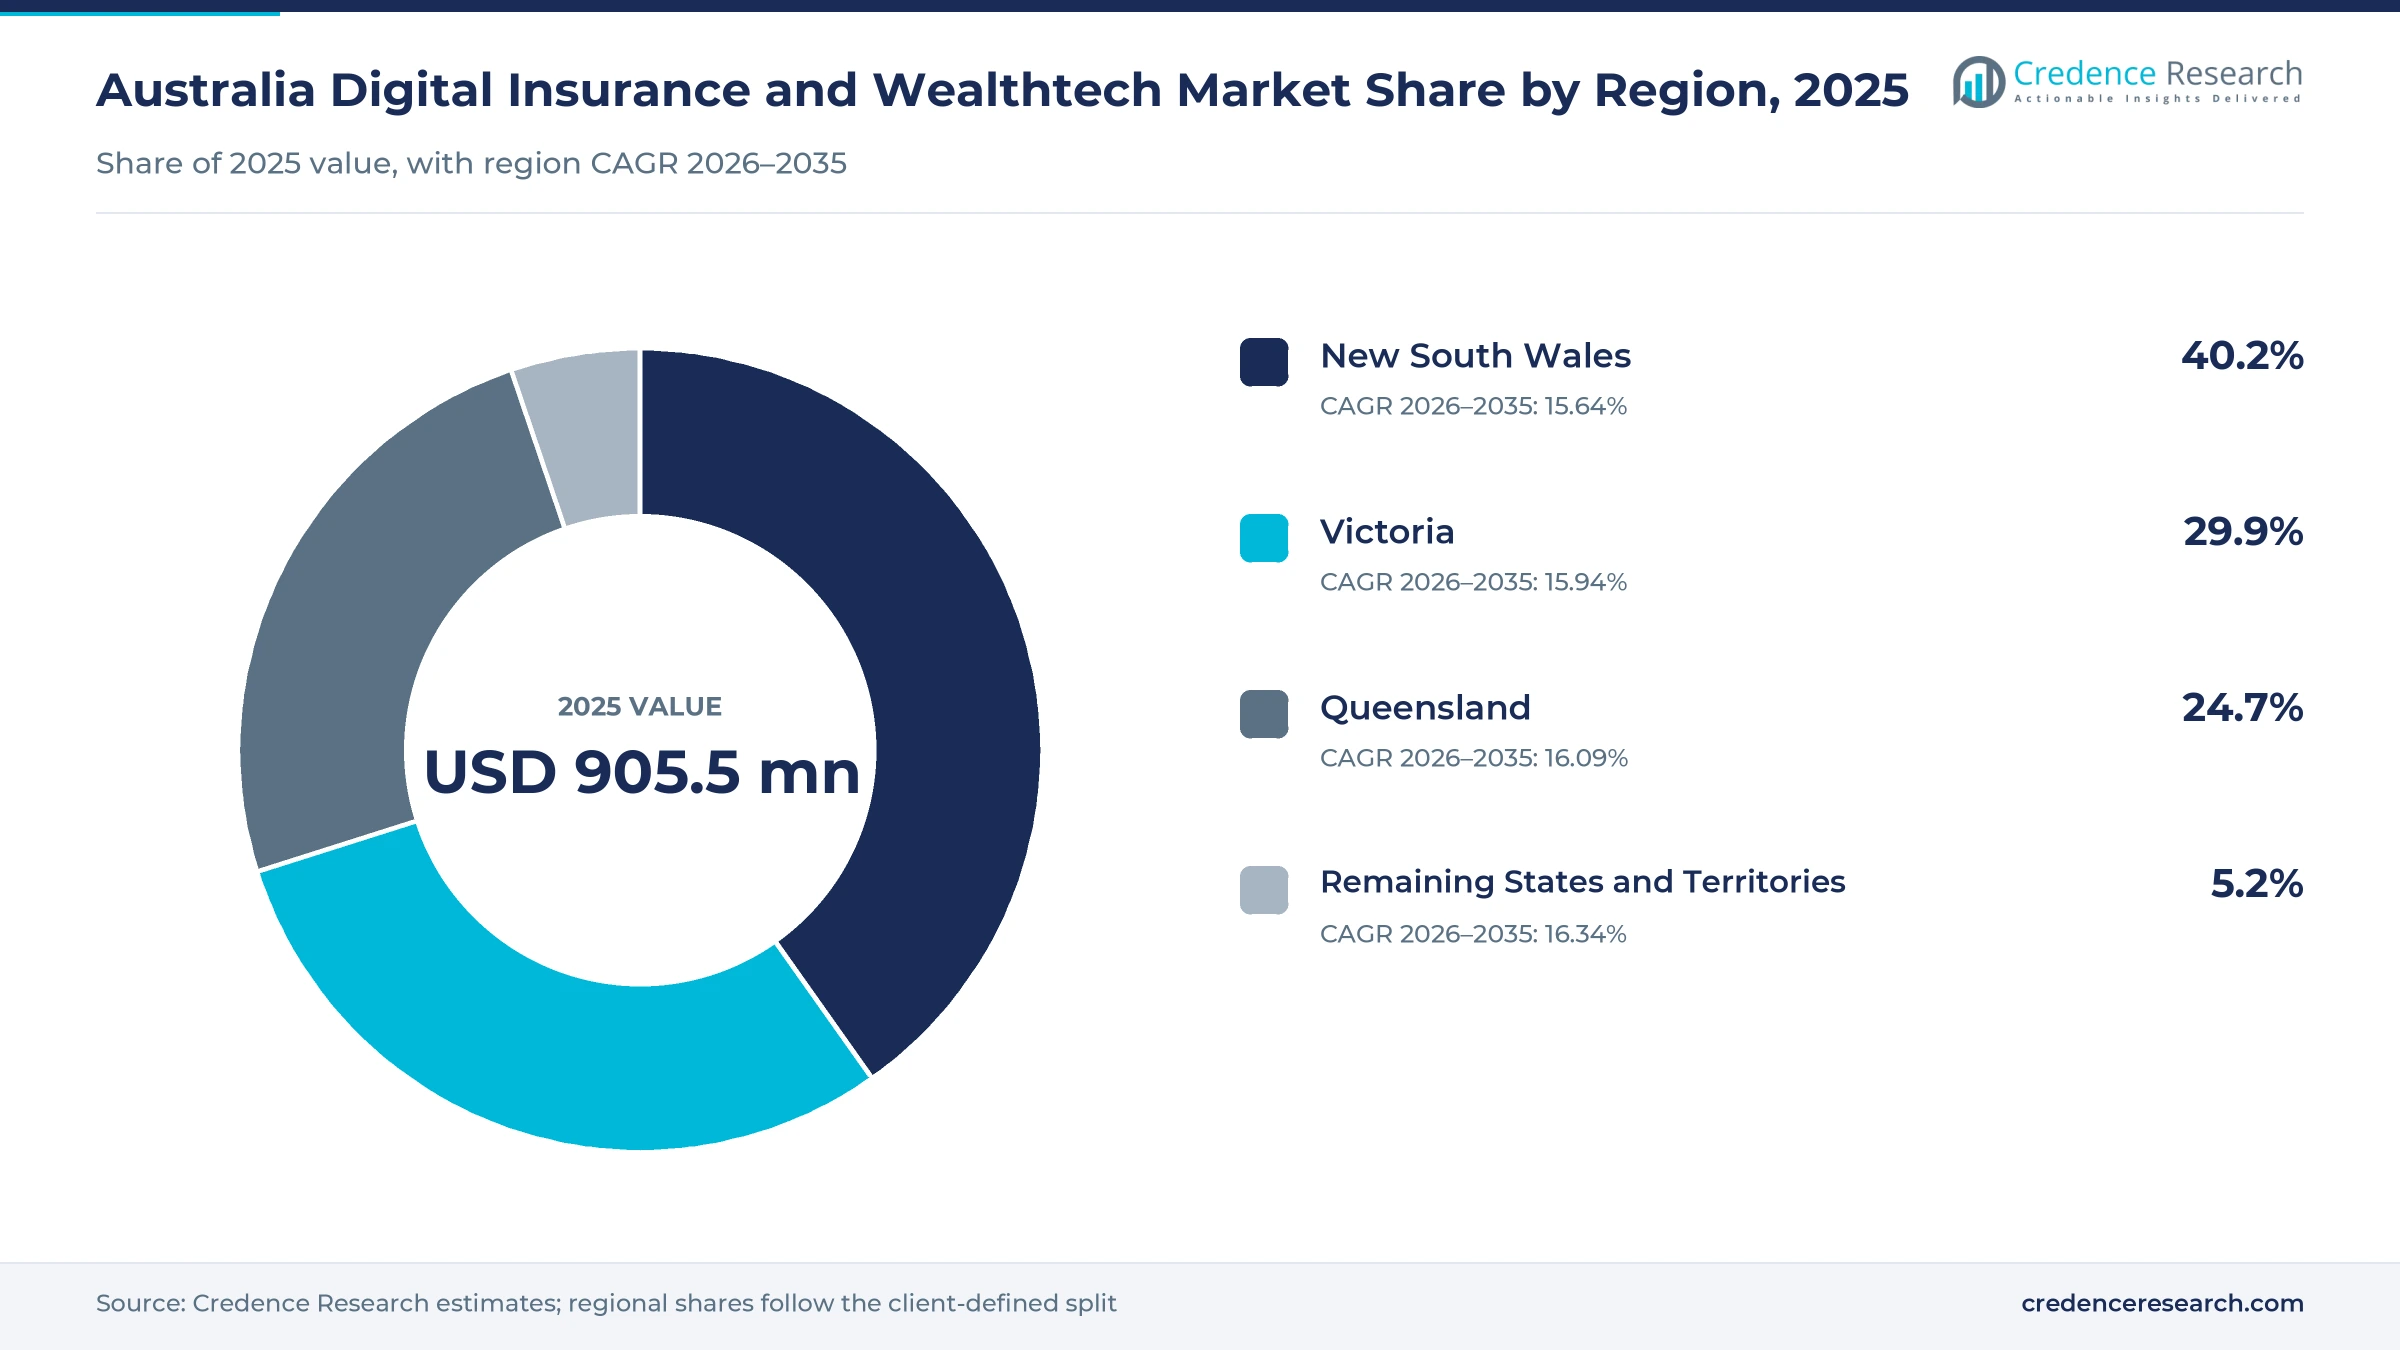
The Australia digital insurance and Wealthtech market was valued at USD 905.5 million in 2025 and is projected to increase from USD 1.08 billion in 2026 to USD 4.06 billion by 2035, registering a CAGR of 15.88% during 2026–2035. Revenue comes from administration fees on adviser-managed portfolios, fees and commissions earned by online insurance intermediaries, and subscriptions paid for advice and portfolio software. New South Wales held the largest regional share, 40.2% in 2025, because the state has the largest population, about 8.67 million residents in March 2026, and the biggest base of households. The remaining states and territories are the fastest-growing region at 16.34% a year, as Western Australia adds residents faster than any other state. Product data obligations under the Consumer Data Right also reached designated non-bank lenders on July 13, 2026, which starts to widen the financial data that insurance and investing apps can draw on.
Which platforms and online cover services are counted?
The estimate measures revenue earned in Australia by investment administration platforms, digital investing apps, online insurance intermediaries and financial advice software vendors. It counts asset-based platform fees, transaction and distribution fees, commissions on policies sold online, and subscription and usage fees paid by licensees, advisers and households.
The estimate excludes insurance premiums retained by underwriters, investment management fees charged by fund managers and superannuation administration run in-house by large funds. The value chain runs from underwriters, fund managers and data providers through platforms and intermediaries to advisers, brokers, households and small businesses in every state and territory.
Australia Digital Insurance and Wealthtech Market Insights
- The Australia digital insurance and Wealthtech market was valued at USD 905.5 million in 2025 and is projected to reach USD 4.06 billion by 2035, registering a CAGR of 15.88% during 2026–2035.
- New South Wales held a 40.2% share of 2025 value, because the state has the largest population, about 8.67 million residents in March 2026.
- Investment administration platforms led with a 38.0% share of 2025 value, because advisers keep moving client portfolios to specialist platforms.
- Product data obligations under the Consumer Data Right reached designated non-bank lenders on July 13, 2026, with consumer data sharing for the largest lenders due on Nov. 9, 2026.
- Digital insurance platforms grow fastest at 16.47% a year during 2026–2035, as small firms buy business cover online and insurers back digital brands.
Administration platforms lead, online cover grows fastest
Why do administration platforms hold the largest share?
Based on solution type, the market is categorized into digital insurance platforms, investment administration platforms, digital investing platforms and financial advice software. Investment Administration Platforms led with a 38.0% share of 2025 value, because advisers place most client portfolios on platforms that charge fees on balances. Digital Insurance Platforms grow fastest at 16.47% a year, as small firms and households buy more cover through online brokers and white-label partners.
How do households, firms and intermediaries split spending?
Based on customer segment, the market is categorized into retail households, business insurance buyers and financial intermediaries. Retail Households led with a 52.0% share of 2025 value, because individual investors ultimately pay most platform and app fees. Business Insurance Buyers grow fastest at 17.28% a year, as sole traders and small employers move from phone and branch quotes to online comparison and renewal.
Why do advisers and brokers remain the main channel?
Based on distribution channel, the market is categorized into direct digital, adviser and broker networks, and embedded partnerships. Adviser and Broker Networks led with 55.0% of 2025 value, because advisers choose the platform for most investment accounts and brokers still place much business cover. Embedded Partnerships grow fastest at 17.60% a year, as carmakers, banks and retailers offer cover inside their own sales journeys.
How do asset fees and distribution fees compare?
Based on revenue model, the market is categorized into asset-based fees, transaction and distribution fees, and subscription and usage fees. Asset-Based Fees led with a 54.0% share of 2025 value, because platform administration fees rise with balances held on each account. Transaction and Distribution Fees grow fastest at 16.45% a year, as online insurance sales add commissions and partner fees on every policy written.
| Segment Group | Leading Sub-segment | Share, 2025 | Fastest-growing Sub-segment | CAGR, 2026–2035 |
|---|---|---|---|---|
| By Solution Type | Investment Administration Platforms | 38.0% | Digital Insurance Platforms | 16.47% |
| By Customer Segment | Retail Households | 52.0% | Business Insurance Buyers | 17.28% |
| By Distribution Channel | Adviser and Broker Networks | 55.0% | Embedded Partnerships | 17.60% |
| By Revenue Model | Asset-Based Fees | 54.0% | Transaction and Distribution Fees | 16.45% |
Request a Free Sample
Fill in your details and we'll send you a free sample report.
- Sample data tables & charts
- Research methodology
Platform switching, SME cover and data access lift demand
Why are advisers moving clients to specialist platforms?
Advisers keep moving client portfolios from older administration systems to specialist platforms that offer managed accounts, wider menus and faster reporting, which lifts administration fee income. HUB24 reported record platform net inflows of AUD 18.9 billion for fiscal 2026 in its June quarter update to the ASX, and its platform funds under administration rose 24% to AUD 139.5 billion. Its market share climbed to 9.9% at March 31, 2026, from 8.6% a year earlier, and 5,649 advisers now use the platform. Netwealth reported preliminary fiscal 2026 net flows of AUD 15.4 billion and guided to AUD 18 billion to AUD 20 billion for fiscal 2027. As a result, investment administration platforms held 38.0% of 2025 value.
How does online distribution widen small business cover?
Small firms increasingly compare, buy and renew business cover online, which shifts commission and fee income toward digital intermediaries. The Australian Bureau of Statistics counted 2,814,778 actively trading businesses at June 30, 2026, including 996,203 employing businesses. Internet use reached 96.1% of the population in 2024, according to the World Bank, so nearly every owner can buy cover online. BizCover said on May 11, 2026, that more than 300,000 customers use its platform to buy, renew and manage business insurance, or about one in 10 small and medium enterprises. In turn, business insurance buyers grow fastest at 17.28% a year, the quickest rate among customer segments.
How does consented data sharing open new services?
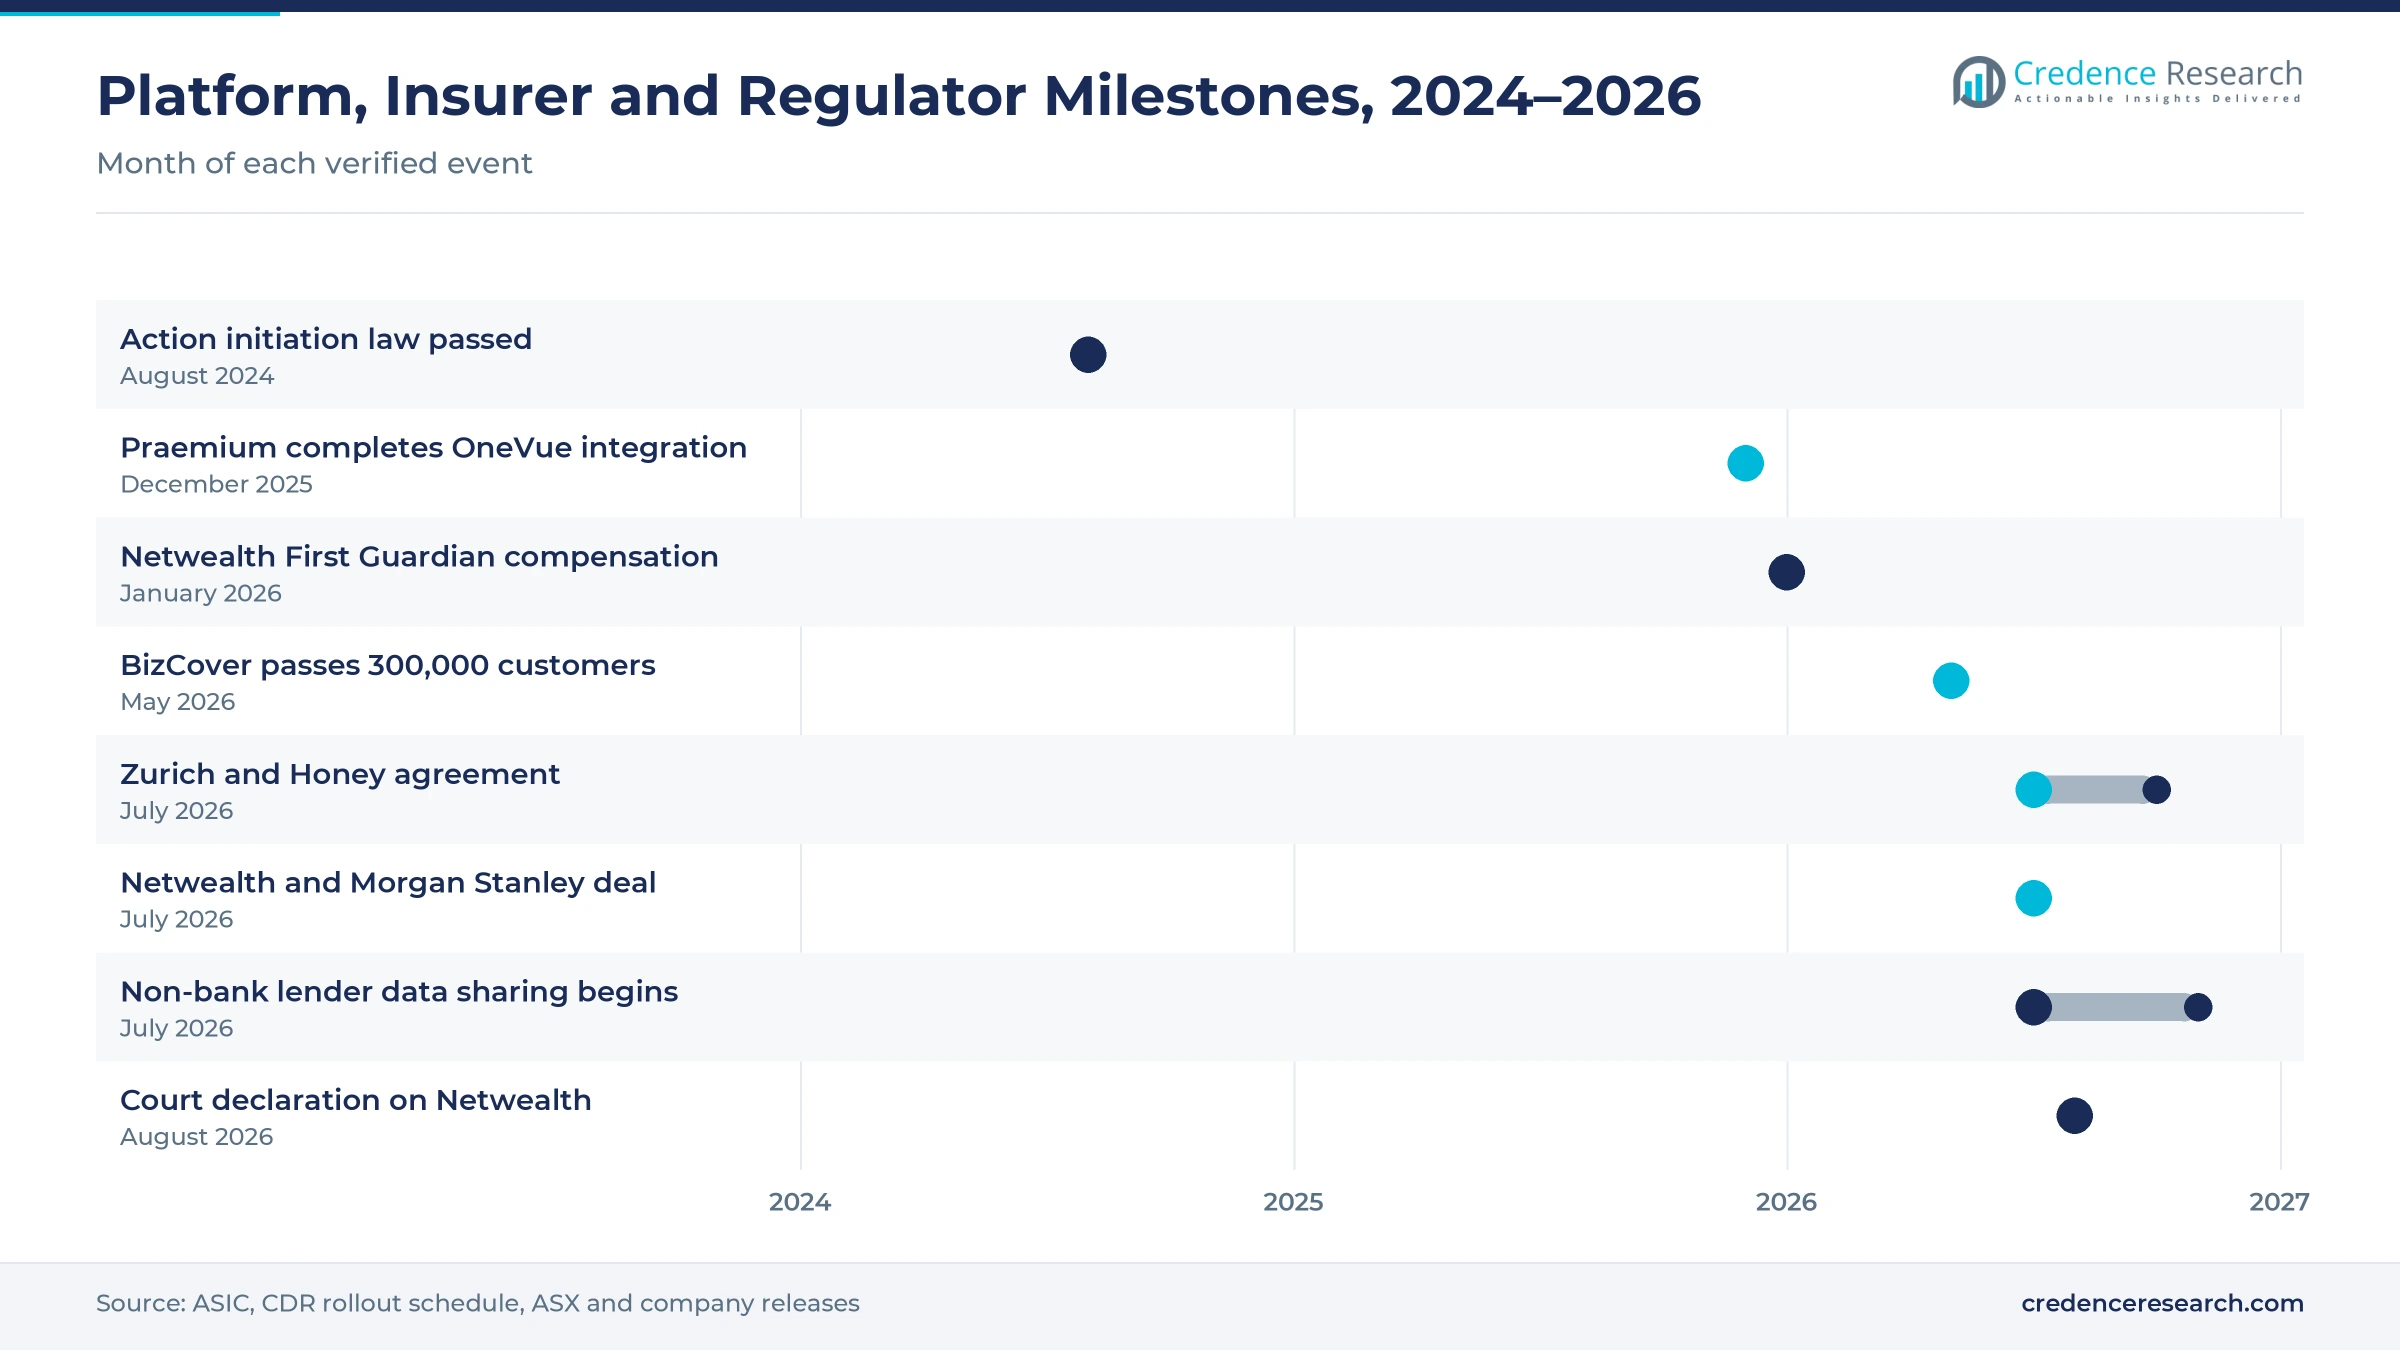
Insurance and investing apps use consented account and loan data to prefill applications, verify income and tailor products, so wider data coverage lowers onboarding costs. The Consumer Data Right rollout schedule shows that bank data sharing began with the four major banks in July 2020 and reached non-major banks by February 2022. Product data obligations for designated non-bank lenders began on July 13, 2026, and law firm King & Wood Mallesons expects at least 35 new data holders, including mortgage, car finance and buy now, pay later providers. Parliament also passed action initiation legislation in August 2024, which lets firms act on customer instructions. As a result, direct digital channels gain because shorter applications suit retail households, which held 52.0% of 2025 value.
Why do rising retirement savings lift platform fees?
Compulsory superannuation keeps adding investable balances, and a growing share of retiree and pre-retiree money sits on adviser platforms that charge fees on assets. Total superannuation assets reached AUD 4,767.2 billion at June 30, 2026, up 9.5% on the year, according to the Australian Prudential Regulation Authority. Contributions rose 12.8% to AUD 236.3 billion in the year to June 2026, while self-managed super fund assets reached AUD 1,107.2 billion. Raiz Invest, a micro-investing app, reported 351,362 active customers and AUD 2.32 billion in funds under management on July 30, 2026. As a result, asset-based fees held 54.0% of 2025 value, the largest share among revenue models.
Underwriting partners, menu scrutiny and advice gaps
How is the shift to underwriting partners changing cover?
Large insurers increasingly supply capital and claims handling while digital brands own the customer journey, which moves distribution value toward platform partners. Zurich said on July 3, 2026, that it will underwrite and manage claims for Honey Insurance home, landlord and motor policies from October 2026, while Honey keeps selling under its own brand and through Bank of Queensland. Open Insurance runs white-label car, home and travel cover for partners such as Volkswagen, Bupa, ahm, Polestar and Telstra, and it added an online integration with CUPRA Australia. Cover Genius, an embedded protection platform that works with insurance carriers and brand partners, raised USD 100 million on July 14, 2026, at a USD 1.9 billion valuation. In turn, embedded partnerships grow at 17.60% a year, the fastest channel rate.
Why is conduct scrutiny reshaping platform menus?
Platform operators now carry more responsibility for the products they list, which is pushing them to tighten menus, research and monitoring. Netwealth paid more than AUD 100 million to over 1,000 First Guardian investors in January 2026, which covered 100% of their investments less any withdrawals. The Federal Court declared on Aug. 20, 2026, that two Netwealth entities had contravened the Corporations Act, according to the Australian Securities and Investments Commission. Investment Magazine reported in February 2026 that the combined Shield and First Guardian collapse was a AUD 1 billion failure, and the minister declined to commit to a timeframe for the remaining advice reforms. As a result, platforms spend more on menu governance and investment monitoring tools.
Where is the opening in lower-cost digital advice?
Fewer than 15,000 advisers serve a population of almost 28 million, which leaves room for software and digital services that cut the cost of each advice file. Financial Newswire counted 14,984 registered advisers in early July 2026, after a low of 14,899 at June 30. Iress said on Aug. 17, 2026, that the next phase of Xplan includes AI-enabled adviser workflow tools and a refreshed client portal. Stockspot, an online adviser, managed more than AUD 800 million for about 14,000 clients by July 2024, according to Investor Daily. In turn, vendors of portfolio and planning software can sell measurable time savings to licensees that face tight adviser capacity.
Can platforms win the stockbroking and private wealth pool?
Stockbroking and private wealth clients still hold large portfolios on legacy systems, which gives specialist platforms a sizable pool beyond traditional financial planning. Netwealth said on July 7, 2026, that it had expanded its relationship with Morgan Stanley Wealth Management Australia to administer listed securities, managed accounts and term deposits. Netwealth puts the stockbroking and private wealth segment at about AUD 600 billion in funds under administration. Praemium lifted total funds under administration 21.1% to AUD 77.9 billion in fiscal 2026, while its non-custodial Scope+ service grew 30.5%. As a result, financial intermediaries that buy platform services for stockbroking and private wealth clients add a second source of platform demand.
Volatile flows, adviser shortages and compliance costs
How does market volatility slow platform flows?
Platform fees depend on new money and balances, so market falls and policy uncertainty quickly cut growth. Netwealth said its June quarter flows softened late in the period because of the Middle East conflict, market volatility and proposed tax changes. Its fourth quarter net flows fell 13.9% from a year earlier, partly because of outflows from a few very wealthy accounts. As a result, platforms are widening their client base so that flows rely less on a small group of large accounts.
Why do adviser shortages cap platform reach?
Most platform accounts are opened through advisers, so a shrinking adviser base limits how many new clients platforms can win each year. Registered adviser numbers fell to 14,899 at June 30, 2026, before a small rebound in early July, according to Financial Newswire. In turn, fewer advisers means fewer new advised accounts, which leaves many households without a platform relationship. Platforms respond with managed accounts and software that let each adviser serve more clients with less paperwork.
How do compensation and licensing reviews raise costs?
Recent investment scheme collapses have put liability cover and compensation levies for advice firms and platforms under review. Investment Magazine reported in February 2026 that a consultation on professional indemnity insurance and the compensation scheme of last resort was underway. The government has also floated licensing for lead generators and comparison websites, which would touch online brokers. As a result, firms are budgeting for higher compliance spending, and smaller intermediaries may seek larger licensed partners.
Why does data-sharing compliance add technology costs?
Every new data holder must build secure interfaces, consent tools and data standards before it can share customer information, which adds cost for lenders and the apps that use the data. The government registered Version 8 rules in March 2025 that narrowed the banking data scope to reduce compliance costs. In turn, the largest non-bank lenders must start sharing consumer data on Nov. 9, 2026, and large providers on May 10, 2027. Firms respond by using shared technology providers rather than building every interface in-house.
New South Wales leads while smaller states grow fastest
| Region | Value, 2025 (USD million) | Share, 2025 | CAGR, 2026–2035 |
|---|---|---|---|
| New South Wales | 364.0 | 40.2% | 15.64% |
| Victoria | 270.7 | 29.9% | 15.94% |
| Queensland | 223.7 | 24.7% | 16.09% |
| Remaining States and Territories | 47.1 | 5.2% | 16.34% |
New South Wales leads on population and business depth
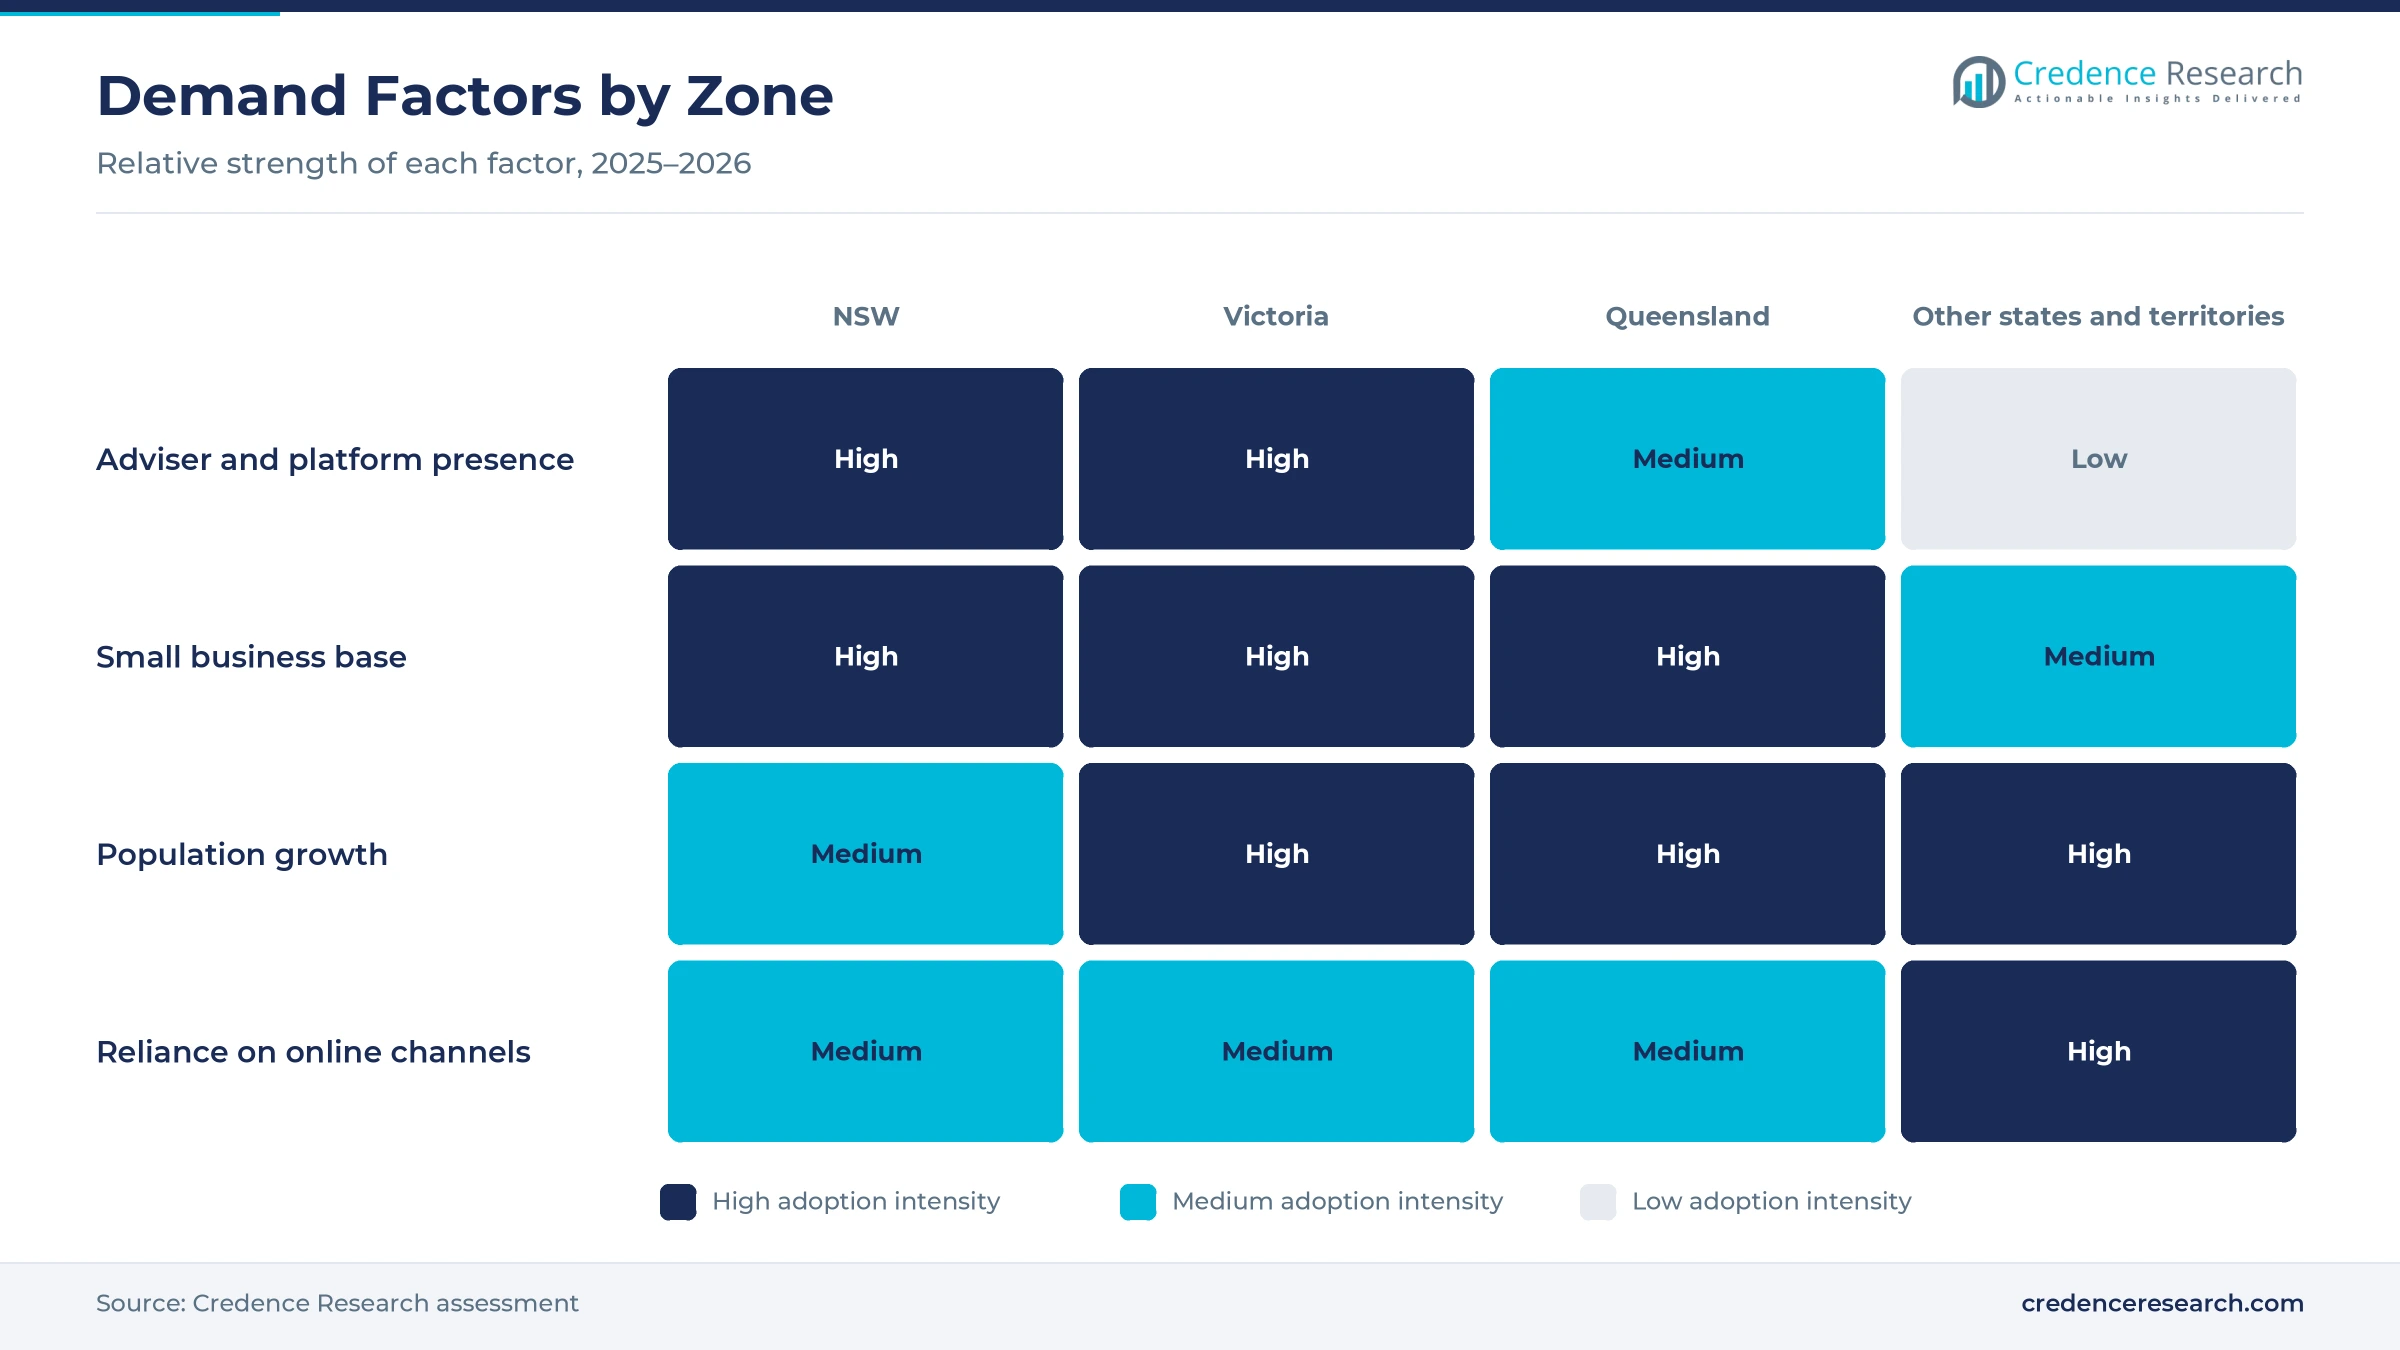
New South Wales held a 40.2% share of 2025 value and grows at 15.64% a year, because the state has the most residents and the largest base of households and employers. It had about 8.67 million residents at March 31, 2026, the most of any state, after adding about 97,000 people over the year. However, its 1.1% population growth trails Victoria and Queensland, so platform and online insurance revenue grows a little slower than the national rate.
How does Victoria support platform and app demand?
Victoria held a 29.9% share of 2025 value and grows at 15.94% a year, because the state has the second-largest population and a large base of super fund members and small employers. Victoria counted about 7.15 million residents at March 31, 2026, after 1.6% annual growth, and it added about 109,500 people, the largest increase of any state. As a result, new households and businesses add platform accounts and online policies faster than in New South Wales.
What lifts demand in Queensland?
Queensland held a 24.7% share of 2025 value and grows at 16.09% a year, because its population growth matches Victoria and outpaces New South Wales. Queensland counted about 5.74 million residents at March 31, 2026, also after 1.6% annual growth, which added about 90,100 people over the year. In turn, small business cover bought online and retirement savings moved to adviser platforms expand at a faster pace than in the largest state.
Why do the remaining states and territories grow fastest?
The remaining states and territories accounted for 5.2% of 2025 value and grow fastest at 16.34% a year. Western Australia recorded the fastest population growth, 2.1% in the year to March 2026, which adds new households and firms faster than in the eastern states. As a result, direct digital insurance sales and investing apps gain from a small base, because remote buyers rely more on online channels than on local branches.
Platform, insurer and regulator moves, 2024–2026
| Development | Status and market relevance |
|---|---|
| In December 2025, Praemium completed the integration of the OneVue platform it had acquired. | Consolidated two administration platforms onto one system |
| In January 2026, Netwealth paid more than AUD 100 million to over 1,000 First Guardian investors. | Raised the bar for platform menu due diligence |
| In May 2026, BizCover said that more than 300,000 customers use its online business insurance platform. | Showed the scale of online small business cover |
| In July 2026, Zurich agreed to underwrite Honey Insurance home, landlord and motor policies from October 2026. | Brought a global insurer behind a digital brand |
| In July 2026, Netwealth expanded its relationship with Morgan Stanley Wealth Management Australia. | Opened the stockbroking and private wealth segment to the platform |
Managed accounts, data APIs and claims tools shape supply
- Managed account engines let advisers run model portfolios across many clients, and Netwealth reported AUD 30.5 billion in managed account funds at June 30, 2026, up 29.9% on the year.
- Consented data interfaces built under the Consumer Data Right let apps pull bank and loan data with customer approval, which shortens applications and income checks.
- Embedded policy and claims APIs let retailers and carmakers sell cover at checkout, and Cover Genius uses its XClaim interface to pay approved claims in real time.
- AI-enabled adviser workflow tools such as the next phase of Iress Xplan help advisers prepare files faster, alongside insurtech tools that automate quoting and claims triage.
Need a Custom Version of This Report?
Tailor the scope, geography, or segments to your exact requirements.
- Custom geography or segment scope
- Direct access to our analyst team
Specialist platforms and online brokers set the pace
Competition is split between specialist investment platforms, online insurance intermediaries, embedded cover providers and software vendors. HUB24 and Netwealth lead platform flows, with HUB24 holding 9.9% of platform funds at March 31, 2026, and Netwealth adding Morgan Stanley Wealth Management Australia as a client. Praemium completed its OneVue integration in December 2025, while Iress is building AI tools into Xplan. In insurance, BizCover serves more than 300,000 business customers, Honey Insurance moves to Zurich underwriting from October 2026, and Open Insurance sells white-label cover for partners such as Volkswagen and Telstra. Raiz Invest and Stockspot compete for younger and lower-balance investors. Rivals compete on fees, menu quality, adviser tools, quote speed and partner reach. Because conduct scrutiny is rising, governance and compliance scale have become key advantages.
Which firms lead Australian platforms and online cover?
| Company | Type | Role in the market |
|---|---|---|
| HUB24 | Specialist platform operator | Record AUD 18.9 billion net inflows in fiscal 2026; 9.9% platform share |
| Netwealth | Specialist platform operator | Expanded Morgan Stanley Wealth Management Australia relationship in July 2026 |
| Praemium | Specialist platform operator | Completed OneVue integration in December 2025 |
| Iress | Software vendor | Building AI-enabled adviser workflow tools into Xplan |
| Cover Genius | Embedded protection platform | Embedded protection platform; raised USD 100 million in July 2026 |
| BizCover | Digital insurance intermediary | More than 300,000 small business customers by May 2026 |
| Raiz Invest | Micro-investing app | 351,362 active customers at the end of the June 2026 quarter |
| Open Insurance | Digital insurance intermediary | White-label car, home and travel cover for brand partners |
| Honey Insurance | Digital insurance intermediary | Zurich to underwrite its home and motor policies from October 2026 |
| Stockspot | Online investment adviser | Online adviser with more than AUD 800 million under management by July 2024 |
Credence Research view on platforms and online cover
Credence Research's view is that Australian platform and online insurance revenue will keep growing because savings, small business formation and data access all point the same way. Investment administration remains the largest revenue pool, while online business cover and embedded partnerships add the fastest growth. Conduct cases tied to First Guardian raise costs, but they also favor platforms with strong menu governance. Providers that combine low-cost administration, adviser productivity tools and insurer partnerships should gain share across the Australia digital insurance and Wealthtech base over the next decade.
How the platform and online cover estimate was built
The report uses 2025 as the base year on a calendar basis, and market values come from the Credence Research model. That model combines platform flow and funds data published by listed operators, superannuation statistics, business counts and population estimates, World Bank internet data, regulator releases and company announcements. Segment splits and zone growth rates are Credence Research estimates, while zone shares follow the client-defined split. Sources used are official statistics, regulator publications, exchange filings and company releases, and Credence Research conducted no interviews or surveys of its own for this report.
Small business cover and partners carry growth to 2035
Revenue is expected to reach USD 4.06 billion by 2035, a 15.88% CAGR during 2026–2035, as platforms keep winning adviser flows and small firms buy more cover online. Growth should come from digital insurance platforms, business insurance buyers and embedded partnerships. Wider consumer data sharing from November 2026 would support faster onboarding, while weak markets or further adviser losses would slow platform flows. Providers with strong governance, adviser tools and insurer backing are expected to gain the most as Australia digital insurance and Wealthtech revenue spreads beyond advised investors.
Frequently Asked Questions
How big is the Australia digital insurance and Wealthtech market?
Which solution type leads Australian revenue?
Which region leads the Australian market?
How fast are specialist investment platforms growing?
How many small businesses buy cover online through BizCover?
When do non-bank lenders join the Consumer Data Right?
Who are the leading companies in the Australian market?
What are the main challenges for providers?
Table of Content
Chapter 1 Market Segmentation
- 1.1 Segmentation Framework
- 1.1.1 Product and Service Classification
- 1.1.2 Application and End-Use Classification
- 1.1.3 Technology and Solution Classification
- 1.1.4 Customer and Distribution Channel Classification
- 1.1.5 Geographic Segmentation
- 1.1.6 Market Segment Definitions and Boundaries
- 1.2 By Solution Type
- 1.2.1 Investment Administration Platforms
- 1.2.2 Digital Insurance Platforms
- 1.2.3 Digital Investing Platforms
- 1.2.4 Financial Advice Software
- 1.3 By Customer Segment
- 1.3.1 Retail Households
- 1.3.2 Financial Intermediaries
- 1.3.3 Business Insurance Buyers
- 1.4 By Revenue Model
- 1.4.1 Asset-Based Fees
- 1.4.2 Transaction and Distribution Fees
- 1.4.3 Subscription and Usage Fees
Chapter 2 Introduction
- 2.1 Report Objectives and Scope
- 2.2 Product Definition and Industry Terminology
- 2.3 Market Inclusions and Exclusions
- 2.4 Research Process
- 2.4.1 Primary Research and Expert Interviews
- 2.4.2 Secondary Research and Source Review
- 2.4.3 Top-Down and Bottom-Up Estimation
- 2.4.4 Data Triangulation and Verification
- 2.5 Market Size Measurement Basis
- 2.5.1 2025: USD 905.5 million → 2035: USD 4.06 billion
- 2.6 Historical and Forecast Reference Periods
- 2.6.1 Historical Period: 2018-2025
- 2.6.2 Base Year: 2025
- 2.6.3 Forecast Period: 2025-2035
- 2.7 Research Assumptions and Limitations
Chapter 3 Executive Summary
- 3.1 Market Snapshot and Key Findings
- 3.2 Base-Year Market Size, 2025
- 3.3 Forecast Market Size, 2035
- 3.4 Revenue and Volume Growth Outlook
- 3.5 Key Demand and Supply Indicators
- 3.6 Leading Market Segments
- 3.7 Fastest-Growing Market Opportunities
- 3.8 Regional Performance Highlights
- 3.9 Technology and Industry Transformation
- 3.10 Competitive Landscape Summary
- 3.11 Analyst View and Strategic Implications
Chapter 4 Australia Digital Insurance and Wealthtech Market Trends and Developments
- 4.1 Historical Industry Development, 2018-2025
- 4.2 Recent Market Trends and Developments
- 4.3 Demand and Customer Behavior Trends
- 4.4 Technology and Product Innovation
- 4.5 Artificial Intelligence, Automation and Digitalization
- 4.6 Local Manufacturing and Supply Chain Realignment
- 4.7 Industry Partnerships, Mergers and Acquisitions
- 4.8 Sustainability and Circular Economy Developments
- 4.9 Government and Private Sector Investment Trends
- 4.10 Emerging Business Models and Commercialization
- 4.11 Industry Developments and Announcements
Chapter 5 Australia Digital Insurance and Wealthtech Market Supply and Demand Analysis
- 5.1 Demand Trend and Consumption Analysis, 2018-2025
- 5.2 Demand Forecast, 2025-2035
- 5.3 Supply Chain Structure and Procurement Trends
- 5.4 Supply-Demand Gap and Bottlenecks
- 5.5 Import Dependence and Sourcing Structure
- 5.6 Regional Supply and Demand Concentration
Chapter 6 Australia Digital Insurance and Wealthtech Market Pricing Analysis
- 6.1 Pricing Structure and Measurement
- 6.2 Historical Pricing Trends, 2018-2025
- 6.3 Pricing Outlook, 2025-2035
- 6.4 Pricing by Product and Market Segment
- 6.5 Geographic Pricing Differences
- 6.6 Key Input, Energy, Labor and Logistics Costs
- 6.7 Contract Pricing and Purchasing Models
- 6.8 Pricing Sensitivity and Competitive Positioning
- 6.9 Price, Margin and Profitability Implications
Chapter 7 Australia Digital Insurance and Wealthtech Market Dynamics
- 7.1 Market Growth Drivers
- 7.1.1 Demand-Side Drivers
- 7.1.2 Technology and Innovation Drivers
- 7.1.3 Infrastructure and Investment Drivers
- 7.1.4 Regulatory and Policy Drivers
- 7.2 Market Restraints
- 7.2.1 Cost and Affordability Constraints
- 7.2.2 Technology and Adoption Barriers
- 7.2.3 Supply Chain and Operational Constraints
- 7.3 Market Challenges
- 7.3.1 Competitive Pressure and Margin Erosion
- 7.3.2 Skills, Infrastructure and Implementation Gaps
- 7.4 Emerging Market Opportunities
- 7.5 Market Dynamics Impact and Time-Horizon Assessment
Chapter 8 Australia Digital Insurance and Wealthtech Value Chain Analysis
- 8.1 Industry Value Chain Overview
- 8.2 Upstream Suppliers and Critical Inputs
- 8.3 Technology and Component Providers
- 8.4 Manufacturing or Service Delivery
- 8.5 Distribution, Channel Partners and Integrators
- 8.6 Downstream Applications and End Users
- 8.7 Value Addition and Profit Pools
- 8.8 Vertical Integration and Outsourcing
- 8.9 Supplier Concentration and Risk
- 8.10 Supply Chain Localization and Resilience
Chapter 9 Australia Digital Insurance and Wealthtech Market Regulations and Policies
- 9.1 Relevant Laws, Standards and Compliance Frameworks
- 9.2 Product, Service, Safety and Quality Requirements
- 9.3 Government Policies, Incentives and Subsidies
- 9.4 Imports, Exports and Trade Barriers
- 9.5 Public Procurement and Local Content Requirements
- 9.6 Data Protection, AI and Cybersecurity Compliance
- 9.7 Upcoming Policy Changes and Market Implications
Chapter 10 Australia Digital Insurance and Wealthtech Market Hotspots and Opportunities
- 10.1 Market Opportunity Mapping and Growth Hotspots
- 10.2 High-Growth Applications and Customer Groups
- 10.3 Underserved Markets and White-Space Opportunities
- 10.4 Emerging Technology and Product Opportunities
- 10.5 New Capacity and Investment Hotspots
- 10.6 Market Entry and Expansion Opportunities
- 10.7 Distribution and Partnership Opportunities
- 10.8 Near-Term and Long-Term Commercial Potential
- 10.9 Opportunity Attractiveness and Execution Risks
Chapter 11 Australia Digital Insurance and Wealthtech Market Outlook, 2025-2035
- 11.1 Market Size and Analysis
- 11.1.1 Revenue (Market Measurement: 2025: USD 905.5 million → 2035: USD 4.06 billion)
- 11.1.2 Historical Market Size, 2018-2025
- 11.1.3 Base-Year Market Size, 2025
- 11.2 Market Forecast, 2025-2035
- 11.2.1 Revenue Forecast to 2035
- 11.2.2 CAGR and Year-on-Year Growth
- 11.2.3 Incremental Revenue Opportunity
- 11.3 Forecast Assumptions and Scenario Analysis
- 11.3.1 Base-Case Forecast
- 11.3.2 Optimistic and Conservative Scenarios
- 11.3.3 Technology, Pricing and Policy Sensitivities
- 11.4 Market Attractiveness and Growth Outlook
Chapter 12 Australia Digital Insurance and Wealthtech Market Segmentation and Outlook
- 12.1 Segmentation Summary and Market Shares, 2025
- 12.2 Largest and Fastest-Growing Segments
- 12.3 By Solution Type - Market Size and Forecast, 2025-2035
- 12.3.1 Segment Definition and Scope
- 12.3.2 Historical Market Size, 2018-2025
- 12.3.3 Revenue Forecast, 2025-2035
- 12.3.4 Base-Year Market Share, 2025
- 12.3.5 Segment CAGR and Growth Drivers
- 12.3.6 Subsegment Market Size and Forecast
- 12.3.6.1 Investment Administration Platforms
- 12.3.6.2 Digital Insurance Platforms
- 12.3.6.3 Digital Investing Platforms
- 12.3.6.4 Financial Advice Software
- 12.3.7 Subsegment Pricing and Adoption Trends
- 12.3.8 Leading Suppliers and Competition
- 12.3.9 Regional Demand and Opportunities
- 12.4 By Customer Segment - Market Size and Forecast, 2025-2035
- 12.4.1 Segment Definition and Scope
- 12.4.2 Historical Market Size, 2018-2025
- 12.4.3 Revenue Forecast, 2025-2035
- 12.4.4 Base-Year Market Share, 2025
- 12.4.5 Segment CAGR and Growth Drivers
- 12.4.6 Subsegment Market Size and Forecast
- 12.4.6.1 Retail Households
- 12.4.6.2 Financial Intermediaries
- 12.4.6.3 Business Insurance Buyers
- 12.4.7 Subsegment Pricing and Adoption Trends
- 12.4.8 Leading Suppliers and Competition
- 12.4.9 Regional Demand and Opportunities
- 12.5 By Revenue Model - Market Size and Forecast, 2025-2035
- 12.5.1 Segment Definition and Scope
- 12.5.2 Historical Market Size, 2018-2025
- 12.5.3 Revenue Forecast, 2025-2035
- 12.5.4 Base-Year Market Share, 2025
- 12.5.5 Segment CAGR and Growth Drivers
- 12.5.6 Subsegment Market Size and Forecast
- 12.5.6.1 Asset-Based Fees
- 12.5.6.2 Transaction and Distribution Fees
- 12.5.6.3 Subscription and Usage Fees
- 12.5.7 Subsegment Pricing and Adoption Trends
- 12.5.8 Leading Suppliers and Competition
- 12.5.9 Regional Demand and Opportunities
- 12.6 Segment Growth Comparison
- 12.7 Segment Attractiveness and Priority Matrix
Chapter 13 Australia Digital Insurance and Wealthtech End-Use and Application Market Outlook
- 13.1 End-Use Industry and Customer Demand Structure
- 13.2 Leading Applications and Customer Groups
- 13.3 End-Use Market Size, Share and Forecast
- 13.4 Major End-Use Industry Deep Dives
- 13.4.1 Customer Requirements and Use Cases
- 13.4.2 Demand and Replacement Cycles
- 13.4.3 Technical and Regulatory Considerations
- 13.4.4 Purchasing and Procurement Models
- 13.4.5 Leading Vendors and Distribution Channels
- 13.4.6 Forecast and Commercial Opportunities
- 13.5 Emerging Applications and Cross-Segment Demand
- 13.6 End-Use Industry Investment Priorities
Chapter 14 Australia Digital Insurance and Wealthtech Geographic Market Outlook, 2025-2035
- 14.1 Domestic Market Distribution and Demand Clusters
- 14.2 State- or Province-Wise Market Size and Forecast, 2025-2035
- 14.3 City and Metropolitan Market Outlook
- 14.4 Industrial, Manufacturing and Commercial Clusters
- 14.5 Geographic Concentration of Key End Users
- 14.6 Local Pricing and Purchasing Differences
- 14.7 Domestic Production Facilities and Capacity Map
- 14.8 Local Infrastructure and Project Pipeline
- 14.9 State-Level Policy and Incentive Differences
- 14.10 Subnational Investment Hotspots and Opportunities
- 14.11 Distribution and Logistics Networks
- 14.12 Domestic Competitive Footprint
Chapter 15 Australia Digital Insurance and Wealthtech Technology, Innovation and Sustainability Outlook
- 15.1 Technology Landscape and Maturity
- 15.2 Product, Process and Service Innovation
- 15.3 AI, Automation and Digital Tools in the Industry
- 15.4 Technology Adoption and Performance Benchmarking
- 15.5 Innovation Pipeline and R&D Investment
- 15.6 Energy Efficiency and Resource Management
- 15.7 Sustainability, Recycling and Circularity
- 15.8 Technology Roadmap, 2025-2035
- 15.9 Risks of Obsolescence and Technology Substitution
Chapter 16 Australia Digital Insurance and Wealthtech Market Key Strategic Imperatives
- 16.1 Growth and Market Entry Priorities
- 16.2 High-Return Products and Segments
- 16.3 Pricing, Profitability and Cost Optimization
- 16.4 Technology Investment and Product Differentiation
- 16.5 Supply Chain Localization and Resilience
- 16.6 Distribution and Customer Acquisition
- 16.7 Partnership, Acquisition and Capacity Strategy
- 16.8 Regional Expansion Priorities
- 16.9 Short-, Medium- and Long-Term Actions
Chapter 17 Competition Outlook
- 17.1 Industry Competition Characteristics
- 17.2 Market Structure and Concentration
- 17.3 Market Share and Competitive Positioning, 2025
- 17.4 Company-Wise Revenue and Product Benchmarking
- 17.5 Production and Service Capacity Benchmarking
- 17.6 Technology, Pricing and Differentiation
- 17.7 Regional Footprint and Distribution Strength
- 17.8 Mergers, Acquisitions and Strategic Alliances
- 17.9 New Entrants and Competitive Threats
- 17.10 Porter's Five Forces and Industry Attractiveness
- 17.11 Competitive Outlook, 2025-2035
Chapter 18 Company Profiles
- 18.1 Company Coverage and Selection Criteria
- 18.2 HUB24
- 18.2.1 Business Description
- 18.2.2 Company Ownership and Geographic Presence
- 18.2.3 Product and Service Portfolio
- 18.2.4 Manufacturing and Operating Footprint
- 18.2.5 Financial Performance and Investment
- 18.2.6 Market Share and Competitive Position
- 18.2.7 Technology and Innovation Capabilities
- 18.2.8 Strategic Alliances or Partnerships
- 18.2.9 Recent Developments
- 18.2.10 Growth Strategy and Outlook
- 18.3 Netwealth
- 18.4 Praemium
- 18.5 Iress
- 18.6 Cover Genius
- 18.7 BizCover
- 18.8 Raiz Invest
- 18.9 Open Insurance
- 18.10 Honey Insurance
- 18.11 Stockspot
- 18.12 Other Relevant Market Participants
Note: Every listed company is profiled on the structure shown under the first company. The company list is preliminary and may change based on research findings, market developments, data availability and client requirements.
Chapter 19 Disclaimer
- 19.1 Research and Forecast Disclaimer
- 19.2 Data Source and Estimation Limitations
Note: The depth of individual sections depends on data availability for this market. Volume, capacity, trade and other unit-based metrics are included where applicable.

