
Licensed platforms and tokenized settlement lift revenue
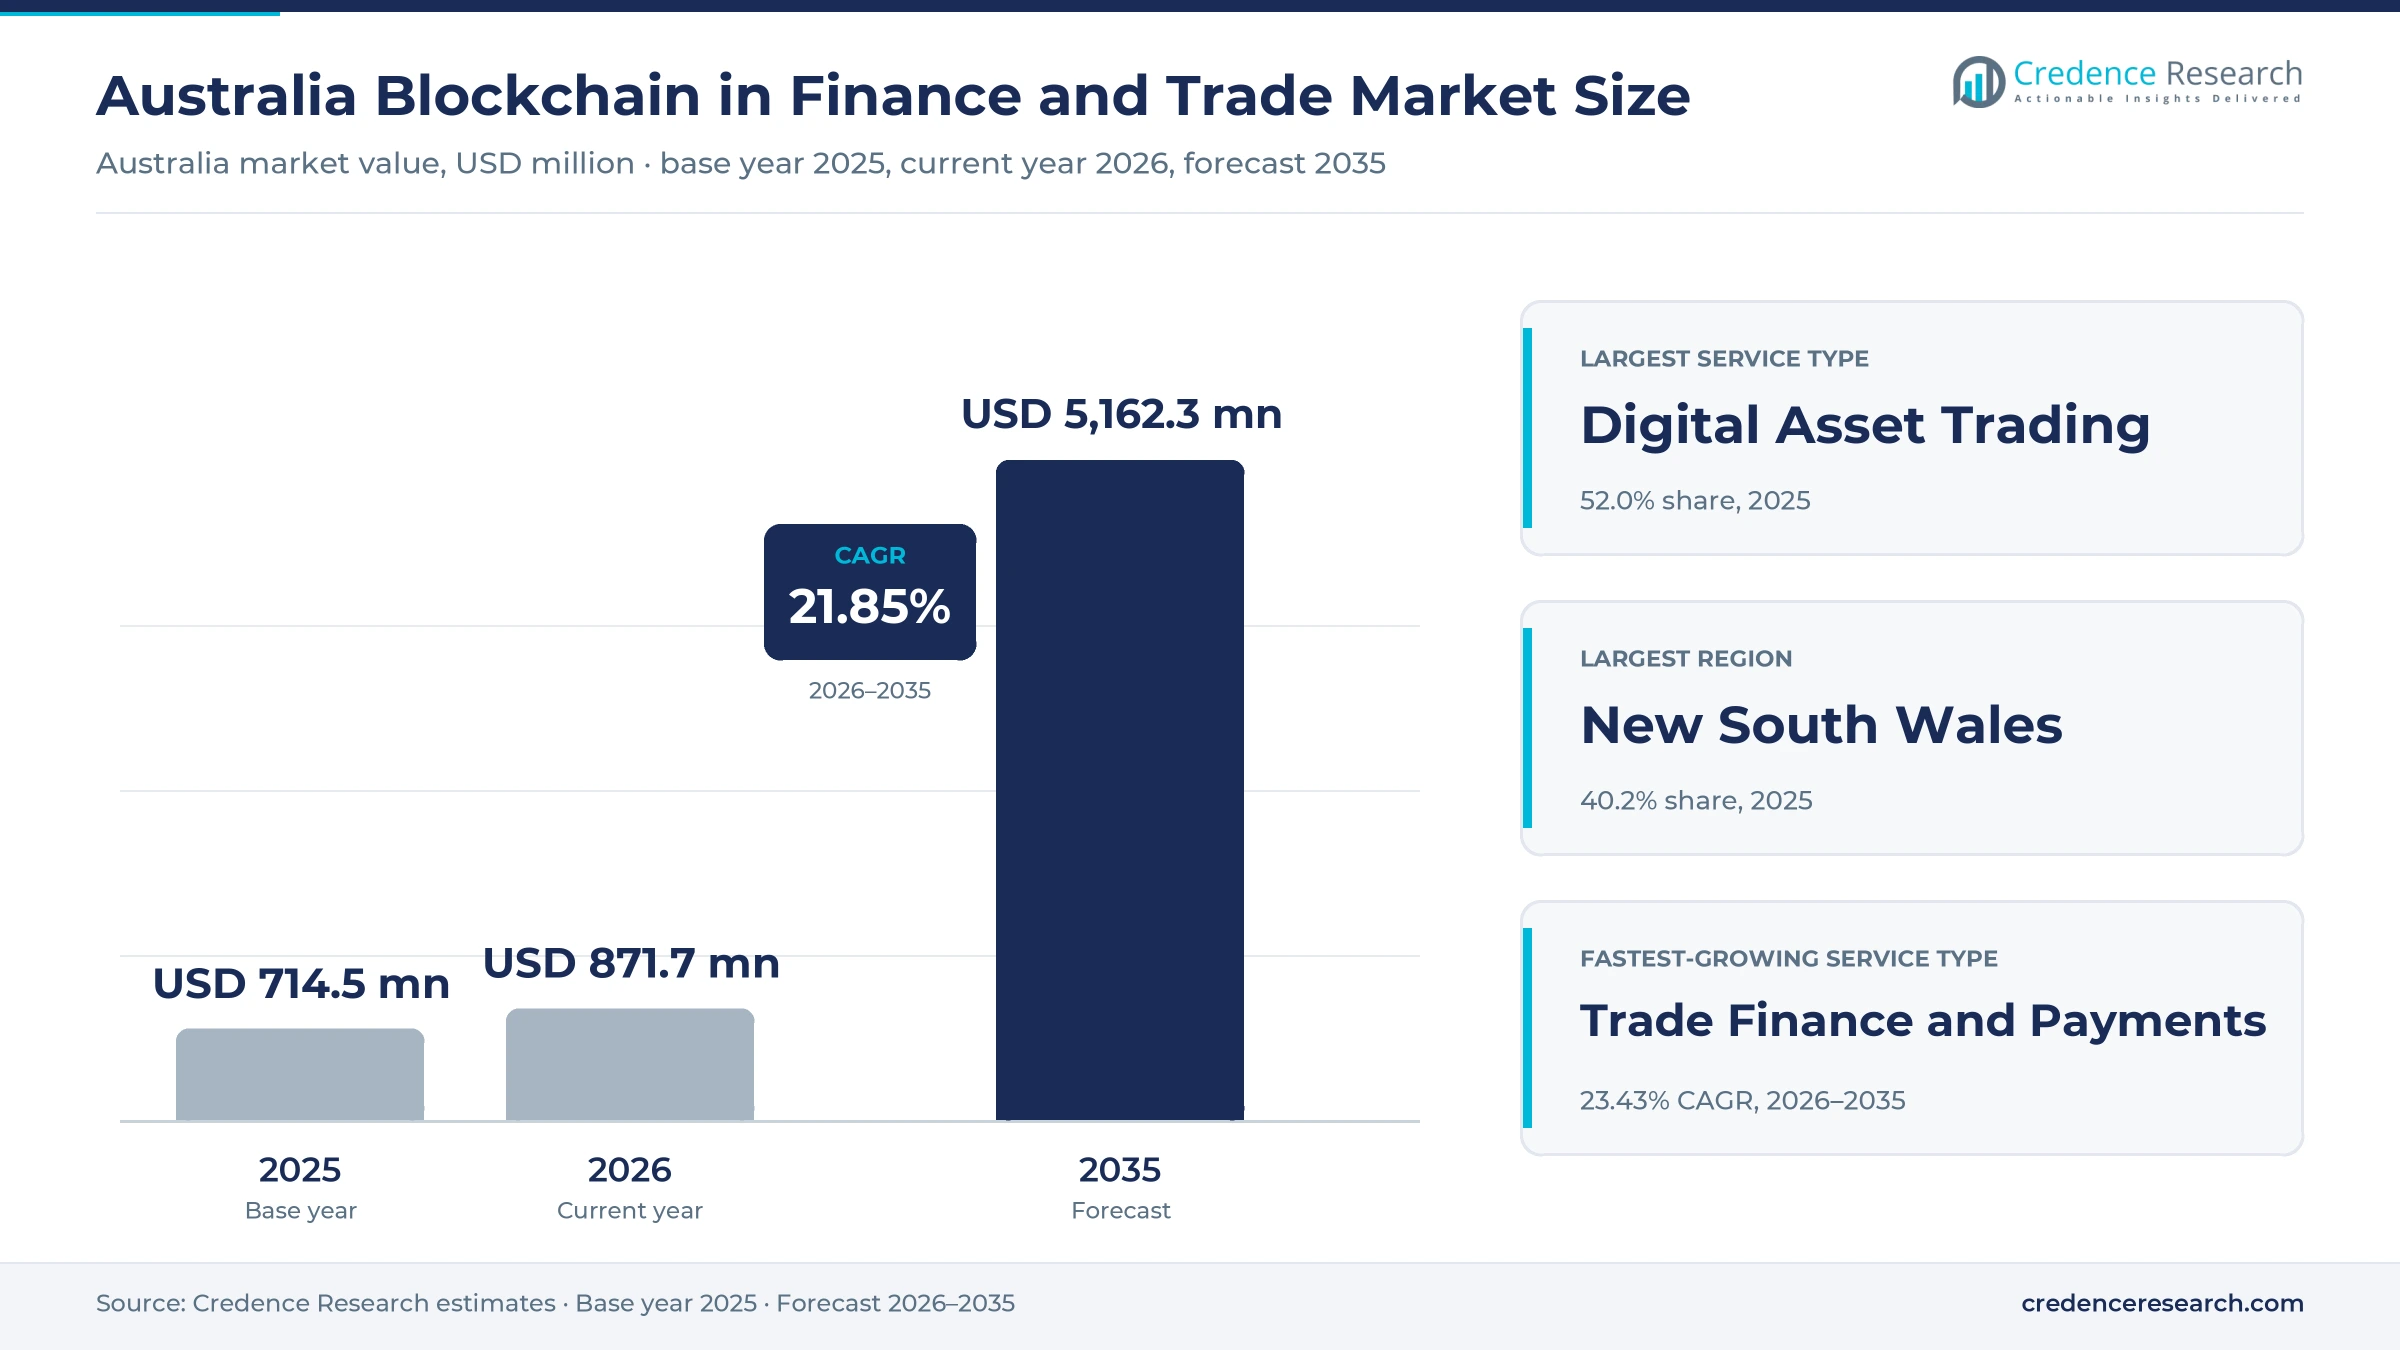
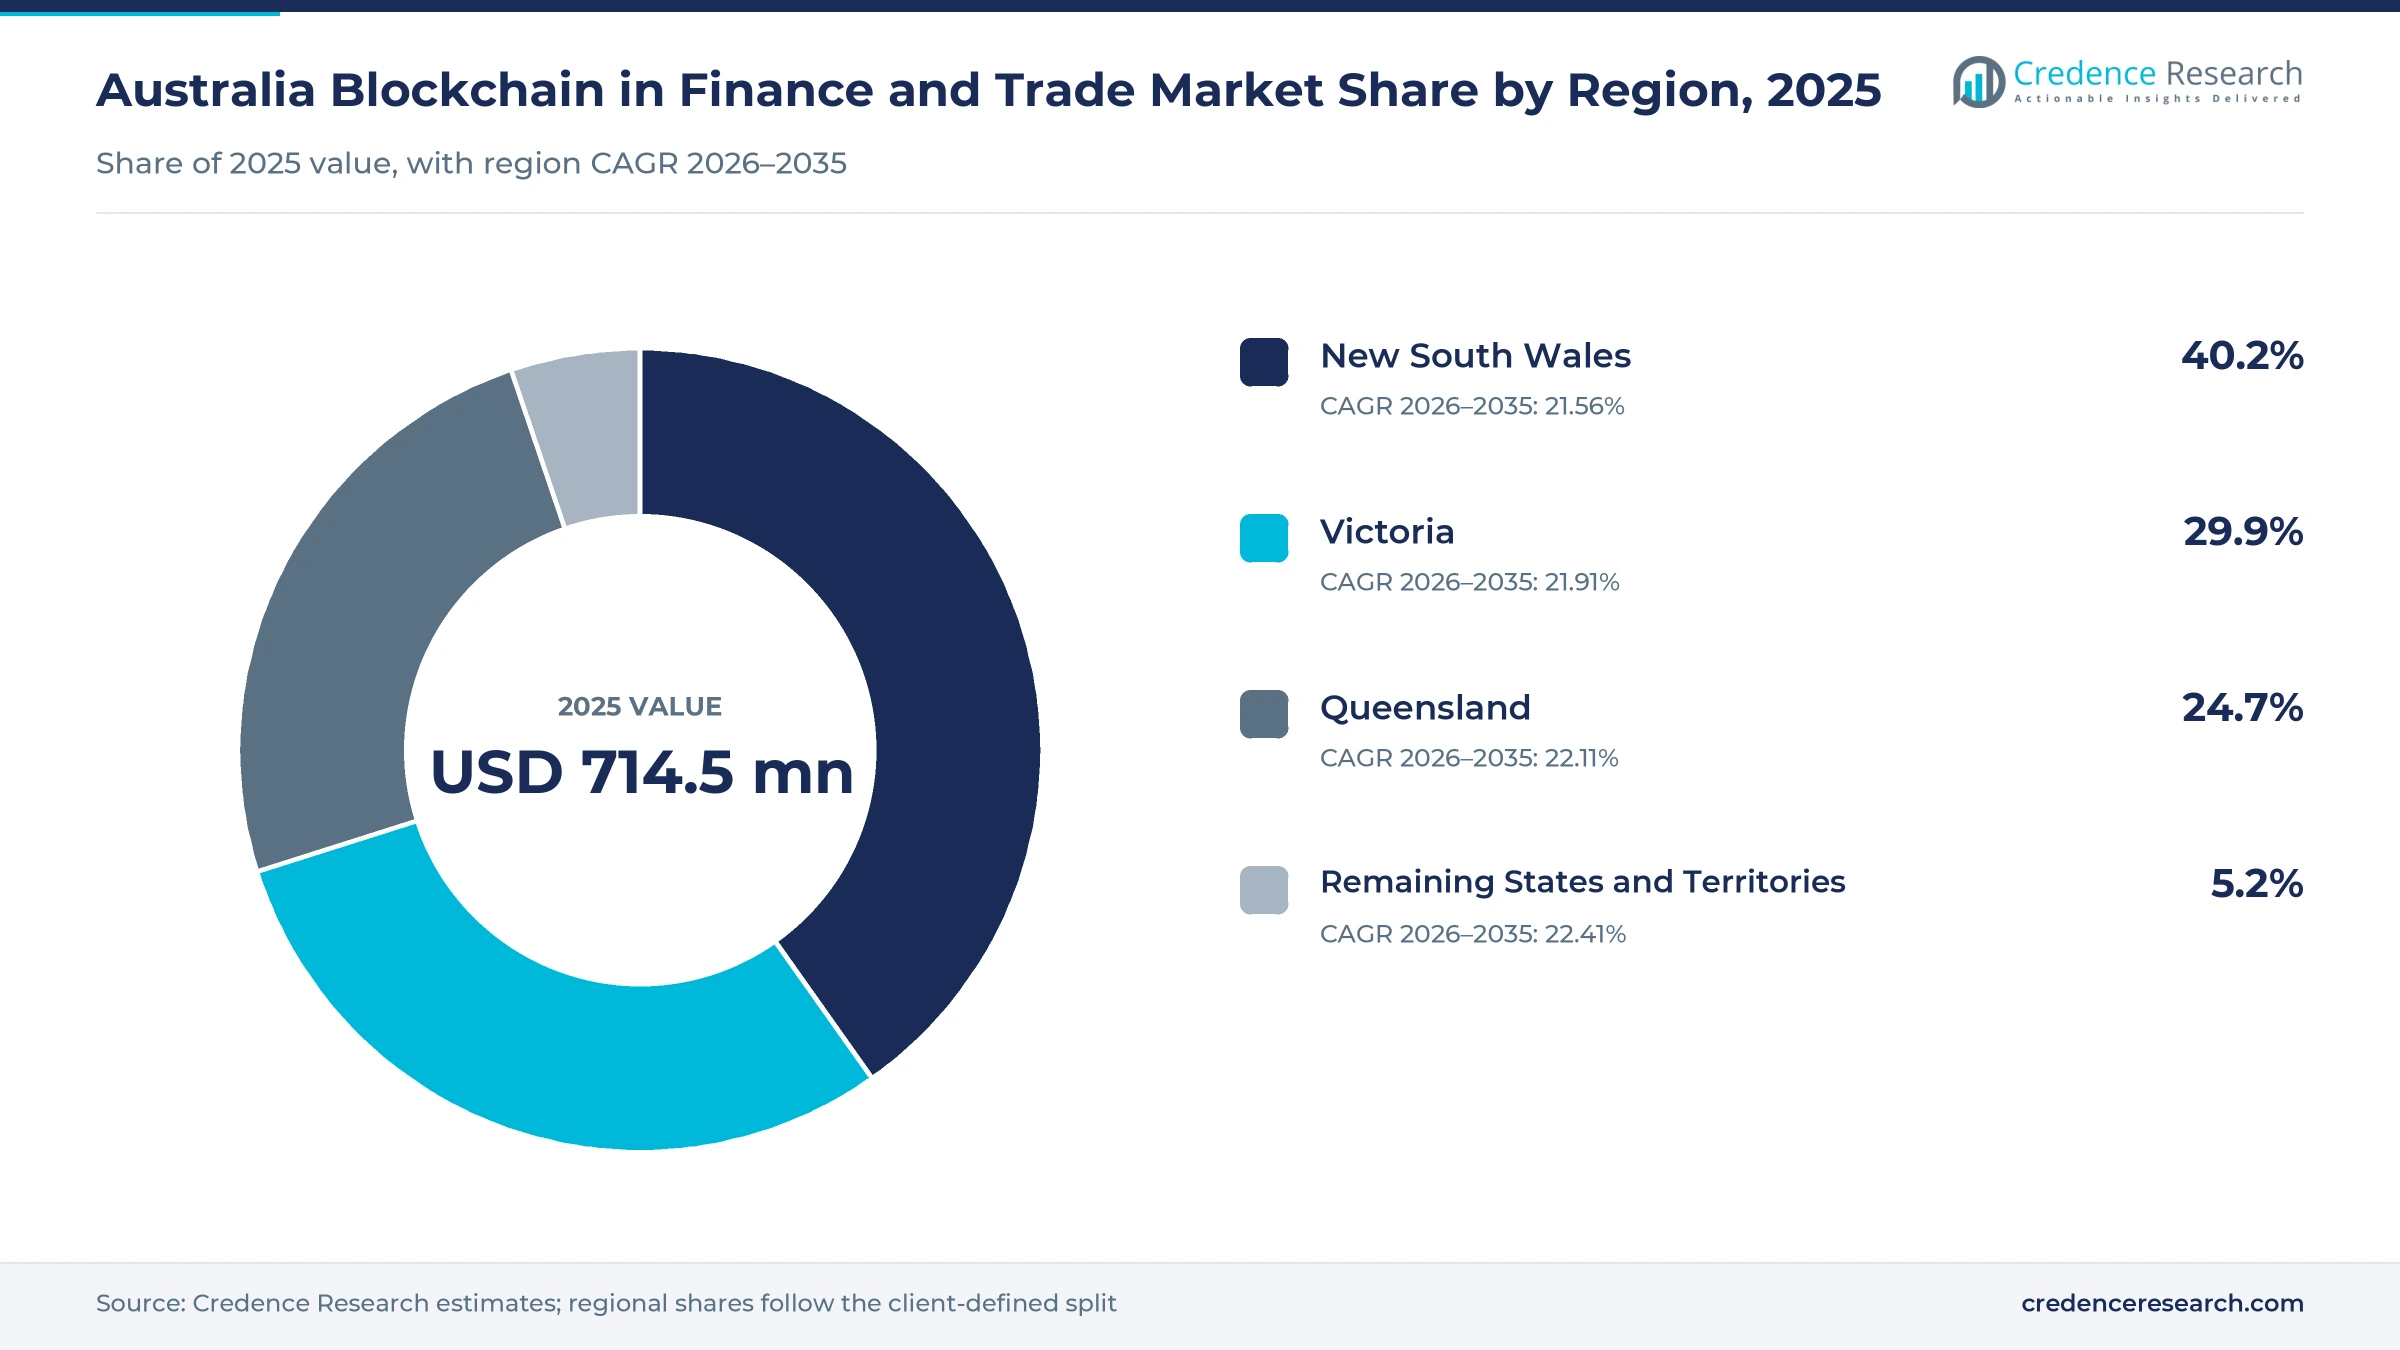
The Australia blockchain in finance and trade market was valued at USD 714.5 million in 2025 and is projected to increase from USD 871.7 million in 2026 to USD 5.16 billion by 2035, registering a CAGR of 21.85% during 2026–2035. Revenue comes from retail investors who buy and sell digital assets on local exchanges, professional investors and self-managed super funds that need custody, and banks and traders that test tokenized settlement for bonds, receivables and cross-border payments. New South Wales held the largest regional share, 40.2% in 2025, because the state has the most residents, about 8.67 million in March 2026, and the deepest pool of investors. The remaining states and territories are the fastest-growing region at 22.41% a year, as Western Australia adds residents faster than any other state. In turn, a national licensing law for digital asset platforms received Royal Assent on April 8, 2026, and it will bring exchanges and custody providers under financial services rules from April 2027.
Which digital asset services does the estimate cover?
The estimate measures revenue earned by firms that run digital asset exchanges and brokerages, offer custody and investment products backed by digital assets, and provide distributed ledger services for payments, trade finance and tokenized securities in Australia. It counts trading fees and spreads, recurring platform fees and implementation and advisory fees earned from local customers.
The estimate excludes the market value of the digital assets themselves, mining income and general software sales that do not involve financial or trade transactions. The value chain runs from protocol networks and custody technology through licensed platforms and brokers to retail investors, institutions and trading enterprises in every state and territory.
Australia Blockchain in Finance and Trade Market Insights
- The Australia blockchain in finance and trade market was valued at USD 714.5 million in 2025 and is projected to reach USD 5.16 billion by 2035, registering a CAGR of 21.85% during 2026–2035.
- New South Wales held a 40.2% share of 2025 value, because the state has the largest population and the deepest pool of investors.
- Digital asset trading led with a 52.0% share of 2025 value, because retail investors still pay most of the fees and spreads in the market.
- A national licensing law for digital asset platforms and tokenized custody platforms received Royal Assent on April 8, 2026, and it commences on April 9, 2027.
- Trade finance and payments services grow fastest at 23.43% a year during 2026–2035, as banks and traders move tokenized settlement from pilots into use.
Exchange trading leads while payments services grow fastest
Why does exchange trading hold the largest share?
Based on service type, the market is categorized into digital asset trading, investment and custody services, and trade finance and payments. Digital Asset Trading led with a 52.0% share of 2025 value, because retail investors pay spreads and fees each time they buy or sell on a local exchange. Trade Finance and Payments grow fastest at 23.43% a year, as stablecoins and deposit tokens start to settle invoices and cross-border trade payments.
How do investors, institutions and traders split spending?
Based on customer segment, the market is categorized into retail individuals, professional investors, financial institutions and trading enterprises. Retail Individuals led with a 46.0% share of 2025 value, because about a third of adult Australians have held crypto. Financial Institutions grow fastest at 23.15% a year, as banks and fund managers build tokenized bond, deposit and settlement services.
Why do direct apps remain the main channel?
Based on distribution channel, the market is categorized into direct digital platforms, relationship-led sales and embedded partner channels. Direct Digital Platforms led with 63.0% of 2025 value, because most retail investors open accounts through exchange apps and websites. Embedded Partner Channels grow fastest at 23.30% a year, as brokers, payment firms and super platforms add digital asset access inside their own services.
How do local exchanges and global entrants divide revenue?
Based on institution type, the market is categorized into domestic exchanges, international exchange subsidiaries, specialist financial platforms and enterprise infrastructure vendors. Domestic Exchanges led with a 44.0% share of 2025 value, because local brands built large retail customer bases early. Enterprise Infrastructure Vendors grow fastest at 23.41% a year, as banks hire ledger and custody technology for tokenized settlement projects.
| Segment Group | Leading Sub-segment | Share, 2025 | Fastest-growing Sub-segment | CAGR, 2026–2035 |
|---|---|---|---|---|
| By Service Type | Digital Asset Trading | 52.0% | Trade Finance and Payments | 23.43% |
| By Customer Segment | Retail Individuals | 46.0% | Financial Institutions | 23.15% |
| By Distribution Channel | Direct Digital Platforms | 63.0% | Embedded Partner Channels | 23.30% |
| By Institution Type | Domestic Exchanges | 44.0% | Enterprise Infrastructure Vendors | 23.41% |
Request a Free Sample
Fill in your details and we'll send you a free sample report.
- Sample data tables & charts
- Research methodology
Retail holders, new capital and wholesale pilots lift demand
How do retail holders lift trading revenue?
Each funded exchange account generates spreads and fees whenever its owner buys, sells or converts digital assets, so a wider holder base lifts revenue directly. About 33% of Australians have invested in or held crypto, according to the 2026 survey of more than 2,000 adults published by exchange operator Independent Reserve on March 17, 2026. The same survey found 31% a year earlier, which shows a broad and still rising holder base. Swyftx, which agreed to buy brokerage Caleb and Brown in July 2025, serves more than 1.2 million customers. Account ownership at financial institutions reached 98.0% of adults in 2024, according to the World Bank, so most investors can fund accounts instantly. As a result, retail individuals hold 46.0% of 2025 value.
Why do institutional owners and new capital support growth?
New owners and partners bring capital, licenses and corporate clients that local exchanges could not reach alone, which widens the paying customer base. IG Group agreed on Sept. 19, 2025, to buy Independent Reserve, which then reported about 11,600 monthly active customers, up 60% on the year. IG acquired a majority stake in February 2026, and the exchange plans corporate payment and yield products for the second half of 2026. OKX Australia opened its platform to self-managed super fund trustees on Sept. 15, 2025, targeting funds that hold about a quarter of national retirement savings. DigitalX raised about AUD 20.7 million in a July 2025 placement to grow its bitcoin holdings. In turn, professional investors and advised channels gain weight, while international exchange subsidiaries widen their product range.
How does wholesale tokenization testing open new revenue?
Banks, fund managers and exchanges now pay for ledger, custody and settlement services that move real assets rather than simulated ones. The Reserve Bank of Australia selected 24 use cases for Project Acacia on July 10, 2025, including 19 pilots with real money and real assets across fixed income, private markets, trade receivables and carbon credits. The final report on May 18, 2026, covered 20 use cases, and the bank issued AUD 4.4 million in pilot wholesale central bank digital currency. ANZ tested the exchange of a tokenized trade payable for its A$DC token, while Zerocap piloted a tokenized government bond paid in stablecoin. As a result, financial institutions grow at 23.15% a year, the fastest customer rate.
Why does platform licensing clarity raise customer trust?
Exchanges and custody providers will soon face the same conduct, custody and dispute rules as other financial firms, which gives cautious investors more confidence. The digital assets framework bill was introduced on Nov. 26, 2025, and the Parliamentary Library noted that an estimated 30,000 Australian investors were affected by the Terra and FTX collapses. Platforms with transactions below AUD 10 million over 12 months avoid licensing, which protects small entrants. The Senate approved the bill on April 2, 2026, and it received Royal Assent on April 8, 2026. In turn, investment and custody services gain ground on trading, which held 52.0% of 2025 value, as licensed custody spreads.
Stablecoins, retirement savings and bonds reshape services
How is the rise of stablecoins changing trade payments?
Importers and exporters want faster settlement without currency swings or long correspondent banking chains, and AUD-backed stablecoins now offer that option. XDC Network, a ledger network with trade finance expertise, partnered with AUD-backed stablecoin AUDD on Jan. 21, 2026, to settle Australia-U.S. business payments faster and at lower cost. The national regulator finalized relief on Dec. 9, 2025, that exempts intermediaries from separate licenses when they distribute eligible stablecoins and wrapped tokens, according to the Australian Securities and Investments Commission. NotCentralised also piloted a tokenized security backed by receivables and invoices under Project Acacia. As a result, trade finance and payments grow at 23.43% a year, the fastest service rate.
Why is the shift to regulated investment products notable?
Many investors now prefer exchange-traded funds and super platforms to holding tokens directly on an exchange, which moves fees toward regulated investment wrappers. The national securities exchange admitted its first spot bitcoin fund, the VanEck Bitcoin ETF, on June 20, 2024. DigitalX also supports its own exchange-listed bitcoin fund, BTXX, alongside its bitcoin treasury strategy. OKX Australia added dashboards and year-end reports for self-managed super fund trustees in September 2025. Self-managed super funds hold roughly a quarter of the AUD 4 trillion superannuation system, which gives such products a large base. In turn, direct digital platforms keep 63.0% of 2025 value, while advised channels expand alongside wider cryptocurrency demand.
Can tokenized government bonds open a new wholesale market?
Banks and fund managers need settlement that runs around the clock with lower counterparty risk, and tokenized government bonds could meet that need. Project Acacia participants completed trades of up to AUD 250,000 across several use cases, and the final report found gains in capital efficiency and settlement. The central bank and its partners proposed a tokenized government bond initiative, a market infrastructure sandbox and further work on bank deposit tokens. The Digital Finance Cooperative Research Centre, the bank's research partner on Project Acacia, puts the economic potential of digital finance innovation at about AUD 24 billion a year. As a result, enterprise infrastructure vendors grow at 23.41% a year, as banks extend distributed ledger systems for banks into live settlement.
Is there room for embedded payments and yield services?
Corporate treasuries and brokers want digital asset access inside tools they already use, which leaves room for embedded payment and yield services. Independent Reserve plans payment capabilities for corporate customers and yield products, subject to approval, in the second half of 2026. Coinbase received a national financial services license with retail derivatives authorization by April 8, 2026, which lets it offer perpetual contracts to local customers. CoinJar, which is registered with the national financial intelligence agency, competes for the same retail customers as brokers and payment apps add digital asset access. In turn, embedded partner channels grow at 23.30% a year, and they connect with digital payment networks used by merchants.
Licensing costs, scams and transfer rules test providers
How does the Block Earner ruling raise licensing costs?
Yield products that platforms once ran without a license now clearly need one, which raises compliance costs for smaller firms. The High Court found on June 17, 2026, that the fixed-yield Earner product was a financial product under the Corporations Act. As a result, smaller platforms must hire compliance staff or partner with licensed firms. The regulator extended no-action relief to Sept. 30, 2026, for firms that lodge license applications, which gives providers time to adjust.
Why do scams and cash kiosks weigh on public confidence?
Older investors lose savings to scams routed through crypto automated teller machines, which damages public confidence in digital assets. The national financial intelligence agency counted more than 1,800 active crypto kiosks, up from 23 in 2019, and people over 50 made almost 72% of transactions by value. In turn, the agency imposed a AUD 5,000 cap on cash deposits and withdrawals. Exchanges respond with stronger customer checks and scam warnings, which protects trust while slowing some onboarding.
How do transfer rules and reporting add operating costs?
Every virtual asset transfer now needs sender and receiver data, which adds systems and staff costs for exchanges. The travel rule started on July 1, 2026, with no carve-out for small transfers, and newly regulated providers had to apply for enrollment by July 29, 2026. As a result, exchanges must upgrade monitoring systems and staff training. Larger platforms spread these costs across more customers, while smaller firms turn to shared compliance tools and specialist vendors.
Why does enforcement risk test product design?
The regulator now pursues platforms that launch credit or leveraged products without proper controls, which raises the stakes of product design. Bit Trade, the local operator of Kraken, was ordered on Dec. 12, 2024, to pay AUD 8 million over a margin extension product offered to more than 1,100 customers. In turn, exchanges now review target market rules before launching products. Providers respond by limiting leverage to wholesale clients and by testing new features with the regulator first.
New South Wales leads while smaller states grow fastest
| Region | Value, 2025 (USD million) | Share, 2025 | CAGR, 2026–2035 |
|---|---|---|---|
| New South Wales | 287.2 | 40.2% | 21.56% |
| Victoria | 213.6 | 29.9% | 21.91% |
| Queensland | 176.5 | 24.7% | 22.11% |
| Remaining States and Territories | 37.2 | 5.2% | 22.41% |
New South Wales leads on population and investor depth
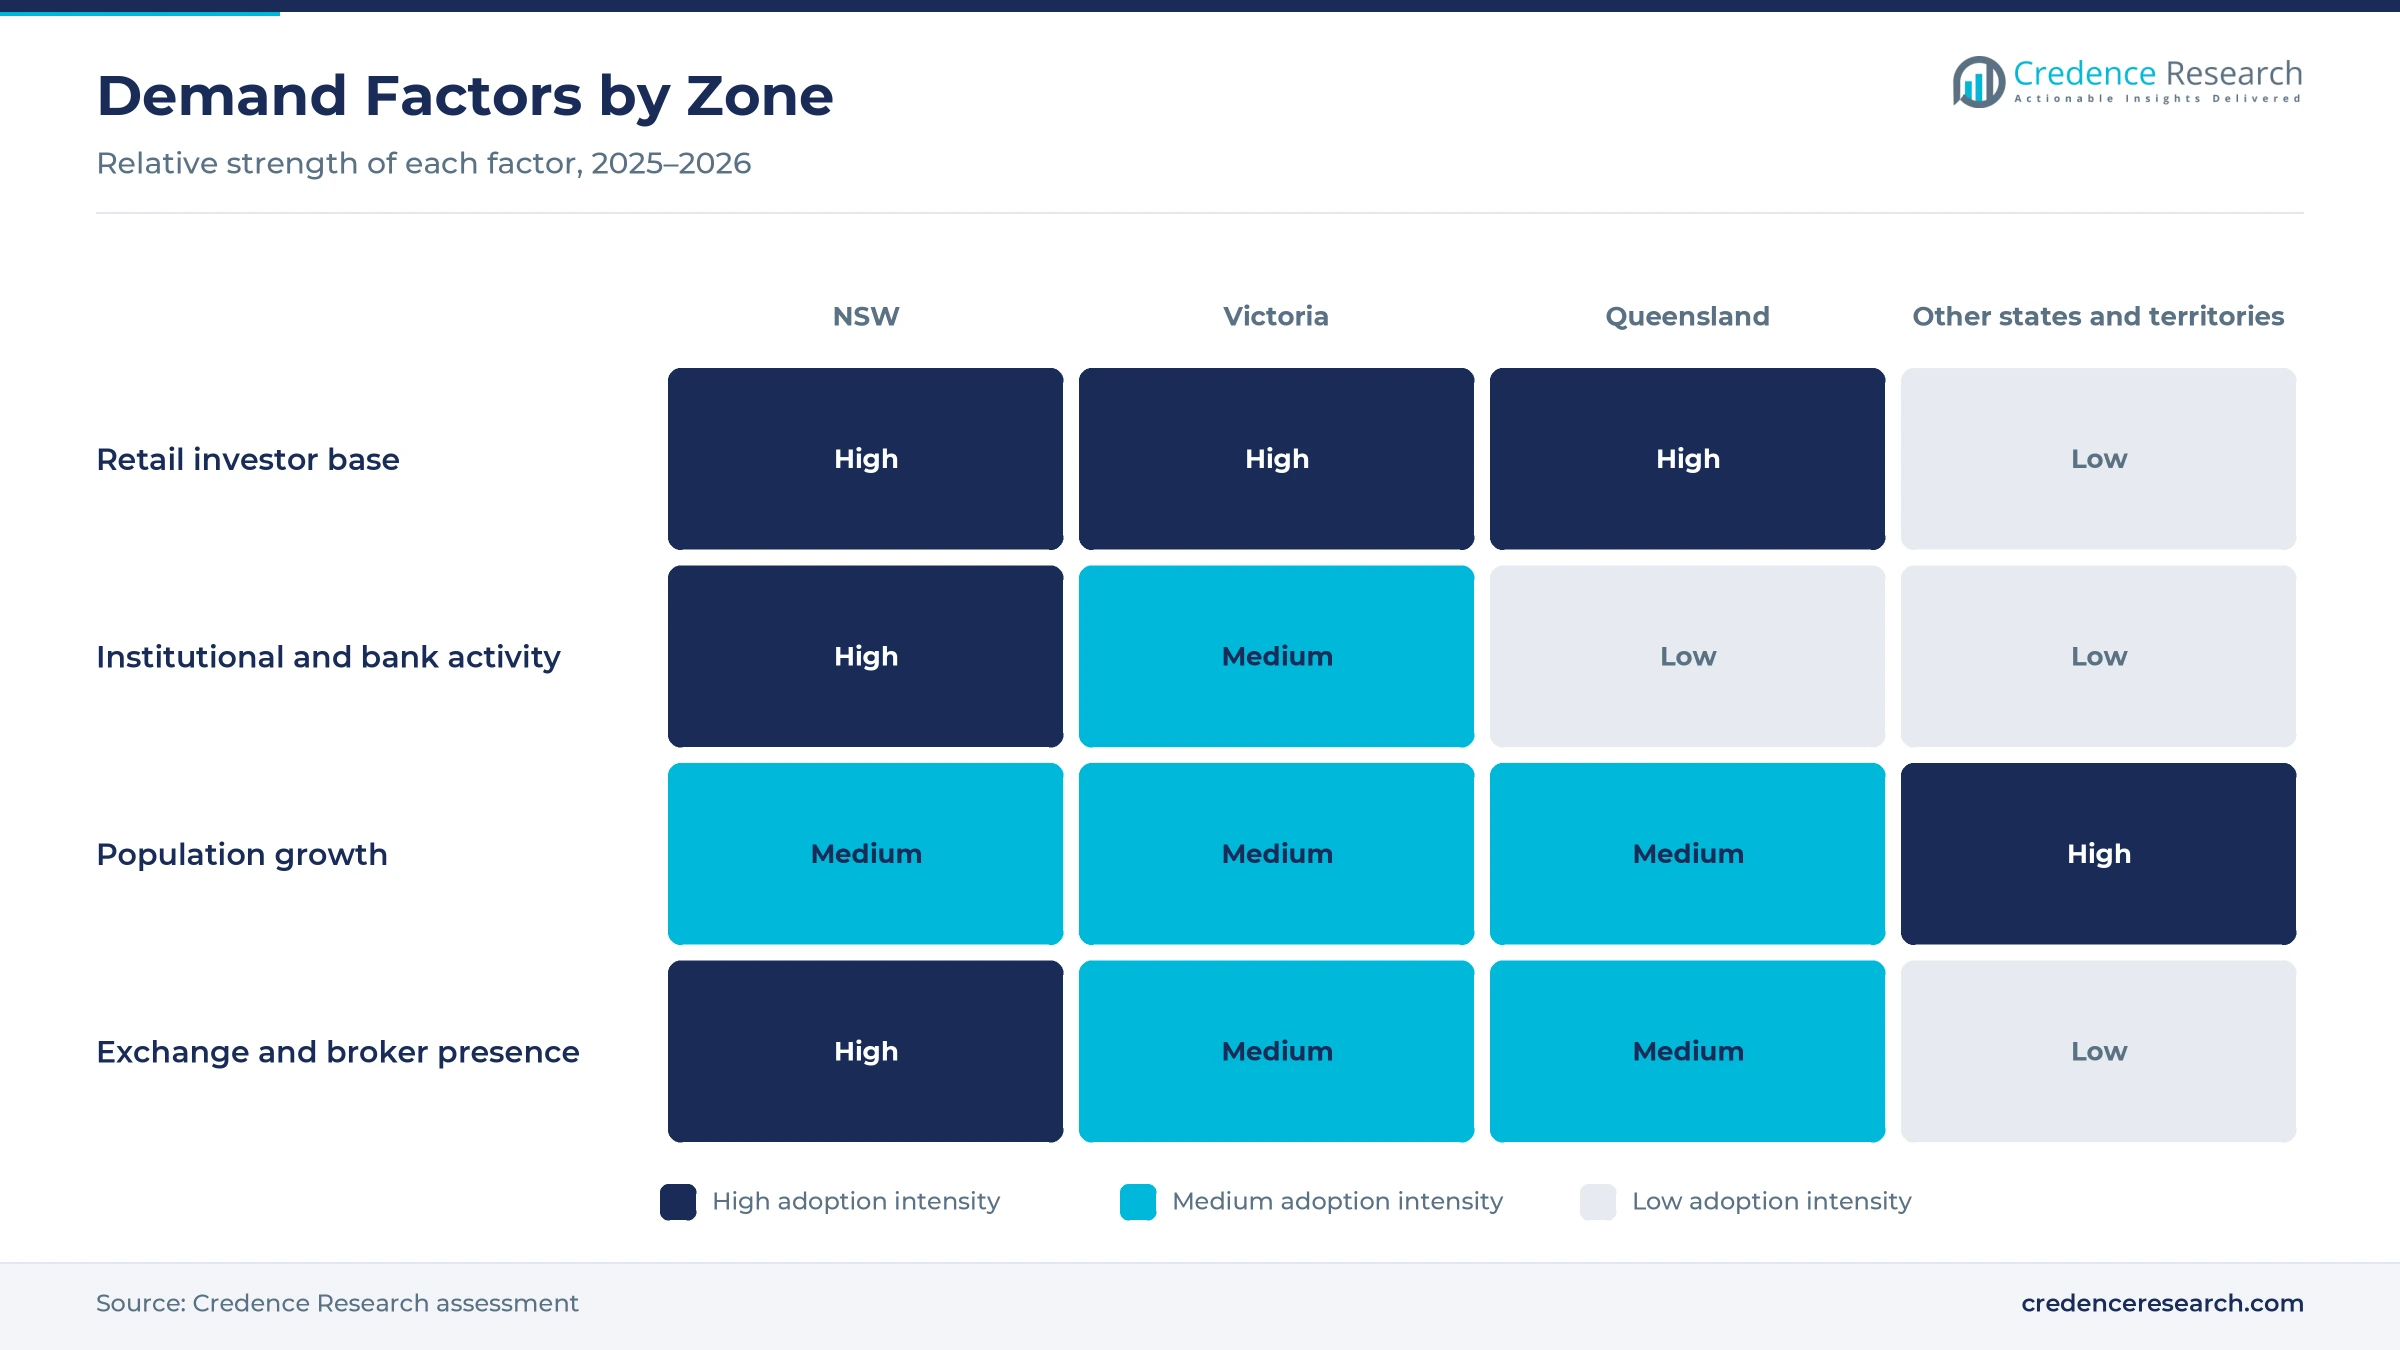
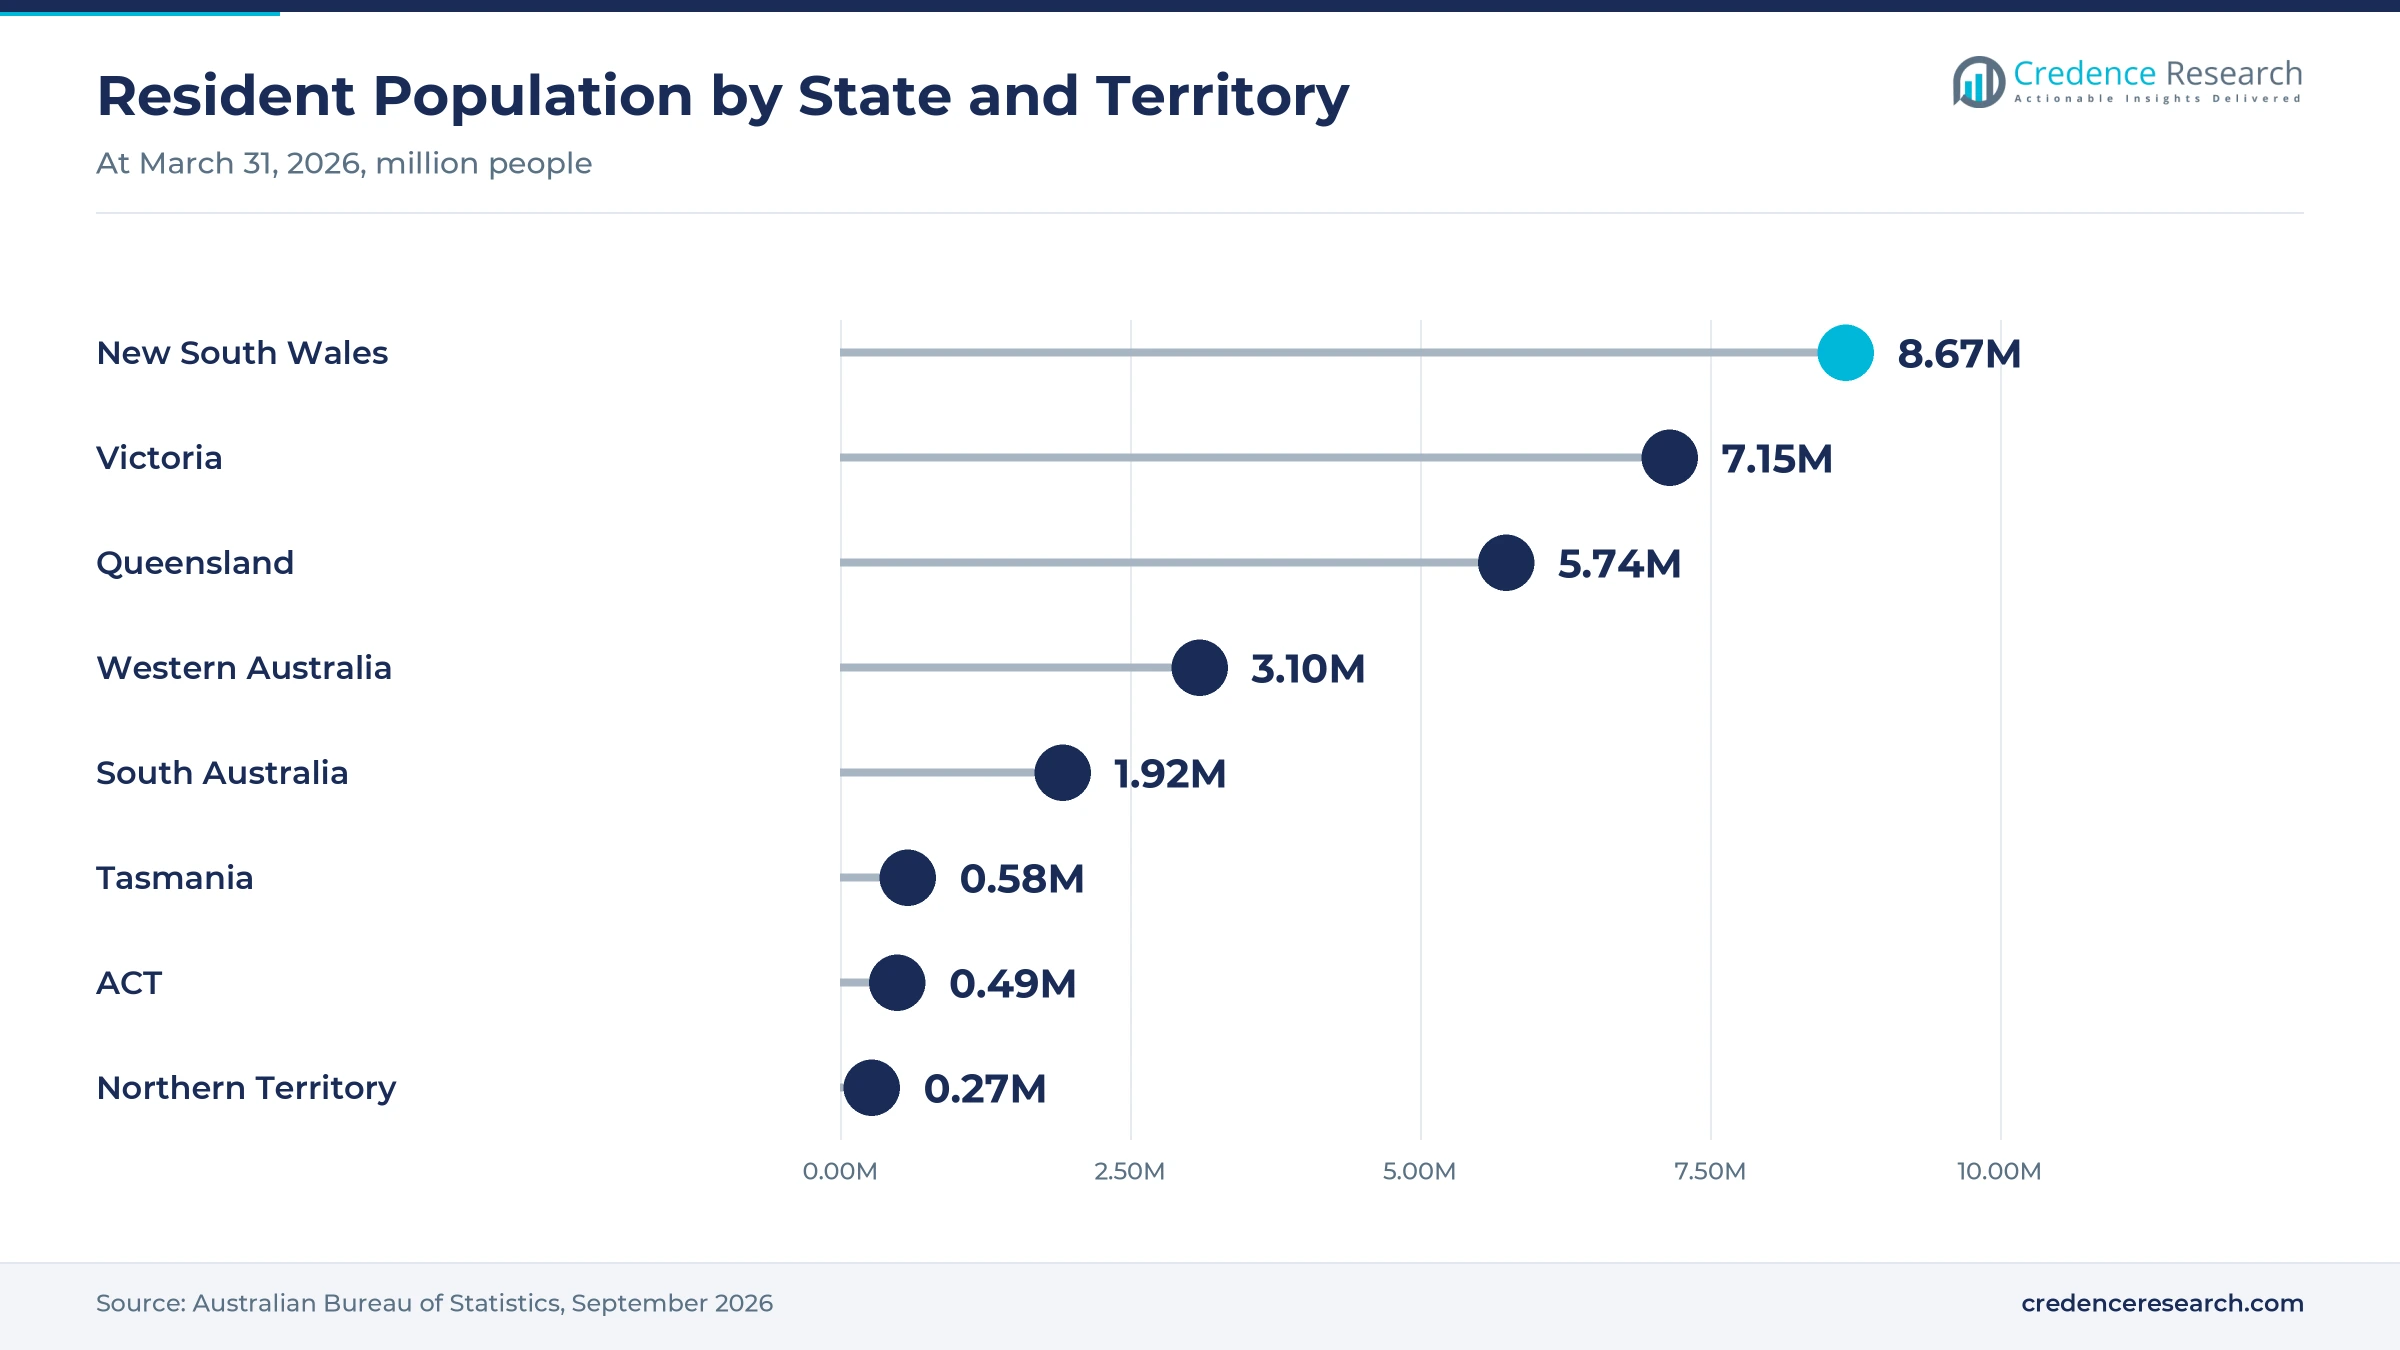
New South Wales held a 40.2% share of 2025 value and grows at 21.56% a year, because the state has the largest population and the deepest pool of retail and institutional investors. It had about 8.67 million residents at March 31, 2026, the most of any state, after adding about 97,000 people over the year. As a result, it leads retail trading, custody services and tokenized settlement pilots run by major banks and fund managers.
How does Victoria support exchange and custody demand?
Victoria held a 29.9% share of 2025 value and grows at 21.91% a year, because the state has the second-largest population and a large base of retail investors and super fund members. Victoria counted about 7.15 million residents at March 31, 2026, after 1.6% annual growth, and it added about 109,500 people, the largest increase of any state. In turn, the state remains the second-largest zone for retail trading accounts and super fund access to digital assets.
What lifts demand in Queensland?
Queensland held a 24.7% share of 2025 value and grows at 22.11% a year, because its population growth matches Victoria and outpaces New South Wales. Queensland counted about 5.74 million residents at March 31, 2026, also after 1.6% annual growth, which added about 90,100 people in Brisbane, regional cities and coastal centers. As a result, retail trading and brokerage services expand faster than in New South Wales.
Why do the remaining states and territories grow fastest?
The remaining states and territories accounted for 5.2% of 2025 value and grow fastest at 22.41% a year. Western Australia recorded the fastest population growth, 2.1% in the year to March 2026, which adds new investors faster than in the eastern states. As a result, payments services and retail trading gain from a small base.
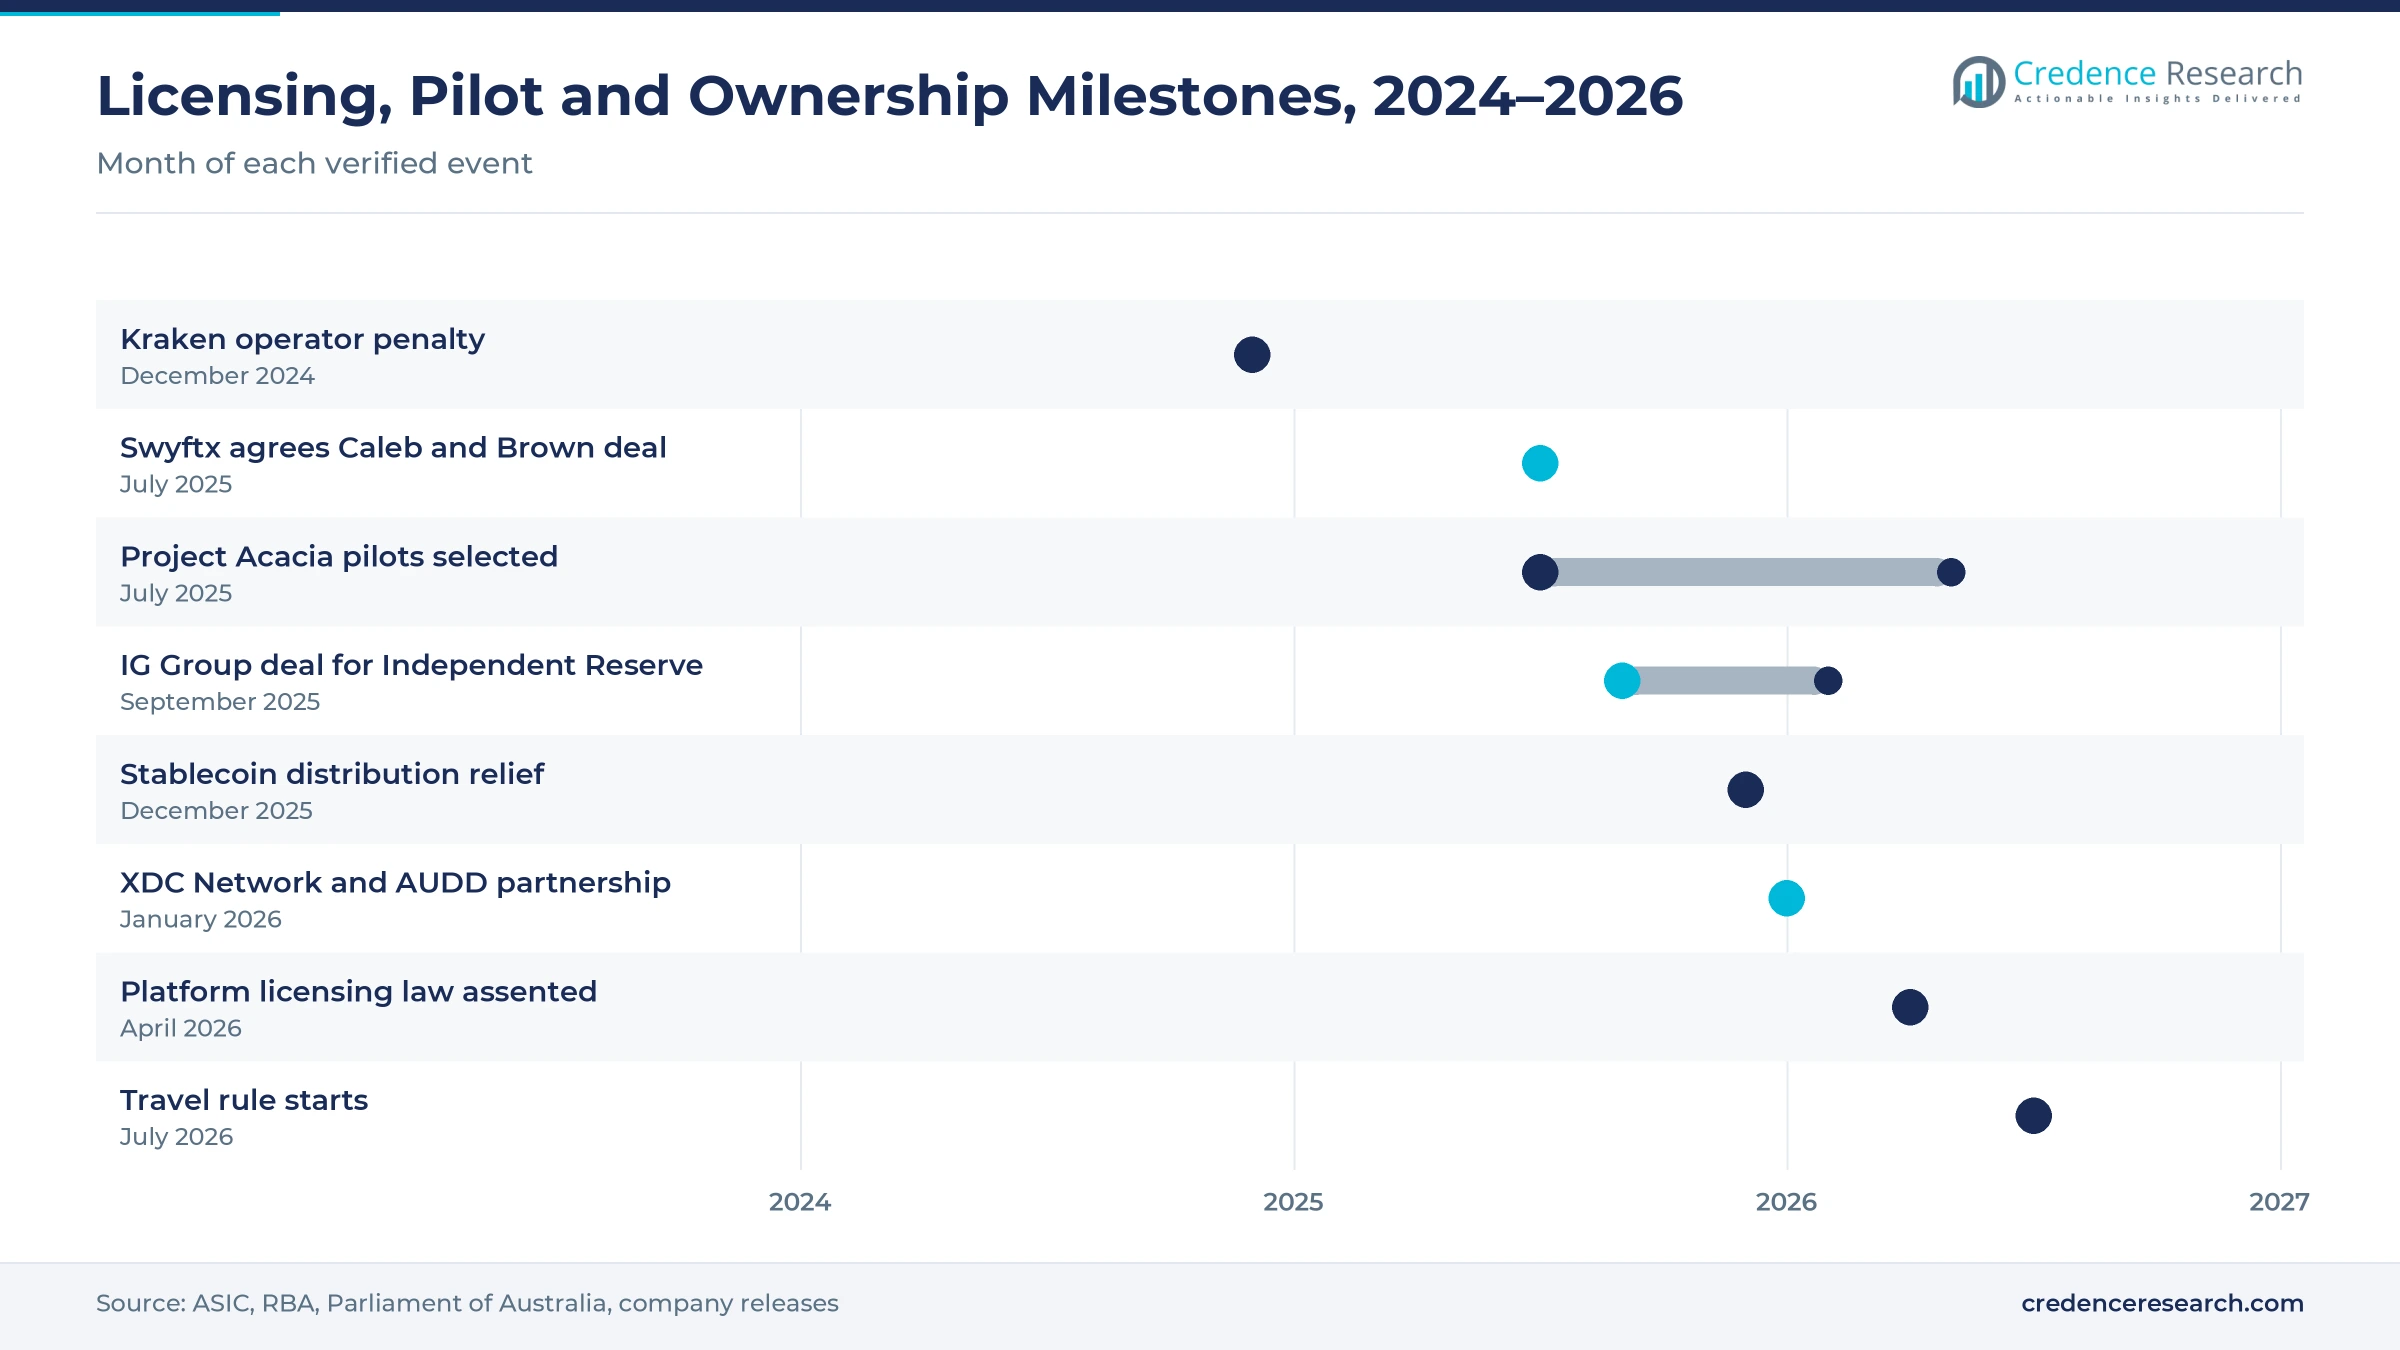
Licensing, pilot and ownership moves, 2024–2026
| Development | Status and market relevance |
|---|---|
| In December 2024, a federal court ordered Bit Trade, the local operator of Kraken, to pay AUD 8 million over a margin extension product. | Set the tone for product design and target market rules |
| In July 2025, the Reserve Bank of Australia selected 24 Project Acacia use cases, including a Zerocap tokenized bond pilot. | Moved wholesale tokenization into real-money pilots |
| In July 2025, Swyftx agreed to acquire digital asset brokerage Caleb and Brown, subject to regulatory approvals. | Combined a large retail exchange with an advised brokerage |
| In September 2025, IG Group agreed to acquire Independent Reserve, and it took a majority stake in February 2026. | Brought a global broker into the local exchange sector |
| In April 2026, the digital assets framework bill received Royal Assent, with commencement set for April 9, 2027. | Brings exchanges and custody platforms under licensing |
Custody, settlement tokens and ledgers change supply
- Institutional custody systems combine key management, segregated wallets and reconciliation tools, which lets platforms hold client assets in omnibus accounts under the record-keeping conditions set by the regulator.
- Settlement tokens include stablecoins, bank deposit tokens and pilot wholesale central bank money, which let tokenized bonds, receivables and invoices settle on delivery versus payment terms.
- Public and permissioned ledgers such as Hedera, Redbelly Network, R3 Corda and XDC Network carry tokenized assets, which helps banks and traders link records with crypto payment apps and settlement systems.
Need a Custom Version of This Report?
Tailor the scope, geography, or segments to your exact requirements.
- Custom geography or segment scope
- Direct access to our analyst team
Domestic exchanges face global brands and new owners
Competition is split between domestic exchanges, subsidiaries of global exchanges, specialist financial platforms and ledger vendors. Swyftx leads the domestic exchanges by customer base and is adding an advised brokerage arm through its planned purchase of Caleb and Brown. Independent Reserve now operates under IG Group majority ownership, while OKX Australia targets self-managed super fund trustees. Kraken operates locally through Bit Trade, which a federal court ordered in December 2024 to pay AUD 8 million over a margin extension product. CoinJar is registered with the national financial intelligence agency and expanded abroad in 2025. Zerocap piloted a tokenized bond under Project Acacia, and Coinstash raised AUD 5 million in July 2025. Rivals compete on spreads, custody safety, licenses and product range. Because licensing now applies to every platform, compliance scale has become a key advantage.
Which platforms lead Australian digital asset services?
| Company | Type | Role in the market |
|---|---|---|
| Swyftx | Domestic exchange | More than 1.2 million customers; agreed to buy Caleb and Brown in July 2025 |
| Independent Reserve | Domestic exchange | IG Group took a majority stake in February 2026 |
| OKX Australia | International exchange subsidiary | Opened its platform to self-managed super fund trustees in September 2025 |
| Kraken Australia | International exchange subsidiary | Local operator Bit Trade was ordered to pay AUD 8 million in December 2024 |
| CoinJar | Domestic exchange | Registered virtual asset provider; launched in 20 U.S. states in 2025 |
| Zerocap | Specialist financial platform | Piloted a tokenized government bond under Project Acacia |
| DigitalX | Specialist financial platform | Raised about AUD 20.7 million in July 2025 and supports the BTXX fund |
| Block Earner | Specialist financial platform | Fixed-yield product ruled a financial product in June 2026 |
| Coinstash | Domestic exchange | Raised AUD 5 million in a Series A round in July 2025 |
| XDC Network | Enterprise infrastructure vendor | Partnered with stablecoin AUDD for Australia-U.S. trade payments in January 2026 |
Credence Research view on digital asset services
Credence Research's view is that Australian digital asset services will keep growing because a broad retail holder base is now joined by institutions, super funds and traders. Exchange trading remains the largest revenue pool, while payments and trade settlement add the fastest growth. The new licensing law raises the cost of entry but should give banks, funds and corporate customers more confidence. Platforms that combine licensed custody, deep liquidity and links to tokenized settlement should gain share fastest across the Australia blockchain in finance and trade base over the next decade.
How the national digital asset services estimate was built
The report uses 2025 as the base year on a calendar basis, and market values come from the Credence Research model. That model combines a published exchange investor index, population estimates, World Bank financial access data, central bank project releases, parliamentary and regulator publications, and company announcements. Segment splits and zone growth rates are Credence Research estimates, while zone shares follow the client-defined split. Sources used are official statistics, regulator publications, exchange filings and company releases, and Credence Research conducted no interviews or surveys of its own for this report.
Payments, institutions and partners carry growth to 2035
Revenue is expected to reach USD 5.16 billion by 2035, a 21.85% CAGR during 2026–2035, as licensed platforms win more investors and institutions move tokenized settlement into daily use. Growth should come from trade finance and payments, financial institutions and embedded partner channels. A smooth licensing transition from April 2027 would support custody and investment services, while weak token prices or more scams would slow retail trading. Platforms with licensed scale, strong custody and links to bank settlement are expected to gain the most as Australia blockchain in finance and trade revenue shifts toward wholesale use.
Frequently Asked Questions
How big is the Australia blockchain in finance and trade market?
Which service type leads Australian digital asset revenue?
Which region leads the Australian market?
When does the digital asset platform licensing law start?
How many Australians have held crypto?
What was Project Acacia?
Who are the leading companies in the Australian market?
What are the main challenges for providers?
Table of Content
Chapter 1 Market Segmentation
- 1.1 Segmentation Framework
- 1.1.1 Product and Service Classification
- 1.1.2 Application and End-Use Classification
- 1.1.3 Technology and Solution Classification
- 1.1.4 Customer and Distribution Channel Classification
- 1.1.5 Geographic Segmentation
- 1.1.6 Market Segment Definitions and Boundaries
- 1.2 By Service Type
- 1.2.1 Digital Asset Trading
- 1.2.2 Investment and Custody Services
- 1.2.3 Trade Finance and Payments
- 1.3 By Customer Segment
- 1.3.1 Retail Individuals
- 1.3.2 Professional Investors
- 1.3.3 Financial Institutions
- 1.3.4 Trading Enterprises
- 1.4 By Institution Type
- 1.4.1 Domestic Exchanges
- 1.4.2 International Exchange Subsidiaries
- 1.4.3 Specialist Financial Platforms
- 1.4.4 Enterprise Infrastructure Vendors
Chapter 2 Introduction
- 2.1 Report Objectives and Scope
- 2.2 Product Definition and Industry Terminology
- 2.3 Market Inclusions and Exclusions
- 2.4 Research Process
- 2.4.1 Primary Research and Expert Interviews
- 2.4.2 Secondary Research and Source Review
- 2.4.3 Top-Down and Bottom-Up Estimation
- 2.4.4 Data Triangulation and Verification
- 2.5 Market Size Measurement Basis
- 2.5.1 2025: USD 714.5 million → 2035: USD 5.16 billion
- 2.6 Historical and Forecast Reference Periods
- 2.6.1 Historical Period: 2018-2025
- 2.6.2 Base Year: 2025
- 2.6.3 Forecast Period: 2025-2035
- 2.7 Research Assumptions and Limitations
Chapter 3 Executive Summary
- 3.1 Market Snapshot and Key Findings
- 3.2 Base-Year Market Size, 2025
- 3.3 Forecast Market Size, 2035
- 3.4 Revenue and Volume Growth Outlook
- 3.5 Key Demand and Supply Indicators
- 3.6 Leading Market Segments
- 3.7 Fastest-Growing Market Opportunities
- 3.8 Regional Performance Highlights
- 3.9 Technology and Industry Transformation
- 3.10 Competitive Landscape Summary
- 3.11 Analyst View and Strategic Implications
Chapter 4 Australia Blockchain in Finance and Trade Market Trends and Developments
- 4.1 Historical Industry Development, 2018-2025
- 4.2 Recent Market Trends and Developments
- 4.3 Demand and Customer Behavior Trends
- 4.4 Technology and Product Innovation
- 4.5 Artificial Intelligence, Automation and Digitalization
- 4.6 Local Manufacturing and Supply Chain Realignment
- 4.7 Industry Partnerships, Mergers and Acquisitions
- 4.8 Sustainability and Circular Economy Developments
- 4.9 Government and Private Sector Investment Trends
- 4.10 Emerging Business Models and Commercialization
- 4.11 Industry Developments and Announcements
Chapter 5 Australia Blockchain in Finance and Trade Market Supply and Demand Analysis
- 5.1 Demand Trend and Consumption Analysis, 2018-2025
- 5.2 Demand Forecast, 2025-2035
- 5.3 Supply Chain Structure and Procurement Trends
- 5.4 Supply-Demand Gap and Bottlenecks
- 5.5 Import Dependence and Sourcing Structure
- 5.6 Regional Supply and Demand Concentration
Chapter 6 Australia Blockchain in Finance and Trade Market Pricing Analysis
- 6.1 Pricing Structure and Measurement
- 6.2 Historical Pricing Trends, 2018-2025
- 6.3 Pricing Outlook, 2025-2035
- 6.4 Pricing by Product and Market Segment
- 6.5 Geographic Pricing Differences
- 6.6 Key Input, Energy, Labor and Logistics Costs
- 6.7 Contract Pricing and Purchasing Models
- 6.8 Pricing Sensitivity and Competitive Positioning
- 6.9 Price, Margin and Profitability Implications
Chapter 7 Australia Blockchain in Finance and Trade Market Dynamics
- 7.1 Market Growth Drivers
- 7.1.1 Demand-Side Drivers
- 7.1.2 Technology and Innovation Drivers
- 7.1.3 Infrastructure and Investment Drivers
- 7.1.4 Regulatory and Policy Drivers
- 7.2 Market Restraints
- 7.2.1 Cost and Affordability Constraints
- 7.2.2 Technology and Adoption Barriers
- 7.2.3 Supply Chain and Operational Constraints
- 7.3 Market Challenges
- 7.3.1 Competitive Pressure and Margin Erosion
- 7.3.2 Skills, Infrastructure and Implementation Gaps
- 7.4 Emerging Market Opportunities
- 7.5 Market Dynamics Impact and Time-Horizon Assessment
Chapter 8 Australia Blockchain in Finance and Trade Value Chain Analysis
- 8.1 Industry Value Chain Overview
- 8.2 Upstream Suppliers and Critical Inputs
- 8.3 Technology and Component Providers
- 8.4 Manufacturing or Service Delivery
- 8.5 Distribution, Channel Partners and Integrators
- 8.6 Downstream Applications and End Users
- 8.7 Value Addition and Profit Pools
- 8.8 Vertical Integration and Outsourcing
- 8.9 Supplier Concentration and Risk
- 8.10 Supply Chain Localization and Resilience
Chapter 9 Australia Blockchain in Finance and Trade Market Regulations and Policies
- 9.1 Relevant Laws, Standards and Compliance Frameworks
- 9.2 Product, Service, Safety and Quality Requirements
- 9.3 Government Policies, Incentives and Subsidies
- 9.4 Imports, Exports and Trade Barriers
- 9.5 Public Procurement and Local Content Requirements
- 9.6 Data Protection, AI and Cybersecurity Compliance
- 9.7 Upcoming Policy Changes and Market Implications
Chapter 10 Australia Blockchain in Finance and Trade Market Hotspots and Opportunities
- 10.1 Market Opportunity Mapping and Growth Hotspots
- 10.2 High-Growth Applications and Customer Groups
- 10.3 Underserved Markets and White-Space Opportunities
- 10.4 Emerging Technology and Product Opportunities
- 10.5 New Capacity and Investment Hotspots
- 10.6 Market Entry and Expansion Opportunities
- 10.7 Distribution and Partnership Opportunities
- 10.8 Near-Term and Long-Term Commercial Potential
- 10.9 Opportunity Attractiveness and Execution Risks
Chapter 11 Australia Blockchain in Finance and Trade Market Outlook, 2025-2035
- 11.1 Market Size and Analysis
- 11.1.1 Revenue (Market Measurement: 2025: USD 714.5 million → 2035: USD 5.16 billion)
- 11.1.2 Historical Market Size, 2018-2025
- 11.1.3 Base-Year Market Size, 2025
- 11.2 Market Forecast, 2025-2035
- 11.2.1 Revenue Forecast to 2035
- 11.2.2 CAGR and Year-on-Year Growth
- 11.2.3 Incremental Revenue Opportunity
- 11.3 Forecast Assumptions and Scenario Analysis
- 11.3.1 Base-Case Forecast
- 11.3.2 Optimistic and Conservative Scenarios
- 11.3.3 Technology, Pricing and Policy Sensitivities
- 11.4 Market Attractiveness and Growth Outlook
Chapter 12 Australia Blockchain in Finance and Trade Market Segmentation and Outlook
- 12.1 Segmentation Summary and Market Shares, 2025
- 12.2 Largest and Fastest-Growing Segments
- 12.3 By Service Type - Market Size and Forecast, 2025-2035
- 12.3.1 Segment Definition and Scope
- 12.3.2 Historical Market Size, 2018-2025
- 12.3.3 Revenue Forecast, 2025-2035
- 12.3.4 Base-Year Market Share, 2025
- 12.3.5 Segment CAGR and Growth Drivers
- 12.3.6 Subsegment Market Size and Forecast
- 12.3.6.1 Digital Asset Trading
- 12.3.6.2 Investment and Custody Services
- 12.3.6.3 Trade Finance and Payments
- 12.3.7 Subsegment Pricing and Adoption Trends
- 12.3.8 Leading Suppliers and Competition
- 12.3.9 Regional Demand and Opportunities
- 12.4 By Customer Segment - Market Size and Forecast, 2025-2035
- 12.4.1 Segment Definition and Scope
- 12.4.2 Historical Market Size, 2018-2025
- 12.4.3 Revenue Forecast, 2025-2035
- 12.4.4 Base-Year Market Share, 2025
- 12.4.5 Segment CAGR and Growth Drivers
- 12.4.6 Subsegment Market Size and Forecast
- 12.4.6.1 Retail Individuals
- 12.4.6.2 Professional Investors
- 12.4.6.3 Financial Institutions
- 12.4.6.4 Trading Enterprises
- 12.4.7 Subsegment Pricing and Adoption Trends
- 12.4.8 Leading Suppliers and Competition
- 12.4.9 Regional Demand and Opportunities
- 12.5 By Institution Type - Market Size and Forecast, 2025-2035
- 12.5.1 Segment Definition and Scope
- 12.5.2 Historical Market Size, 2018-2025
- 12.5.3 Revenue Forecast, 2025-2035
- 12.5.4 Base-Year Market Share, 2025
- 12.5.5 Segment CAGR and Growth Drivers
- 12.5.6 Subsegment Market Size and Forecast
- 12.5.6.1 Domestic Exchanges
- 12.5.6.2 International Exchange Subsidiaries
- 12.5.6.3 Specialist Financial Platforms
- 12.5.6.4 Enterprise Infrastructure Vendors
- 12.5.7 Subsegment Pricing and Adoption Trends
- 12.5.8 Leading Suppliers and Competition
- 12.5.9 Regional Demand and Opportunities
- 12.6 Segment Growth Comparison
- 12.7 Segment Attractiveness and Priority Matrix
Chapter 13 Australia Blockchain in Finance and Trade End-Use and Application Market Outlook
- 13.1 End-Use Industry and Customer Demand Structure
- 13.2 Leading Applications and Customer Groups
- 13.3 End-Use Market Size, Share and Forecast
- 13.4 Major End-Use Industry Deep Dives
- 13.4.1 Customer Requirements and Use Cases
- 13.4.2 Demand and Replacement Cycles
- 13.4.3 Technical and Regulatory Considerations
- 13.4.4 Purchasing and Procurement Models
- 13.4.5 Leading Vendors and Distribution Channels
- 13.4.6 Forecast and Commercial Opportunities
- 13.5 Emerging Applications and Cross-Segment Demand
- 13.6 End-Use Industry Investment Priorities
Chapter 14 Australia Blockchain in Finance and Trade Geographic Market Outlook, 2025-2035
- 14.1 Domestic Market Distribution and Demand Clusters
- 14.2 State- or Province-Wise Market Size and Forecast, 2025-2035
- 14.3 City and Metropolitan Market Outlook
- 14.4 Industrial, Manufacturing and Commercial Clusters
- 14.5 Geographic Concentration of Key End Users
- 14.6 Local Pricing and Purchasing Differences
- 14.7 Domestic Production Facilities and Capacity Map
- 14.8 Local Infrastructure and Project Pipeline
- 14.9 State-Level Policy and Incentive Differences
- 14.10 Subnational Investment Hotspots and Opportunities
- 14.11 Distribution and Logistics Networks
- 14.12 Domestic Competitive Footprint
Chapter 15 Australia Blockchain in Finance and Trade Technology, Innovation and Sustainability Outlook
- 15.1 Technology Landscape and Maturity
- 15.2 Product, Process and Service Innovation
- 15.3 AI, Automation and Digital Tools in the Industry
- 15.4 Technology Adoption and Performance Benchmarking
- 15.5 Innovation Pipeline and R&D Investment
- 15.6 Energy Efficiency and Resource Management
- 15.7 Sustainability, Recycling and Circularity
- 15.8 Technology Roadmap, 2025-2035
- 15.9 Risks of Obsolescence and Technology Substitution
Chapter 16 Australia Blockchain in Finance and Trade Market Key Strategic Imperatives
- 16.1 Growth and Market Entry Priorities
- 16.2 High-Return Products and Segments
- 16.3 Pricing, Profitability and Cost Optimization
- 16.4 Technology Investment and Product Differentiation
- 16.5 Supply Chain Localization and Resilience
- 16.6 Distribution and Customer Acquisition
- 16.7 Partnership, Acquisition and Capacity Strategy
- 16.8 Regional Expansion Priorities
- 16.9 Short-, Medium- and Long-Term Actions
Chapter 17 Competition Outlook
- 17.1 Industry Competition Characteristics
- 17.2 Market Structure and Concentration
- 17.3 Market Share and Competitive Positioning, 2025
- 17.4 Company-Wise Revenue and Product Benchmarking
- 17.5 Production and Service Capacity Benchmarking
- 17.6 Technology, Pricing and Differentiation
- 17.7 Regional Footprint and Distribution Strength
- 17.8 Mergers, Acquisitions and Strategic Alliances
- 17.9 New Entrants and Competitive Threats
- 17.10 Porter's Five Forces and Industry Attractiveness
- 17.11 Competitive Outlook, 2025-2035
Chapter 18 Company Profiles
- 18.1 Company Coverage and Selection Criteria
- 18.2 Kraken Australia
- 18.2.1 Business Description
- 18.2.2 Company Ownership and Geographic Presence
- 18.2.3 Product and Service Portfolio
- 18.2.4 Manufacturing and Operating Footprint
- 18.2.5 Financial Performance and Investment
- 18.2.6 Market Share and Competitive Position
- 18.2.7 Technology and Innovation Capabilities
- 18.2.8 Strategic Alliances or Partnerships
- 18.2.9 Recent Developments
- 18.2.10 Growth Strategy and Outlook
- 18.3 OKX Australia
- 18.4 Swyftx
- 18.5 Independent Reserve
- 18.6 CoinJar
- 18.7 Zerocap
- 18.8 DigitalX
- 18.9 Block Earner
- 18.10 Coinstash
- 18.11 XDC Network
- 18.12 Other Relevant Market Participants
Note: Every listed company is profiled on the structure shown under the first company. The company list is preliminary and may change based on research findings, market developments, data availability and client requirements.
Chapter 19 Disclaimer
- 19.1 Research and Forecast Disclaimer
- 19.2 Data Source and Estimation Limitations
Note: The depth of individual sections depends on data availability for this market. Volume, capacity, trade and other unit-based metrics are included where applicable.

