
Equity broking anchors revenue as retail accounts surge
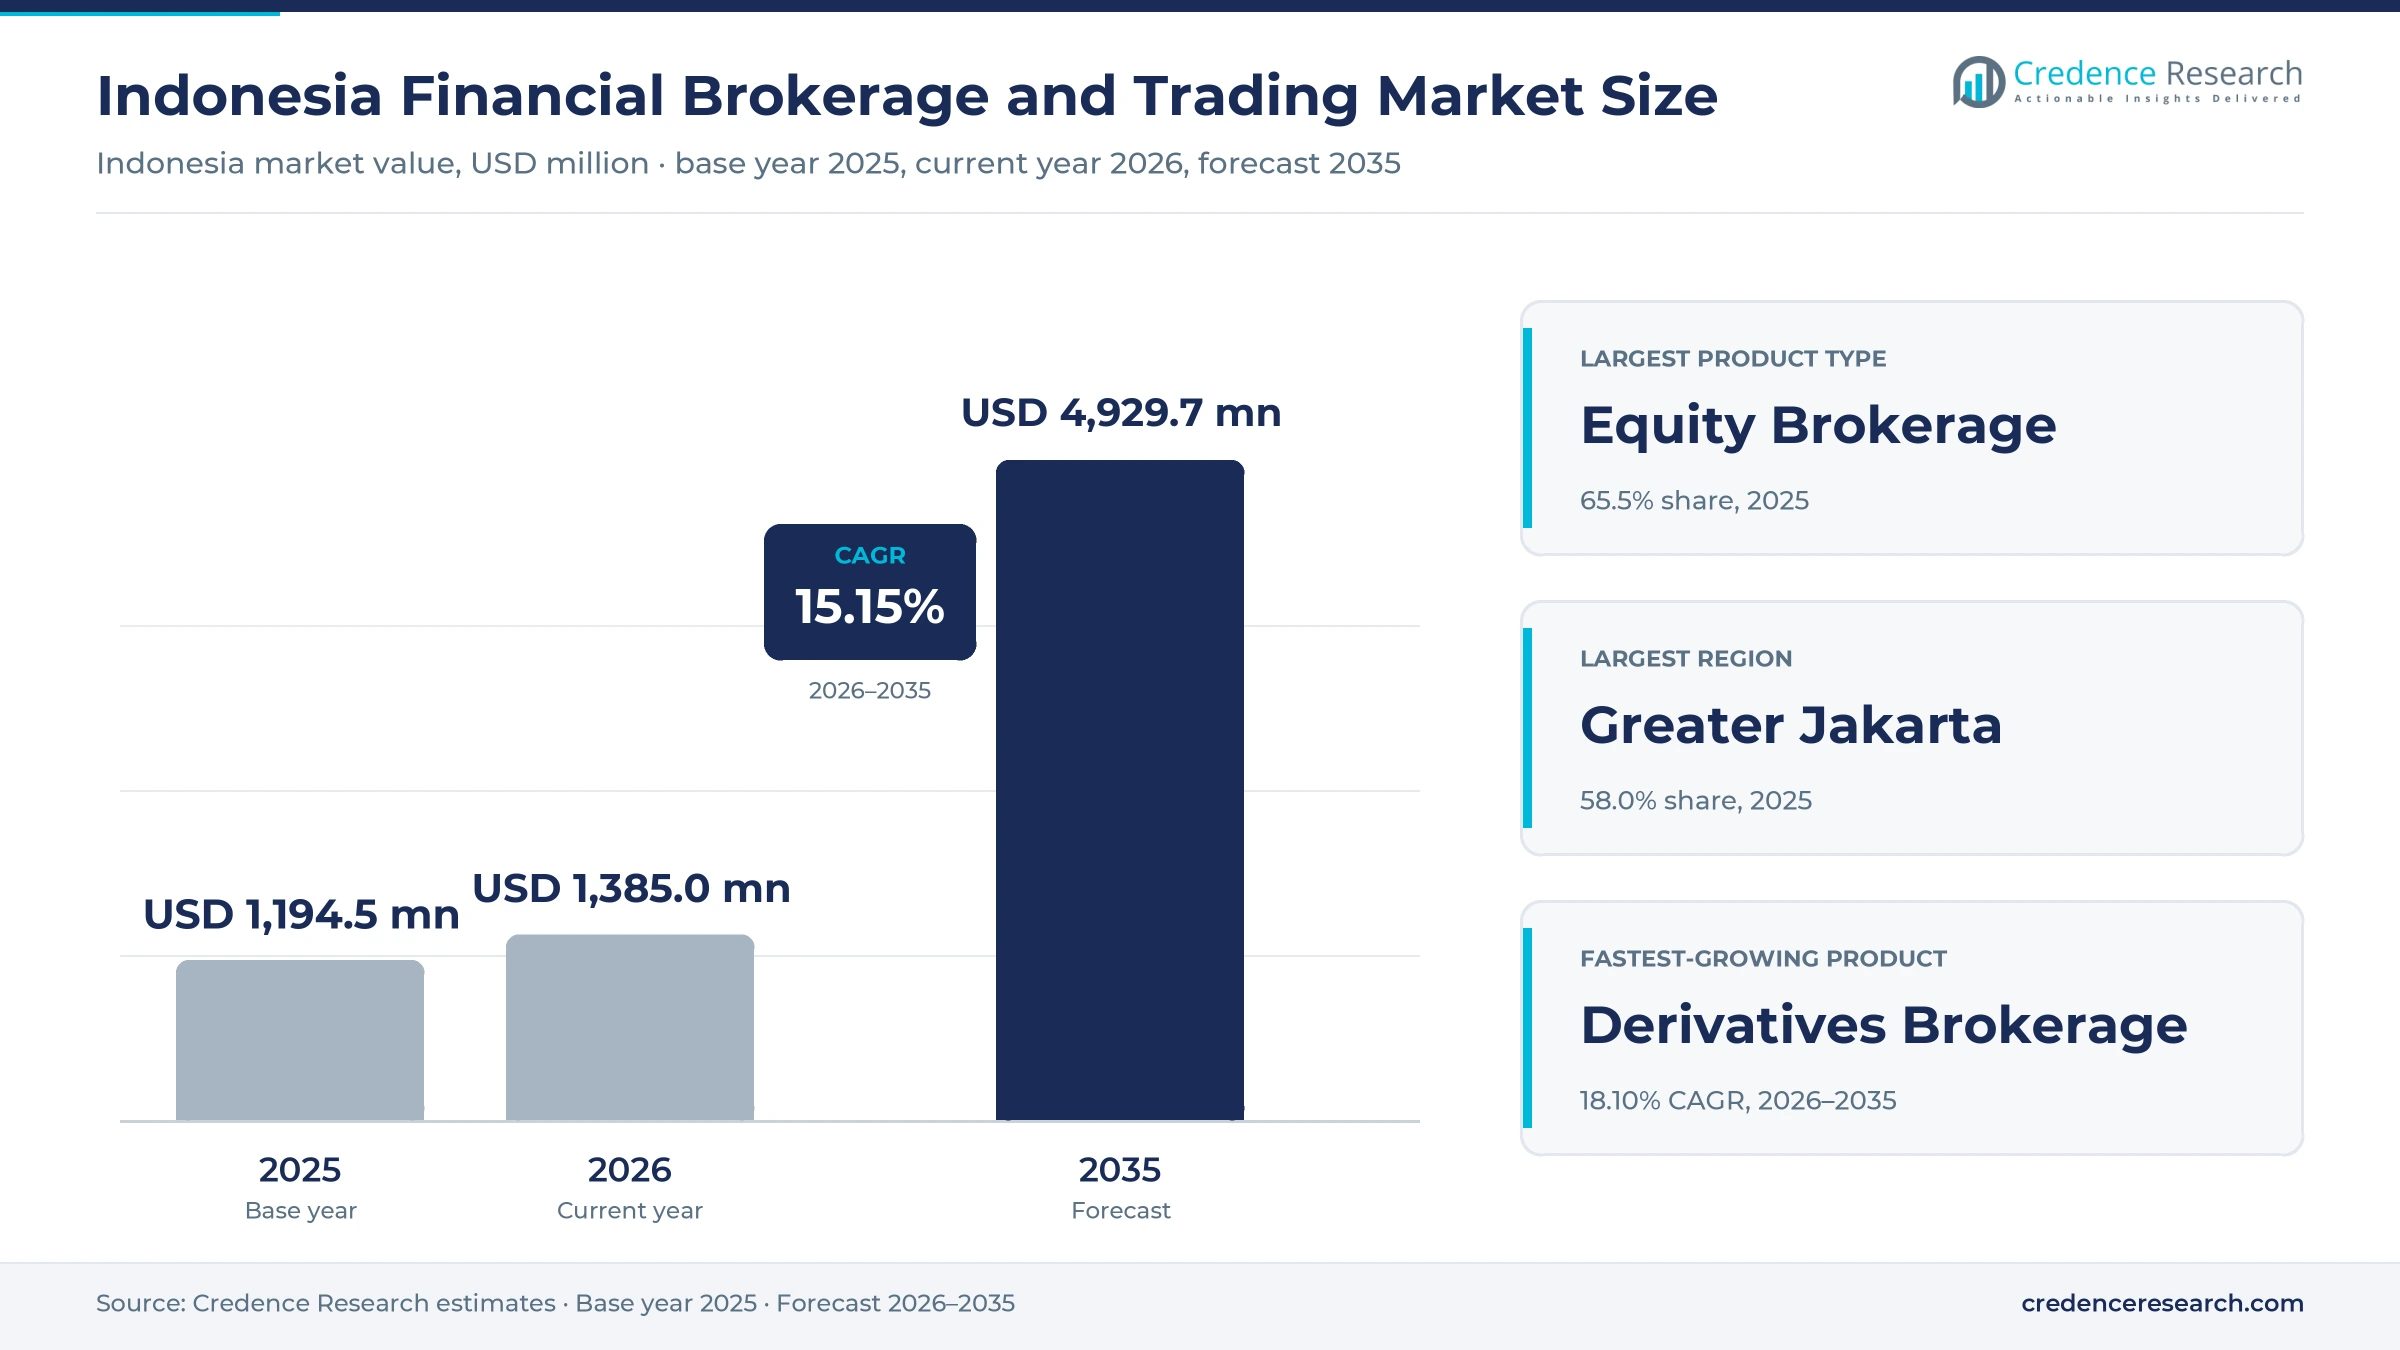
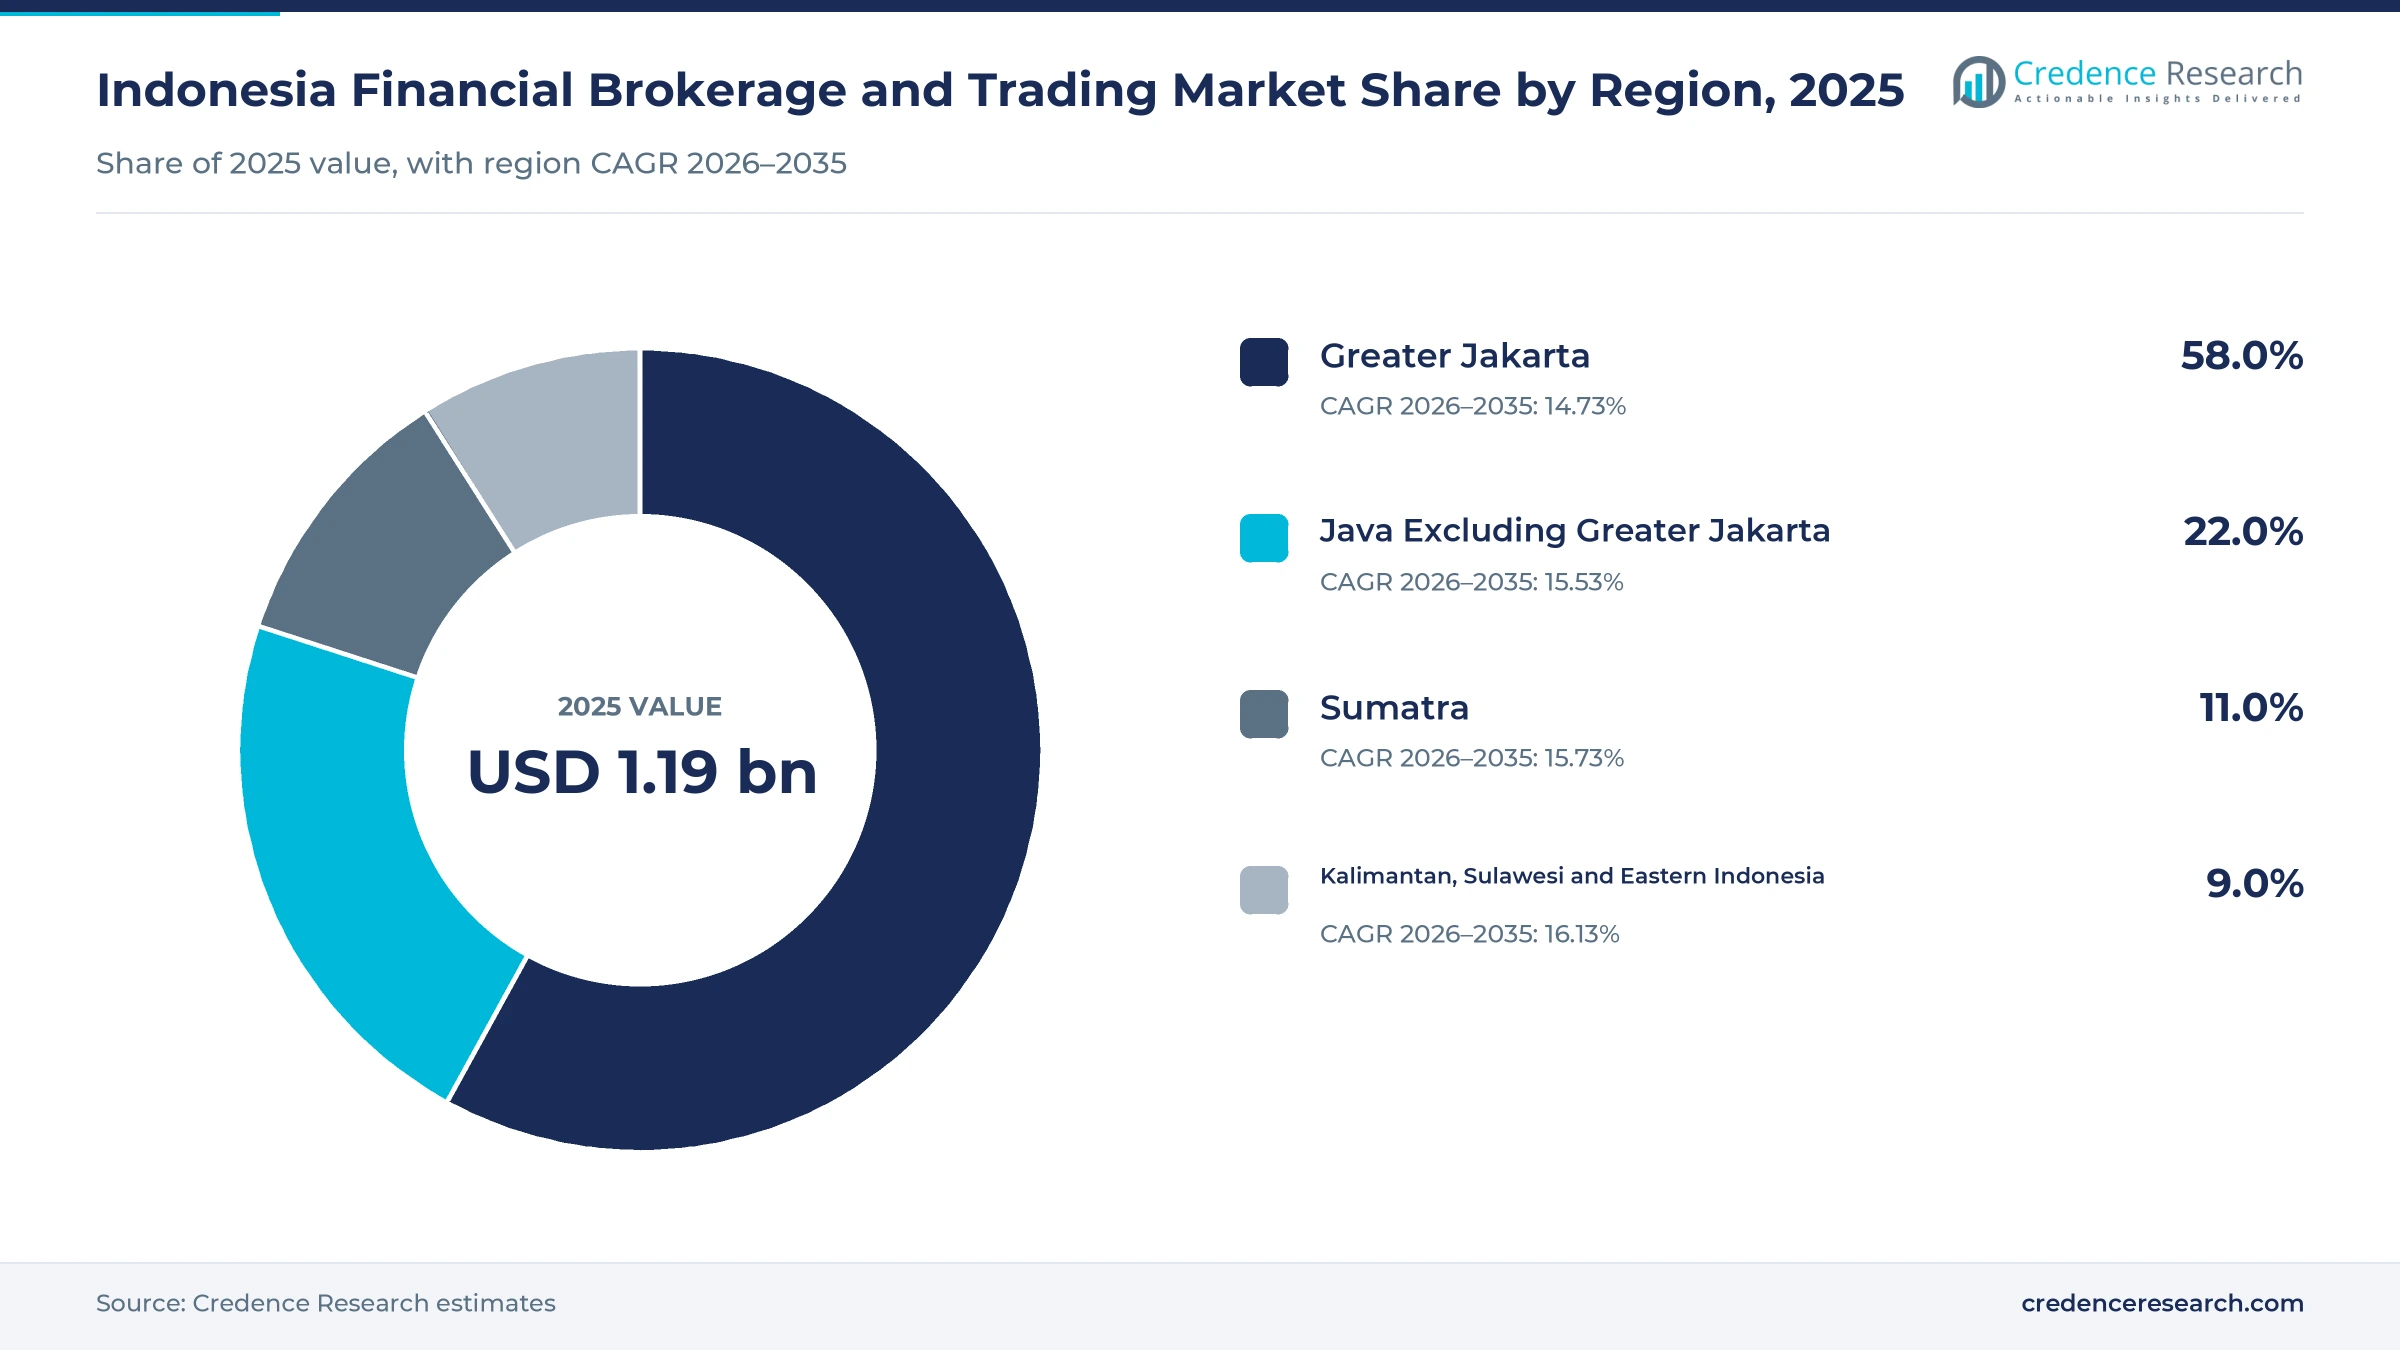
The Indonesia financial brokerage and trading market was valued at USD 1.19 billion in 2025 and is projected to increase from USD 1.39 billion in 2026 to USD 4.93 billion by 2035, registering a CAGR of 15.15% during 2026–2035. Demand comes from millions of first-time retail investors who buy shares, bonds and mutual funds on mobile apps, and from domestic and foreign institutions that route large orders through Jakarta securities houses. Greater Jakarta held the largest regional share, 58.0% in 2025, because head offices, fund managers, foreign desks and wealthy clients cluster in the capital. Kalimantan, Sulawesi and Eastern Indonesia is the fastest-growing region at 16.13% a year, as app-based account opening reaches mining and plantation towns far from branch networks. In turn, the Financial Services Authority took over supervision of financial derivatives and crypto assets in January 2025, which places most listed dealing under one regulator.
Which commissions, spreads and fees does the estimate count?
The estimate measures revenue earned by licensed securities companies and futures brokers in Indonesia from executing client orders in equities, bonds, listed derivatives, commodities and foreign exchange. It counts transaction commissions, execution and spread income, interest on margin financing, and platform, data and custody-related fees charged to retail, wealthy and institutional clients.
The estimate excludes investment banking advisory and underwriting fees, asset management fees, proprietary trading gains and the value of securities traded. The value chain runs from the exchange, clearing house and central depository through exchange members and futures brokers to sales teams, apps and order-routing links used by clients.
Indonesia Financial Brokerage and Trading Market Insights
- The Indonesia financial brokerage and trading market was valued at USD 1.19 billion in 2025 and is projected to reach USD 4.93 billion by 2035, registering a CAGR of 15.15% during 2026–2035.
- Greater Jakarta held a 58.0% share of 2025 value, because head offices, foreign institutional desks and wealthy clients cluster in the capital.
- Equity brokerage led with a 65.5% share of 2025 value, because share dealing on the Indonesia Stock Exchange generates most commission income.
- Capital market investors reached 20,129,679 on Dec. 19, 2025, up 35% from 14,871,659 at the end of 2024, according to the central securities depository.
- Short selling trading opened on Oct. 1, 2026, with five eligible stocks and two licensed securities firms, which adds a new margin and lending product.
Equity broking leads while derivatives grow the fastest
Why does equity brokerage hold most of the revenue?
Based on product type, the market is categorized into equity brokerage, fixed income brokerage, derivatives brokerage and commodity and FX brokerage. Equity Brokerage led with a 65.5% share of 2025 value, because share dealing on the exchange produces most commission income for securities firms. Derivatives Brokerage grows fastest at 18.10% a year, as single stock futures, index futures and new short selling rules bring hedging tools to more clients.
How fast are retail investors adding to revenue?
Based on customer segment, the market is categorized into retail investors, high-net-worth individuals, domestic institutions and foreign institutions. Retail Investors led with a 38.0% share of 2025 value, because millions of small accounts trade often on apps. Retail Investors also grow fastest at 16.01% a year, while foreign institutions stay important for large block orders.
Which channels win the most new orders?
Based on distribution channel, the market is categorized into mobile trading applications, web trading platforms, dealer-assisted channels and API and direct market access. Mobile Trading Applications led with a 44.0% share of 2025 value, because most new investors open accounts and place orders on phones. Mobile Trading Applications grow fastest at 16.07% a year, as apps add research, margin and bond features in one place.
How quickly is margin financing income rising?
Based on revenue model, the market is categorized into transaction commissions, execution and spread income, margin financing income and platform and ancillary fees. Transaction Commissions led with a 54.5% share of 2025 value, because most firms still charge a fee on each trade. Platform and Ancillary Fees grow fastest at 15.92% a year, as firms add subscriptions, data packages and custody services to lower-fee plans.
| Segment Group | Leading Sub-segment | Share, 2025 | Fastest-growing Sub-segment | CAGR, 2026–2035 |
|---|---|---|---|---|
| By Product Type | Equity Brokerage | 65.5% | Derivatives Brokerage | 18.10% |
| By Customer Segment | Retail Investors | 38.0% | Retail Investors | 16.01% |
| By Distribution Channel | Mobile Trading Applications | 44.0% | Mobile Trading Applications | 16.07% |
| By Revenue Model | Transaction Commissions | 54.5% | Platform and Ancillary Fees | 15.92% |
Request a Free Sample
Fill in your details and we'll send you a free sample report.
- Sample data tables & charts
- Research methodology
New investors, deeper liquidity and literacy lift volumes
How is a fast-growing investor base lifting order flow?
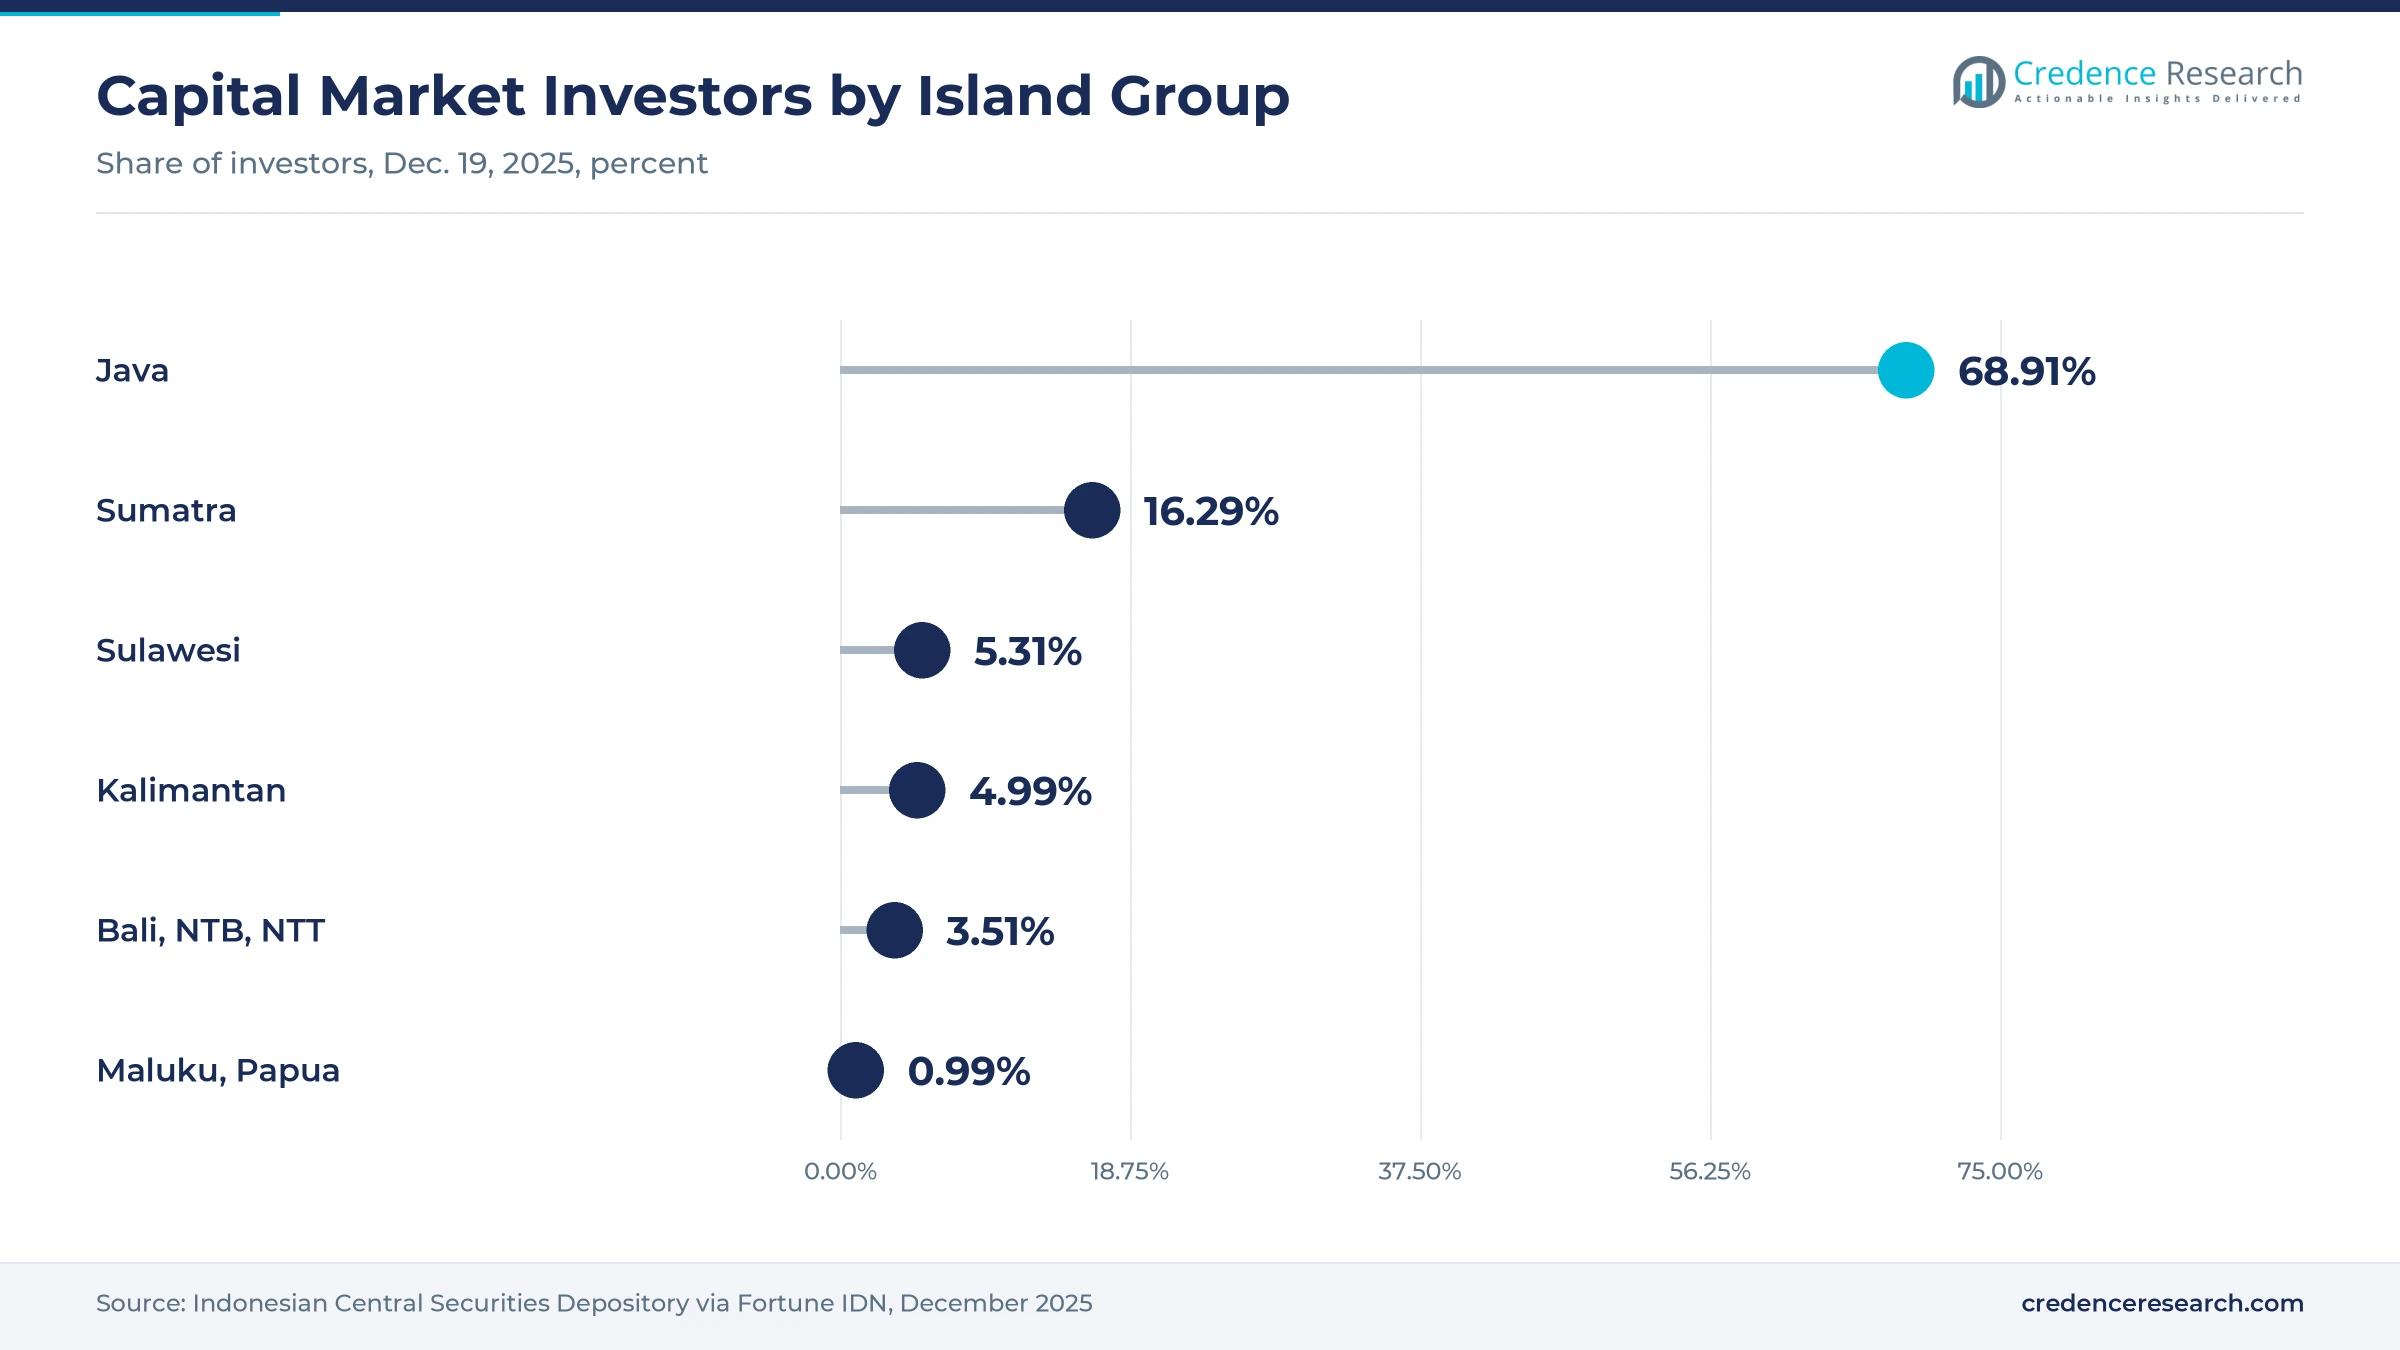
A fast-growing domestic investor base lifts order flow, because every new account adds trades, deposits and margin demand for securities firms. Capital market investors reached 20,129,679 on Dec. 19, 2025, up 35% from 14,871,659 at the end of 2024, according to Fortune IDN citing the central securities depository. Java accounted for 68.91% of these investors, while Sumatra held 16.29%, which shows how far account growth has spread beyond the capital. The exchange later reported 20.3 million investors for 2025, a 37% rise on the previous year. As a result, retail investors hold 38.0% of 2025 value and grow at 16.01% a year.
Why do higher exchange liquidity and depth raise revenue?
Higher exchange liquidity raises broking revenue, because commissions and spreads scale with the value that clients trade each session. Average daily equity transaction value reached IDR 18.07 trillion in 2025, up 40.6% from the year before, according to Databoks citing the exchange. Market capitalization set a record of IDR 16,004 trillion on Dec. 8, 2025, as the composite index posted 24 all-time highs during the year. Twenty-six companies listed in 2025 and raised IDR 18.1 trillion, which gave brokers new shares to distribute and trade. In turn, equity brokerage holds 65.5% of 2025 value across the country.
How does better financial literacy widen the client pool?
Better financial literacy widens the client pool, because people who understand risk and returns are more willing to open securities accounts. The national literacy index rose to 66.46% in 2025 from 65.43% in 2024, and the inclusion index climbed to 80.51% from 75.02%, according to the Financial Services Authority. The authority and Statistics Indonesia released these survey results on May 2, 2025. However, Java still holds 94.42% of investor assets, while Sumatra holds only 2.04%, which leaves wide room for growth elsewhere. As a result, Sumatra, with 11.0% of 2025 value, has wide room to deepen client holdings.
Why do steady growth and market reforms support dealing?
Steady economic growth and market reforms support dealing activity, because rising incomes and deeper bond markets give clients more to invest and trade. The International Monetary Fund said in January 2026 that growth reached 5.0% in 2025 and projected 5.1% for 2026. Its directors also endorsed a gradual cut in the central bank role in the government debt market to raise private participation and liquidity. Separately, supervision of financial derivatives and crypto assets moved from the trade ministry agency to the Financial Services Authority on Jan. 10, 2025. In turn, fixed income brokerage gains more secondary trading, while derivatives grow at 18.10% a year.
Futures, short selling and app brokers reshape the trade
How is the rise of listed futures changing product mix?
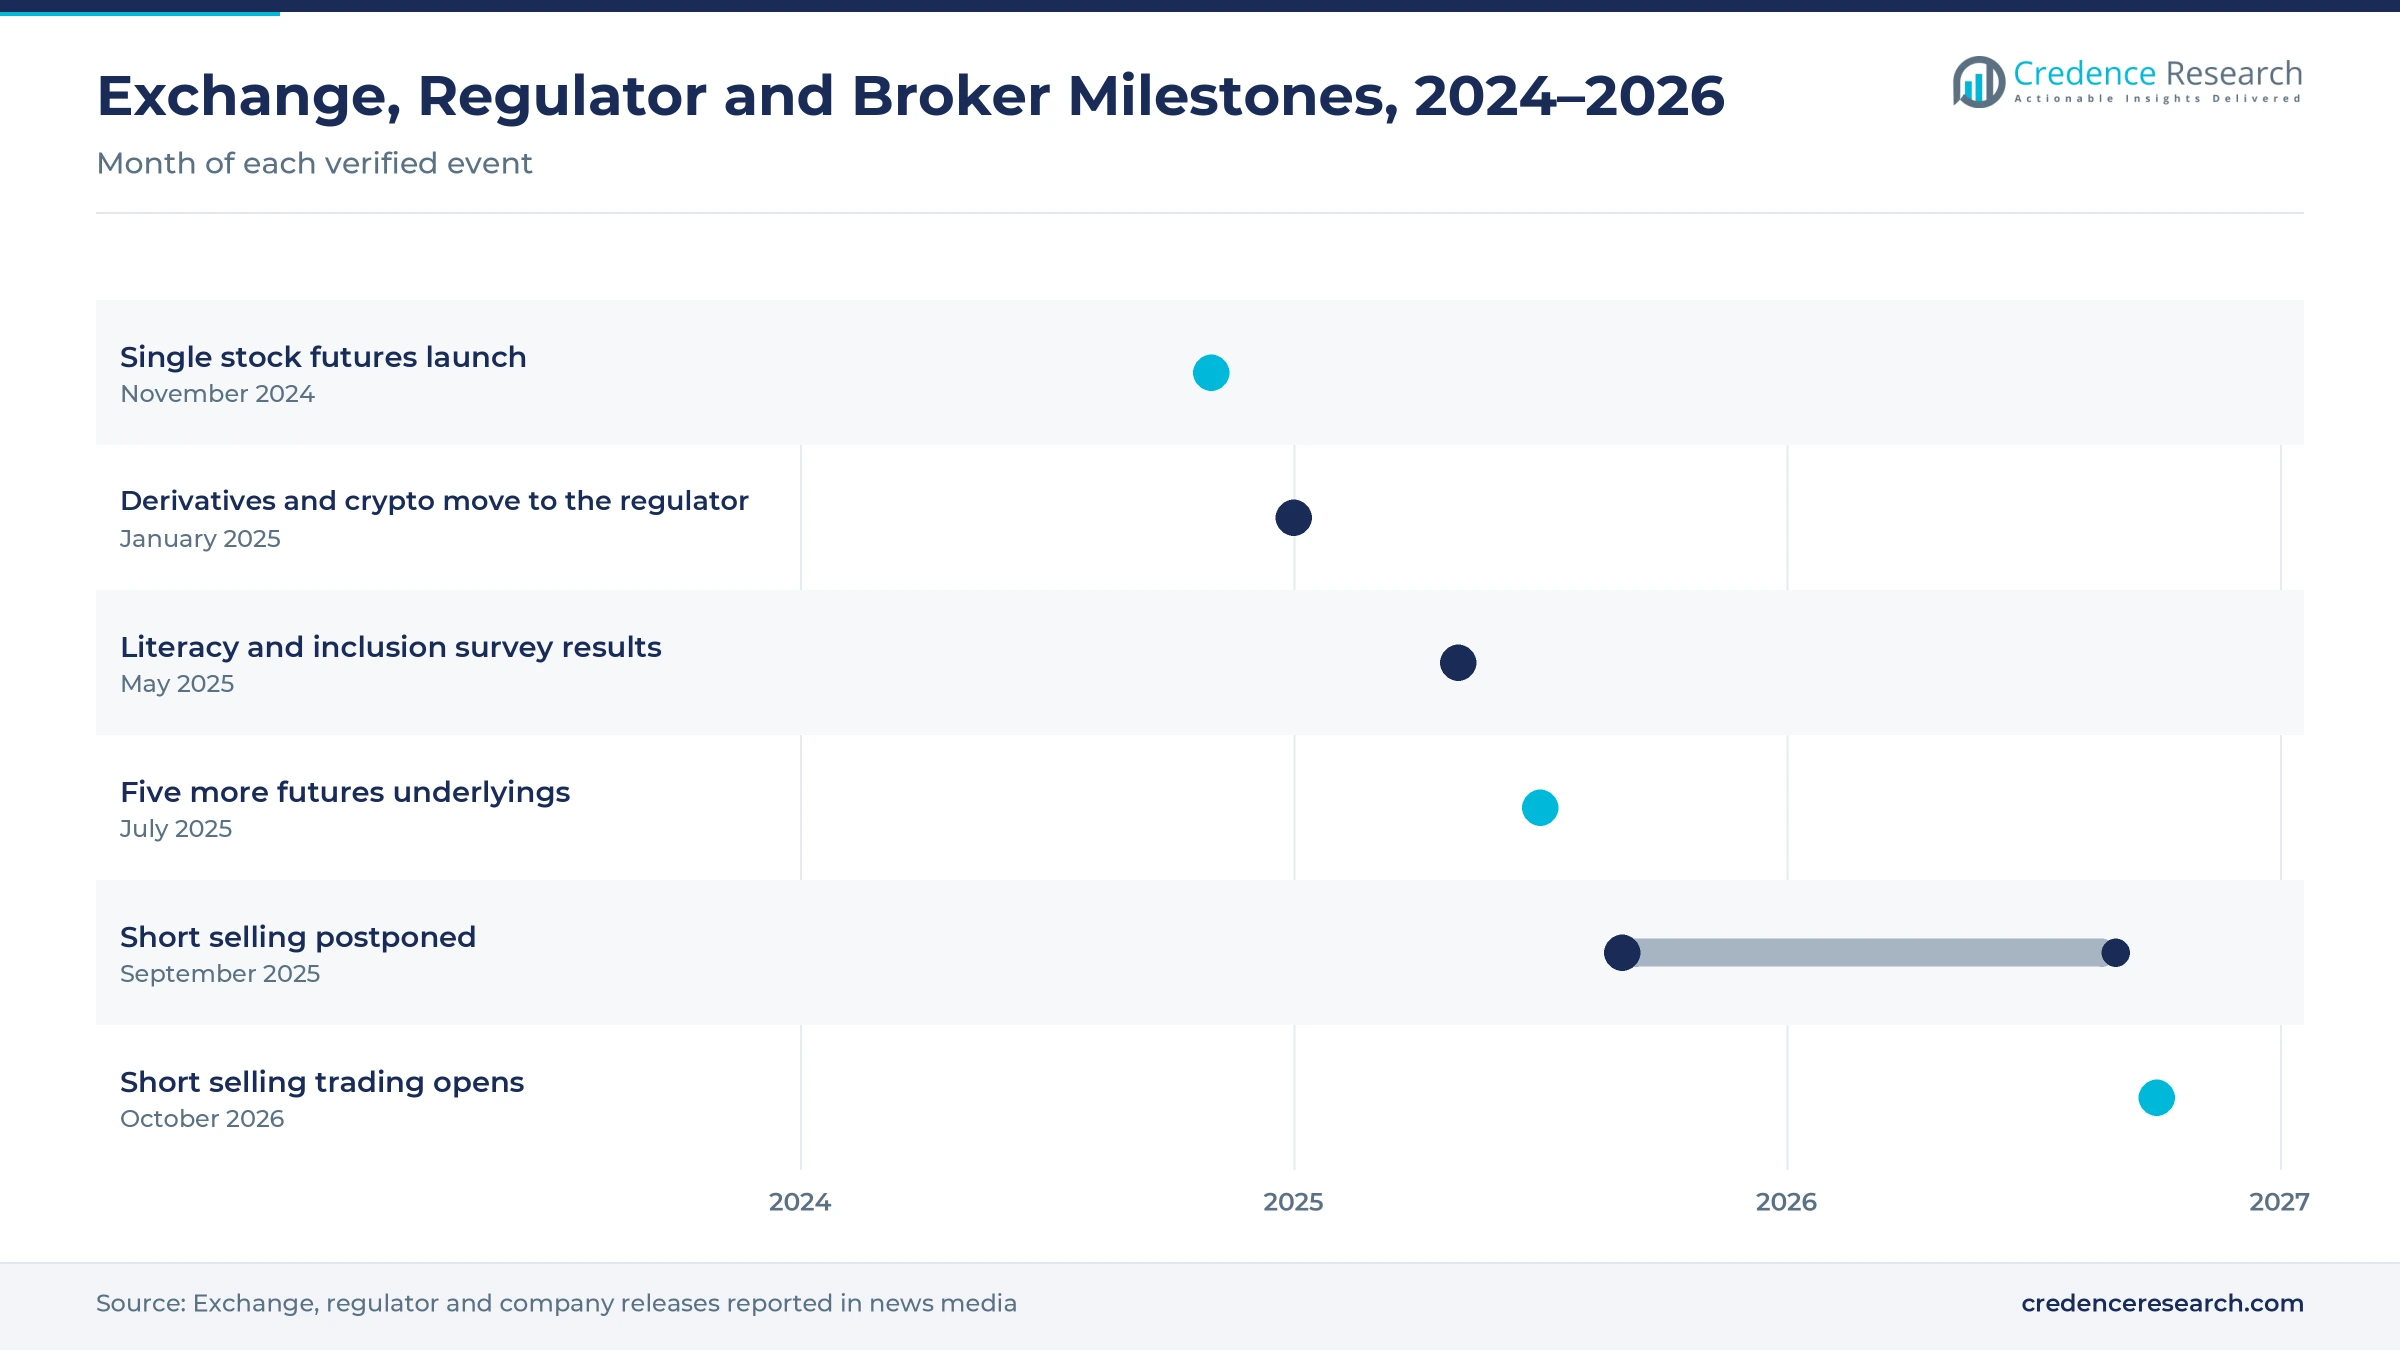
The rise of listed futures is changing the product mix, because securities firms can now offer hedging and leverage on single stocks inside regulated accounts. The exchange launched single stock futures on Nov. 12, 2024, and added five more underlying stocks on July 14, 2025, which raised the total to 10. The number of derivative investors rose 142% through June 2025 compared with a year earlier, while 2,175 single stock futures contracts traded in the period. These volumes remain small, so the product has room to grow as more members join. As a result, derivatives brokerage grows faster than any other product type in the forecast.
Why is the arrival of short selling significant for brokers?
The arrival of short selling is significant for brokers, because it adds stock lending, margin financing and two-way strategies to their offer. The exchange postponed short selling in September 2025 and again in March 2026, citing infrastructure readiness and risk management. A phased rollout began on Sept. 15, 2026, and trading opened on Oct. 1, 2026, with five eligible stocks. Only two firms, Semesta Indovest Sekuritas and Ajaib Sekuritas, held licenses at launch, which gives early movers a head start. Twenty-seven exchange members had earlier expressed interest in the product, and nine were preparing license applications. In turn, margin financing income grows at 15.92% a year as more firms qualify.
Can app-first brokers win more of the retail order book?
App-first brokers can win more of the retail order book, because younger investors choose low fees, simple screens and social features over branch visits. Stockbit Sekuritas Digital handled IDR 114.24 trillion of equity transactions in the first half of 2025, a 3.9% share, according to IDNFinancials. Total equity transaction value reached IDR 1,449 trillion in that half, so even a small share shift moves large sums. Mandiri Sekuritas ranked second with a 9.7% share, ahead of Maybank Sekuritas Indonesia at 7.7%. UBS Sekuritas Indonesia led with a 9.99% share, which shows that foreign desks still dominate large orders. As a result, mobile trading applications hold 44.0% of 2025 value and keep gaining.
Is unified supervision an opening for multi-asset accounts?
Unified supervision offers an opening for multi-asset accounts, because one regulator now oversees shares, listed derivatives and crypto assets. The handover from the trade ministry agency on Jan. 10, 2025, moved exchange-traded derivatives on stock indexes and foreign single stocks to the Financial Services Authority. Derivatives on money market and foreign exchange instruments moved to Bank Indonesia at the same time. The transfer followed Government Regulation No. 49 of 2024 and the 2023 financial sector development law. This clarity lets securities firms and futures brokers plan combined apps, shared know-your-customer checks and one margin account. In turn, commodity and FX brokerage keeps a steady base while firms cross-sell new digital payments and investment features.
Volatility, fee pressure and fraud test securities firms
How does market volatility hit commission income?
Market volatility hits commission income, because retail clients trade less after sharp losses and margin calls. The composite index fell to a first-half 2025 low of 5,996 before recovering to record highs later in the year. As a result, firms that rely on retail commissions saw uneven monthly revenue. Brokers respond with diversified income from margin interest, bonds, subscriptions and wealth products that hold up better in weak markets.
Why does fee competition squeeze smaller securities firms?
Fee competition squeezes smaller securities firms, because app-first rivals offer very low commissions to win young investors. In turn, firms without scale struggle to fund technology, research and compliance teams. Smaller houses with branch-based models feel this pressure first, since their costs per trade are higher. Many respond by merging, partnering with banks, focusing on wealthy clients or selling white-label platforms to other members.
How do scams and illegal platforms damage trust?
Scams and illegal investment platforms damage trust, because victims often blame the whole industry after losing savings. However, unlicensed apps and social media groups still promise quick profits on stocks, futures and currencies. New investors outside big cities face the highest risk, since they have fewer ways to check licenses. Licensed firms respond with education campaigns, verified app listings and stronger customer identity checks.
Why do capital and system rules raise operating costs?
Capital and system rules raise operating costs, because firms must meet net capital, cybersecurity and reporting standards before offering margin, derivatives or short selling. As a result, only a few members qualified for short selling licenses at launch. Mid-sized firms face long preparation times and high technology spending. Many respond by buying cloud-based risk engines, sharing vendors and phasing new products in stages.
Greater Jakarta leads while eastern islands grow fastest
| Region | Value, 2025 (USD billion) | Share, 2025 | CAGR, 2026–2035 |
|---|---|---|---|
| Greater Jakarta | 0.69 | 58.0% | 14.73% |
| Java Excluding Greater Jakarta | 0.26 | 22.0% | 15.53% |
| Sumatra | 0.13 | 11.0% | 15.73% |
| Kalimantan, Sulawesi and Eastern Indonesia | 0.11 | 9.0% | 16.13% |
Why does Greater Jakarta hold the largest share?
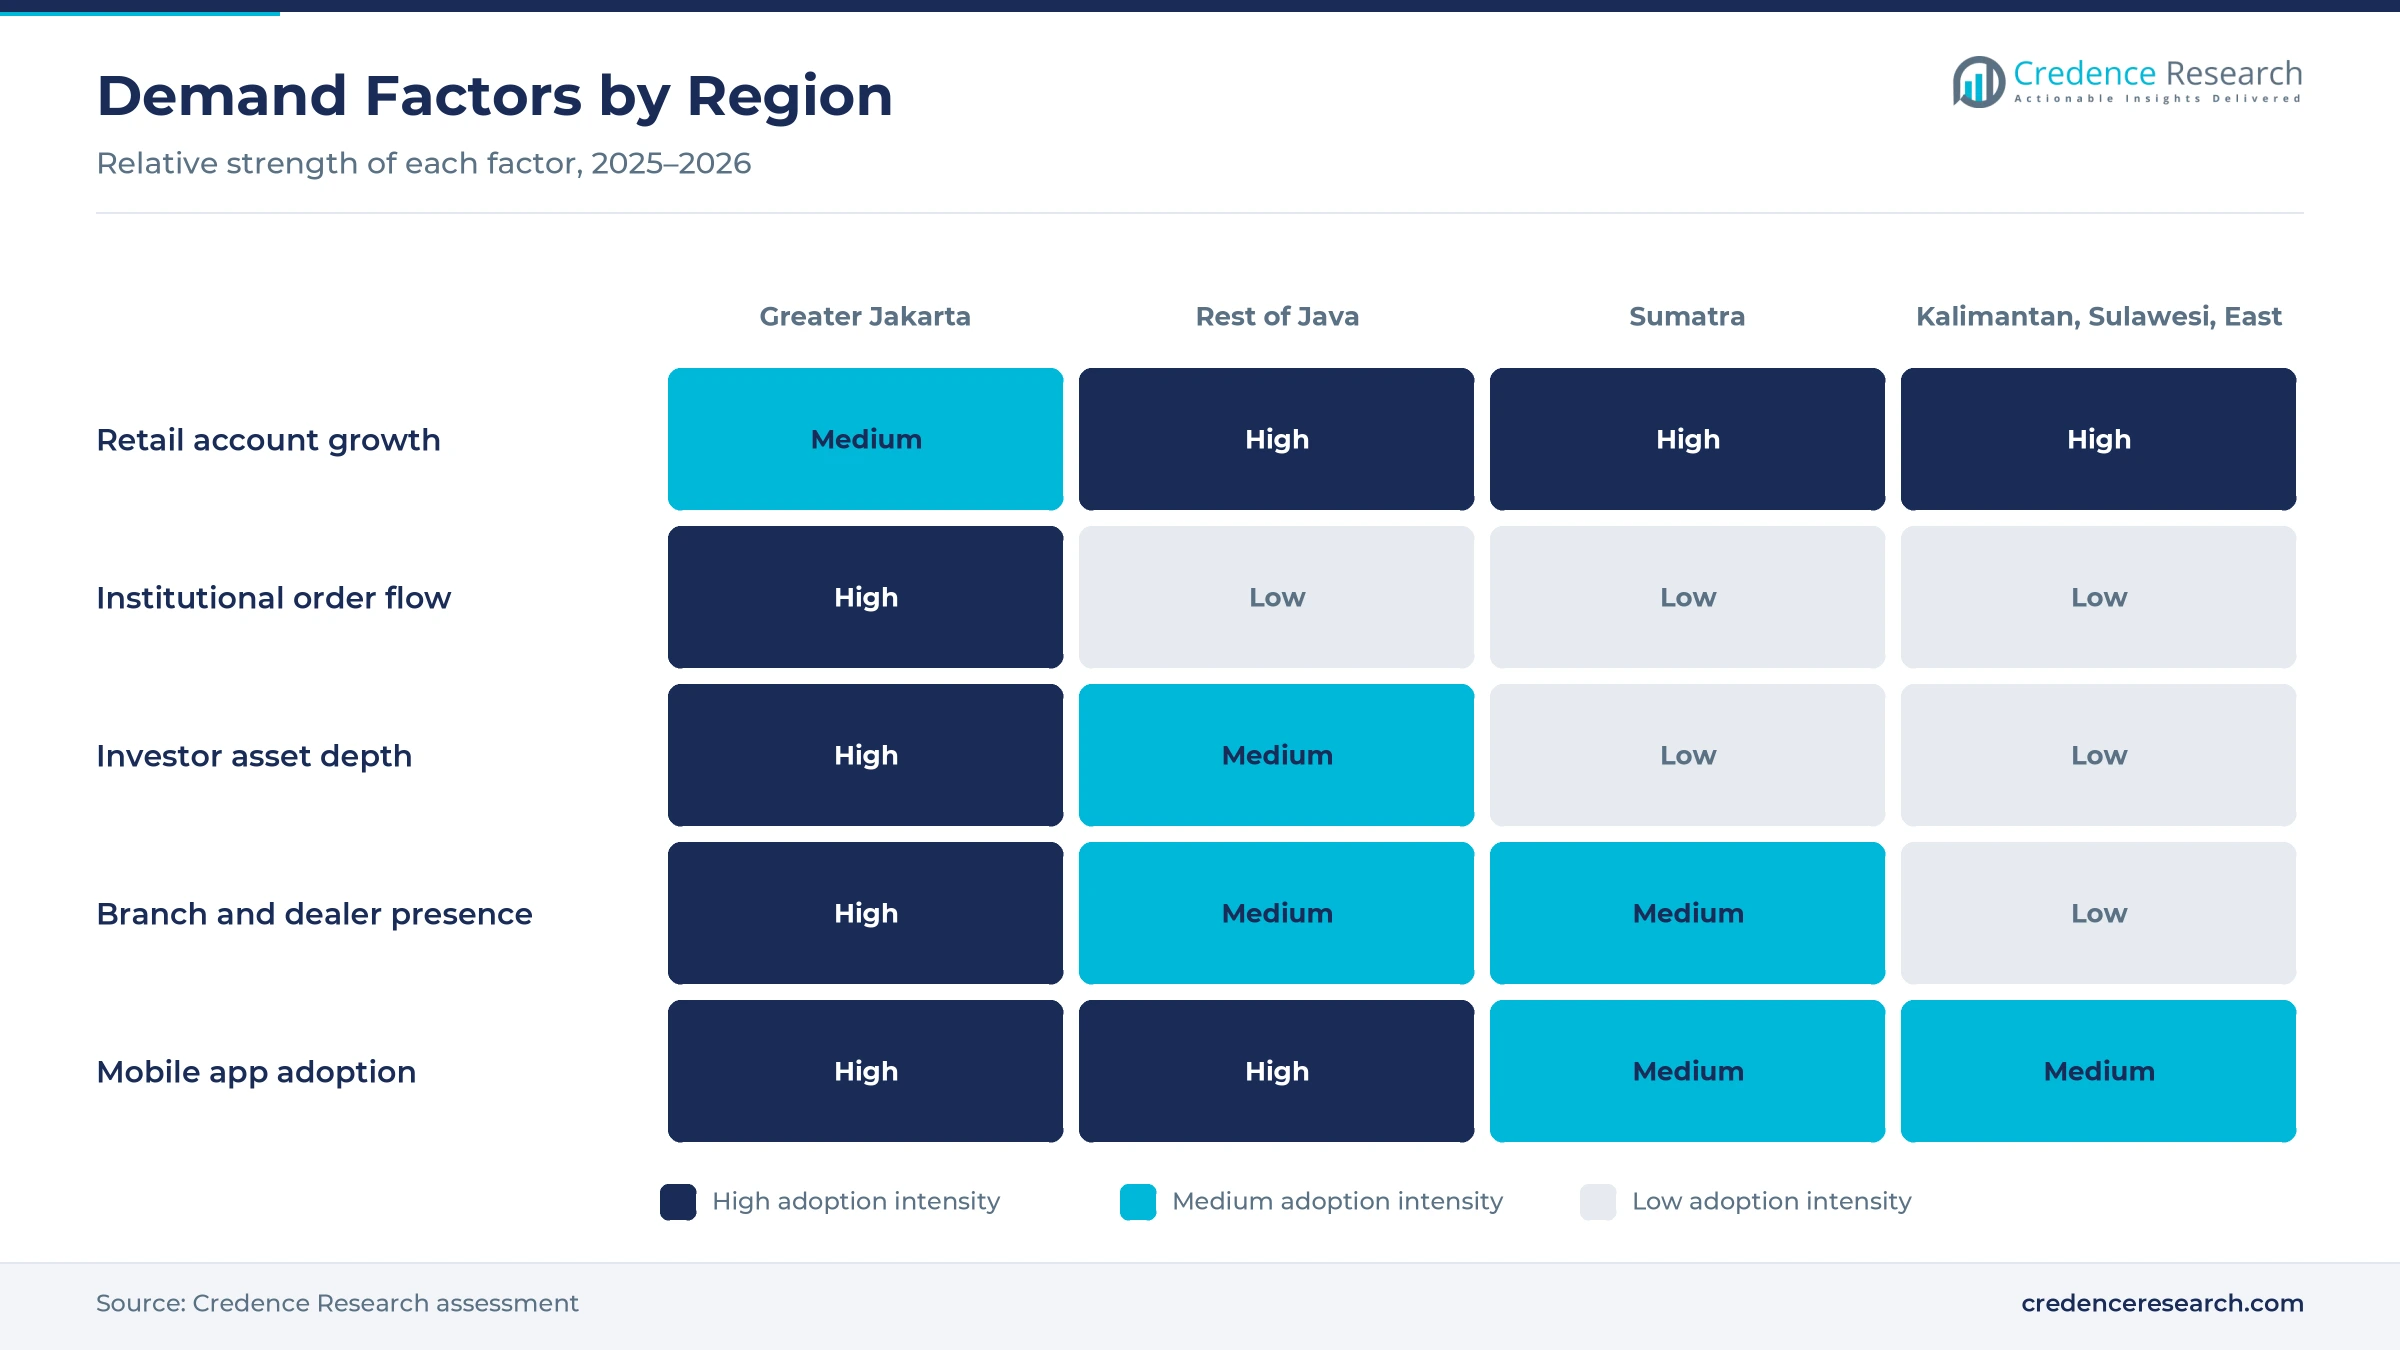
Greater Jakarta held a 58.0% share of 2025 value and grows at 14.73% a year, because head offices, foreign institutional desks, pension funds and wealthy families cluster in the capital. The exchange, clearing house and central depository all operate from Jakarta. Foreign and bank-affiliated houses serve most block orders from their Jakarta dealing rooms. As a result, institutional commissions and margin books remain concentrated in the metro area, even as retail accounts spread.
How fast is the rest of Java adding accounts?
Java excluding Greater Jakarta held a 22.0% share of 2025 value and grows at 15.53% a year, because Surabaya, Bandung, Semarang and Yogyakarta host large student and salaried populations. Java as a whole accounted for 68.91% of capital market investors in December 2025. Mobile apps let these clients open accounts and trade without visiting branches. In turn, the zone adds the most new retail accounts outside the capital.
Why does Sumatra matter for the next wave of investors?
Sumatra held 11.0% of 2025 value and grows at 15.73% a year, because Medan, Palembang, Pekanbaru and Padang have growing middle classes and plantation incomes. The island hosted 16.29% of investors in December 2025, yet only 2.04% of investor assets. This gap shows that accounts are numerous but still small. As a result, brokers target the island with education events and low-minimum products that suit mobile banking users.
How are eastern islands adding the fastest growth?
Kalimantan, Sulawesi and Eastern Indonesia held a 9.0% share of 2025 value and grows fastest at 16.13% a year, because mining, nickel processing and plantation towns create new savers. Sulawesi held 5.31% of investors and Kalimantan 4.99% in December 2025. Bali, the Nusa Tenggara provinces, Maluku and Papua together added another 4.50%. In turn, app-based account opening reaches clients far from branch networks.
Exchange, regulator and broker milestones since 2024
| Development | Status and market relevance |
|---|---|
| In November 2024, the Indonesia Stock Exchange launched single stock futures for exchange members and their clients. | Adds listed hedging products for brokers |
| In January 2025, the trade ministry agency handed supervision of financial derivatives and crypto assets to the Financial Services Authority and Bank Indonesia. | Brings most listed dealing under one regulator |
| In May 2025, the Financial Services Authority and Statistics Indonesia reported a literacy index of 66.46% and an inclusion index of 80.51%. | Signals a larger pool of potential clients |
| In July 2025, the exchange added five underlying stocks to single stock futures, raising the total to 10. | Widens derivative choice for clients |
| In October 2026, short selling trading opened with five eligible stocks and two licensed securities firms. | Opens stock lending and margin income |
Apps, order routing and risk engines modernize dealing
- Mobile trading apps combine account opening, research, payments and order entry, which lets new investors fund an account and place a first order within minutes of signing up.
- Smart order routing sends client orders to the exchange at low latency, which suits institutions, foreign desks and active retail traders who need fast fills.
- Real-time risk engines track margin, collateral and short positions across accounts, which protects firms and clients during sharp price moves and trading halts.
- Electronic identity checks verify clients with national ID data and face matching, which cuts fraud and speeds remote onboarding for clients outside Java.
Need a Custom Version of This Report?
Tailor the scope, geography, or segments to your exact requirements.
- Custom geography or segment scope
- Direct access to our analyst team
Foreign houses and bank units vie with app-first firms
Competition is led by foreign securities houses, bank-affiliated firms and fast-growing app-first brokers. UBS Sekuritas Indonesia, Mandiri Sekuritas and Maybank Sekuritas Indonesia ranked first to third by equity transaction value in the first half of 2025, followed by CGS International Sekuritas Indonesia, Mirae Asset Sekuritas Indonesia and several other foreign houses. Stockbit Sekuritas Digital and Indo Premier Sekuritas compete for retail clients with mobile apps, while Semesta Indovest Sekuritas and KB Valbury Sekuritas complete the top ten. Rivals compete on execution quality, research coverage, app design, commission levels and margin terms. As short selling and derivatives expand, firms with strong capital, risk systems and large client bases are best placed to automate order execution and gain share.
Which securities firms shape Indonesian dealing?
| Company | Type | Role in the market |
|---|---|---|
| UBS Sekuritas Indonesia | Foreign securities firm | Led equity transaction value with a 9.99% share in the first half of 2025 |
| Mandiri Sekuritas | Bank-affiliated securities firm | Ranked second by equity transaction value in the first half of 2025 |
| Maybank Sekuritas Indonesia | Foreign bank-affiliated firm | Ranked third by equity transaction value in the first half of 2025 |
| Stockbit Sekuritas Digital | Digital-first broker | Held a 3.9% share of equity transaction value in the first half of 2025 |
| Semesta Indovest Sekuritas | Domestic securities house | One of two firms licensed for short selling at the October 2026 launch |
Credence Research view on Indonesian securities dealing
Credence Research's view is that the Indonesian market will grow through more investors, deeper liquidity and a wider product shelf rather than through higher fees. Equity brokerage remains the largest revenue pool, while derivatives, margin financing and app-based retail accounts add the fastest growth. Short selling and single stock futures should lift income for firms with strong capital and risk systems. Bank-affiliated houses and app-first brokers should gain the most, while market swings and fee competition keep pressure on smaller firms.
How the national broking revenue estimate was built
The report uses 2025 as the base year on a calendar basis, and market values come from the Credence Research model. That model combines exchange transaction values, investor counts from the central depository, broker rankings, regulator survey results and macroeconomic data. Regional shares, segment splits and growth rates are Credence Research estimates. Sources used are regulator and exchange releases, IMF publications and company and market data reported in news media, and no interviews or surveys were used.
Retail depth, derivatives and margin lending carry growth
The Indonesia financial brokerage and trading market is expected to reach USD 4.93 billion by 2035, a 15.15% CAGR during 2026–2035, as new investors keep opening accounts and trading values rise. Growth should be strongest in derivatives brokerage, retail investors, mobile trading applications and the eastern islands, because these areas gain most from new products and app-based access. Short selling and unified supervision will favor well-capitalized firms, while volatility and fee competition could slow some smaller houses.
Frequently Asked Questions
How big is the Indonesia financial brokerage and trading market?
Which product type leads Indonesian broking revenue?
Which region leads the Indonesian market?
How many capital market investors does Indonesia have?
When did short selling start on the Indonesian exchange?
Which channel leads client orders in Indonesia?
Who are the leading securities firms in Indonesia?
What are the main challenges for Indonesian brokers?
Table of Content
Chapter 1 Market Segmentation
- 1.1 Segmentation Framework
- 1.1.1 Product and Service Classification
- 1.1.2 Application and End-Use Classification
- 1.1.3 Technology and Solution Classification
- 1.1.4 Customer and Distribution Channel Classification
- 1.1.5 Geographic Segmentation
- 1.1.6 Market Segment Definitions and Boundaries
- 1.2 By Product Type
- 1.2.1 Equity Brokerage
- 1.2.2 Fixed Income Brokerage
- 1.2.3 Derivatives Brokerage
- 1.2.4 Commodity and FX Brokerage
- 1.3 By Customer Segment
- 1.3.1 Retail Investors
- 1.3.2 High-Net-Worth Individuals
- 1.3.3 Domestic Institutions
- 1.3.4 Foreign Institutions
- 1.4 By Revenue Model
- 1.4.1 Transaction Commissions
- 1.4.2 Execution and Spread Income
- 1.4.3 Margin Financing Income
- 1.4.4 Platform and Ancillary Fees
Chapter 2 Introduction
- 2.1 Report Objectives and Scope
- 2.2 Product Definition and Industry Terminology
- 2.3 Market Inclusions and Exclusions
- 2.4 Research Process
- 2.4.1 Primary Research and Expert Interviews
- 2.4.2 Secondary Research and Source Review
- 2.4.3 Top-Down and Bottom-Up Estimation
- 2.4.4 Data Triangulation and Verification
- 2.5 Market Size Measurement Basis
- 2.5.1 2025: USD 1.19 billion → 2035: USD 4.93 billion
- 2.6 Historical and Forecast Reference Periods
- 2.6.1 Historical Period: 2018-2025
- 2.6.2 Base Year: 2025
- 2.6.3 Forecast Period: 2025-2035
- 2.7 Research Assumptions and Limitations
Chapter 3 Executive Summary
- 3.1 Market Snapshot and Key Findings
- 3.2 Base-Year Market Size, 2025
- 3.3 Forecast Market Size, 2035
- 3.4 Revenue and Volume Growth Outlook
- 3.5 Key Demand and Supply Indicators
- 3.6 Leading Market Segments
- 3.7 Fastest-Growing Market Opportunities
- 3.8 Regional Performance Highlights
- 3.9 Technology and Industry Transformation
- 3.10 Competitive Landscape Summary
- 3.11 Analyst View and Strategic Implications
Chapter 4 Indonesia Financial Brokerage and Trading Market Trends and Developments
- 4.1 Historical Industry Development, 2018-2025
- 4.2 Recent Market Trends and Developments
- 4.3 Demand and Customer Behavior Trends
- 4.4 Technology and Product Innovation
- 4.5 Artificial Intelligence, Automation and Digitalization
- 4.6 Local Manufacturing and Supply Chain Realignment
- 4.7 Industry Partnerships, Mergers and Acquisitions
- 4.8 Sustainability and Circular Economy Developments
- 4.9 Government and Private Sector Investment Trends
- 4.10 Emerging Business Models and Commercialization
- 4.11 Industry Developments and Announcements
Chapter 5 Indonesia Financial Brokerage and Trading Market Supply and Demand Analysis
- 5.1 Demand Trend and Consumption Analysis, 2018-2025
- 5.2 Demand Forecast, 2025-2035
- 5.3 Supply Chain Structure and Procurement Trends
- 5.4 Supply-Demand Gap and Bottlenecks
- 5.5 Import Dependence and Sourcing Structure
- 5.6 Regional Supply and Demand Concentration
Chapter 6 Indonesia Financial Brokerage and Trading Market Pricing Analysis
- 6.1 Pricing Structure and Measurement
- 6.2 Historical Pricing Trends, 2018-2025
- 6.3 Pricing Outlook, 2025-2035
- 6.4 Pricing by Product and Market Segment
- 6.5 Geographic Pricing Differences
- 6.6 Key Input, Energy, Labor and Logistics Costs
- 6.7 Contract Pricing and Purchasing Models
- 6.8 Pricing Sensitivity and Competitive Positioning
- 6.9 Price, Margin and Profitability Implications
Chapter 7 Indonesia Financial Brokerage and Trading Market Dynamics
- 7.1 Market Growth Drivers
- 7.1.1 Demand-Side Drivers
- 7.1.2 Technology and Innovation Drivers
- 7.1.3 Infrastructure and Investment Drivers
- 7.1.4 Regulatory and Policy Drivers
- 7.2 Market Restraints
- 7.2.1 Cost and Affordability Constraints
- 7.2.2 Technology and Adoption Barriers
- 7.2.3 Supply Chain and Operational Constraints
- 7.3 Market Challenges
- 7.3.1 Competitive Pressure and Margin Erosion
- 7.3.2 Skills, Infrastructure and Implementation Gaps
- 7.4 Emerging Market Opportunities
- 7.5 Market Dynamics Impact and Time-Horizon Assessment
Chapter 8 Indonesia Financial Brokerage and Trading Value Chain Analysis
- 8.1 Industry Value Chain Overview
- 8.2 Upstream Suppliers and Critical Inputs
- 8.3 Technology and Component Providers
- 8.4 Manufacturing or Service Delivery
- 8.5 Distribution, Channel Partners and Integrators
- 8.6 Downstream Applications and End Users
- 8.7 Value Addition and Profit Pools
- 8.8 Vertical Integration and Outsourcing
- 8.9 Supplier Concentration and Risk
- 8.10 Supply Chain Localization and Resilience
Chapter 9 Indonesia Financial Brokerage and Trading Market Regulations and Policies
- 9.1 Relevant Laws, Standards and Compliance Frameworks
- 9.2 Product, Service, Safety and Quality Requirements
- 9.3 Government Policies, Incentives and Subsidies
- 9.4 Imports, Exports and Trade Barriers
- 9.5 Public Procurement and Local Content Requirements
- 9.6 Data Protection, AI and Cybersecurity Compliance
- 9.7 Upcoming Policy Changes and Market Implications
Chapter 10 Indonesia Financial Brokerage and Trading Market Hotspots and Opportunities
- 10.1 Market Opportunity Mapping and Growth Hotspots
- 10.2 High-Growth Applications and Customer Groups
- 10.3 Underserved Markets and White-Space Opportunities
- 10.4 Emerging Technology and Product Opportunities
- 10.5 New Capacity and Investment Hotspots
- 10.6 Market Entry and Expansion Opportunities
- 10.7 Distribution and Partnership Opportunities
- 10.8 Near-Term and Long-Term Commercial Potential
- 10.9 Opportunity Attractiveness and Execution Risks
Chapter 11 Indonesia Financial Brokerage and Trading Market Outlook, 2025-2035
- 11.1 Market Size and Analysis
- 11.1.1 Revenue (Market Measurement: 2025: USD 1.19 billion → 2035: USD 4.93 billion)
- 11.1.2 Historical Market Size, 2018-2025
- 11.1.3 Base-Year Market Size, 2025
- 11.2 Market Forecast, 2025-2035
- 11.2.1 Revenue Forecast to 2035
- 11.2.2 CAGR and Year-on-Year Growth
- 11.2.3 Incremental Revenue Opportunity
- 11.3 Forecast Assumptions and Scenario Analysis
- 11.3.1 Base-Case Forecast
- 11.3.2 Optimistic and Conservative Scenarios
- 11.3.3 Technology, Pricing and Policy Sensitivities
- 11.4 Market Attractiveness and Growth Outlook
Chapter 12 Indonesia Financial Brokerage and Trading Market Segmentation and Outlook
- 12.1 Segmentation Summary and Market Shares, 2025
- 12.2 Largest and Fastest-Growing Segments
- 12.3 By Product Type - Market Size and Forecast, 2025-2035
- 12.3.1 Segment Definition and Scope
- 12.3.2 Historical Market Size, 2018-2025
- 12.3.3 Revenue Forecast, 2025-2035
- 12.3.4 Base-Year Market Share, 2025
- 12.3.5 Segment CAGR and Growth Drivers
- 12.3.6 Subsegment Market Size and Forecast
- 12.3.6.1 Equity Brokerage
- 12.3.6.2 Fixed Income Brokerage
- 12.3.6.3 Derivatives Brokerage
- 12.3.6.4 Commodity and FX Brokerage
- 12.3.7 Subsegment Pricing and Adoption Trends
- 12.3.8 Leading Suppliers and Competition
- 12.3.9 Regional Demand and Opportunities
- 12.4 By Customer Segment - Market Size and Forecast, 2025-2035
- 12.4.1 Segment Definition and Scope
- 12.4.2 Historical Market Size, 2018-2025
- 12.4.3 Revenue Forecast, 2025-2035
- 12.4.4 Base-Year Market Share, 2025
- 12.4.5 Segment CAGR and Growth Drivers
- 12.4.6 Subsegment Market Size and Forecast
- 12.4.6.1 Retail Investors
- 12.4.6.2 High-Net-Worth Individuals
- 12.4.6.3 Domestic Institutions
- 12.4.6.4 Foreign Institutions
- 12.4.7 Subsegment Pricing and Adoption Trends
- 12.4.8 Leading Suppliers and Competition
- 12.4.9 Regional Demand and Opportunities
- 12.5 By Revenue Model - Market Size and Forecast, 2025-2035
- 12.5.1 Segment Definition and Scope
- 12.5.2 Historical Market Size, 2018-2025
- 12.5.3 Revenue Forecast, 2025-2035
- 12.5.4 Base-Year Market Share, 2025
- 12.5.5 Segment CAGR and Growth Drivers
- 12.5.6 Subsegment Market Size and Forecast
- 12.5.6.1 Transaction Commissions
- 12.5.6.2 Execution and Spread Income
- 12.5.6.3 Margin Financing Income
- 12.5.6.4 Platform and Ancillary Fees
- 12.5.7 Subsegment Pricing and Adoption Trends
- 12.5.8 Leading Suppliers and Competition
- 12.5.9 Regional Demand and Opportunities
- 12.6 Segment Growth Comparison
- 12.7 Segment Attractiveness and Priority Matrix
Chapter 13 Indonesia Financial Brokerage and Trading End-Use and Application Market Outlook
- 13.1 End-Use Industry and Customer Demand Structure
- 13.2 Leading Applications and Customer Groups
- 13.3 End-Use Market Size, Share and Forecast
- 13.4 Major End-Use Industry Deep Dives
- 13.4.1 Customer Requirements and Use Cases
- 13.4.2 Demand and Replacement Cycles
- 13.4.3 Technical and Regulatory Considerations
- 13.4.4 Purchasing and Procurement Models
- 13.4.5 Leading Vendors and Distribution Channels
- 13.4.6 Forecast and Commercial Opportunities
- 13.5 Emerging Applications and Cross-Segment Demand
- 13.6 End-Use Industry Investment Priorities
Chapter 14 Indonesia Financial Brokerage and Trading Geographic Market Outlook, 2025-2035
- 14.1 Domestic Market Distribution and Demand Clusters
- 14.2 State- or Province-Wise Market Size and Forecast, 2025-2035
- 14.3 City and Metropolitan Market Outlook
- 14.4 Industrial, Manufacturing and Commercial Clusters
- 14.5 Geographic Concentration of Key End Users
- 14.6 Local Pricing and Purchasing Differences
- 14.7 Domestic Production Facilities and Capacity Map
- 14.8 Local Infrastructure and Project Pipeline
- 14.9 State-Level Policy and Incentive Differences
- 14.10 Subnational Investment Hotspots and Opportunities
- 14.11 Distribution and Logistics Networks
- 14.12 Domestic Competitive Footprint
Chapter 15 Indonesia Financial Brokerage and Trading Technology, Innovation and Sustainability Outlook
- 15.1 Technology Landscape and Maturity
- 15.2 Product, Process and Service Innovation
- 15.3 AI, Automation and Digital Tools in the Industry
- 15.4 Technology Adoption and Performance Benchmarking
- 15.5 Innovation Pipeline and R&D Investment
- 15.6 Energy Efficiency and Resource Management
- 15.7 Sustainability, Recycling and Circularity
- 15.8 Technology Roadmap, 2025-2035
- 15.9 Risks of Obsolescence and Technology Substitution
Chapter 16 Indonesia Financial Brokerage and Trading Market Key Strategic Imperatives
- 16.1 Growth and Market Entry Priorities
- 16.2 High-Return Products and Segments
- 16.3 Pricing, Profitability and Cost Optimization
- 16.4 Technology Investment and Product Differentiation
- 16.5 Supply Chain Localization and Resilience
- 16.6 Distribution and Customer Acquisition
- 16.7 Partnership, Acquisition and Capacity Strategy
- 16.8 Regional Expansion Priorities
- 16.9 Short-, Medium- and Long-Term Actions
Chapter 17 Competition Outlook
- 17.1 Industry Competition Characteristics
- 17.2 Market Structure and Concentration
- 17.3 Market Share and Competitive Positioning, 2025
- 17.4 Company-Wise Revenue and Product Benchmarking
- 17.5 Production and Service Capacity Benchmarking
- 17.6 Technology, Pricing and Differentiation
- 17.7 Regional Footprint and Distribution Strength
- 17.8 Mergers, Acquisitions and Strategic Alliances
- 17.9 New Entrants and Competitive Threats
- 17.10 Porter's Five Forces and Industry Attractiveness
- 17.11 Competitive Outlook, 2025-2035
Chapter 18 Company Profiles
- 18.1 Company Coverage and Selection Criteria
- 18.2 UBS Sekuritas Indonesia
- 18.2.1 Business Description
- 18.2.2 Company Ownership and Geographic Presence
- 18.2.3 Product and Service Portfolio
- 18.2.4 Manufacturing and Operating Footprint
- 18.2.5 Financial Performance and Investment
- 18.2.6 Market Share and Competitive Position
- 18.2.7 Technology and Innovation Capabilities
- 18.2.8 Strategic Alliances or Partnerships
- 18.2.9 Recent Developments
- 18.2.10 Growth Strategy and Outlook
- 18.3 Mandiri Sekuritas
- 18.4 Maybank Sekuritas Indonesia
- 18.5 CGS International Sekuritas Indonesia
- 18.6 Mirae Asset Sekuritas Indonesia
- 18.7 J.P. Morgan Sekuritas Indonesia
- 18.8 Stockbit Sekuritas Digital
- 18.9 Indo Premier Sekuritas
- 18.10 Semesta Indovest Sekuritas
- 18.11 KB Valbury Sekuritas
- 18.12 Other Relevant Market Participants
Note: Every listed company is profiled on the structure shown under the first company. The company list is preliminary and may change based on research findings, market developments, data availability and client requirements.
Chapter 19 Disclaimer
- 19.1 Research and Forecast Disclaimer
- 19.2 Data Source and Estimation Limitations
Note: The depth of individual sections depends on data availability for this market. Volume, capacity, trade and other unit-based metrics are included where applicable.

