
Safeguard surrenders turn ACCUs into a compliance commodity
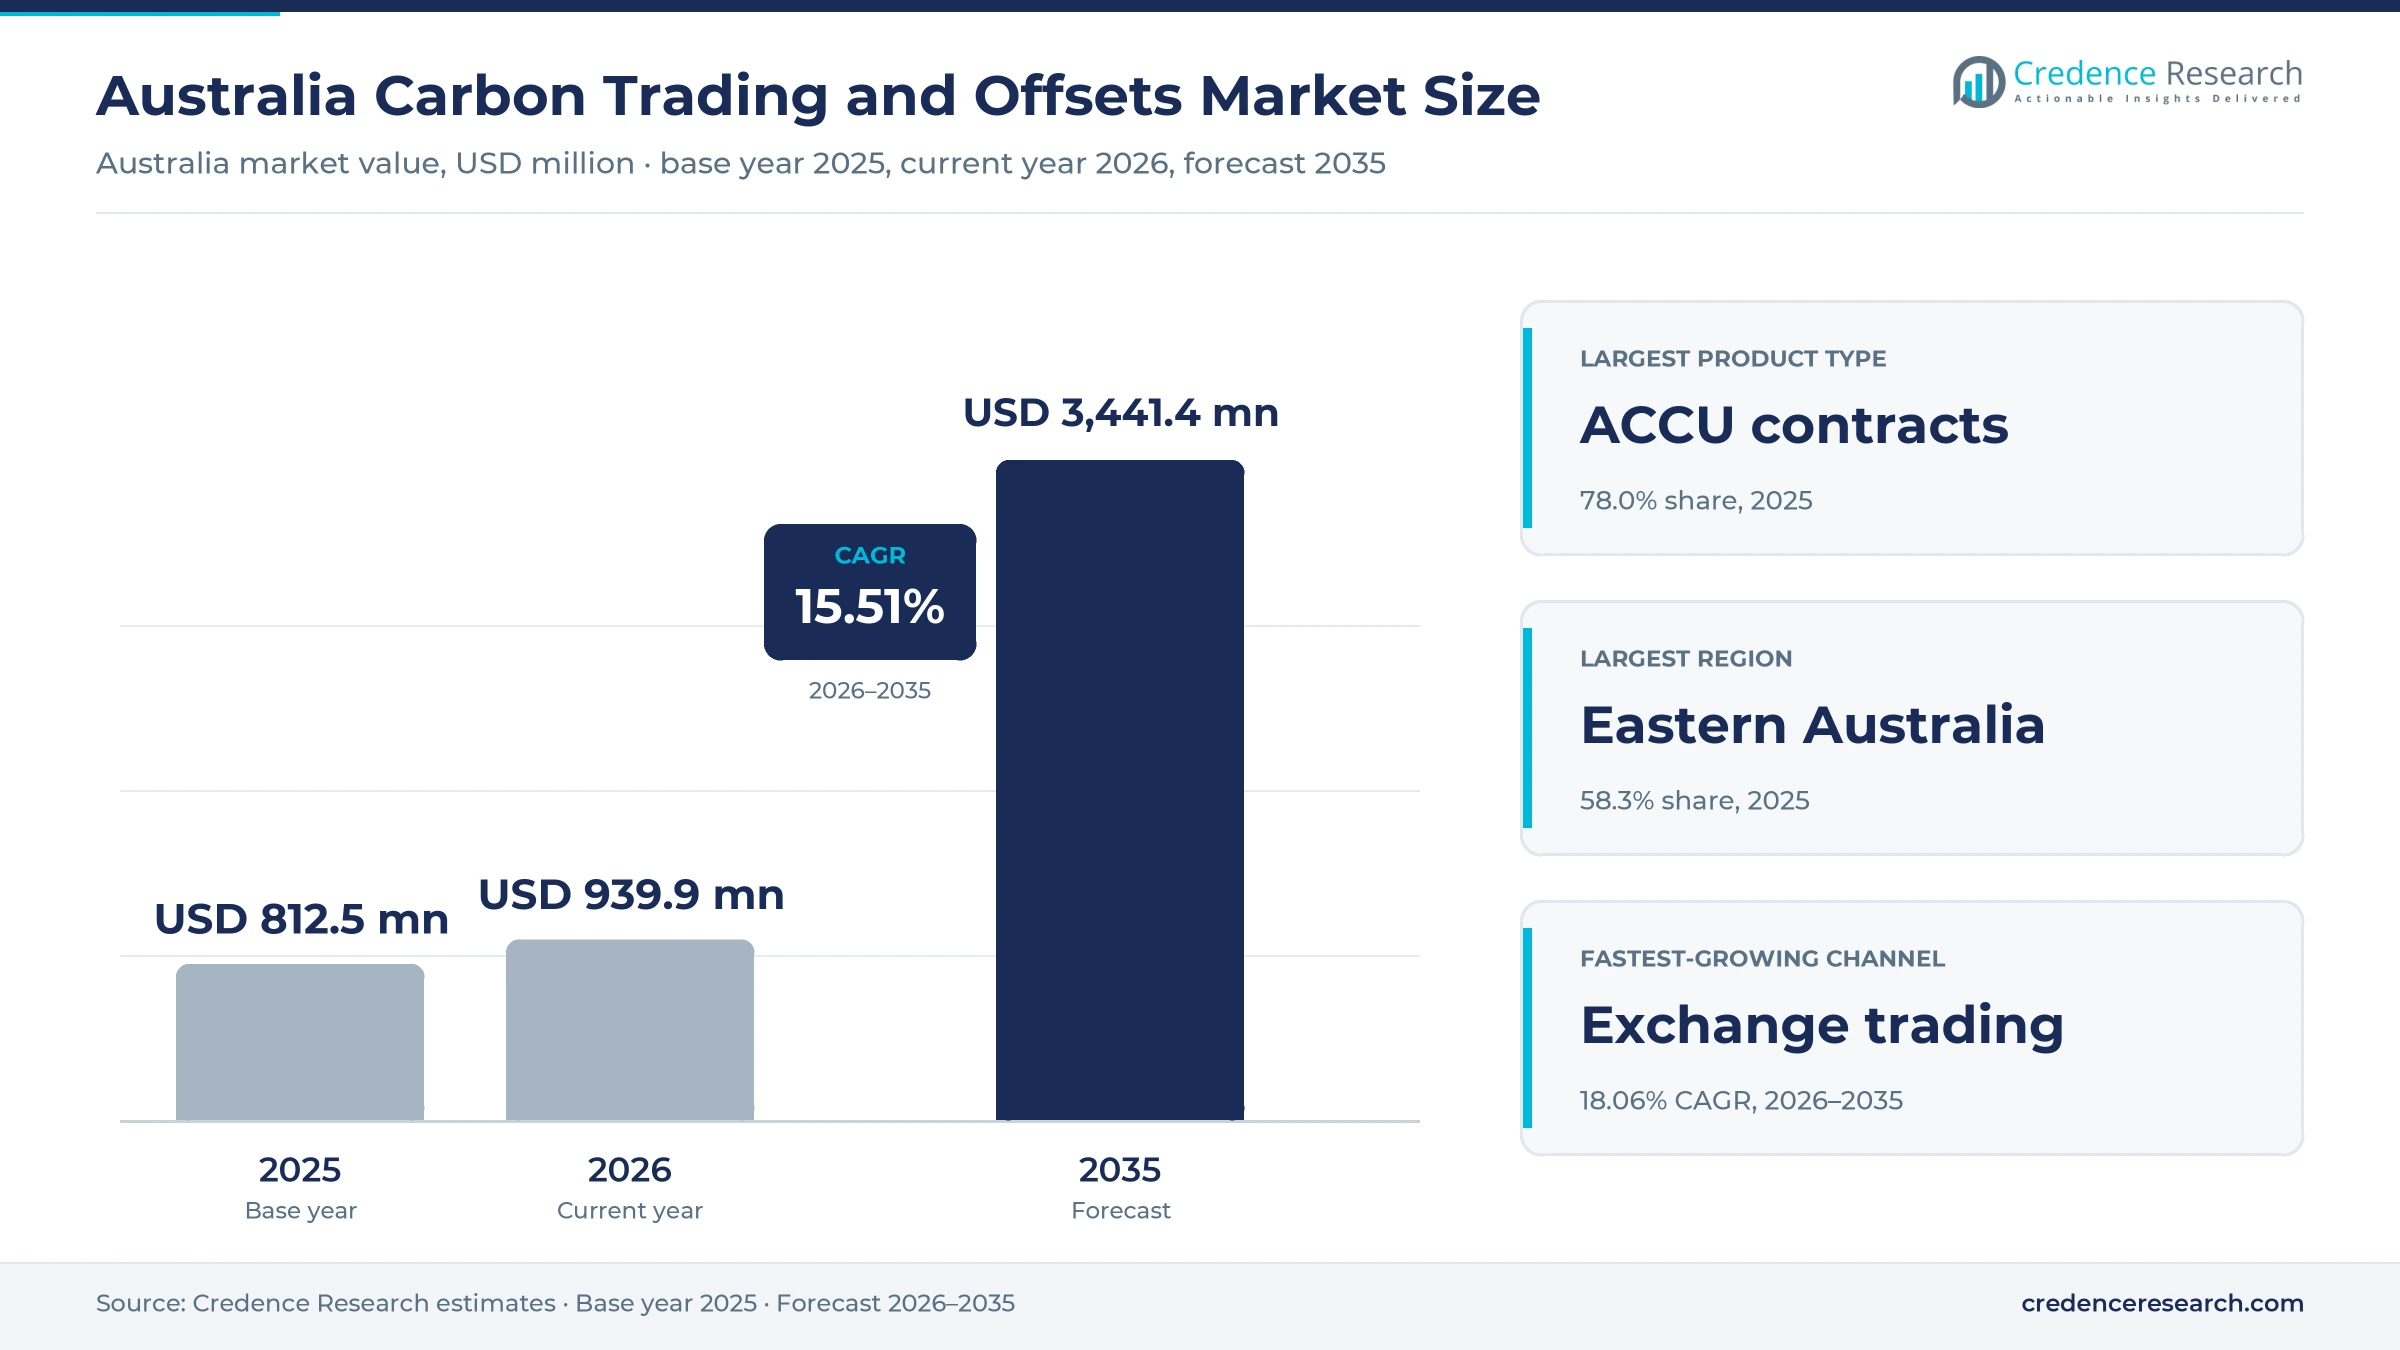
The Australia carbon trading and offsets market was valued at USD 812.5 million in 2025 and is projected to increase from USD 939.9 million in 2026 to USD 3.44 billion by 2035, registering a CAGR of 15.51% during 2026–2035. Demand comes from Safeguard facilities that surrender Australian carbon credit units and Safeguard Mechanism credit units each year, from Commonwealth contract deliveries and from corporate buyers that cancel units for voluntary claims. Eastern Australia held the largest regional share, 58.3% in 2025, because most corporate buyers, brokers and intermediaries trade from the eastern capitals. Western Australia is the fastest-growing region at 16.20% a year, as mining and gas facilities face declining baselines. The move of all units into a blockchain registry in November 2025 and the arrival of physically delivered futures have also changed how sellers and buyers settle trades.
Which unit transactions does the estimate count?
The estimate measures the value of transactions in Australian carbon credit units and Safeguard Mechanism credit units, including spot purchases, fixed-price forward deliveries and option premiums. It counts units sold by project developers, financial intermediaries and corporate sellers to Safeguard buyers, Commonwealth procurement programs, non-Safeguard buyers and trading counterparties.
The estimate excludes renewable energy certificates, international units, project development fees and advisory income. The value chain runs from registered projects and the national registry through bilateral deals, brokers and exchanges to compliance buyers, which surrender units to cover emissions above each facility baseline before the April 1 deadline.
Australia Carbon Trading and Offsets Market Insights
- The Australia carbon trading and offsets market was valued at USD 812.5 million in 2025 and is projected to reach USD 3.44 billion by 2035, registering a CAGR of 15.51% during 2026–2035.
- Eastern Australia held a 58.3% share of 2025 value, because corporate buyers, brokers and intermediaries in the eastern capitals arrange most unit purchases.
- ACCU contracts led with a 78.0% share of 2025 value, because Safeguard facilities surrendered 10.8 million ACCUs against 2.6 million SMCs for 2024-25.
- The regulator migrated 177,672,533 active and previously cancelled ACCUs into its blockchain Unit and Certificate Registry in November 2025, creating one ledger for ACCUs and SMCs.
- Exchange trading grows fastest at 18.06% a year during 2026–2035, as listed ACCU futures on two exchanges give buyers forward prices for future surrender years.
ACCU contracts and brokered deals hold most traded value
Why do ACCU contracts dominate traded value?
Based on product type, the market is categorized into ACCU contracts, SMC contracts and mixed ACCU-SMC contracts. ACCU Contracts led with a 78.0% share of 2025 value, because ACCUs remain the main unit that Safeguard facilities surrender and that corporate buyers cancel. Mixed ACCU-SMC Contracts grow fastest at 17.47% a year, as buyers bundle both units to cover each annual obligation at the lowest delivered cost.
How do Safeguard buyers shape unit demand?
Based on customer segment, the market is categorized into Safeguard buyers, Commonwealth procurement, non-Safeguard buyers and trading counterparties. Safeguard Buyers led with a 52.0% share of 2025 value, because 139 facilities surrendered units for the 2024-25 compliance period. Trading Counterparties grow fastest at 16.15% a year, as banks and trading houses warehouse units and hedge forward positions.
Which channels carry most ACCU and SMC volume?
Based on distribution channel, the market is categorized into bilateral OTC, broker-arranged OTC and exchange trading. Broker-Arranged OTC led with a 47.0% share of 2025 value, because brokers match large compliance buyers with project sellers and price method premiums. Exchange Trading grows fastest at 18.06% a year, as cleared futures and spot screens attract mid-sized buyers.
How are ACCU and SMC trades settled?
Based on revenue model, the market is categorized into spot settlement, fixed-price forward settlement and option contract consideration. Spot Settlement led with a 55.0% share of 2025 value, because most buyers take issued units for prompt surrender or cancellation. Option Contract Consideration grows fastest at 17.24% a year, as buyers pay premiums to cap the cost of units they will need after 2027.
| Segment Group | Leading Sub-segment | Share, 2025 | Fastest-growing Sub-segment | CAGR, 2026–2035 |
|---|---|---|---|---|
| By Product Type | ACCU Contracts | 78.0% | Mixed ACCU-SMC Contracts | 17.47% |
| By Customer Segment | Safeguard Buyers | 52.0% | Trading Counterparties | 16.15% |
| By Distribution Channel | Broker-Arranged OTC | 47.0% | Exchange Trading | 18.06% |
| By Revenue Model | Spot Settlement | 55.0% | Option Contract Consideration | 17.24% |
Request a Free Sample
Fill in your details and we'll send you a free sample report.
- Sample data tables & charts
- Research methodology
Falling baselines and forward buying lift unit demand
How do declining Safeguard baselines lift unit demand?
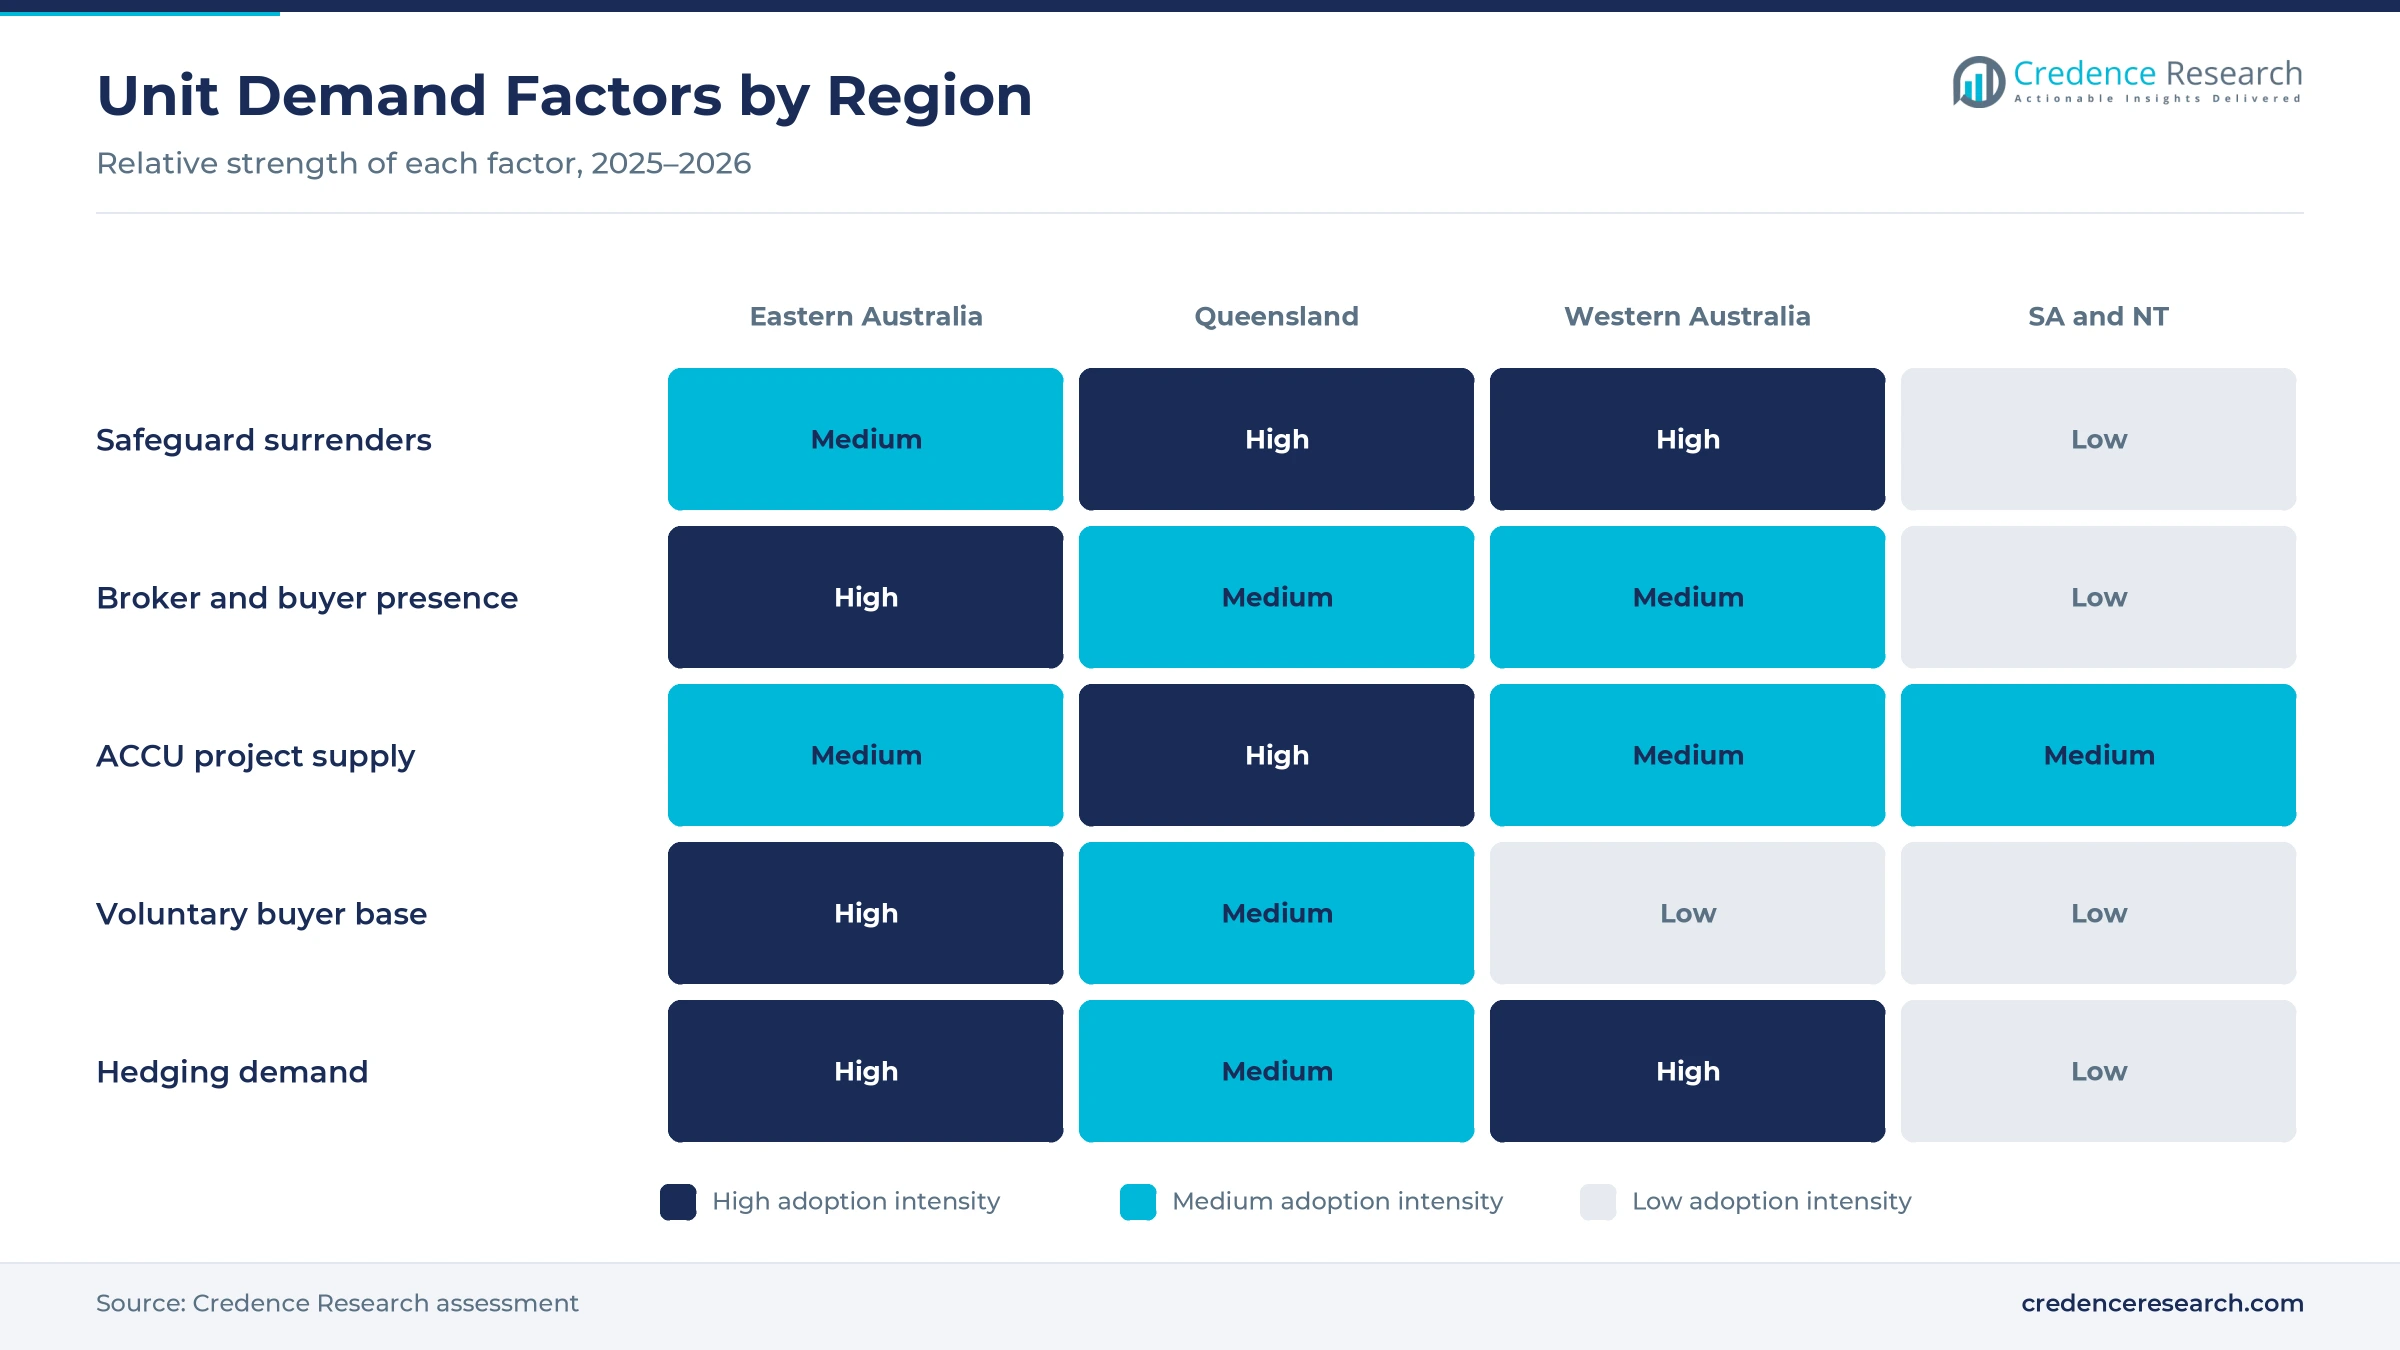
Each covered facility must close a growing gap between its emissions and a shrinking limit with ACCUs or SMCs, so falling baselines translate directly into purchases. Baselines decline by 4.9% each financial year through June 30, 2030, while trade-exposed facilities can access a lower rate for three years. The Clean Energy Regulator counted 208 covered facilities and 132.8 million metric tons of covered emissions in 2024-25, equal to 29.9% of national emissions. For that period, 139 facilities surrendered 10.8 million ACCUs and 2.6 million SMCs, a 49% rise in total surrenders from 2023-24. As a result, Safeguard buyers hold 52.0% of 2025 value and anchor demand for issued units.
Why is structured carbon procurement gaining ground?
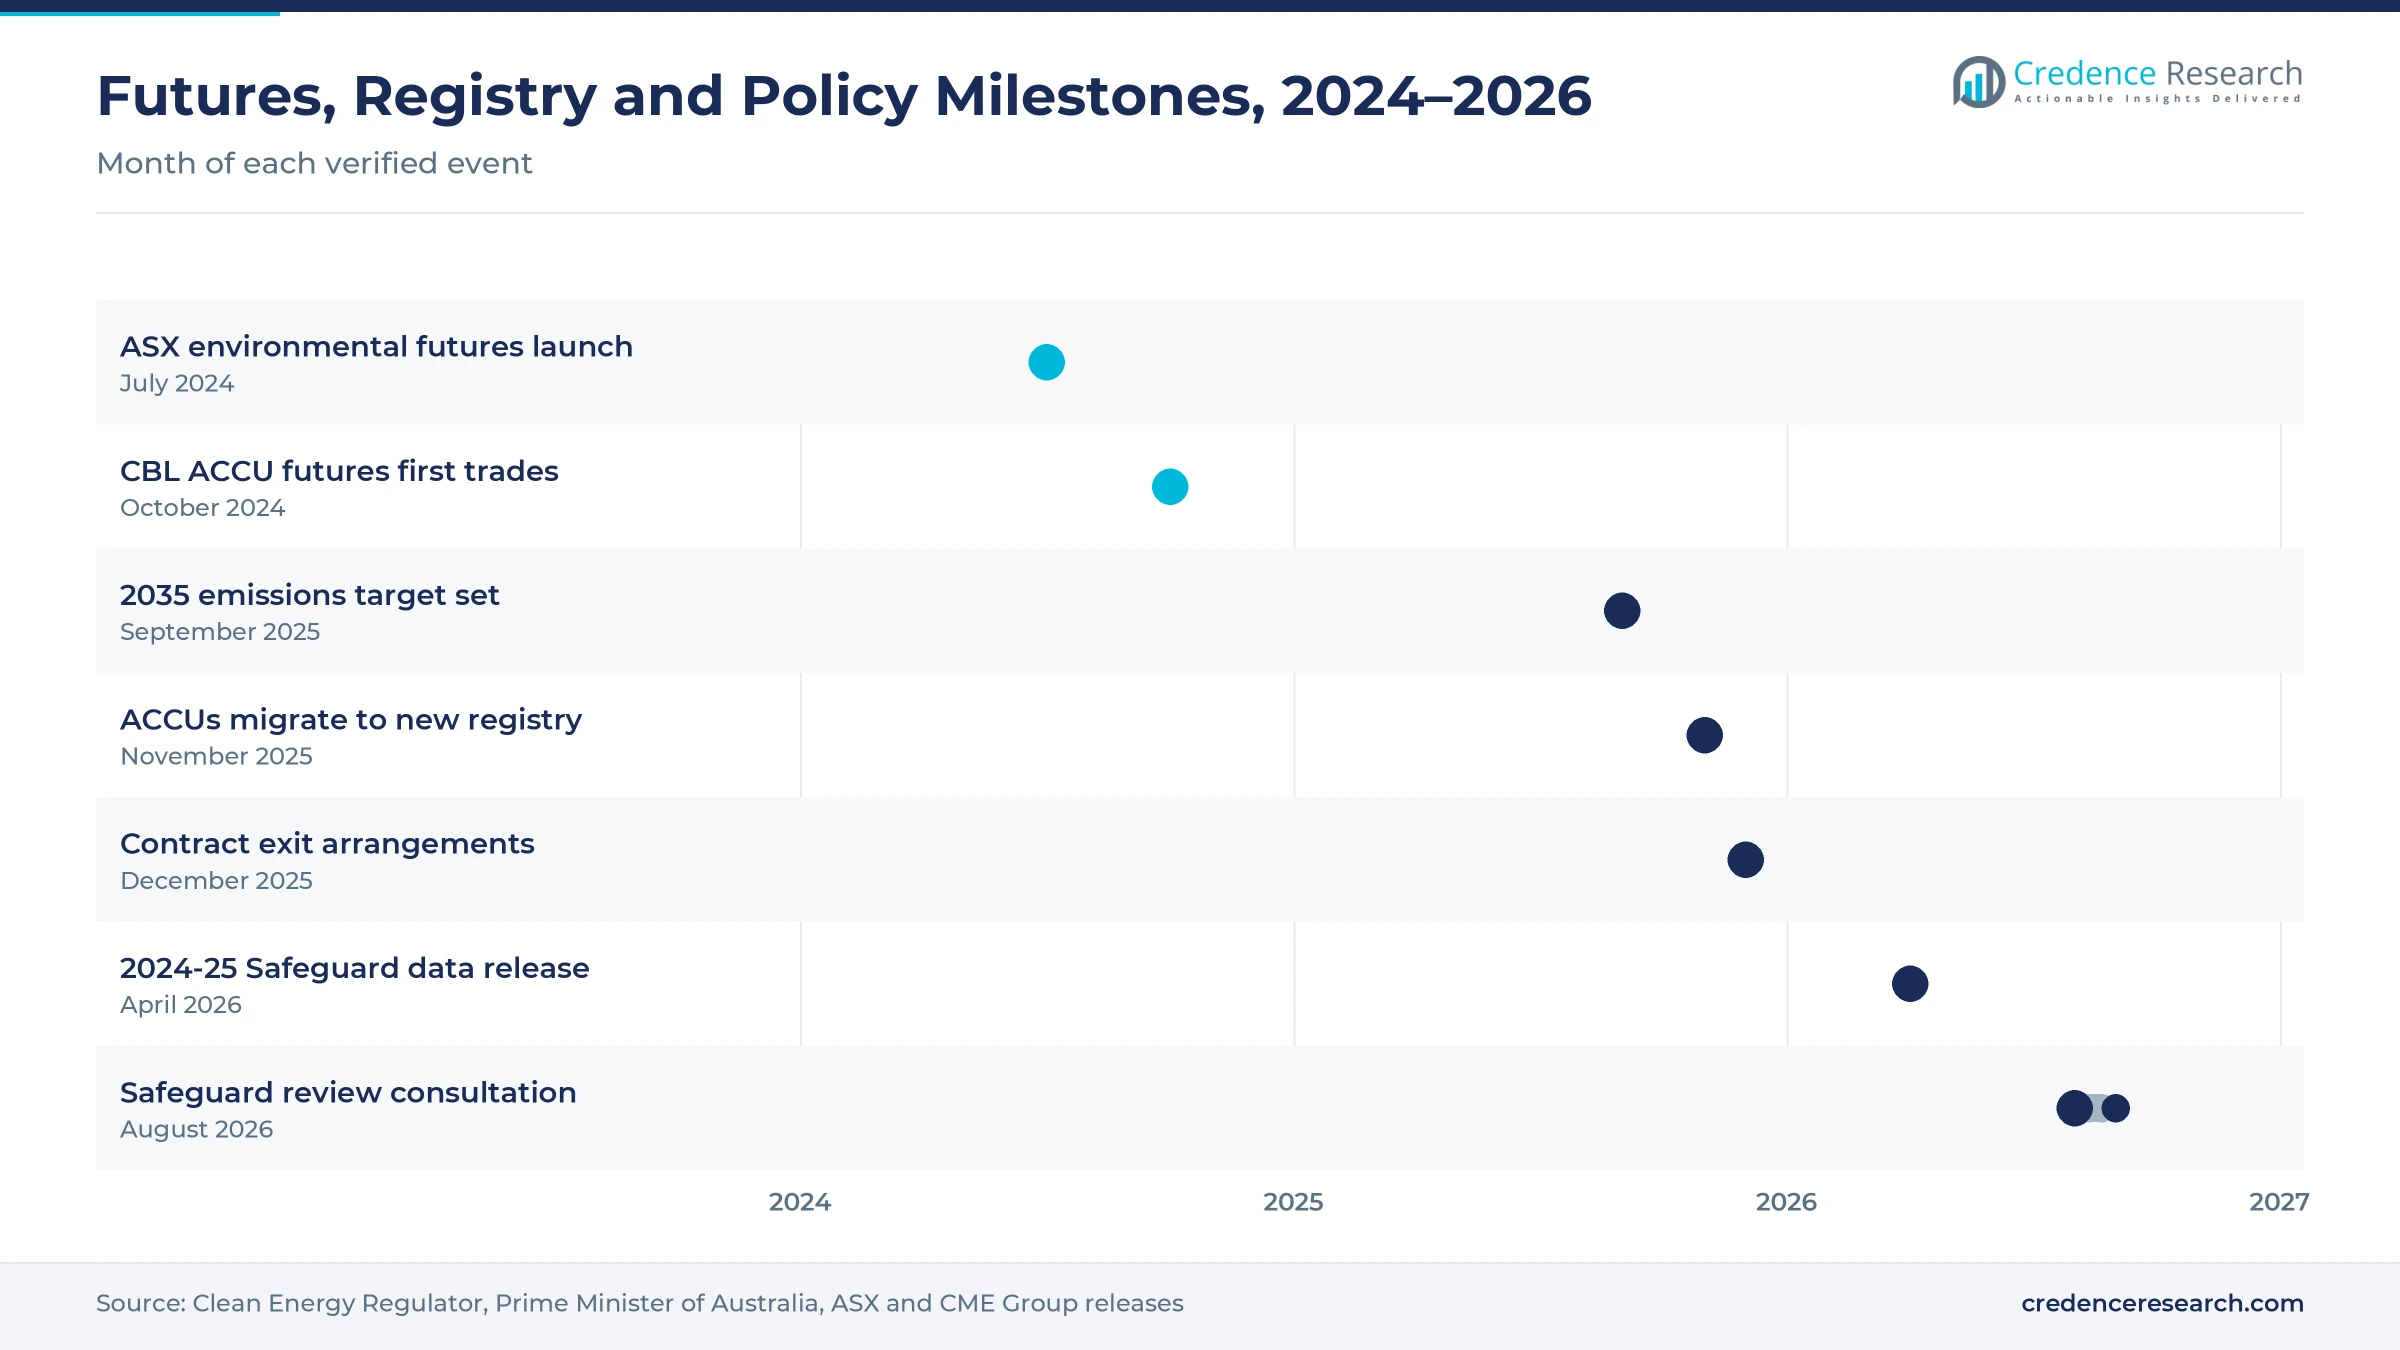
Buyers now lock in forward volumes, option caps and Commonwealth contract units instead of buying only before each surrender deadline. ASX listed physically delivered ACCU futures of 1,000 units each on July 29, 2024, aiming to show annual forward prices out to five years, according to its exchange launch release. The government announced permanent exit arrangements for fixed delivery Commonwealth carbon abatement contracts on Dec. 3, 2025, with a 60% discount on exit fees for sellers that deliver at least 25% of outstanding volume. Units held in the cost containment measure are offered to eligible facilities at A$87.72 for 2026-27. In turn, fixed-price forward settlement holds a large share of value, while options grow at 17.24% a year.
How does broader credit origination widen supply?
New methods and first-time projects add units from waste, agriculture and native forests to the traded pool, which gives buyers a wider choice of credits. The regulator issued a record 21.7 million ACCUs in 2025 and expects 22 million to 26 million in 2026. Issuance in the first half of 2026 reached 10.9 million, with 1.5 million ACCUs going to projects for the first time, the highest first-time issuance since 2017. The government introduced a method for reducing methane from landfill gas on Nov. 28, 2025, and approved an improved native forest management method on June 25, 2026. As a result, project developers can sell from a wider mix of methods to compliance and voluntary buyers.
Why do the 2035 target and registry upgrade add momentum?
Buyers now face a longer compliance path and a simpler way to hold and move units, which supports steady growth in trade. The government set a 2035 target of a 62% to 70% reduction on 2005 emissions on Sept. 18, 2025, according to the Prime Minister's announcement. The regulator migrated 177,672,533 active and previously cancelled ACCUs into its blockchain registry in November 2025, along with the history of more than 2,000 accounts. The new registry holds ACCUs and SMCs in one place and adds multi-factor checks on transfers. In turn, exchange trading grows at 18.06% a year, the fastest channel during 2026–2035.
Futures, SMC banking and post-2030 limits reshape trade
How is the rise of cleared ACCU futures changing trade?
Buyers can now hedge future surrender needs with standard listed contracts instead of only negotiating bespoke forward deals. CME Group launched CBL ACCU futures based on the Xpansiv CBL spot market, and five contracts first traded as a block between Freepoint Commodities and Mercuria on Oct. 14, 2024, according to CME Group. ASX introduced a temporary fee waiver on its environmental futures to build early liquidity. The exchange also noted that about half of all ACCUs sat in the accounts of Safeguard or related entities. As a result, ACCU exchange and brokerage venues gain share from bilateral deals, although broker-arranged OTC still holds 47.0% of 2025 value.
Why is SMC banking an emerging shift in supply?
Many facilities that earn SMCs keep them for later years instead of selling them to other emitters, which marks a shift in how this unit reaches the market. The regulator issued 6.7 million SMCs to 54 facilities for 2024-25, down from 8.3 million to 64 facilities a year earlier. Only 2.6 million SMCs were surrendered for 2024-25, and SMC holdings stood at 11.0 million at the end of June 2026. SMC spot prices tracked ACCUs closely, reaching A$39.25 on Aug. 14, 2026, against A$39.03 for generic ACCUs. In turn, SMC contracts grow faster than ACCU contracts, as banked units return to market when baselines tighten.
Can post-2030 baseline settings open new demand?
A steeper decline rate after 2030 would raise the number of units that facilities must buy each year, which makes the review a key demand signal. The department released its Safeguard Mechanism review consultation paper on Aug. 7, 2026, with a focus on the 2030-35 baseline decline rate. The regulator reported that ACCU holdings outside the cost containment measure reached 61.2 million at the end of June 2026, yet net growth in holdings slowed to 0.4 million in the first half, according to its June quarter 2026 market report. That compares with 5.1 million in the first half of 2024. As a result, sellers holding inventory can expect firmer demand as surrenders catch up with supply.
Is there an opening in data-rich offset portfolios?
Buyers increasingly want unit-level method, location and co-benefit records before they pay premiums for credits. Carbon pricing revenues exceeded US$100 billion in 2024, and about 28% of global emissions are now covered by a carbon price, according to the World Bank. The same release said compliance demand for carbon credits almost tripled, while voluntary demand growth was negligible. In Australia, non-Safeguard cancellations fell to 0.3 million ACCUs in the June quarter of 2026. In turn, sellers that pair registry data with emissions accounting tools can win compliance buyers that must explain their unit choices.
Unit surplus, method reviews and thin screens weigh on value
How does a large unit surplus weigh on prices?
ACCU issuance still outpaces Safeguard surrenders and voluntary cancellations each year, which keeps a large inventory in seller accounts. As a result, generic spot prices stayed near A$38 in mid-2026, which limits the value of each traded unit for developers and intermediaries. Sellers respond with forward contracts, method premiums and Commonwealth exits, which help them place volume at better terms. This pressure should ease only when annual demand overtakes supply.
Why do method reviews slow some project sales?
Buyers hesitate when a crediting method faces new limits or integrity questions, which slows some project sales. The independent assurance committee found in April 2026 that the soil carbon method needed strengthening, and soil carbon project registrations fell to their lowest level since 2023. In turn, sellers of affected units face longer deal times and wider spreads. Developers respond with tighter sampling and clearer project data, which help restore buyer confidence in forestry and land-use credits.
How does thin screen liquidity limit exchange growth?
Large compliance buyers still prefer negotiated deals that move size without shifting prices, which keeps screen activity light. As a result, listed futures and spot contracts can trade only a few blocks on many days, which deters new participants. Exchanges respond with fee waivers, market makers and block trade facilities, which help build depth over time. This challenge favors venues that can attract bank and trading house liquidity.
Why does policy uncertainty after 2030 delay contracts?
Buyers cannot yet price the baseline decline rate that will apply from 2030-31, which delays some long supply contracts. In turn, many facilities sign shorter forward deals and keep options open, which reduces the volume of multi-year supply agreements. Developers respond with flexible delivery schedules and price collars, which share risk with buyers. This uncertainty should ease once the Safeguard review sets post-2030 settings.
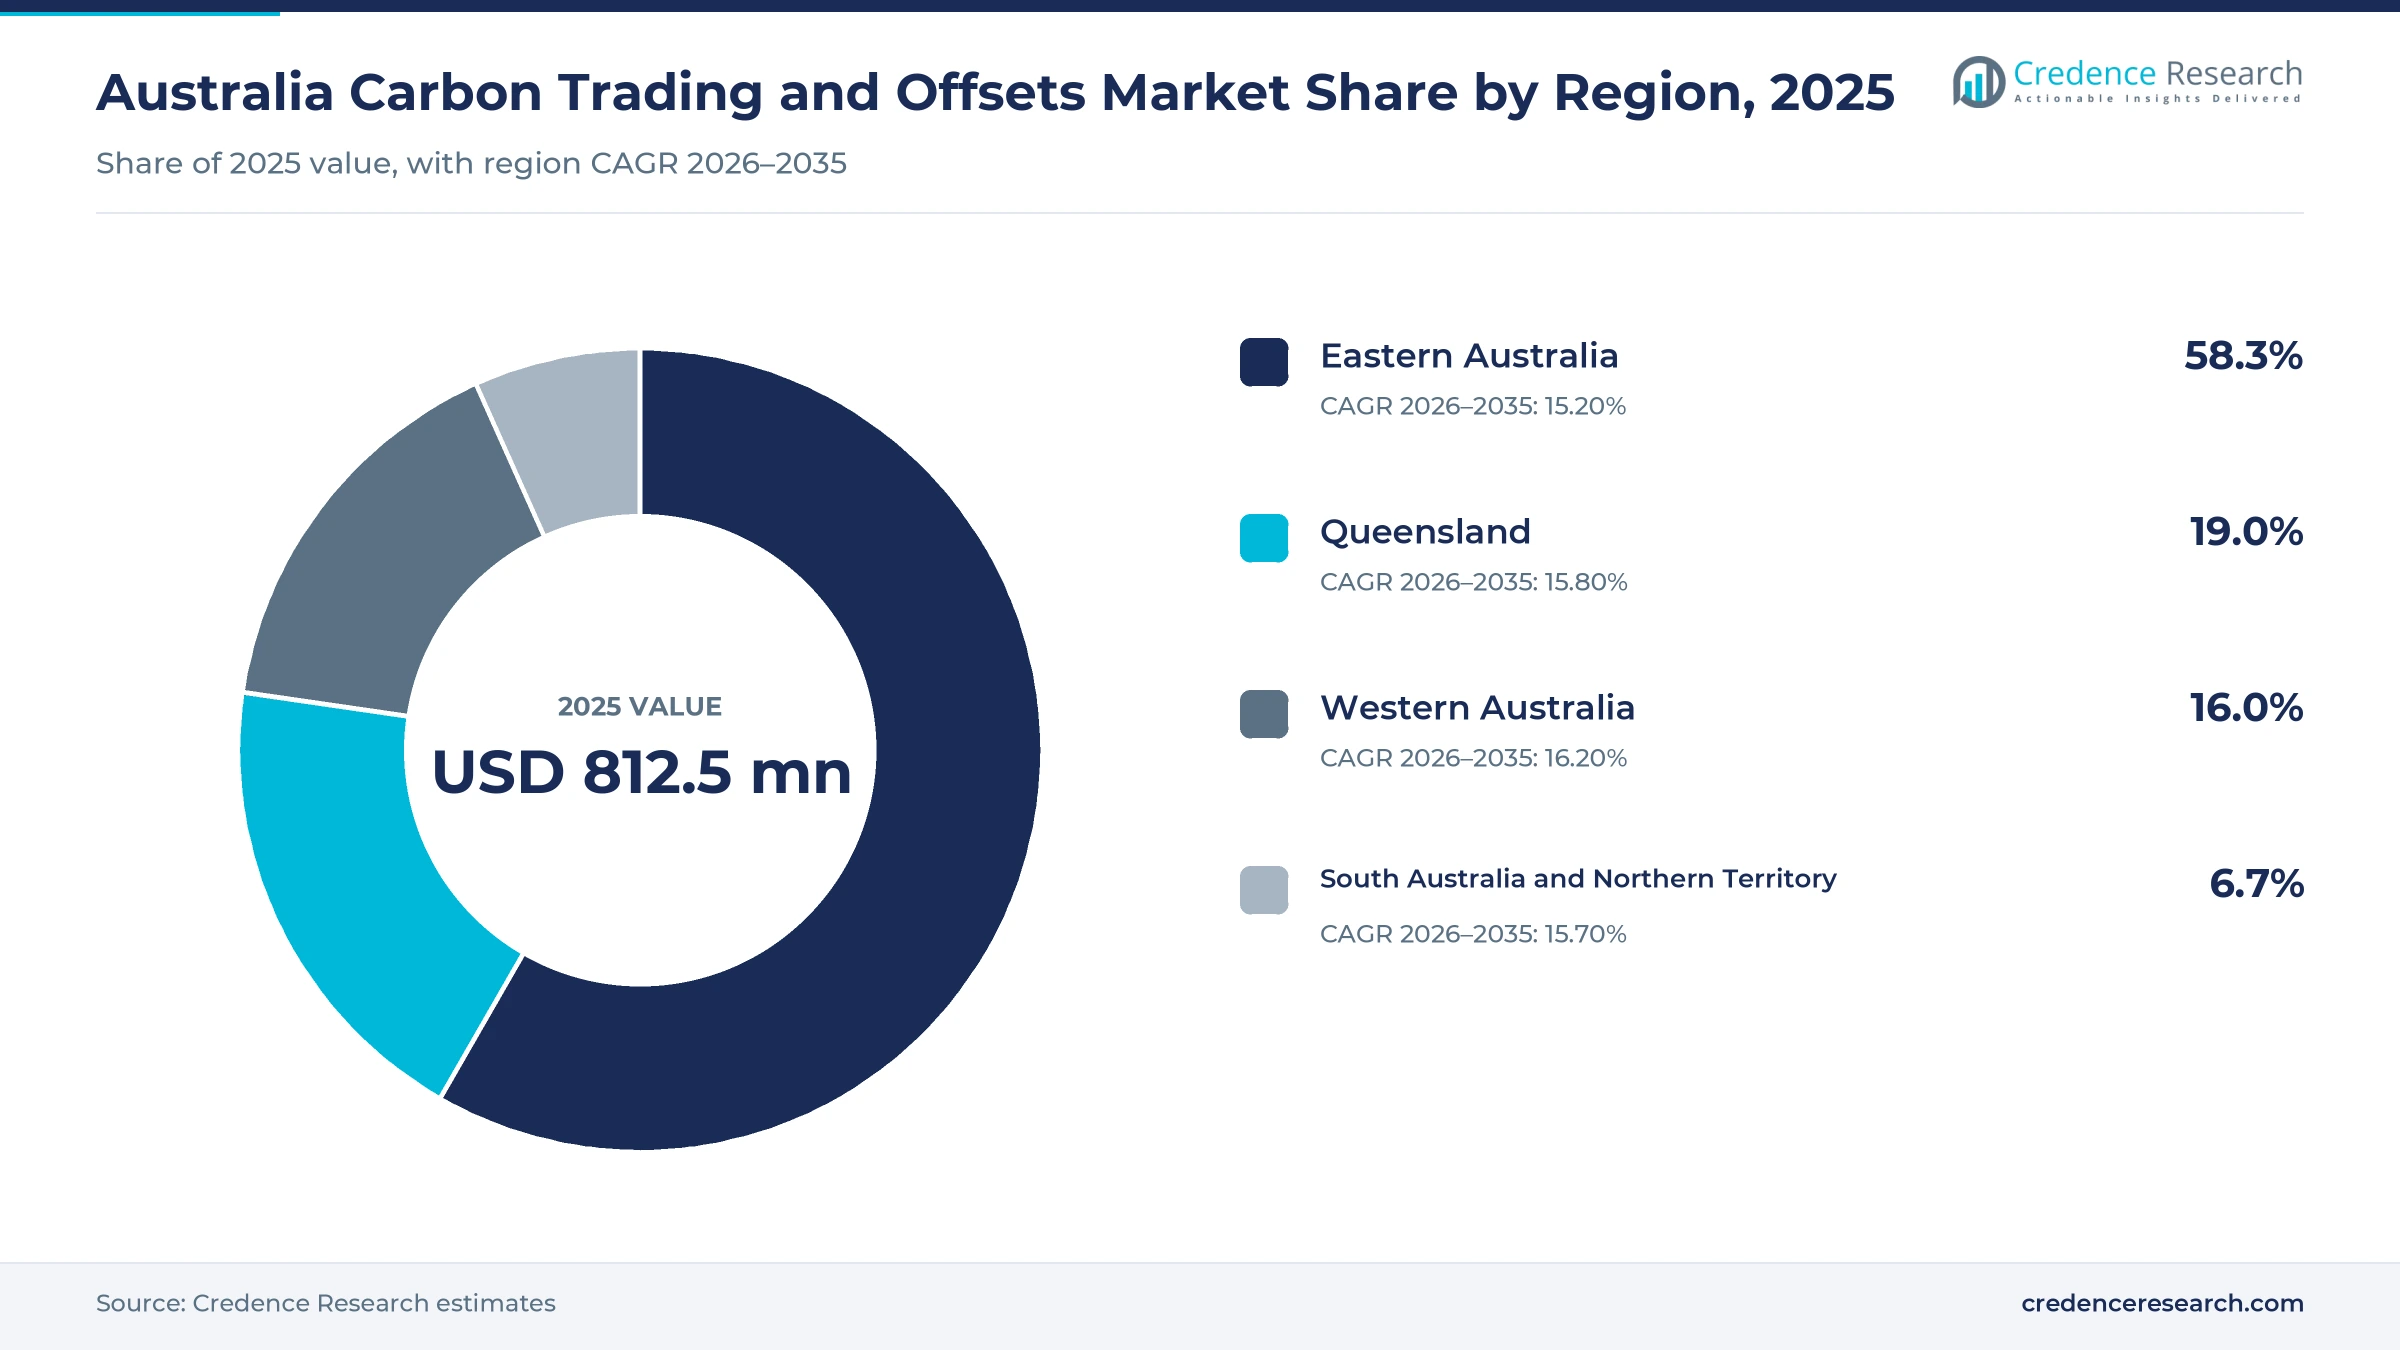
Eastern buyers lead while western emitters grow fastest
| Region | Value, 2025 (USD million) | Share, 2025 | CAGR, 2026–2035 |
|---|---|---|---|
| Eastern Australia | 473.7 | 58.3% | 15.20% |
| Queensland | 154.4 | 19.0% | 15.80% |
| Western Australia | 130.0 | 16.0% | 16.20% |
| South Australia and Northern Territory | 54.4 | 6.7% | 15.70% |
Why does eastern Australia hold the top share?
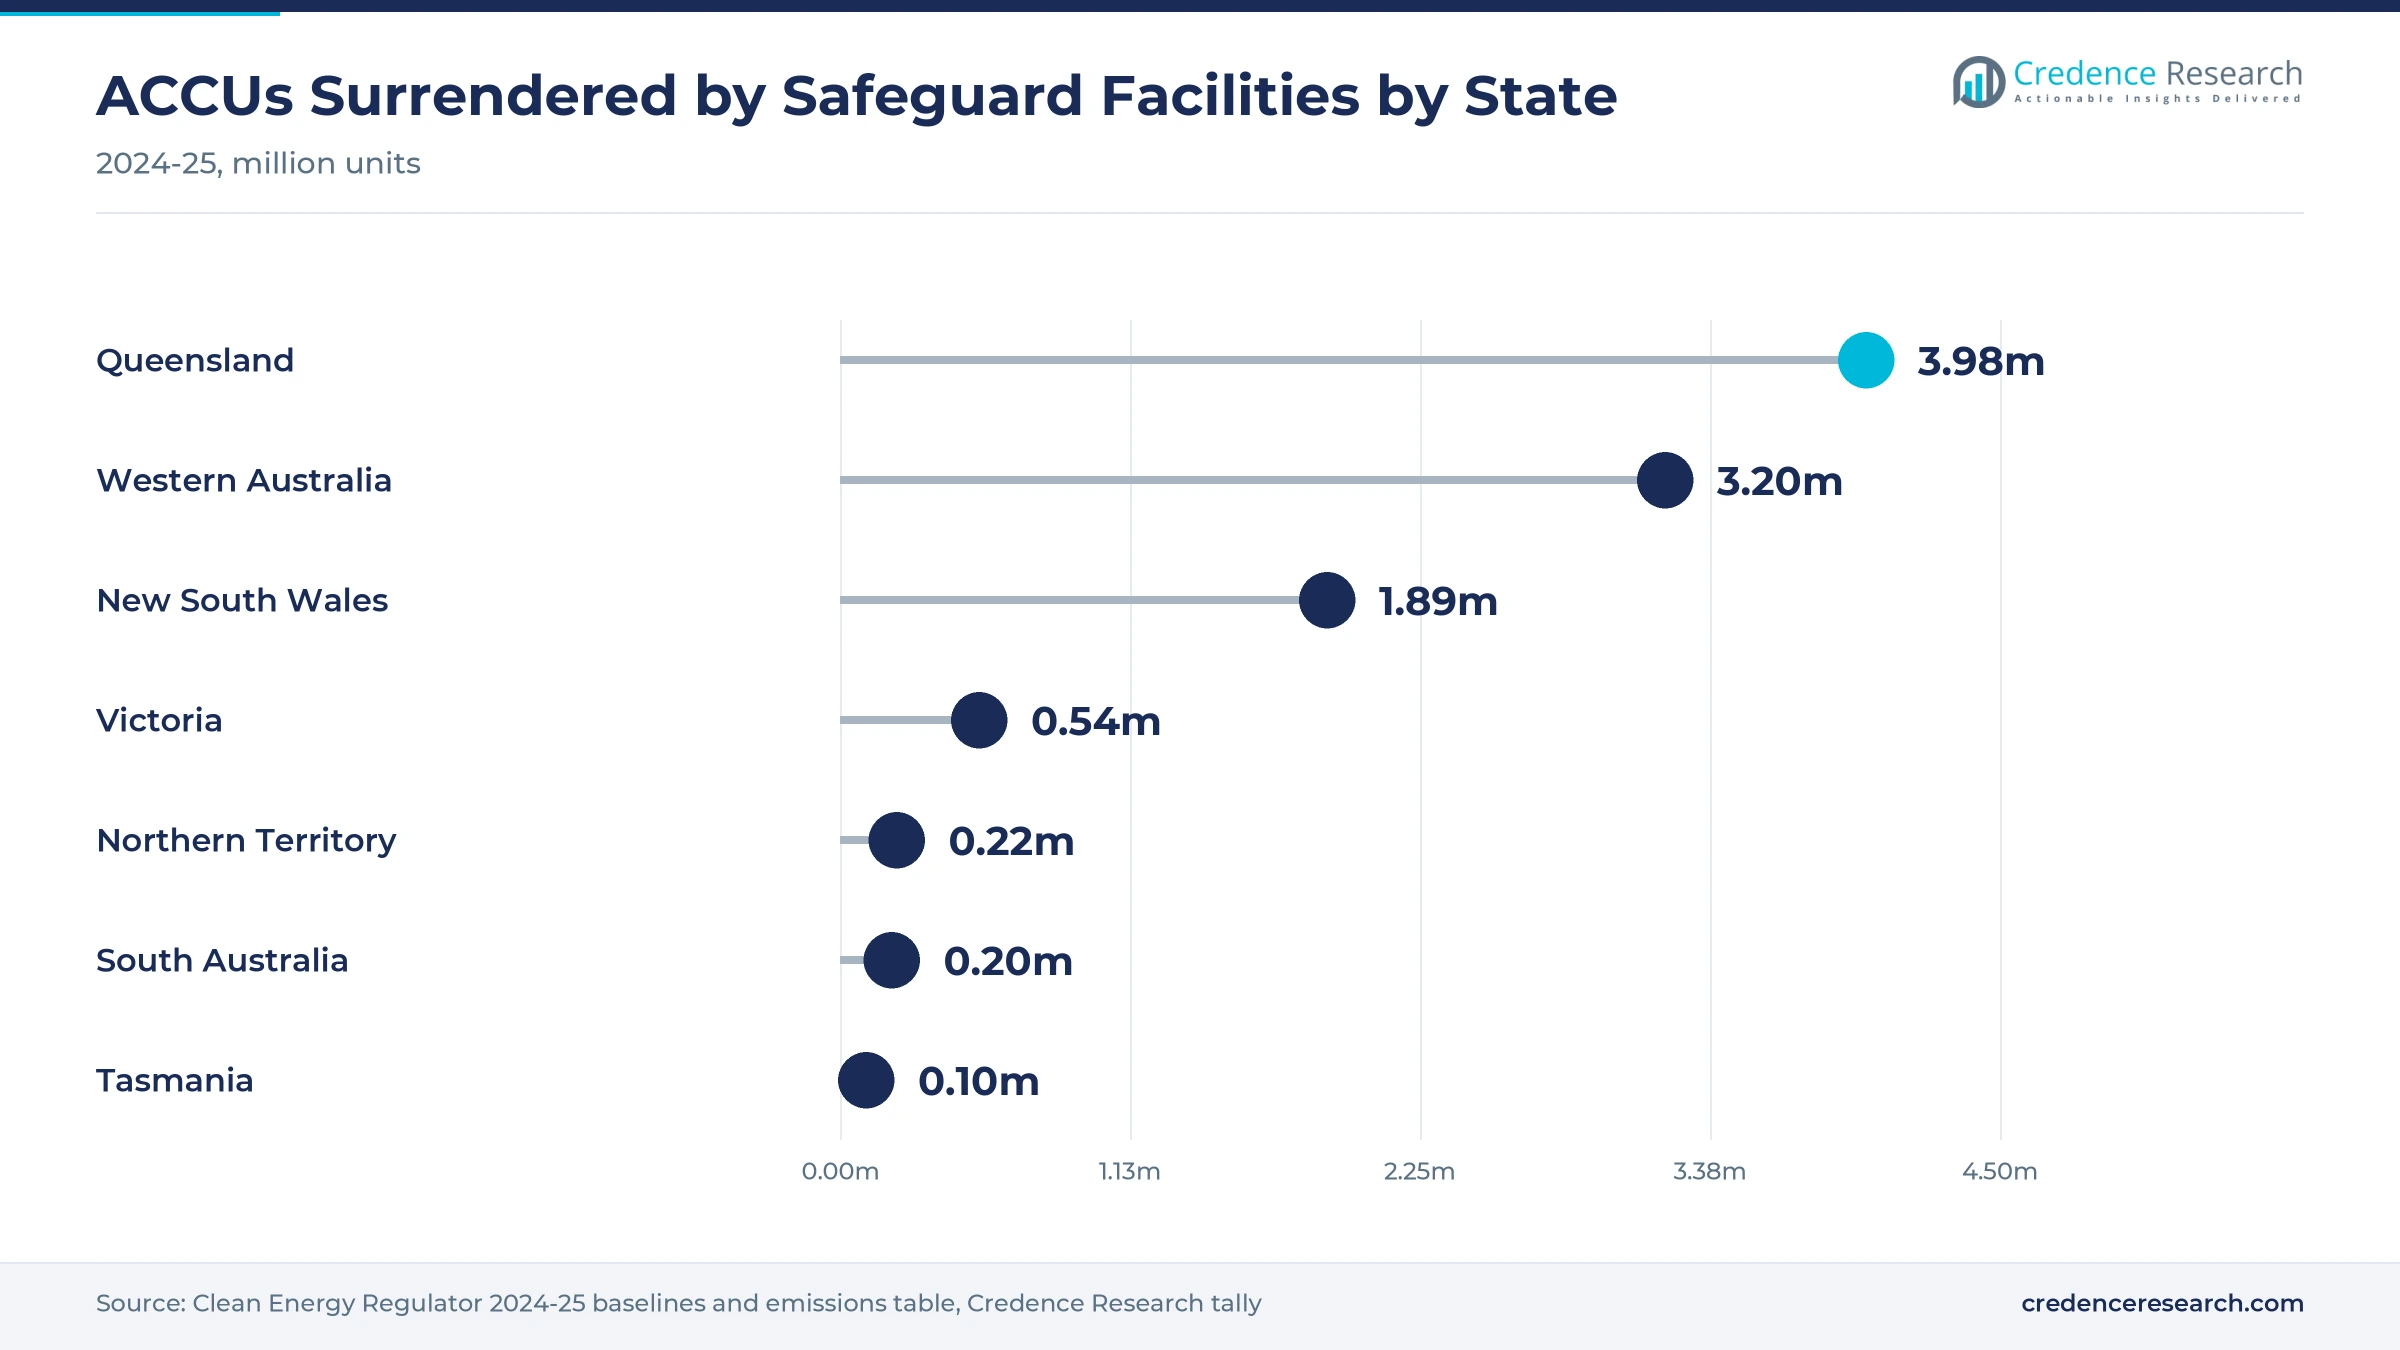
Eastern Australia held a 58.3% share of 2025 value and grows at 15.20% a year, because corporate buyers, brokers and trading counterparties arrange most unit purchases from the eastern capitals. Safeguard facilities in New South Wales, Victoria and Tasmania surrendered about 2.5 million ACCUs for 2024-25 across 55 facility entries, led by 1.89 million in New South Wales. As a result, the zone combines steady compliance demand with the deepest pool of voluntary and intermediary buyers.
What drives unit purchases in Queensland?
Queensland held a 19.0% share of 2025 value and grows at 15.80% a year, because coal mines and gas plants in the state face declining baselines. Queensland facilities surrendered 3.98 million ACCUs and 1.26 million SMCs for 2024-25, the largest ACCU total of any state, across 70 facility entries. The state also hosts supply, including an LMS Energy landfill gas project that has received 16,019 ACCUs. In turn, Queensland acts as both a major buyer and seller zone.
Why do large mining and gas emitters make the west fastest?
Western Australia held a 16.0% share of 2025 value and grows fastest at 16.20% a year, because mining and gas facilities carry the largest covered emissions of any state. Western Australian facilities reported 47.2 million metric tons of covered emissions for 2024-25 across 81 facility entries. They surrendered 3.2 million ACCUs and 0.75 million SMCs for the same period. As a result, falling baselines add more purchases in this zone than in any other.
How do South Australia and the NT contribute?
South Australia and the Northern Territory held a 6.7% share of 2025 value and grow at 15.70% a year, because the zone has fewer covered facilities. Northern Territory facilities reported 7.3 million metric tons of covered emissions for 2024-25, while South Australian facilities reported 4.2 million metric tons. The regulator credited carbon capture and storage at the Moomba plant with lowering oil and gas emissions intensity. In turn, the zone buys fewer units per facility than the larger states.
Futures listings, registry migration and contract exits
| Development | Status and market relevance |
|---|---|
| In July 2024, ASX listed physically delivered ACCU, LGC and NZU futures on its ASX 24 market. | Gave buyers the first listed local forward curve |
| In October 2024, CME Group recorded the first CBL ACCU futures trades between Freepoint Commodities and Mercuria. | Linked a global futures venue to the CBL spot market |
| In November 2025, the regulator migrated 177,672,533 ACCUs into its blockchain Unit and Certificate Registry. | Created one ledger for ACCUs and SMCs |
| In December 2025, the government announced permanent exit arrangements for fixed delivery carbon abatement contracts. | Releases more contracted units to the private market |
| In August 2026, the department released its Safeguard Mechanism review consultation paper. | Opens debate on the 2030-35 baseline decline rate |
Blockchain registry and delivered futures support trade
- Blockchain registry ledgers hold ACCUs and SMCs in one Unit and Certificate Registry built on Trovio's CorTenX service, which adds richer unit data and multi-factor checks on transfers.
- Physically delivered futures settle into registry accounts at expiry, which lets buyers hedge future surrender needs and still receive real units for compliance.
- Electronic spot screens match standard ACCU contracts anonymously and provide the reference price that CBL ACCU futures settle against.
- Direct soil and biomass measurement supports issuance for soil carbon and avoided deforestation projects, which must prove carbon gains with field sampling before units are credited.
Need a Custom Version of This Report?
Tailor the scope, geography, or segments to your exact requirements.
- Custom geography or segment scope
- Direct access to our analyst team
Developers, offset retailers and exchanges compete for flow
Competition combines project developers that originate units with offset retailers, brokers and exchanges that move them to buyers. GreenCollar works with land managers on carbon farming projects, while Select Carbon offers human-induced regeneration, soil carbon and environmental planting projects. AgriProve registers and manages soil carbon projects for farmers across Australia, and LMS Energy captures landfill methane at 68 sites across Australia, including a Queensland project that earns ACCUs. Climate Friendly offers carbon farming, savanna fire management and carbon credit trading services. Corporate Carbon provides project services and ownership models, and CO2 Australia delivers large revegetation projects. South Pole offers ACCU purchasing and project development, and Tasman Environmental Markets sells ACCUs and other offsets to businesses. Xpansiv runs the CBL exchange and owns an Australian environmental brokerage. Rivals compete on method mix, delivery reliability, price transparency and contract structuring for Safeguard buyers.
Which developers, sellers and venues handle ACCU flow?
| Company | Type | Role in the market |
|---|---|---|
| GreenCollar | Project developer | Carbon farming projects with land managers |
| Climate Friendly | Project developer | Carbon farming, savanna fire and credit trading services |
| LMS Energy | Project developer | Runs landfill gas projects at 68 Australian sites |
| AgriProve | Project developer | Registers and manages soil carbon projects for farmers |
| Select Carbon | Project developer | Regeneration, soil carbon and planting projects |
| Corporate Carbon | Project developer | Project services and project ownership models |
| CO2 Australia | Project developer | Large-scale revegetation and environmental projects |
| South Pole | Financial intermediary | ACCU purchasing and project development services |
| Tasman Environmental Markets | Corporate seller | Sells ACCUs and other offsets to businesses since 2014 |
| Xpansiv | Exchange and broker | Runs the CBL exchange and an Australian environmental brokerage |
Credence Research view on ACCU and SMC demand
Credence Research's view is that Australian ACCU and SMC demand will rise steadily because Safeguard baselines keep falling while emitters still lack affordable onsite abatement at scale. ACCU contracts remain the core of traded value, yet SMC bundles, options and exchange trading add the fastest growth. The current unit surplus keeps prices moderate for now, although slower growth in holdings points to tighter balances later this decade. Sellers with diverse methods, reliable delivery and clear project data should gain the most share by 2035.
How the ACCU and SMC transaction estimate was built
The report uses 2025 as the base year on a calendar basis, and market values come from the Credence Research model. That model combines regulator data on unit issuance, surrenders, holdings and spot prices, exchange releases on contract launches, and international agency data on carbon pricing. Segment splits and zone growth rates are Credence Research estimates, while zone shares follow the client-provided split. Sources used are regulator releases and data tables, government announcements, exchange and company releases and international agency publications, and no interviews or surveys were used.
Post-2030 baseline settings decide demand to 2035
The Australia carbon trading and offsets market is expected to reach USD 3.44 billion by 2035, a 15.51% CAGR during 2026–2035, as Safeguard baselines tighten and more buyers secure units through forwards, options and cleared futures. Growth should be strongest in mixed ACCU-SMC contracts, exchange trading and Western Australia, because these areas gain most from hedging needs and large emitters. A unit surplus, method reviews and post-2030 policy uncertainty could slow some sales, while the 2035 target should support demand after 2030.
Frequently Asked Questions
How big is the Australia carbon trading and offsets market?
Which product type leads ACCU and SMC trade?
Which region leads the market?
How fast do Safeguard baselines decline?
How many units did Safeguard facilities surrender for 2024-25?
When did ACCU futures start trading?
Who are the leading companies in Australian ACCU supply and trade?
What are the main challenges for unit sellers?
Table of Content
Chapter 1 Market Segmentation
- 1.1 Segmentation Framework
- 1.1.1 Product and Service Classification
- 1.1.2 Application and End-Use Classification
- 1.1.3 Technology and Solution Classification
- 1.1.4 Customer and Distribution Channel Classification
- 1.1.5 Geographic Segmentation
- 1.1.6 Market Segment Definitions and Boundaries
- 1.2 By Product Type
- 1.2.1 ACCU Contracts
- 1.2.2 SMC Contracts
- 1.2.3 Mixed ACCU-SMC Contracts
- 1.3 By Customer Segment
- 1.3.1 Safeguard Buyers
- 1.3.2 Commonwealth Procurement
- 1.3.3 Non-Safeguard Buyers
- 1.3.4 Trading Counterparties
- 1.4 By Revenue Model
- 1.4.1 Spot Settlement
- 1.4.2 Fixed-Price Forward Settlement
- 1.4.3 Option Contract Consideration
Chapter 2 Introduction
- 2.1 Report Objectives and Scope
- 2.2 Product Definition and Industry Terminology
- 2.3 Market Inclusions and Exclusions
- 2.4 Research Process
- 2.4.1 Primary Research and Expert Interviews
- 2.4.2 Secondary Research and Source Review
- 2.4.3 Top-Down and Bottom-Up Estimation
- 2.4.4 Data Triangulation and Verification
- 2.5 Market Size Measurement Basis
- 2.5.1 2025: USD 812.5 million → 2035: USD 3.44 billion
- 2.6 Historical and Forecast Reference Periods
- 2.6.1 Historical Period: 2018-2025
- 2.6.2 Base Year: 2025
- 2.6.3 Forecast Period: 2025-2035
- 2.7 Research Assumptions and Limitations
Chapter 3 Executive Summary
- 3.1 Market Snapshot and Key Findings
- 3.2 Base-Year Market Size, 2025
- 3.3 Forecast Market Size, 2035
- 3.4 Revenue and Volume Growth Outlook
- 3.5 Key Demand and Supply Indicators
- 3.6 Leading Market Segments
- 3.7 Fastest-Growing Market Opportunities
- 3.8 Regional Performance Highlights
- 3.9 Technology and Industry Transformation
- 3.10 Competitive Landscape Summary
- 3.11 Analyst View and Strategic Implications
Chapter 4 Australia Carbon Trading and Offsets Market Trends and Developments
- 4.1 Historical Industry Development, 2018-2025
- 4.2 Recent Market Trends and Developments
- 4.3 Demand and Customer Behavior Trends
- 4.4 Technology and Product Innovation
- 4.5 Artificial Intelligence, Automation and Digitalization
- 4.6 Local Manufacturing and Supply Chain Realignment
- 4.7 Industry Partnerships, Mergers and Acquisitions
- 4.8 Sustainability and Circular Economy Developments
- 4.9 Government and Private Sector Investment Trends
- 4.10 Emerging Business Models and Commercialization
- 4.11 Industry Developments and Announcements
Chapter 5 Australia Carbon Trading and Offsets Market Supply and Demand Analysis
- 5.1 Demand Trend and Consumption Analysis, 2018-2025
- 5.2 Demand Forecast, 2025-2035
- 5.3 Supply Chain Structure and Procurement Trends
- 5.4 Supply-Demand Gap and Bottlenecks
- 5.5 Import Dependence and Sourcing Structure
- 5.6 Regional Supply and Demand Concentration
Chapter 6 Australia Carbon Trading and Offsets Market Pricing Analysis
- 6.1 Pricing Structure and Measurement
- 6.2 Historical Pricing Trends, 2018-2025
- 6.3 Pricing Outlook, 2025-2035
- 6.4 Pricing by Product and Market Segment
- 6.5 Geographic Pricing Differences
- 6.6 Key Input, Energy, Labor and Logistics Costs
- 6.7 Contract Pricing and Purchasing Models
- 6.8 Pricing Sensitivity and Competitive Positioning
- 6.9 Price, Margin and Profitability Implications
Chapter 7 Australia Carbon Trading and Offsets Market Dynamics
- 7.1 Market Growth Drivers
- 7.1.1 Demand-Side Drivers
- 7.1.2 Technology and Innovation Drivers
- 7.1.3 Infrastructure and Investment Drivers
- 7.1.4 Regulatory and Policy Drivers
- 7.2 Market Restraints
- 7.2.1 Cost and Affordability Constraints
- 7.2.2 Technology and Adoption Barriers
- 7.2.3 Supply Chain and Operational Constraints
- 7.3 Market Challenges
- 7.3.1 Competitive Pressure and Margin Erosion
- 7.3.2 Skills, Infrastructure and Implementation Gaps
- 7.4 Emerging Market Opportunities
- 7.5 Market Dynamics Impact and Time-Horizon Assessment
Chapter 8 Australia Carbon Trading and Offsets Value Chain Analysis
- 8.1 Industry Value Chain Overview
- 8.2 Upstream Suppliers and Critical Inputs
- 8.3 Technology and Component Providers
- 8.4 Manufacturing or Service Delivery
- 8.5 Distribution, Channel Partners and Integrators
- 8.6 Downstream Applications and End Users
- 8.7 Value Addition and Profit Pools
- 8.8 Vertical Integration and Outsourcing
- 8.9 Supplier Concentration and Risk
- 8.10 Supply Chain Localization and Resilience
Chapter 9 Australia Carbon Trading and Offsets Market Regulations and Policies
- 9.1 Relevant Laws, Standards and Compliance Frameworks
- 9.2 Product, Service, Safety and Quality Requirements
- 9.3 Government Policies, Incentives and Subsidies
- 9.4 Imports, Exports and Trade Barriers
- 9.5 Public Procurement and Local Content Requirements
- 9.6 Data Protection, AI and Cybersecurity Compliance
- 9.7 Upcoming Policy Changes and Market Implications
Chapter 10 Australia Carbon Trading and Offsets Market Hotspots and Opportunities
- 10.1 Market Opportunity Mapping and Growth Hotspots
- 10.2 High-Growth Applications and Customer Groups
- 10.3 Underserved Markets and White-Space Opportunities
- 10.4 Emerging Technology and Product Opportunities
- 10.5 New Capacity and Investment Hotspots
- 10.6 Market Entry and Expansion Opportunities
- 10.7 Distribution and Partnership Opportunities
- 10.8 Near-Term and Long-Term Commercial Potential
- 10.9 Opportunity Attractiveness and Execution Risks
Chapter 11 Australia Carbon Trading and Offsets Market Outlook, 2025-2035
- 11.1 Market Size and Analysis
- 11.1.1 Revenue (Market Measurement: 2025: USD 812.5 million → 2035: USD 3.44 billion)
- 11.1.2 Historical Market Size, 2018-2025
- 11.1.3 Base-Year Market Size, 2025
- 11.2 Market Forecast, 2025-2035
- 11.2.1 Revenue Forecast to 2035
- 11.2.2 CAGR and Year-on-Year Growth
- 11.2.3 Incremental Revenue Opportunity
- 11.3 Forecast Assumptions and Scenario Analysis
- 11.3.1 Base-Case Forecast
- 11.3.2 Optimistic and Conservative Scenarios
- 11.3.3 Technology, Pricing and Policy Sensitivities
- 11.4 Market Attractiveness and Growth Outlook
Chapter 12 Australia Carbon Trading and Offsets Market Segmentation and Outlook
- 12.1 Segmentation Summary and Market Shares, 2025
- 12.2 Largest and Fastest-Growing Segments
- 12.3 By Product Type - Market Size and Forecast, 2025-2035
- 12.3.1 Segment Definition and Scope
- 12.3.2 Historical Market Size, 2018-2025
- 12.3.3 Revenue Forecast, 2025-2035
- 12.3.4 Base-Year Market Share, 2025
- 12.3.5 Segment CAGR and Growth Drivers
- 12.3.6 Subsegment Market Size and Forecast
- 12.3.6.1 ACCU Contracts
- 12.3.6.2 SMC Contracts
- 12.3.6.3 Mixed ACCU-SMC Contracts
- 12.3.7 Subsegment Pricing and Adoption Trends
- 12.3.8 Leading Suppliers and Competition
- 12.3.9 Regional Demand and Opportunities
- 12.4 By Customer Segment - Market Size and Forecast, 2025-2035
- 12.4.1 Segment Definition and Scope
- 12.4.2 Historical Market Size, 2018-2025
- 12.4.3 Revenue Forecast, 2025-2035
- 12.4.4 Base-Year Market Share, 2025
- 12.4.5 Segment CAGR and Growth Drivers
- 12.4.6 Subsegment Market Size and Forecast
- 12.4.6.1 Safeguard Buyers
- 12.4.6.2 Commonwealth Procurement
- 12.4.6.3 Non-Safeguard Buyers
- 12.4.6.4 Trading Counterparties
- 12.4.7 Subsegment Pricing and Adoption Trends
- 12.4.8 Leading Suppliers and Competition
- 12.4.9 Regional Demand and Opportunities
- 12.5 By Revenue Model - Market Size and Forecast, 2025-2035
- 12.5.1 Segment Definition and Scope
- 12.5.2 Historical Market Size, 2018-2025
- 12.5.3 Revenue Forecast, 2025-2035
- 12.5.4 Base-Year Market Share, 2025
- 12.5.5 Segment CAGR and Growth Drivers
- 12.5.6 Subsegment Market Size and Forecast
- 12.5.6.1 Spot Settlement
- 12.5.6.2 Fixed-Price Forward Settlement
- 12.5.6.3 Option Contract Consideration
- 12.5.7 Subsegment Pricing and Adoption Trends
- 12.5.8 Leading Suppliers and Competition
- 12.5.9 Regional Demand and Opportunities
- 12.6 Segment Growth Comparison
- 12.7 Segment Attractiveness and Priority Matrix
Chapter 13 Australia Carbon Trading and Offsets End-Use and Application Market Outlook
- 13.1 End-Use Industry and Customer Demand Structure
- 13.2 Leading Applications and Customer Groups
- 13.3 End-Use Market Size, Share and Forecast
- 13.4 Major End-Use Industry Deep Dives
- 13.4.1 Customer Requirements and Use Cases
- 13.4.2 Demand and Replacement Cycles
- 13.4.3 Technical and Regulatory Considerations
- 13.4.4 Purchasing and Procurement Models
- 13.4.5 Leading Vendors and Distribution Channels
- 13.4.6 Forecast and Commercial Opportunities
- 13.5 Emerging Applications and Cross-Segment Demand
- 13.6 End-Use Industry Investment Priorities
Chapter 14 Australia Carbon Trading and Offsets Geographic Market Outlook, 2025-2035
- 14.1 Domestic Market Distribution and Demand Clusters
- 14.2 State- or Province-Wise Market Size and Forecast, 2025-2035
- 14.3 City and Metropolitan Market Outlook
- 14.4 Industrial, Manufacturing and Commercial Clusters
- 14.5 Geographic Concentration of Key End Users
- 14.6 Local Pricing and Purchasing Differences
- 14.7 Domestic Production Facilities and Capacity Map
- 14.8 Local Infrastructure and Project Pipeline
- 14.9 State-Level Policy and Incentive Differences
- 14.10 Subnational Investment Hotspots and Opportunities
- 14.11 Distribution and Logistics Networks
- 14.12 Domestic Competitive Footprint
Chapter 15 Australia Carbon Trading and Offsets Technology, Innovation and Sustainability Outlook
- 15.1 Technology Landscape and Maturity
- 15.2 Product, Process and Service Innovation
- 15.3 AI, Automation and Digital Tools in the Industry
- 15.4 Technology Adoption and Performance Benchmarking
- 15.5 Innovation Pipeline and R&D Investment
- 15.6 Energy Efficiency and Resource Management
- 15.7 Sustainability, Recycling and Circularity
- 15.8 Technology Roadmap, 2025-2035
- 15.9 Risks of Obsolescence and Technology Substitution
Chapter 16 Australia Carbon Trading and Offsets Market Key Strategic Imperatives
- 16.1 Growth and Market Entry Priorities
- 16.2 High-Return Products and Segments
- 16.3 Pricing, Profitability and Cost Optimization
- 16.4 Technology Investment and Product Differentiation
- 16.5 Supply Chain Localization and Resilience
- 16.6 Distribution and Customer Acquisition
- 16.7 Partnership, Acquisition and Capacity Strategy
- 16.8 Regional Expansion Priorities
- 16.9 Short-, Medium- and Long-Term Actions
Chapter 17 Competition Outlook
- 17.1 Industry Competition Characteristics
- 17.2 Market Structure and Concentration
- 17.3 Market Share and Competitive Positioning, 2025
- 17.4 Company-Wise Revenue and Product Benchmarking
- 17.5 Production and Service Capacity Benchmarking
- 17.6 Technology, Pricing and Differentiation
- 17.7 Regional Footprint and Distribution Strength
- 17.8 Mergers, Acquisitions and Strategic Alliances
- 17.9 New Entrants and Competitive Threats
- 17.10 Porter's Five Forces and Industry Attractiveness
- 17.11 Competitive Outlook, 2025-2035
Chapter 18 Company Profiles
- 18.1 Company Coverage and Selection Criteria
- 18.2 GreenCollar
- 18.2.1 Business Description
- 18.2.2 Company Ownership and Geographic Presence
- 18.2.3 Product and Service Portfolio
- 18.2.4 Manufacturing and Operating Footprint
- 18.2.5 Financial Performance and Investment
- 18.2.6 Market Share and Competitive Position
- 18.2.7 Technology and Innovation Capabilities
- 18.2.8 Strategic Alliances or Partnerships
- 18.2.9 Recent Developments
- 18.2.10 Growth Strategy and Outlook
- 18.3 Climate Friendly
- 18.4 LMS Energy
- 18.5 Corporate Carbon
- 18.6 AgriProve
- 18.7 Select Carbon
- 18.8 CO2 Australia
- 18.9 South Pole
- 18.10 Tasman Environmental Markets
- 18.11 Xpansiv
- 18.12 Other Relevant Market Participants
Note: Every listed company is profiled on the structure shown under the first company. The company list is preliminary and may change based on research findings, market developments, data availability and client requirements.
Chapter 19 Disclaimer
- 19.1 Research and Forecast Disclaimer
- 19.2 Data Source and Estimation Limitations
Note: The depth of individual sections depends on data availability for this market. Volume, capacity, trade and other unit-based metrics are included where applicable.

