
Parcel sealing and wall membranes anchor demand
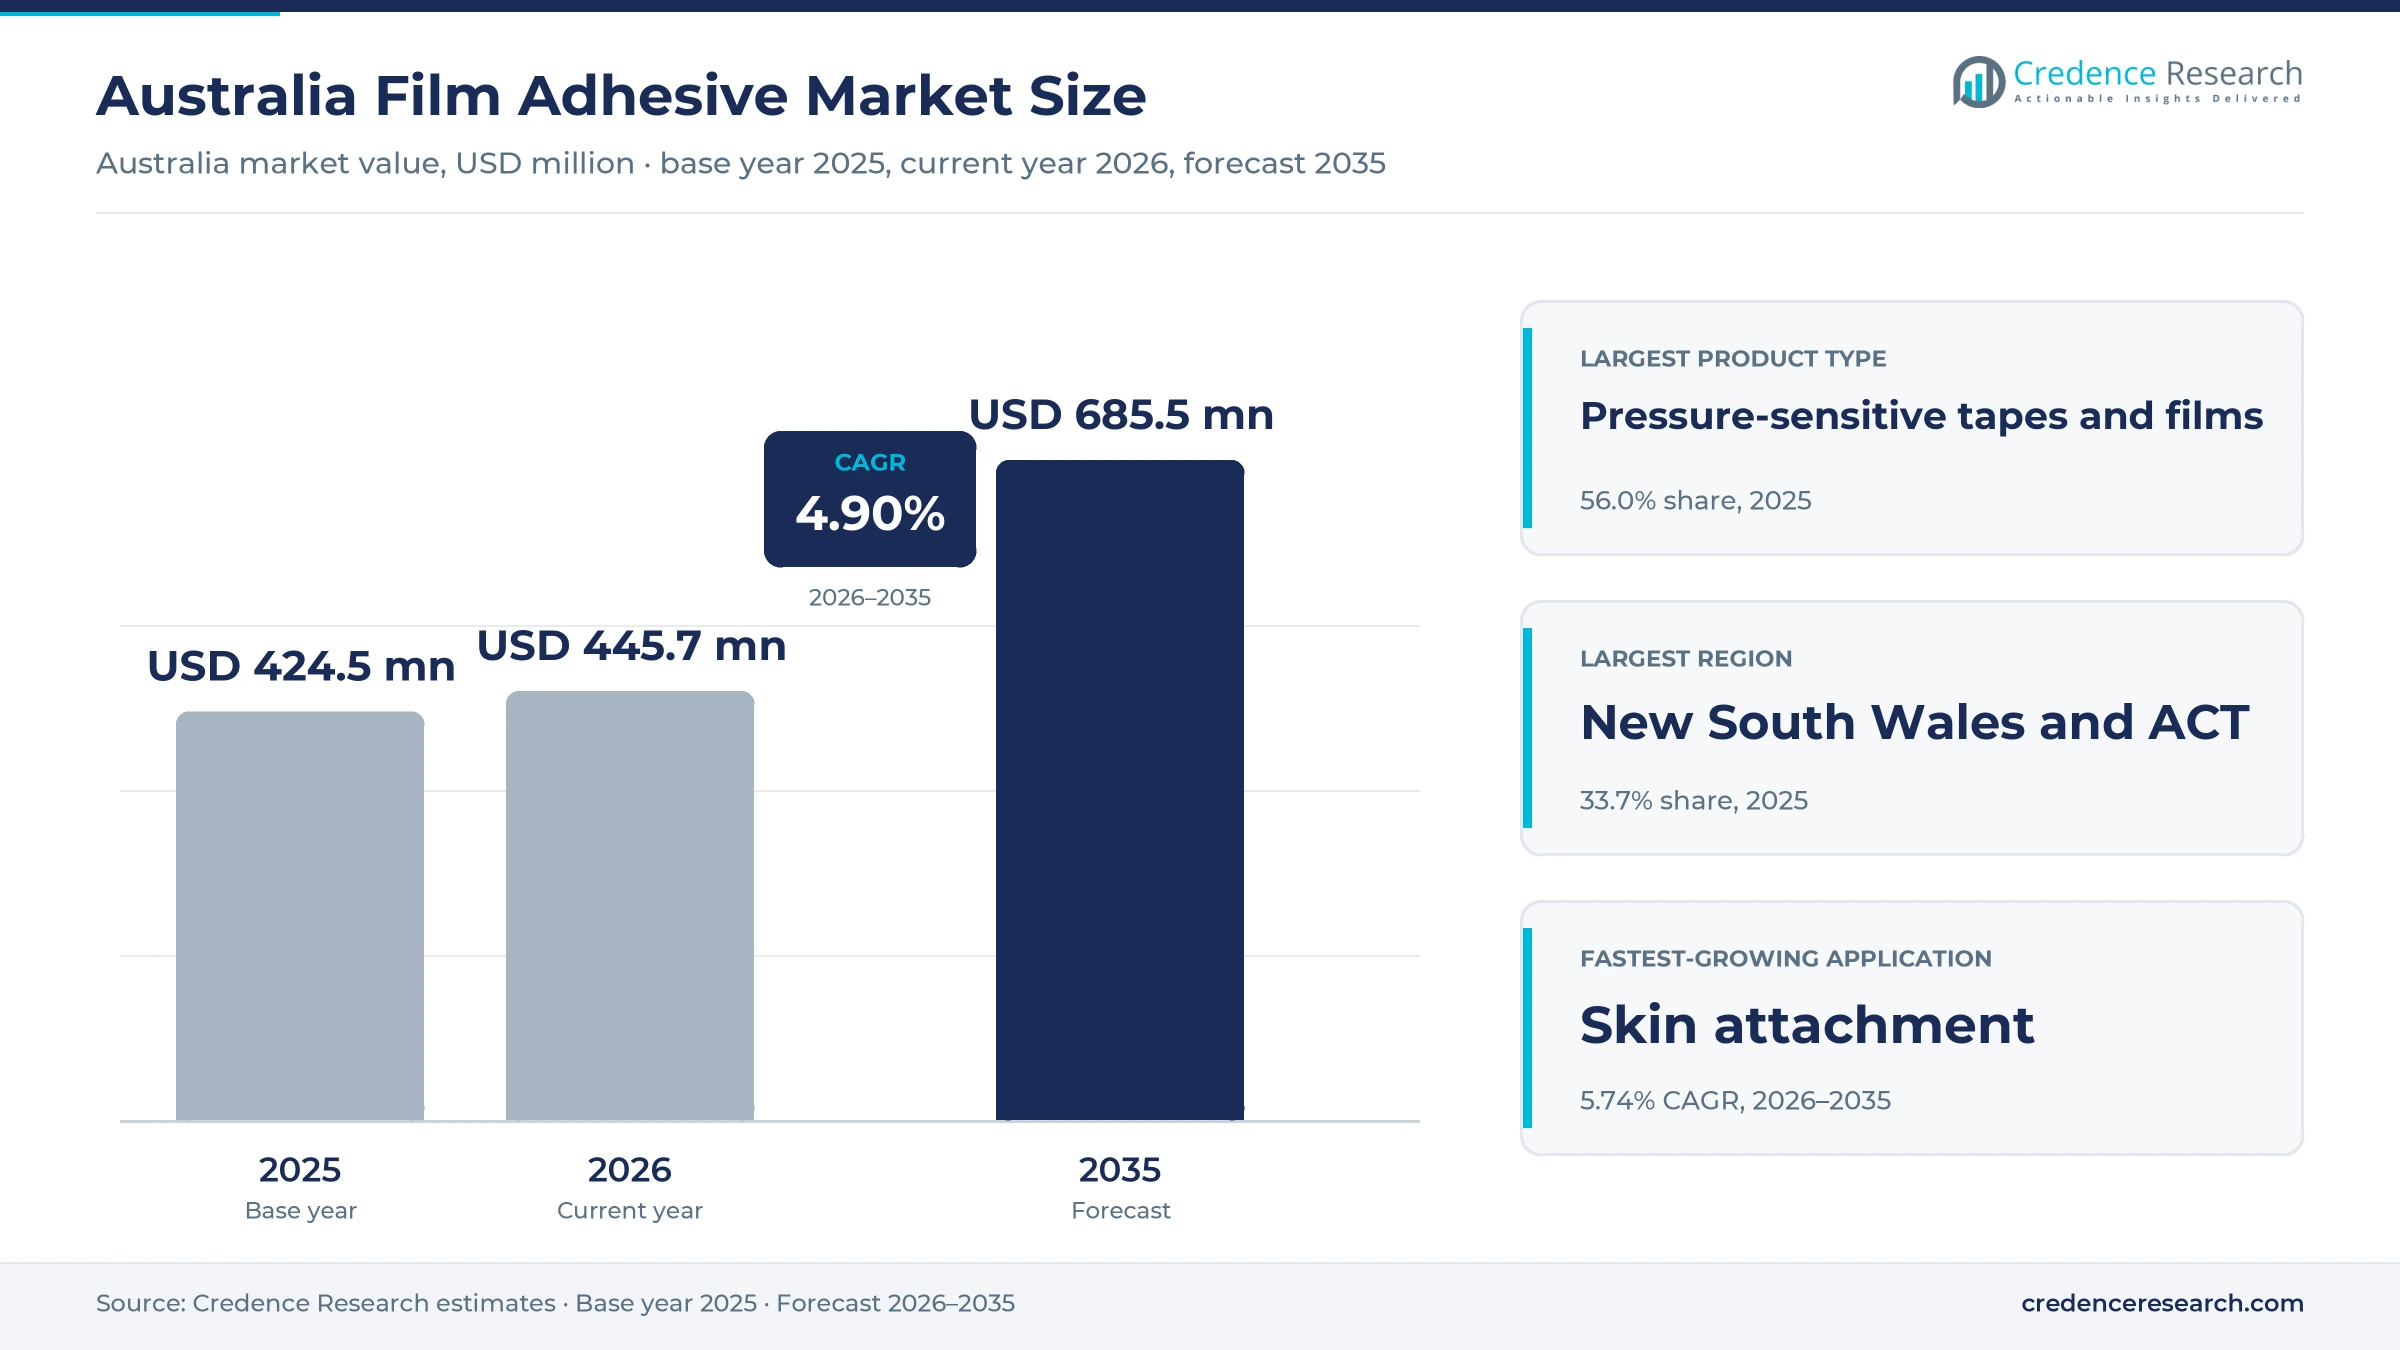
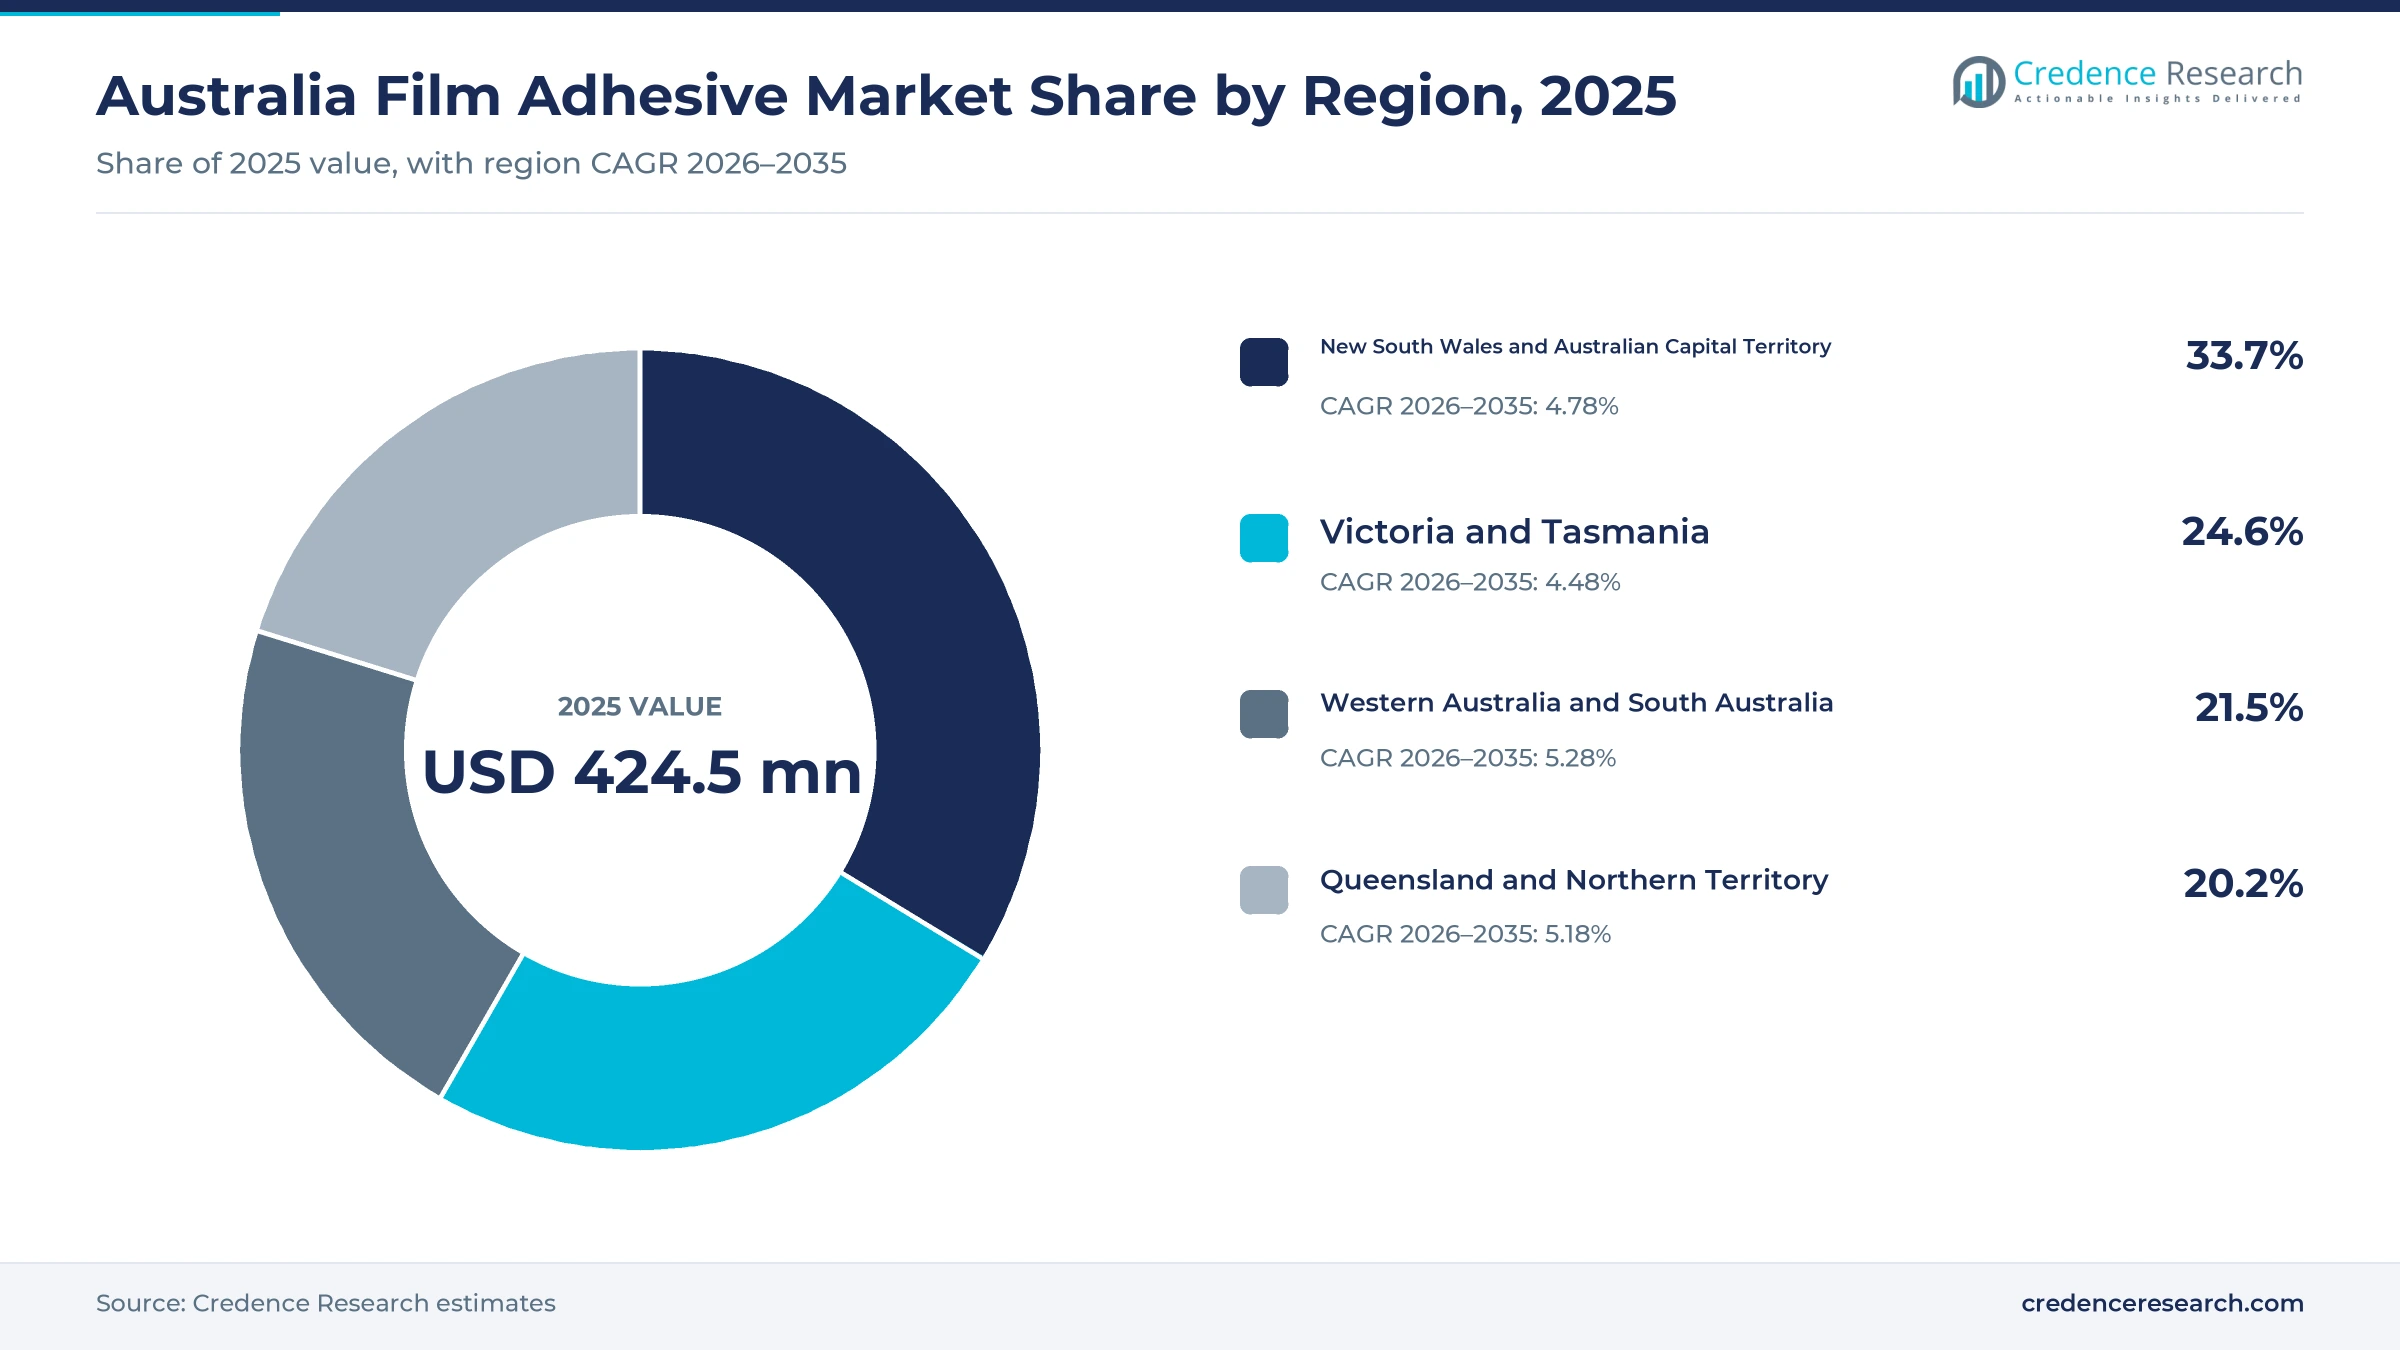
The Australia film adhesive market was valued at USD 424.5 million in 2025 and is projected to increase from USD 445.7 million in 2026 to USD 685.5 million by 2035, registering a CAGR of 4.90% during 2026–2035. Demand comes from packaging converters, builders, equipment makers, medical device suppliers and retail buyers that need bonded films, coated tapes and laminating layers rather than liquid glue. New South Wales and the Australian Capital Territory held the largest regional share, 33.7% in 2025, because most converting plants, parcel hubs and head-office buying sit in and around Sydney. Western Australia and South Australia form the fastest-growing region at 5.28% a year, as mining services, housing growth and local assembly work expand. In turn, national code changes for condensation control and tighter rules on skin-contact materials are moving buyers toward tested, documented film systems.
Which bonded film and tape products are counted?
The estimate measures spending in Australia on adhesive supplied in film or coated-web form, including pressure-sensitive tapes and films, laminating adhesive films and structural adhesive films. It covers acrylic, rubber, silicone, epoxy and polyurethane chemistries bought by converters, builders, manufacturers, medical suppliers and retail buyers. Values are stated in USD million at current prices and exclude goods and services tax.
The estimate excludes liquid and hot-melt adhesive sold in drums, sealants, structural fasteners and the base films sold without an adhesive layer. The value chain runs from overseas and local adhesive makers through coating and slitting converters, technical distributors and retail channels to end users in every state.
Australia Film Adhesive Market Insights
- The Australia film adhesive market was valued at USD 424.5 million in 2025 and is projected to reach USD 685.5 million by 2035, at a 4.90% CAGR during 2026–2035.
- New South Wales and the Australian Capital Territory held a 33.7% share of 2025 value, because converting, warehousing and parcel handling concentrate around Sydney.
- Pressure-sensitive tapes and films led product types with a 56.0% share of 2025 value, as carton sealing, surface protection and labelling run on coated webs.
- Online spending reached A$82.6 billion in 2025, up 13.9% on a year earlier, which lifts repeat carton sealing and labelling volume.
- Skin attachment grows fastest among applications at 5.74% a year during 2026–2035, as hospitals and home users buy tested dressing and sensor grades.
Tape and film grades lead while structural layers gain
Why do coated tapes and films hold the largest share?
Based on product type, the market is categorized into pressure-sensitive tapes and films, lamination adhesive films and structural adhesive films. Pressure-sensitive tapes and films led with a 56.0% share of 2025 value, because every parcel, label and protected panel uses a coated web that bonds on contact. Structural adhesive films grow fastest at 5.67% a year, as builders and equipment makers replace rivets and wet glue with cut film layers.
How much demand sits with packaging converters?
Based on end-use industry, the market is categorized into packaging, building and construction, transport and equipment, medical and consumer and stationery. Packaging led with a 38.0% share of 2025 value, because cartons, labels and protective wraps consume film adhesive on every order. Medical grows fastest at 5.69% a year, as dressings, wearable monitors and device assembly need documented grades.
Which chemistry suits Australian conditions best?
Based on technology, the market is categorized into acrylic adhesives, rubber and silicone adhesives, and epoxy and polyurethane adhesives. Acrylic adhesives led with a 52.0% share of 2025 value, because acrylic systems hold up through heat, humidity and long storage in warehouses. Acrylic adhesives grow fastest at 5.26% a year, as water-based and solvent-free coatings replace older rubber grades in tape lines.
Is skin attachment the fastest-moving use?
Based on application, the market is categorized into sealing and labelling, surface protection, component bonding and skin attachment. Sealing and labelling led with a 41.0% share of 2025 value, because carton closing and label stock run through warehouses every working day. Skin attachment grows fastest at 5.74% a year, as hospitals and home users buy tested dressing and sensor grades.
| Segment Group | Leading Sub-segment | Share, 2025 | Fastest-growing Sub-segment | CAGR, 2026–2035 |
|---|---|---|---|---|
| By Product Type | Pressure-sensitive tapes and films | 56.0% | Structural adhesive films | 5.67% |
| By End-Use Industry | Packaging | 38.0% | Medical | 5.69% |
| By Technology | Acrylic adhesives | 52.0% | Acrylic adhesives | 5.26% |
| By Application | Sealing and labelling | 41.0% | Skin attachment | 5.74% |
Request a Free Sample
Fill in your details and we'll send you a free sample report.
- Sample data tables & charts
- Research methodology
Parcels, building rules and skin-contact use lift volume
How does repeat parcel sealing raise film volume?
Repeat parcel sealing raises film volume, because every carton that leaves a warehouse needs closing tape, a label face stock and often a protective layer. Online spending reached A$82.6 billion in 2025, up 13.9% on a year earlier, and 9.8 million households shopped online, according to reported national postal data. Australia Post also runs more than 1,200 parcel lockers, which spreads handling and repacking across suburban networks. Because this demand repeats with each order rather than each building or vehicle, packaging holds the largest end-use share at 38.0% of 2025 value, and sealing and labelling lead every other application by volume. In turn, converters that supply pressure-sensitive tapes and labels plan capacity around steady parcel flow.
Why do building-envelope rules add bonded layers?
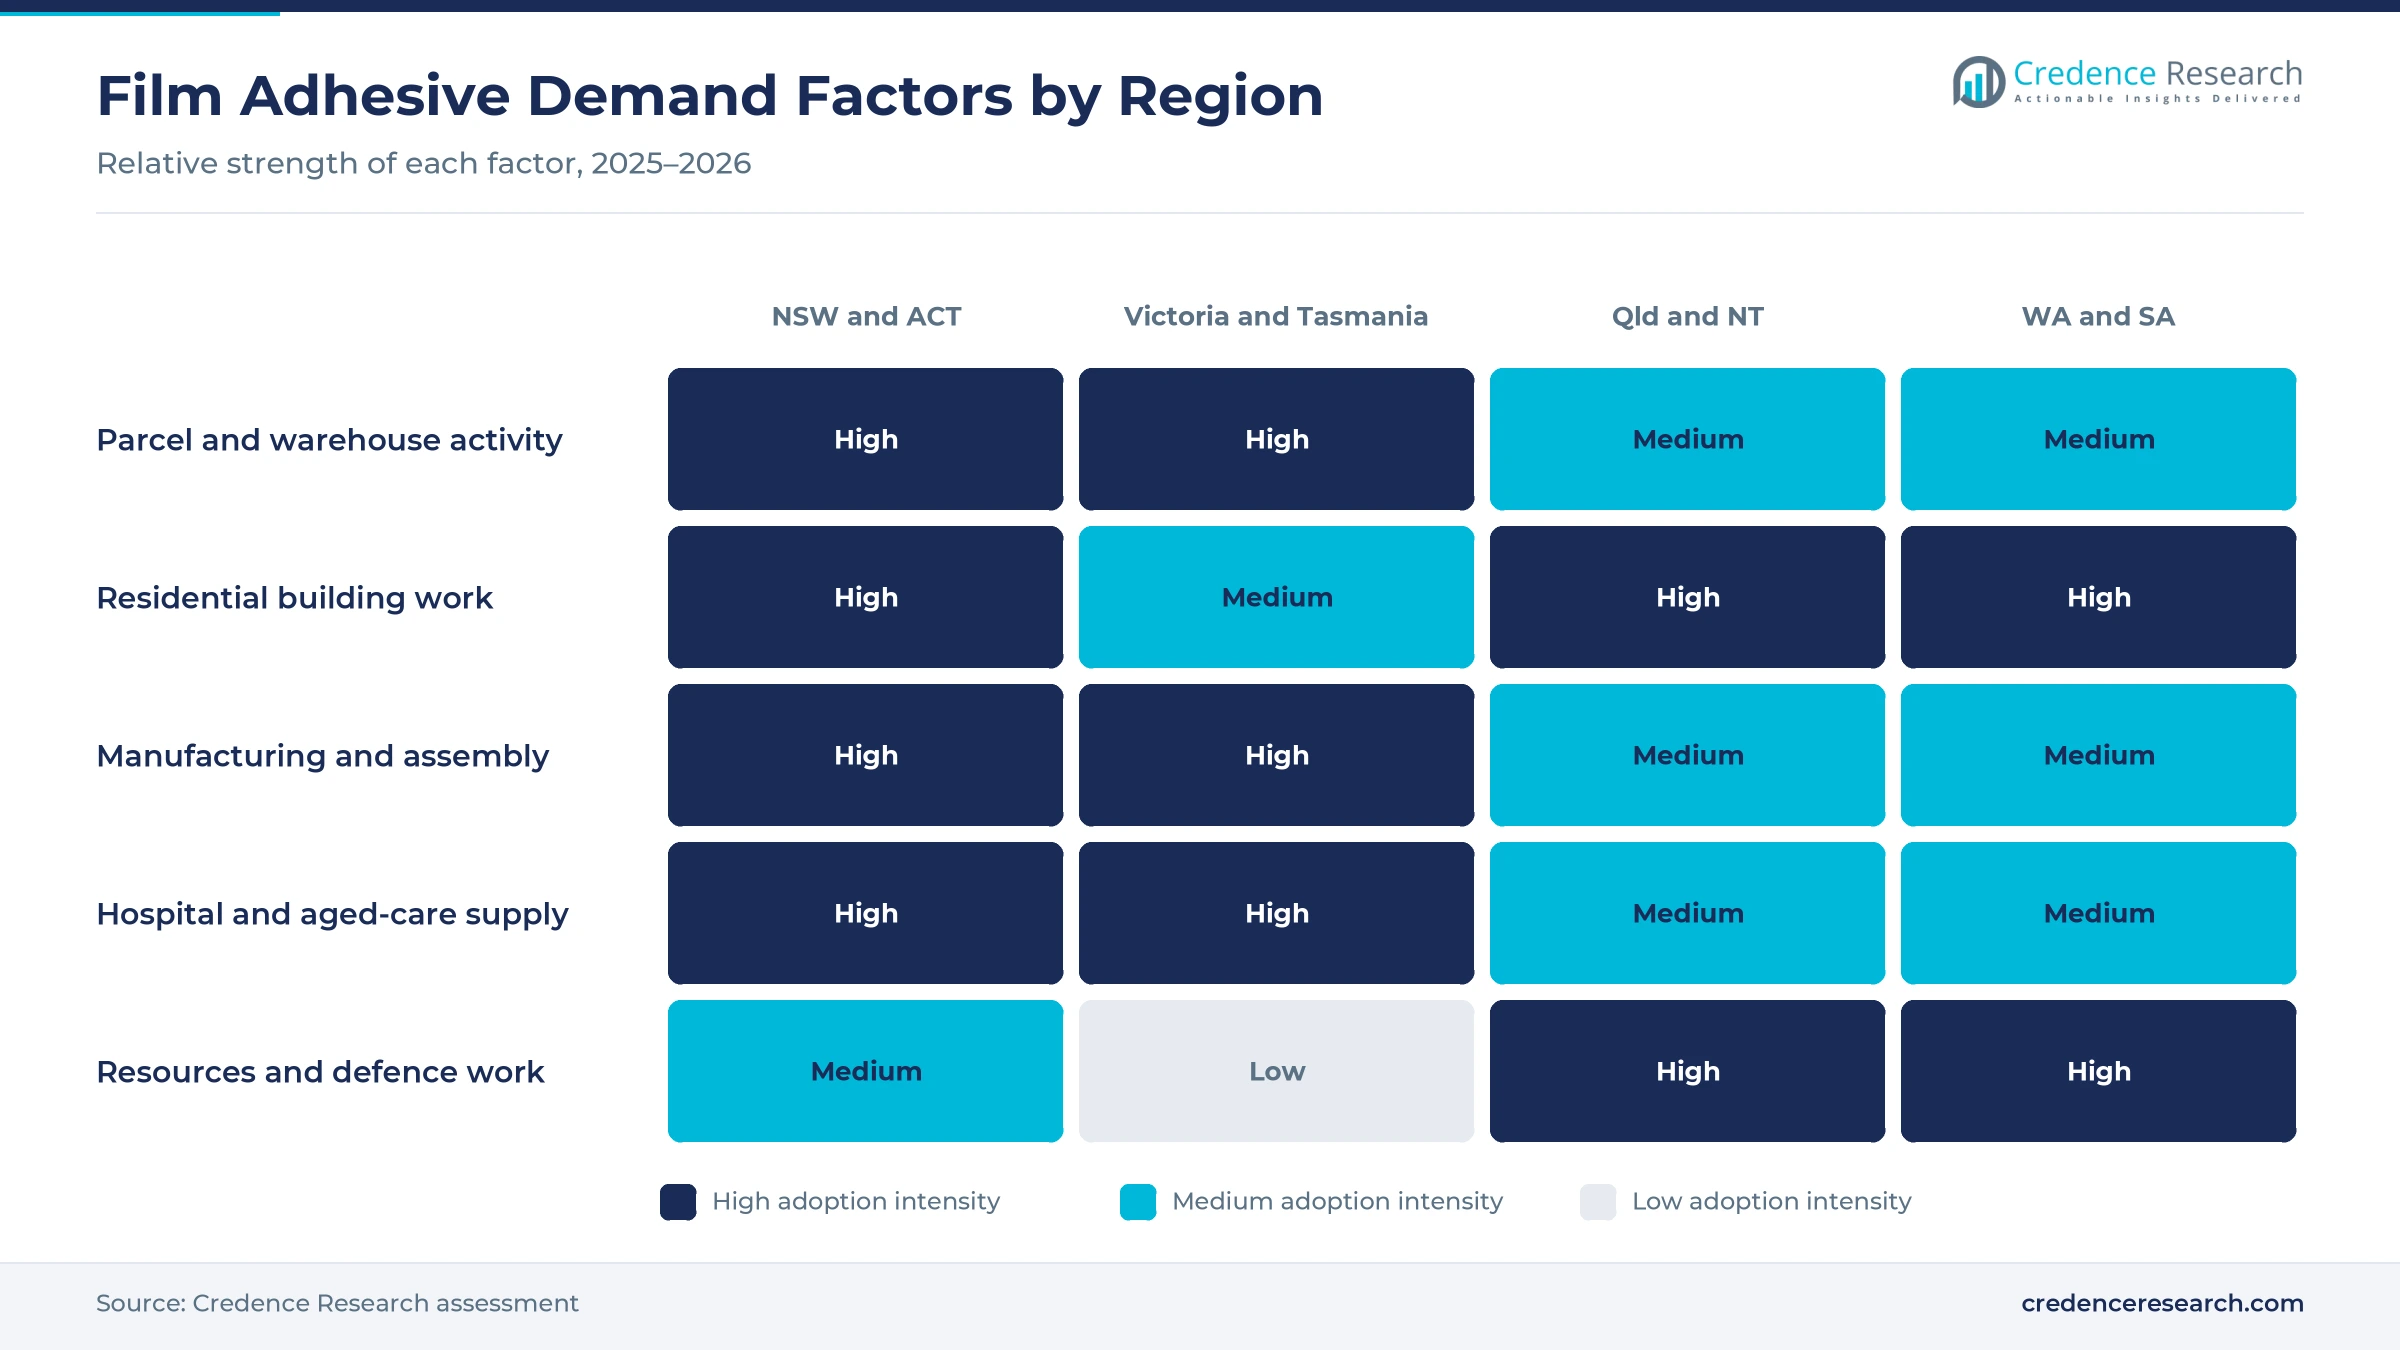
Building-envelope rules add bonded layers, because sealed wall and roof systems need taped joints, bonded membranes and continuous laps that hold through decades of service. Building ministers agreed on Oct. 22, 2025, that the next national code edition would be published by Feb. 1, 2026, with adoption open from May 1, 2026, and condensation mitigation included, according to the ministers' communique. Pliable building membranes in external walls must comply with AS/NZS 4200.1 and sit outside the primary insulation layer, with minimum vapor permeance set by climate zone. Approvals reached 205,249 dwellings in 2025-26, up 9.2% on the previous year, the strongest result in five years. As a result, building and construction demand grows faster than the national average and lifts bonded film use in building construction.
What drives qualified skin-contact film demand?
Qualified skin-contact film demand grows, because dressings, sensors and wearable devices need adhesive layers that pass biocompatibility and wear testing before a hospital will buy them. On June 24, 2026, the adhesive formulator Fuller announced a recommended cash offer for Advanced Medical Solutions, naming tissue adhesives, tapes and dressings as the acquired portfolio, according to the company announcement. The same formulator agreed in December 2024 to buy Medifill in Ireland and GEM in Italy, whose devices are certified for more than 80 internal indications. People aged 65 and over made up 18.1% of the Australian population in 2025, according to World Bank population data. Consequently, medical demand grows fastest among end uses at 5.69% a year.
How does population growth spread demand westward?
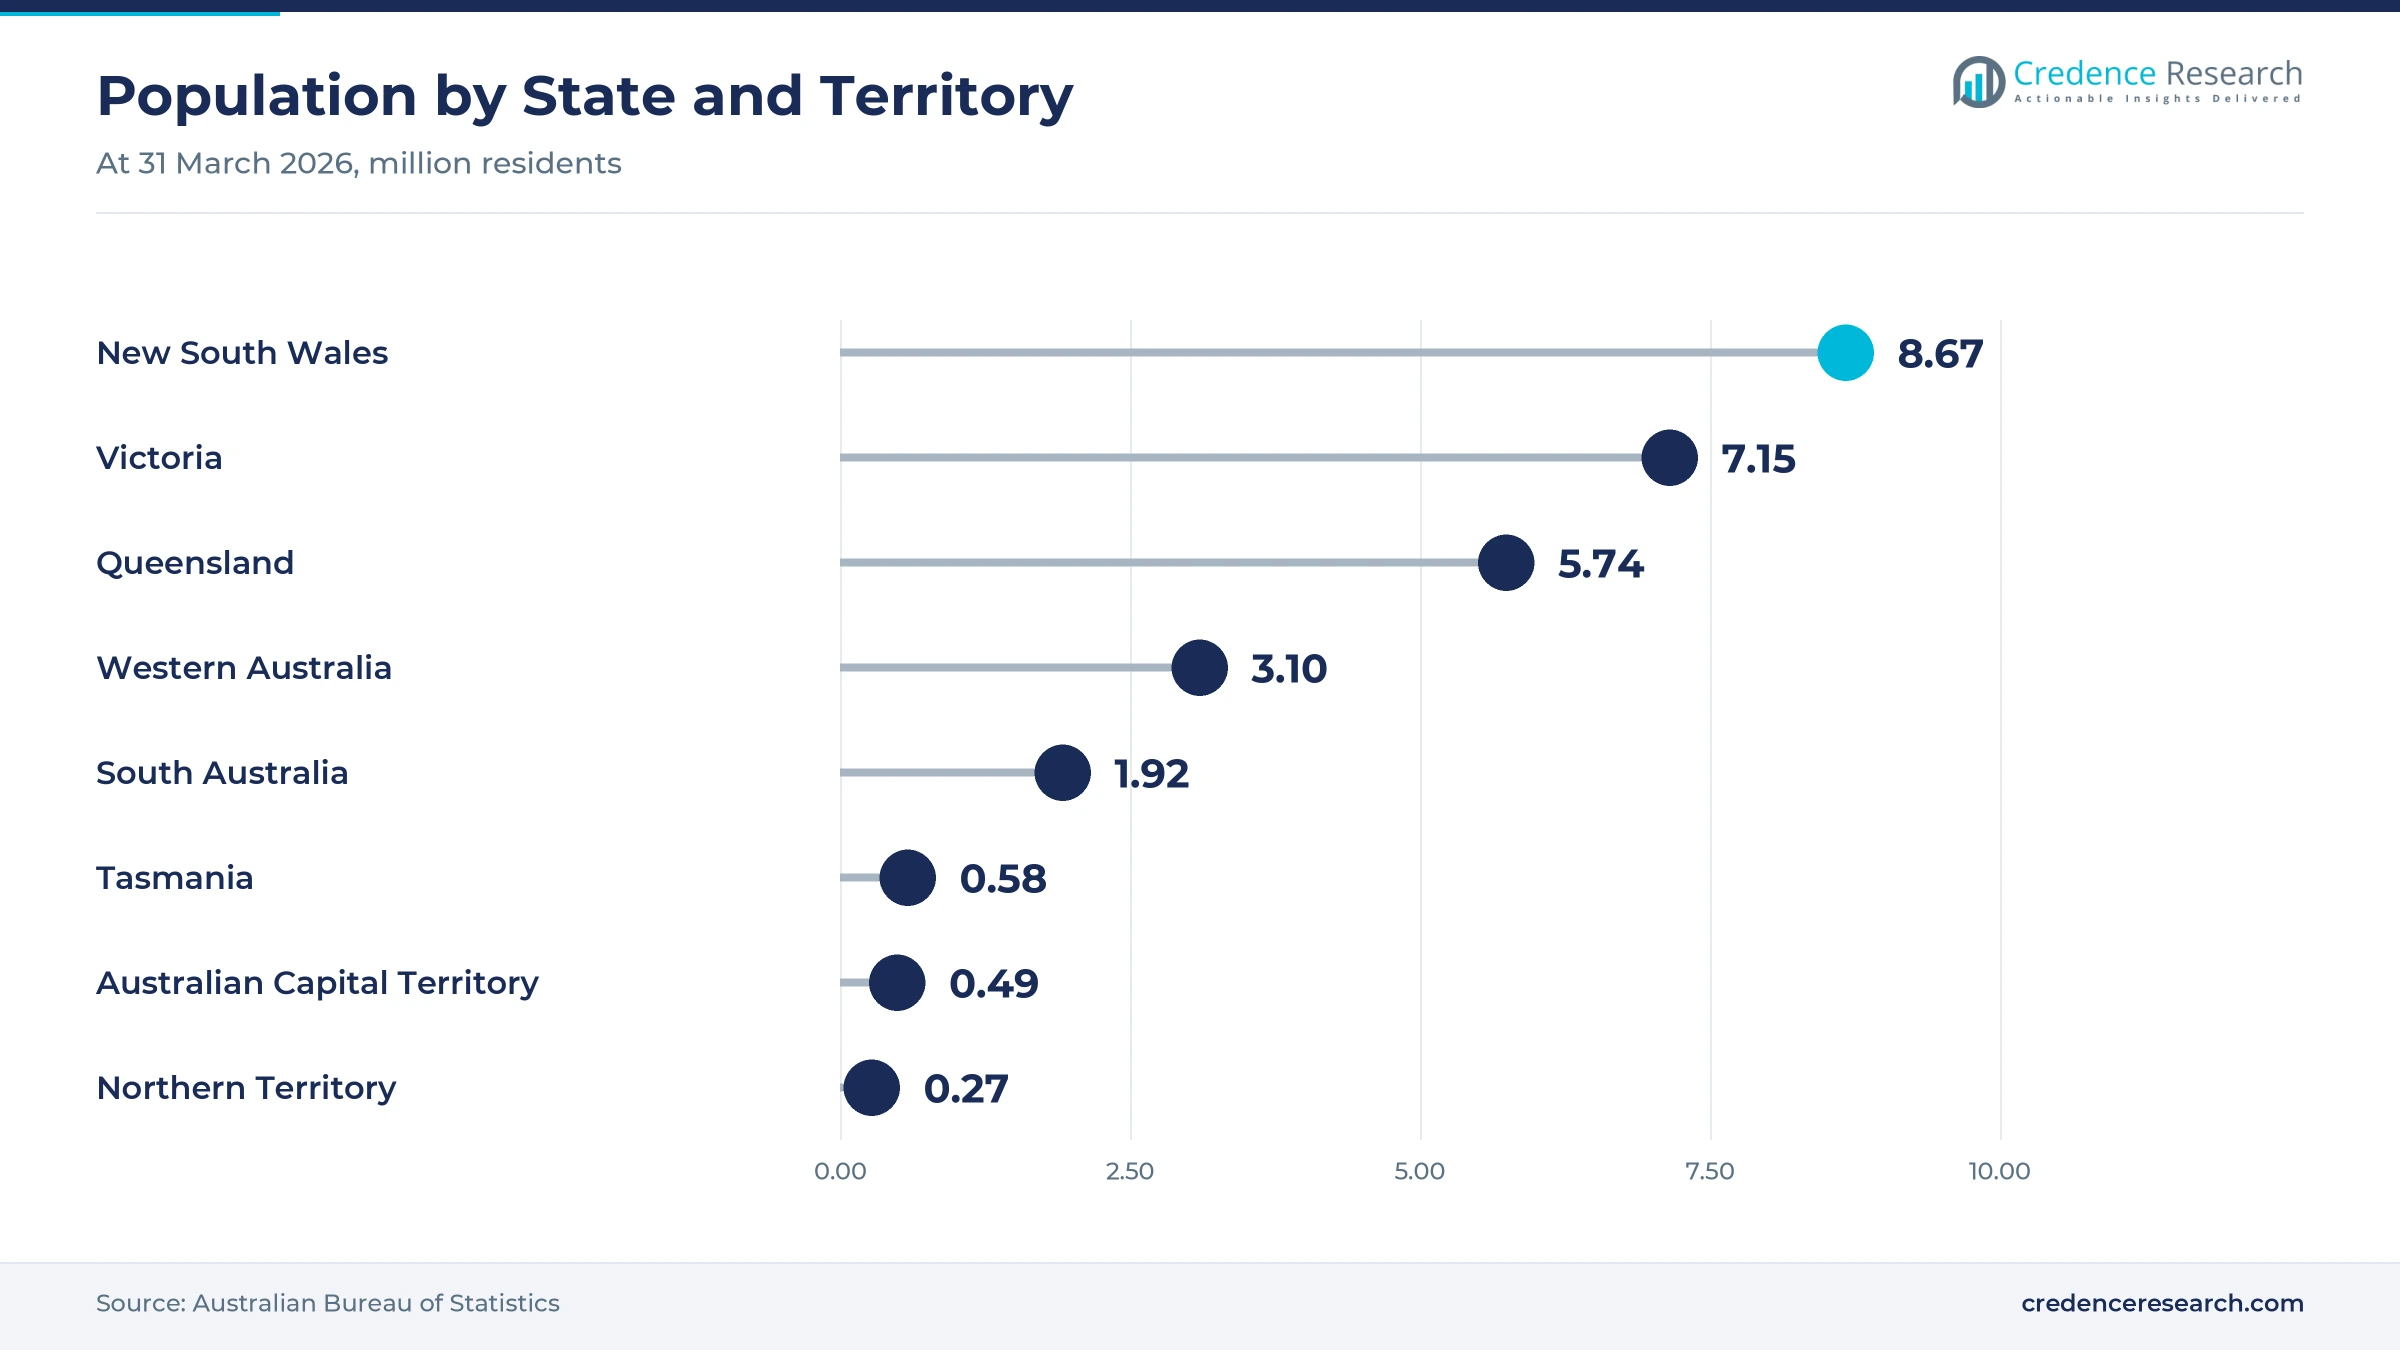
Population growth spreads demand westward, because new households, clinics, shops and warehouses all consume bonded film close to where people live. Australia reached 27,921,200 residents at March 2026, growing 1.4% over the year, while Western Australia grew fastest at 2.1%, according to national population statistics. New South Wales grew more slowly at 1.1%, even though it remains the largest state by population with 8,670,100 residents. Tasmania grew 0.6%, the slowest of any state, so volume there leans on existing industry rather than on new building work. In turn, Western Australia and South Australia together form the fastest-growing region through 2035, while New South Wales and the Australian Capital Territory keep the largest share of national spending.
Water-based grades and local slitting gain ground
Why are water-based acrylic grades gaining ground?
Water-based acrylic grades are gaining ground, because buyers want lower solvent emissions, longer shelf life and stable bonds through Australian heat and humidity. Acrylic systems led technologies with a 52.0% share of 2025 value and also grow fastest at 5.26% a year. Rubber and silicone grades keep niche work in masking, splicing and release liners, yet they lose share as tape lines convert to water-based coating. Fuller lists polymer technology among its regional capabilities and runs three manufacturing locations across Australia and New Zealand. Queensland and the Northern Territory, which hold a 20.2% share of 2025 value, face the hottest storage conditions, where acrylic films hold their bond better than older rubber grades.
How is local slitting changing supply to converters?
Local slitting is changing supply, because long freight routes make imported finished rolls slow and costly for small orders. Australia Post runs more than 1,200 parcel lockers, and 9.8 million households bought online in 2025, so converters need stock held in country rather than on water. The average online basket fell to A$95 in 2024, its lowest in a decade, so parcel counts grew faster than order values and lifted tape use for each dollar sold. tesa tape Australia operates from Eastern Creek in western Sydney, close to parcel and manufacturing customers in the eastern states. Fuller bought Advanced Adhesives, based in Sydney and Auckland, in 2016 and folded its manufacturing into regional operations. As a result, buyers increasingly split orders between imported master rolls and locally slit widths cut to machine specification.
Can wearable and dressing grades open a clear opening?
Wearable and dressing grades open a clear opening, because hospitals, aged-care providers and home users need attachment layers that stay on skin without irritation. Skin attachment grows fastest among applications at 5.74% a year, from a 41.0% base held by sealing and labelling. Advanced Medical Solutions supplies tapes and dressings alongside tissue adhesives, which shows how film layers travel with device portfolios. The share of residents aged 65 and over reached 18.1% in 2025, up from 17.7% a year earlier. Because a tested grade is hard to replace once specified, suppliers that qualify early hold positions in medical tape supply for years.
Where does protected-panel shipping create new volume?
Protected-panel shipping creates new volume, because sheet metal, glass, appliance fronts and building panels travel long distances and arrive scratched without a temporary film. Surface protection ranked second among applications in 2025, behind carton sealing and labelling work. Structural adhesive films grow fastest among product types at 5.67% a year, as panel and equipment makers specify bonded layers instead of mechanical fixings. Dwelling approvals of 205,249 in 2025-26 move doors, glazing and cladding to sites in every state. Because freight between Perth, Adelaide and the east coast is costly, protection film travels with high-value goods. In turn, converters that also supply high-barrier packaging can sell protective grades into the same accounts.
Import reliance, freight and testing costs slow growth
How does import reliance affect film pricing?
Import reliance affects pricing, because most adhesive films, carriers and release liners arrive from overseas coating plants. Currency moves and shipping delays then reach buyers as higher prices and longer lead times on special widths. As a result, converters hold more stock than their order books require, which ties up working capital. Suppliers respond by slitting master rolls locally and keeping common widths in Australian warehouses, so routine orders ship within days rather than waiting on a vessel.
Why do freight distances limit smaller buyers?
Freight distances limit smaller buyers, because a roll shipped from Sydney to Perth costs far more than the same roll moved within a single city. Western Australia and South Australia together hold a 21.5% share of 2025 value spread across a very wide area. Consequently, small converters pay more for each square meter than national accounts with contract freight rates. Distributors respond with regional stock points and consolidated delivery runs that share transport cost across several customers.
What testing costs slow new grade adoption?
Testing costs slow adoption, because skin-contact and construction grades need documented performance before a specifier will accept them. Membrane products must meet AS/NZS 4200.1 in external walls, and medical layers need biocompatibility and wear data from accredited laboratories. In turn, smaller suppliers struggle to fund qualification work for a market of this size. Larger groups respond by selling tested platforms into several countries at once, which spreads the cost of each approval across far more volume.
Can local converters match imported finished rolls?
Imported finished rolls pressure local converters, because overseas plants run longer lines at lower unit cost. Retail and stationery grades face the sharpest price competition, and consumer and stationery demand grows slowest among the five end uses in this report. As a result, local businesses move toward custom widths, printed tapes and technical grades that reward short lead times. Service, application support and the ability to hold qualified stock then matter more to buyers than a published list price.
Sydney converting leads while the west grows fastest
| Region | Value, 2025 (USD million) | Share, 2025 | CAGR, 2026–2035 |
|---|---|---|---|
| New South Wales and Australian Capital Territory | 143.1 | 33.7% | 4.78% |
| Victoria and Tasmania | 104.4 | 24.6% | 4.48% |
| Western Australia and South Australia | 91.3 | 21.5% | 5.28% |
| Queensland and Northern Territory | 85.7 | 20.2% | 5.18% |
Converting and parcel hubs keep the Sydney region ahead
New South Wales and the Australian Capital Territory held a 33.7% share of 2025 value and grow at 4.78% a year. The state had 8,670,100 residents at March 2026, the most of any state, which concentrates warehousing and label printing. tesa tape Australia operates from Eastern Creek in western Sydney, close to those customers. Because head offices also buy for national networks from Sydney, specification decisions for tape and film grades are often made in this region rather than where the rolls are used.
Melbourne manufacturing anchors Victoria and Tasmania
Victoria and Tasmania held a 24.6% share of 2025 value and grow at 4.48% a year. Victoria had 7,154,200 residents at March 2026 and grew 1.6% over the year, while Tasmania had 580,700 residents and grew 0.6%, the slowest rate in the country. Victorian plants convert packaging, vehicle parts and appliance components that use laminating and protective layers. As a result, demand here leans on established manufacturing and food packaging rather than on new construction work.
Why do the western and southern states grow fastest?
Western Australia and South Australia held a 21.5% share of 2025 value and grow fastest at 5.28% a year. Western Australia grew 2.1% in the year to March 2026, the fastest of any state, reaching 3,096,200 residents. South Australia reached 1,916,800 residents after 1.0% growth over the same twelve months. Because mining services, defense work and new housing all order protected panels and sealed building systems, film adhesive volume in these states rises faster than the national average through 2035.
Housing growth lifts Queensland and the Northern Territory
Queensland and the Northern Territory held a 20.2% share of 2025 value and grow at 5.18% a year. Queensland had 5,739,500 residents at March 2026 after 1.6% growth, while the Northern Territory had 268,900 after 1.5% growth. Humid, hot conditions in both places favor acrylic systems over rubber grades for carton sealing and membrane taping. In turn, residential building and distribution work around Brisbane carries most of the regional volume.
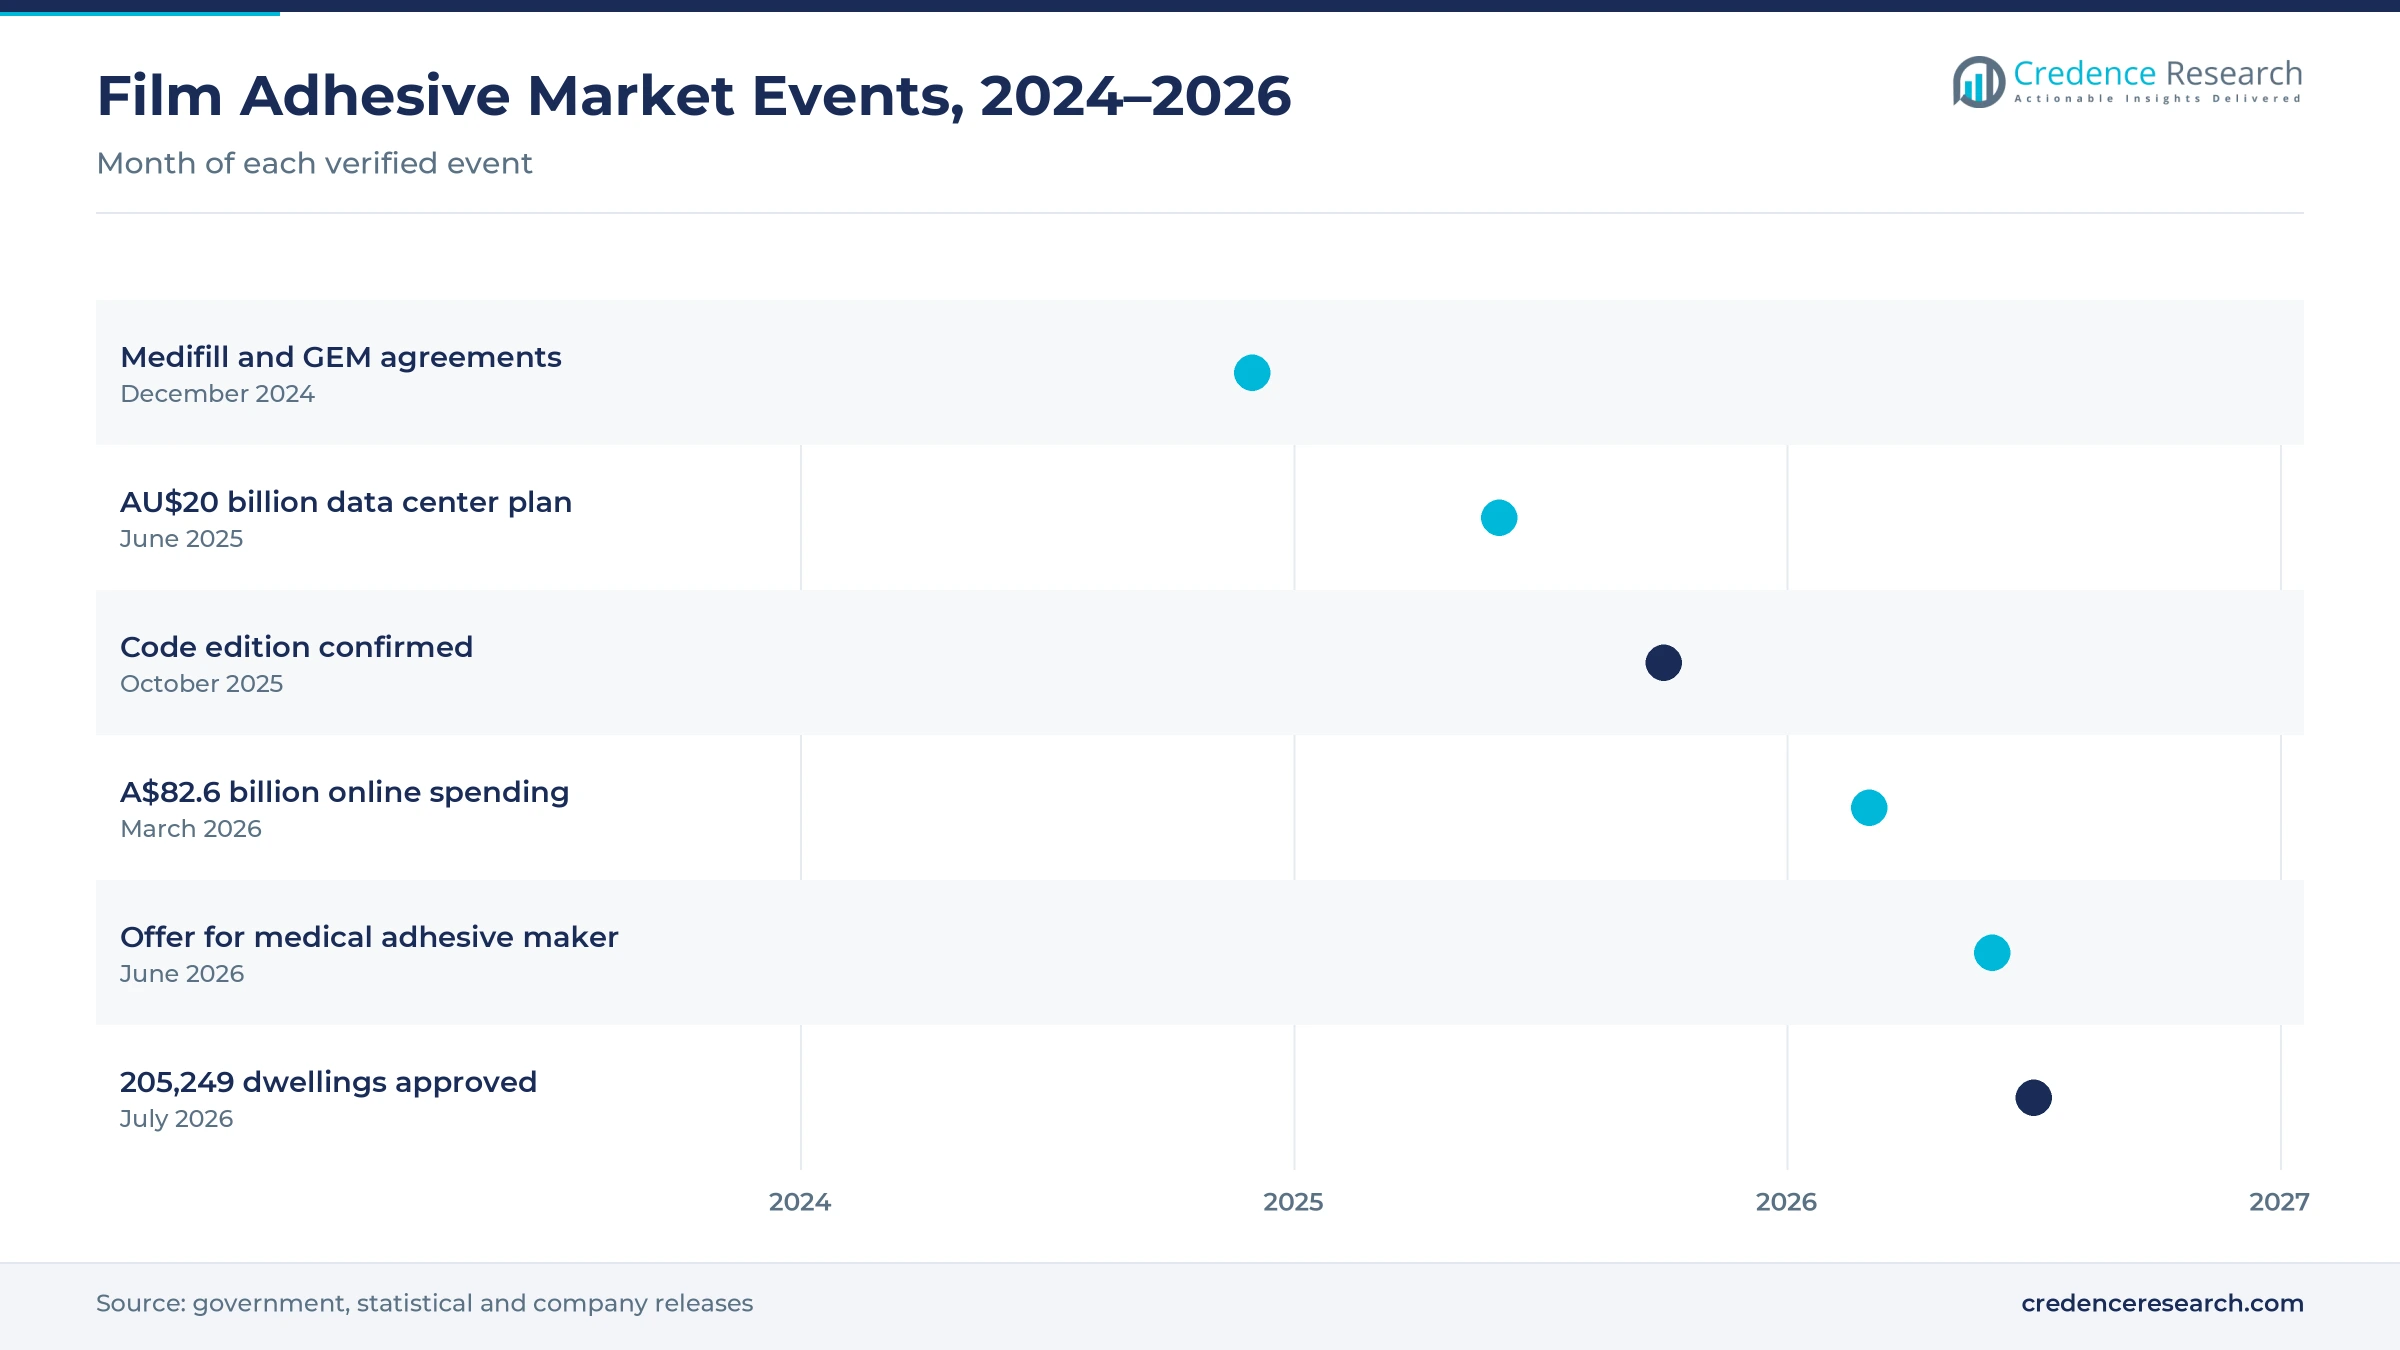
Deals, code changes and demand data, 2024–2026
| Development | Status and market relevance |
|---|---|
| In December 2024, H.B. Fuller agreed to acquire Medifill in Ireland and GEM in Italy for medical adhesive work. | Builds tested skin-contact portfolio |
| In June 2025, Amazon set out a plan to invest AU$20 billion in Australian data center infrastructure to 2029. | Adds protected equipment shipments |
| In October 2025, building ministers confirmed the next national construction code for publication by February 2026. | Keeps condensation control in scope |
| In March 2026, national postal data put 2025 online spending at A$82.6 billion, up 13.9% on a year earlier. | Supports repeat parcel sealing volume |
| In June 2026, H.B. Fuller announced a recommended offer for Advanced Medical Solutions and its tapes and dressings. | Signals medical film adhesive focus |
Acrylic, rubber and reactive chemistries compete
- Acrylic systems hold bonds through heat, humidity and long storage, which suits carton sealing, labelling and membrane taping across the country.
- Rubber and silicone systems grip quickly at low temperature and release cleanly, so they stay in masking, splicing and liner work.
- Epoxy and polyurethane films cure into structural layers that carry load, which lets builders and equipment makers replace rivets and wet glue.
- Carrier and liner choice decides how a roll converts, because paper, polyester and polypropylene webs each slit, print and dispense differently.
Need a Custom Version of This Report?
Tailor the scope, geography, or segments to your exact requirements.
- Custom geography or segment scope
- Direct access to our analyst team
Suppliers compete on service and qualified grades
Competition runs between global adhesive formulators, international tape brands and local converters that coat, slit and print to order. Fuller promotes packaging, woodworking, paper converting and polymer capability across Australia and New Zealand from three manufacturing locations, and it bought Sydney-based Advanced Adhesives in 2016 to add regional manufacturing. Its December 2024 agreements for Medifill and GEM, followed by the June 2026 offer for Advanced Medical Solutions, point supply toward tested skin-contact layers. tesa tape Australia serves eastern customers from Eastern Creek in western Sydney, while 3M lists bonding, mounting, foam and packaging tape ranges on its Australian site. Avery Dennison runs a Berrinba distribution center in Brisbane that supplies label and graphic materials to east coast customers, and Bostik makes adhesives and sealants at Thomastown in Victoria. Local converters compete on slitting speed, custom widths and technical service, because imported finished rolls arrive cheaply in standard sizes.
Which suppliers have verified Australian film adhesive activity?
| Company | Type | Role in the market |
|---|---|---|
| H.B. Fuller | Global formulator | Three manufacturing locations across Australia and New Zealand |
| 3M Australia | International tape brand | Sells bonding, mounting, foam and packaging tapes on its Australian site |
| Avery Dennison Australia | Label materials supplier | Berrinba distribution center in Brisbane serves east coast customers |
| tesa tape Australia | International tape brand | Australian operation based at Eastern Creek in Sydney |
| Bostik Australia | Local adhesive manufacturer | Makes adhesives and sealants at its Thomastown plant in Victoria |
Credence Research sees medical and west-coast gains
Credence Research's view is that Australian film adhesive demand will grow steadily through 2035, because parcel sealing, sealed building envelopes and tested medical layers each repeat rather than depend on one project cycle. Pressure-sensitive tapes and films should keep the largest product share, while structural films and skin attachment grow fastest. New South Wales and the Australian Capital Territory will stay the largest region, although the western and southern states add volume faster. However, import reliance, freight distance and qualification costs will reward suppliers holding local stock and documented grades.
Converted area and recoating cycles anchor the model
The report uses 2025 as the base year, with values in USD million at current prices. Market values come from the Credence Research model, which combines converted film area, tape consumption per parcel and building, recoating and replacement cycles, and price tiers by grade. The four regional groups and their 2025 shares follow the client brief, while regional growth rates and the splits by product type, end-use industry, technology and application are Credence Research estimates. Sources used are official statistics, government communiques, regulator and standards documents, company announcements and supplier pages, and no interviews or surveys were used.
Qualified film grades shape demand through 2035
The market is expected to reach USD 685.5 million by 2035, a 4.90% CAGR during 2026–2035, as parcel volume, sealed building systems and tested medical layers keep demand rising. Spending is projected to rise from USD 445.7 million in 2026 as converters add capacity and builders adopt the newer code requirements. Growth should be strongest in structural adhesive films, skin attachment and the western and southern states, while packaging keeps the largest end-use share. In contrast, import reliance and long freight routes could hold back smaller converters in some years.
Frequently Asked Questions
How big is the Australia film adhesive market?
Which region leads demand?
Which region grows fastest?
Which product type holds the largest share?
Which application grows fastest?
How do building code changes affect demand?
Who are the leading companies in this market?
What are the main risks to growth?
Table of Content
Chapter 1 Market Segmentation
- 1.1 Segmentation Framework
- 1.1.1 Product and Service Classification
- 1.1.2 Application and End-Use Classification
- 1.1.3 Technology and Solution Classification
- 1.1.4 Customer and Distribution Channel Classification
- 1.1.5 Geographic Segmentation
- 1.1.6 Market Segment Definitions and Boundaries
- 1.2 By Product Type
- 1.2.1 Pressure-sensitive tapes and films
- 1.2.2 Lamination adhesive films
- 1.2.3 Structural adhesive films
- 1.3 By End-Use Industry
- 1.3.1 Packaging
- 1.3.2 Building and construction
- 1.3.3 Transport and equipment
- 1.3.4 Medical
- 1.3.5 Consumer and stationery
- 1.4 By Technology
- 1.4.1 Acrylic adhesives
- 1.4.2 Rubber and silicone adhesives
- 1.4.3 Epoxy and polyurethane adhesives
- 1.5 By Application
- 1.5.1 Sealing and labelling
- 1.5.2 Surface protection
- 1.5.3 Component bonding
- 1.5.4 Skin attachment
Chapter 2 Introduction
- 2.1 Report Objectives and Scope
- 2.2 Product Definition and Industry Terminology
- 2.3 Market Inclusions and Exclusions
- 2.4 Research Process
- 2.4.1 Primary Research and Expert Interviews
- 2.4.2 Secondary Research and Source Review
- 2.4.3 Top-Down and Bottom-Up Estimation
- 2.4.4 Data Triangulation and Verification
- 2.5 Market Size Measurement Basis
- 2.5.1 2025: USD 424.5 million → 2035: USD 685.5 million
- 2.6 Historical and Forecast Reference Periods
- 2.6.1 Historical Period: 2018-2025
- 2.6.2 Base Year: 2025
- 2.6.3 Forecast Period: 2025-2035
- 2.7 Research Assumptions and Limitations
Chapter 3 Executive Summary
- 3.1 Market Snapshot and Key Findings
- 3.2 Base-Year Market Size, 2025
- 3.3 Forecast Market Size, 2035
- 3.4 Revenue and Volume Growth Outlook
- 3.5 Key Demand and Supply Indicators
- 3.6 Leading Market Segments
- 3.7 Fastest-Growing Market Opportunities
- 3.8 Regional Performance Highlights
- 3.9 Technology and Industry Transformation
- 3.10 Competitive Landscape Summary
- 3.11 Analyst View and Strategic Implications
Chapter 4 Australia Film Adhesive Market Trends and Developments
- 4.1 Historical Industry Development, 2018-2025
- 4.2 Recent Market Trends and Developments
- 4.3 Demand and Customer Behavior Trends
- 4.4 Technology and Product Innovation
- 4.5 Artificial Intelligence, Automation and Digitalization
- 4.6 Local Manufacturing and Supply Chain Realignment
- 4.7 Industry Partnerships, Mergers and Acquisitions
- 4.8 Sustainability and Circular Economy Developments
- 4.9 Government and Private Sector Investment Trends
- 4.10 Emerging Business Models and Commercialization
- 4.11 Industry Developments and Announcements
Chapter 5 Australia Film Adhesive Market Production, Supply and Demand Analysis
- 5.1 Demand Trend and Consumption Analysis, 2018-2025
- 5.2 Demand Forecast, 2025-2035
- 5.3 Production and Output Trend, 2018-2025
- 5.4 Production and Output Forecast, 2025-2035
- 5.5 Installed Capacity and Capacity Utilization
- 5.6 Company-Wise Production Plants and Statistics
- 5.6.1 Installed Production Capacity
- 5.6.2 Actual Production
- 5.6.3 Planned Capacity and Expansion Targets
- 5.7 Supply Chain Structure and Procurement Trends
- 5.8 Supply-Demand Gap and Bottlenecks
- 5.9 Import Dependence and Sourcing Structure
- 5.10 Contract Manufacturing and Outsourcing
- 5.11 Regional Supply and Demand Concentration
Chapter 6 Australia Film Adhesive Market Pricing Analysis
- 6.1 Pricing Structure and Measurement
- 6.2 Historical Pricing Trends, 2018-2025
- 6.3 Pricing Outlook, 2025-2035
- 6.4 Average Selling Price and Unit Economics
- 6.5 Pricing by Product and Market Segment
- 6.6 Geographic Pricing Differences
- 6.7 Key Input, Energy, Labor and Logistics Costs
- 6.8 Contract Pricing and Purchasing Models
- 6.9 Pricing Sensitivity and Competitive Positioning
- 6.10 Price, Margin and Profitability Implications
Chapter 7 Australia Film Adhesive Market Dynamics
- 7.1 Market Growth Drivers
- 7.1.1 Demand-Side Drivers
- 7.1.2 Technology and Innovation Drivers
- 7.1.3 Infrastructure and Investment Drivers
- 7.1.4 Regulatory and Policy Drivers
- 7.2 Market Restraints
- 7.2.1 Cost and Affordability Constraints
- 7.2.2 Technology and Adoption Barriers
- 7.2.3 Supply Chain and Operational Constraints
- 7.3 Market Challenges
- 7.3.1 Competitive Pressure and Margin Erosion
- 7.3.2 Skills, Infrastructure and Implementation Gaps
- 7.4 Emerging Market Opportunities
- 7.5 Market Dynamics Impact and Time-Horizon Assessment
Chapter 8 Australia Film Adhesive Value Chain Analysis
- 8.1 Industry Value Chain Overview
- 8.2 Upstream Suppliers and Critical Inputs
- 8.3 Technology and Component Providers
- 8.4 Manufacturing or Service Delivery
- 8.5 Distribution, Channel Partners and Integrators
- 8.6 Downstream Applications and End Users
- 8.7 Value Addition and Profit Pools
- 8.8 Vertical Integration and Outsourcing
- 8.9 Supplier Concentration and Risk
- 8.10 Supply Chain Localization and Resilience
Chapter 9 Australia Film Adhesive Market Regulations and Policies
- 9.1 Relevant Laws, Standards and Compliance Frameworks
- 9.2 Product, Service, Safety and Quality Requirements
- 9.3 Government Policies, Incentives and Subsidies
- 9.4 Imports, Exports and Trade Barriers
- 9.5 Public Procurement and Local Content Requirements
- 9.6 Environmental and Sustainability Compliance
- 9.7 Upcoming Policy Changes and Market Implications
Chapter 10 Australia Film Adhesive Market Hotspots and Opportunities
- 10.1 Market Opportunity Mapping and Growth Hotspots
- 10.2 High-Growth Applications and Customer Groups
- 10.3 Underserved Markets and White-Space Opportunities
- 10.4 Emerging Technology and Product Opportunities
- 10.5 New Capacity and Investment Hotspots
- 10.6 Market Entry and Expansion Opportunities
- 10.7 Distribution and Partnership Opportunities
- 10.8 Near-Term and Long-Term Commercial Potential
- 10.9 Opportunity Attractiveness and Execution Risks
Chapter 11 Australia Film Adhesive Market Outlook, 2025-2035
- 11.1 Market Size and Analysis
- 11.1.1 Revenue (Market Measurement: 2025: USD 424.5 million → 2035: USD 685.5 million)
- 11.1.2 Market Volume and Quantity Sold
- 11.1.3 Historical Market Size, 2018-2025
- 11.1.4 Base-Year Market Size, 2025
- 11.2 Market Forecast, 2025-2035
- 11.2.1 Revenue Forecast to 2035
- 11.2.2 Volume Forecast to 2035
- 11.2.3 CAGR and Year-on-Year Growth
- 11.2.4 Incremental Revenue Opportunity
- 11.3 Forecast Assumptions and Scenario Analysis
- 11.3.1 Base-Case Forecast
- 11.3.2 Optimistic and Conservative Scenarios
- 11.3.3 Technology, Pricing and Policy Sensitivities
- 11.4 Market Attractiveness and Growth Outlook
Chapter 12 Australia Film Adhesive Market Segmentation and Outlook
- 12.1 Segmentation Summary and Market Shares, 2025
- 12.2 Largest and Fastest-Growing Segments
- 12.3 By Product Type - Market Size and Forecast, 2025-2035
- 12.3.1 Segment Definition and Scope
- 12.3.2 Historical Market Size, 2018-2025
- 12.3.3 Revenue Forecast, 2025-2035
- 12.3.4 Volume Forecast, 2025-2035
- 12.3.5 Base-Year Market Share, 2025
- 12.3.6 Segment CAGR and Growth Drivers
- 12.3.7 Subsegment Market Size and Forecast
- 12.3.7.1 Pressure-sensitive tapes and films
- 12.3.7.2 Lamination adhesive films
- 12.3.7.3 Structural adhesive films
- 12.3.8 Subsegment Pricing and Adoption Trends
- 12.3.9 Leading Suppliers and Competition
- 12.3.10 Regional Demand and Opportunities
- 12.4 By End-Use Industry - Market Size and Forecast, 2025-2035
- 12.4.1 Segment Definition and Scope
- 12.4.2 Historical Market Size, 2018-2025
- 12.4.3 Revenue Forecast, 2025-2035
- 12.4.4 Volume Forecast, 2025-2035
- 12.4.5 Base-Year Market Share, 2025
- 12.4.6 Segment CAGR and Growth Drivers
- 12.4.7 Subsegment Market Size and Forecast
- 12.4.7.1 Packaging
- 12.4.7.2 Building and construction
- 12.4.7.3 Transport and equipment
- 12.4.7.4 Medical
- 12.4.7.5 Consumer and stationery
- 12.4.8 Subsegment Pricing and Adoption Trends
- 12.4.9 Leading Suppliers and Competition
- 12.4.10 Regional Demand and Opportunities
- 12.5 By Technology - Market Size and Forecast, 2025-2035
- 12.5.1 Segment Definition and Scope
- 12.5.2 Historical Market Size, 2018-2025
- 12.5.3 Revenue Forecast, 2025-2035
- 12.5.4 Volume Forecast, 2025-2035
- 12.5.5 Base-Year Market Share, 2025
- 12.5.6 Segment CAGR and Growth Drivers
- 12.5.7 Subsegment Market Size and Forecast
- 12.5.7.1 Acrylic adhesives
- 12.5.7.2 Rubber and silicone adhesives
- 12.5.7.3 Epoxy and polyurethane adhesives
- 12.5.8 Subsegment Pricing and Adoption Trends
- 12.5.9 Leading Suppliers and Competition
- 12.5.10 Regional Demand and Opportunities
- 12.6 By Application - Market Size and Forecast, 2025-2035
- 12.6.1 Segment Definition and Scope
- 12.6.2 Historical Market Size, 2018-2025
- 12.6.3 Revenue Forecast, 2025-2035
- 12.6.4 Volume Forecast, 2025-2035
- 12.6.5 Base-Year Market Share, 2025
- 12.6.6 Segment CAGR and Growth Drivers
- 12.6.7 Subsegment Market Size and Forecast
- 12.6.7.1 Sealing and labelling
- 12.6.7.2 Surface protection
- 12.6.7.3 Component bonding
- 12.6.7.4 Skin attachment
- 12.6.8 Subsegment Pricing and Adoption Trends
- 12.6.9 Leading Suppliers and Competition
- 12.6.10 Regional Demand and Opportunities
- 12.7 Segment Growth Comparison
- 12.8 Segment Attractiveness and Priority Matrix
Chapter 13 Australia Film Adhesive End-Use and Application Market Outlook
- 13.1 End-Use Industry and Customer Demand Structure
- 13.2 Leading Applications and Customer Groups
- 13.3 End-Use Market Size, Share and Forecast
- 13.4 Major End-Use Industry Deep Dives
- 13.4.1 Customer Requirements and Use Cases
- 13.4.2 Demand and Replacement Cycles
- 13.4.3 Technical and Regulatory Considerations
- 13.4.4 Purchasing and Procurement Models
- 13.4.5 Leading Vendors and Distribution Channels
- 13.4.6 Forecast and Commercial Opportunities
- 13.5 Emerging Applications and Cross-Segment Demand
- 13.6 End-Use Industry Investment Priorities
Chapter 14 Australia Film Adhesive Geographic Market Outlook, 2025-2035
- 14.1 Domestic Market Distribution and Demand Clusters
- 14.2 State- or Province-Wise Market Size and Forecast, 2025-2035
- 14.3 City and Metropolitan Market Outlook
- 14.4 Industrial, Manufacturing and Commercial Clusters
- 14.5 Geographic Concentration of Key End Users
- 14.6 Local Pricing and Purchasing Differences
- 14.7 Domestic Production Facilities and Capacity Map
- 14.8 Local Infrastructure and Project Pipeline
- 14.9 State-Level Policy and Incentive Differences
- 14.10 Subnational Investment Hotspots and Opportunities
- 14.11 Distribution and Logistics Networks
- 14.12 Domestic Competitive Footprint
Chapter 15 Australia Film Adhesive Technology, Innovation and Sustainability Outlook
- 15.1 Technology Landscape and Maturity
- 15.2 Product, Process and Service Innovation
- 15.3 AI, Automation and Digital Tools in the Industry
- 15.4 Technology Adoption and Performance Benchmarking
- 15.5 Innovation Pipeline and R&D Investment
- 15.6 Patent and Intellectual Property Trends
- 15.7 Energy Efficiency and Resource Management
- 15.8 Sustainability, Recycling and Circularity
- 15.9 Technology Roadmap, 2025-2035
- 15.10 Risks of Obsolescence and Technology Substitution
Chapter 16 Australia Film Adhesive Market Key Strategic Imperatives
- 16.1 Growth and Market Entry Priorities
- 16.2 High-Return Products and Segments
- 16.3 Pricing, Profitability and Cost Optimization
- 16.4 Technology Investment and Product Differentiation
- 16.5 Supply Chain Localization and Resilience
- 16.6 Distribution and Customer Acquisition
- 16.7 Partnership, Acquisition and Capacity Strategy
- 16.8 Regional Expansion Priorities
- 16.9 Short-, Medium- and Long-Term Actions
Chapter 17 Competition Outlook
- 17.1 Industry Competition Characteristics
- 17.2 Market Structure and Concentration
- 17.3 Market Share and Competitive Positioning, 2025
- 17.4 Company-Wise Revenue and Product Benchmarking
- 17.5 Production and Service Capacity Benchmarking
- 17.6 Technology, Pricing and Differentiation
- 17.7 Regional Footprint and Distribution Strength
- 17.8 Mergers, Acquisitions and Strategic Alliances
- 17.9 New Entrants and Competitive Threats
- 17.10 Porter's Five Forces and Industry Attractiveness
- 17.11 Competitive Outlook, 2025-2035
Chapter 18 Company Profiles
- 18.1 Company Coverage and Selection Criteria
- 18.2 H.B. Fuller
- 18.2.1 Business Description
- 18.2.2 Company Ownership and Geographic Presence
- 18.2.3 Product and Service Portfolio
- 18.2.4 Manufacturing and Operating Footprint
- 18.2.5 Production Capacity and Expansion Plans
- 18.2.6 Financial Performance and Investment
- 18.2.7 Market Share and Competitive Position
- 18.2.8 Technology and Innovation Capabilities
- 18.2.9 Strategic Alliances or Partnerships
- 18.2.10 Recent Developments
- 18.2.11 Growth Strategy and Outlook
- 18.3 3M Australia
- 18.4 Avery Dennison Australia
- 18.5 tesa tape Australia
- 18.6 Bostik Australia
- 18.7 Other Relevant Market Participants
Note: Every listed company is profiled on the structure shown under the first company. The company list is preliminary and may change based on research findings, market developments, data availability and client requirements.
Chapter 19 Disclaimer
- 19.1 Research and Forecast Disclaimer
- 19.2 Data Source and Estimation Limitations
Note: The depth of individual sections depends on data availability for this market. Volume, capacity, trade and other unit-based metrics are included where applicable.

