
Record cattle kills and finishing work lift chemical use
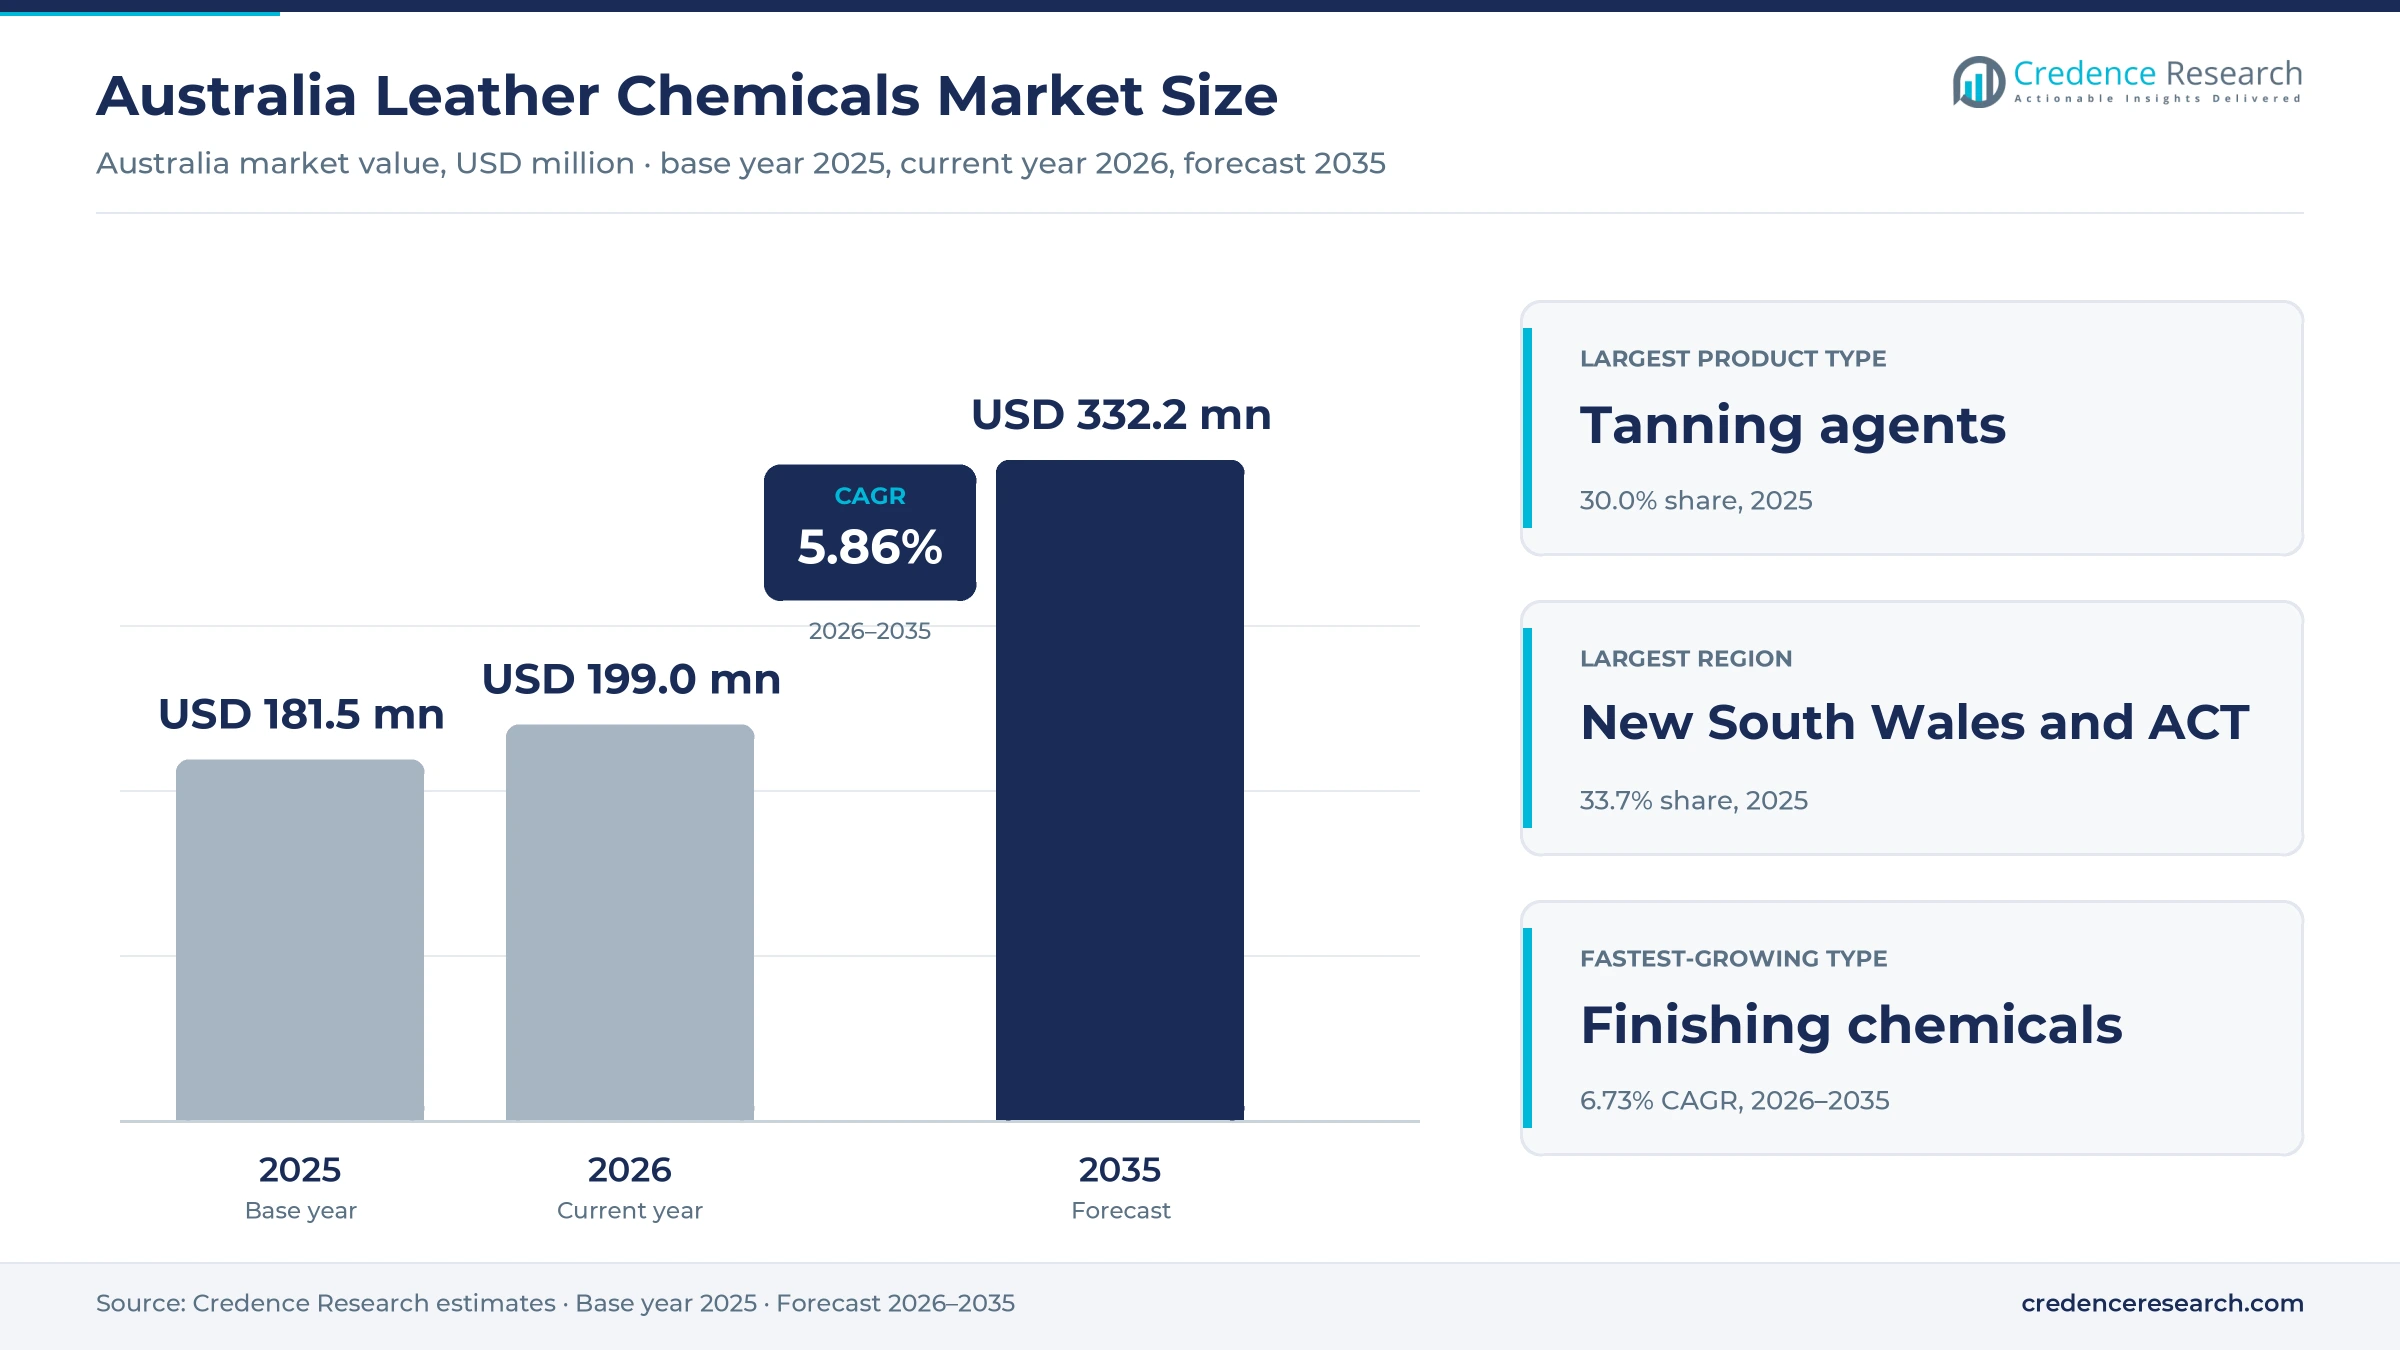
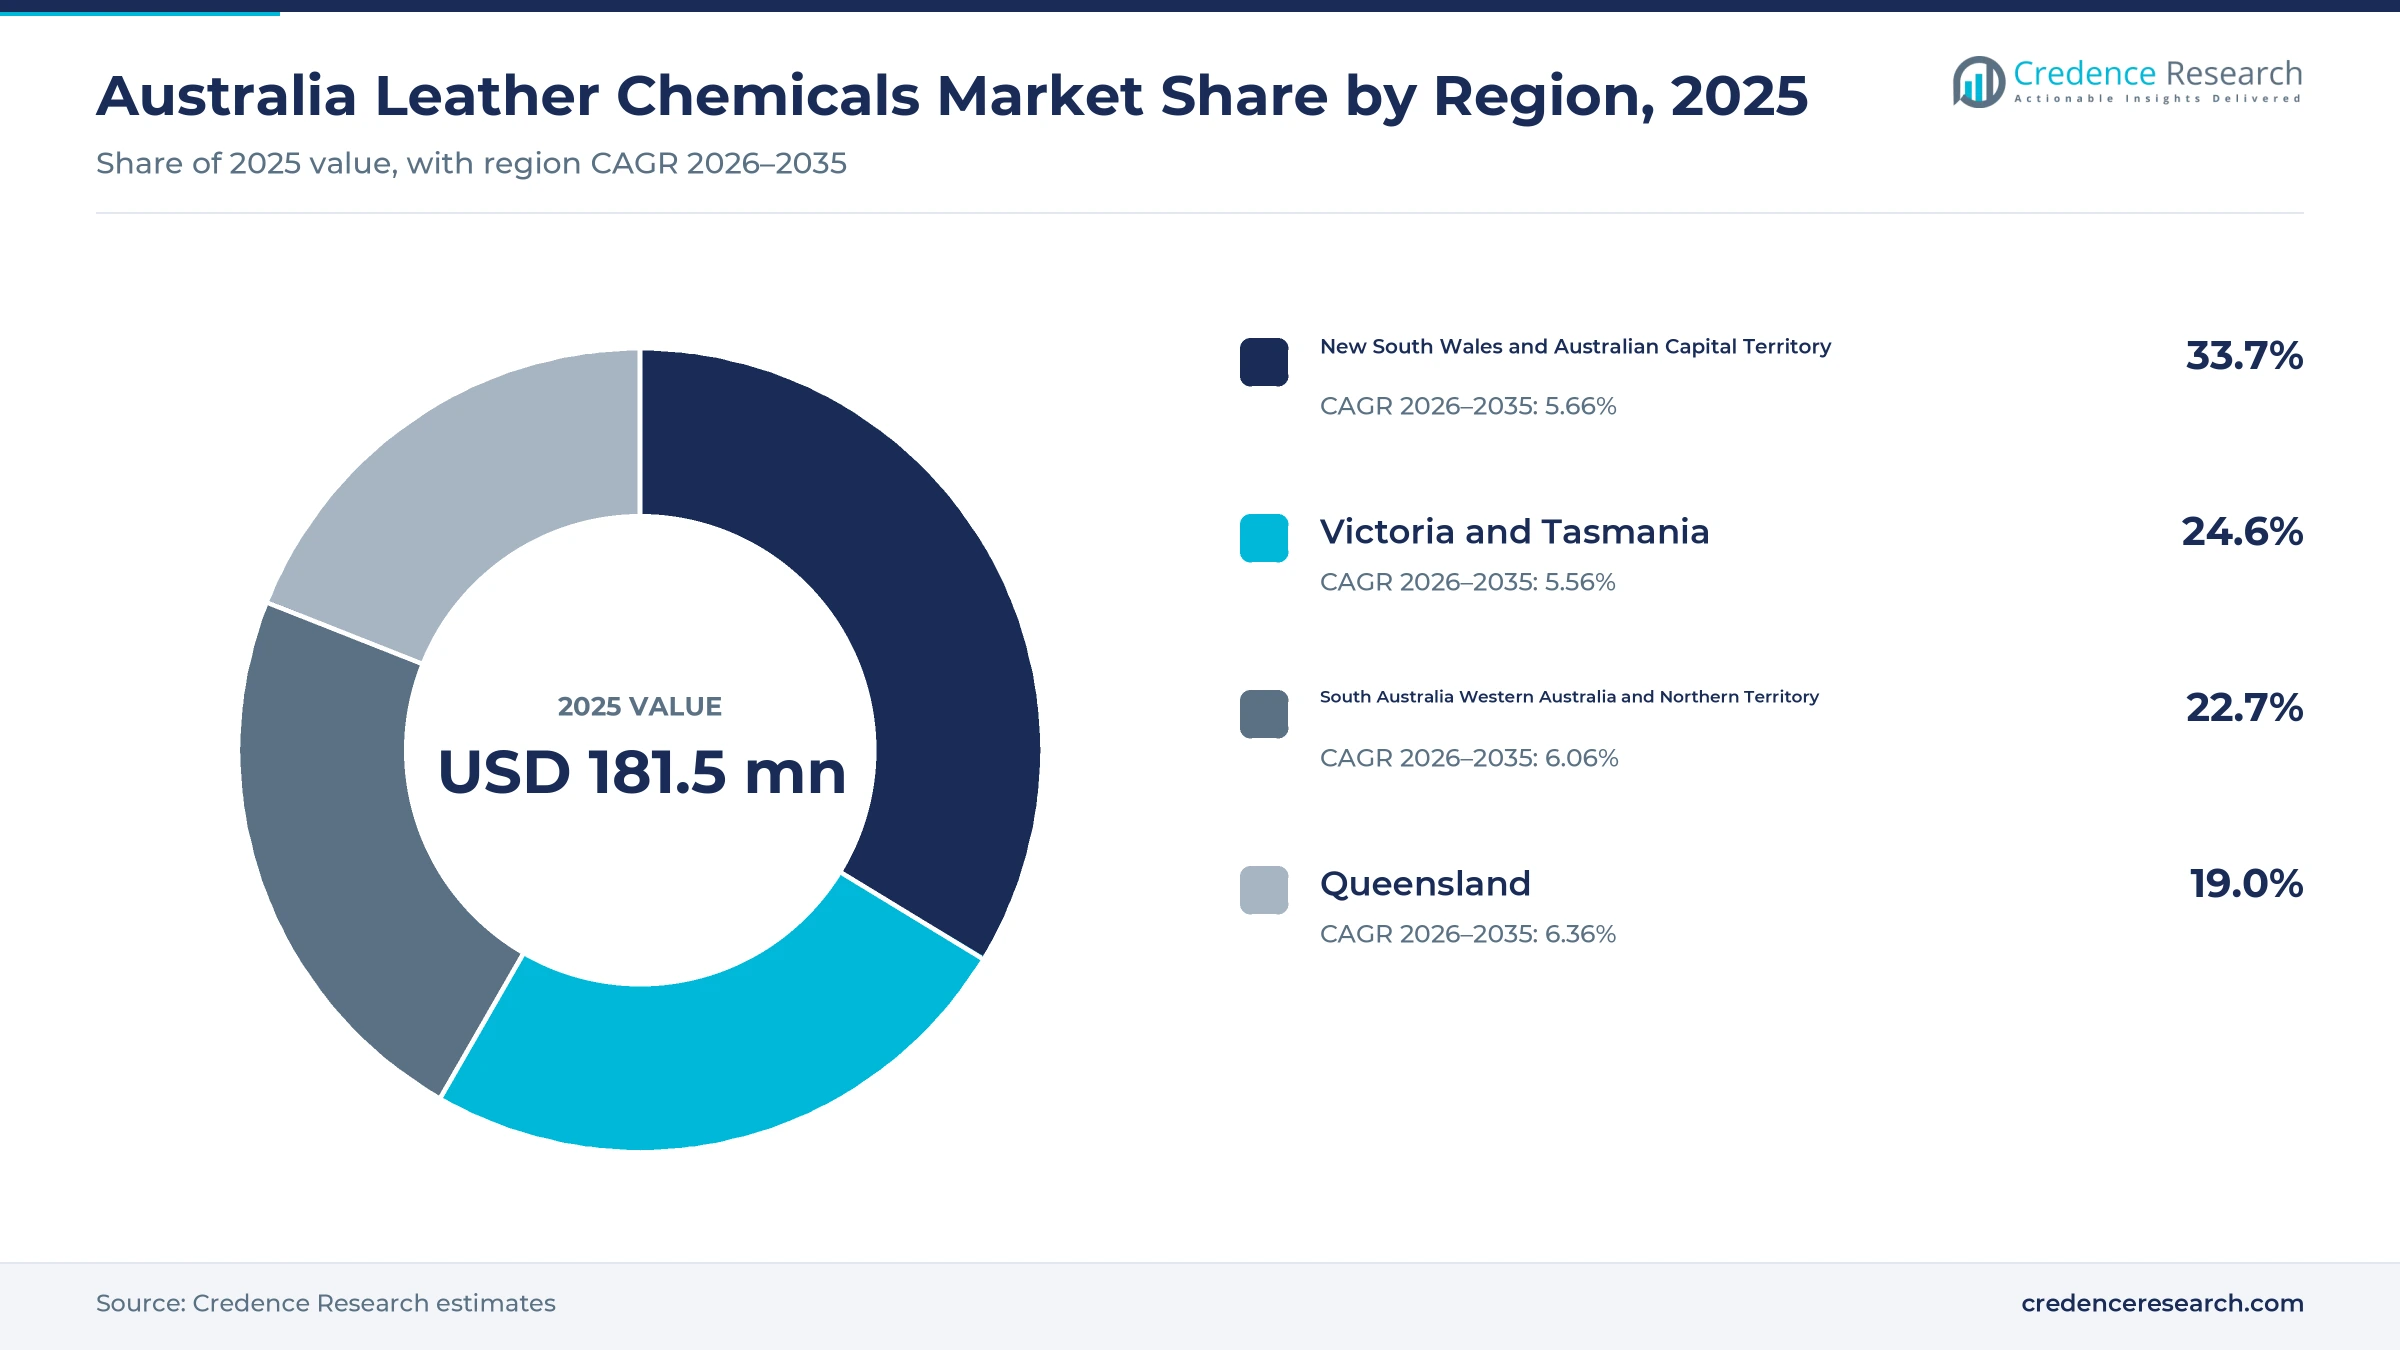
The Australia leather chemicals market was valued at USD 181.5 million in 2025 and is projected to increase from USD 199.0 million in 2026 to USD 332.1 million by 2035, registering a CAGR of 5.86% during 2026–2035. Demand comes from tanneries, wet-blue processors, sheepskin dressers, kangaroo leather makers, upholstery repairers and leather goods workshops that buy beamhouse, tanning, retanning and finishing products. New South Wales and the Australian Capital Territory held the largest regional share, 33.7% in 2025, because finishers, distributors and furniture repairers cluster around Sydney. Queensland is the fastest-growing region at 6.36% a year, as record cattle slaughter lifts hide volumes at processors near Brisbane. In turn, the ban on three PFAS chemicals from July 2025 is pushing finishers toward fluorine-free water repellents and documented supply chains.
Which tanning, dyeing and finishing products are counted?
The estimate measures spending in Australia on beamhouse chemicals, tanning agents, retanning dyeing and fatliquoring chemicals, and finishing chemicals used to turn cattle hides, sheepskins and kangaroo skins into leather. It also counts cleaners, conditioners, pigments and topcoats bought to recondition finished leather in furniture, vehicles and footwear. Values are stated in USD million at current prices and exclude goods and services tax.
The estimate excludes raw hides and skins, finished leather, synthetic leather, footwear adhesives and general cleaning products not formulated for leather. The value chain runs from overseas and local formulators through agents and technical distributors to tanneries, sheepskin processors, finishers, repairers and leather product makers across the country.
Australia Leather Chemicals Market Insights
- The Australia leather chemicals market was valued at USD 181.5 million in 2025 and is projected to reach USD 332.1 million by 2035, at a 5.86% CAGR during 2026–2035.
- New South Wales and the Australian Capital Territory held a 33.7% share of 2025 value, as finishers and distributors cluster around Sydney.
- Tanning agents led product types with a 30.0% share of 2025 value, because most hides are processed to the wet-blue stage before export.
- Australia banned the import, manufacture and use of PFOS, PFOA and PFHxS from July 1, 2025, under its industrial chemicals environmental standard.
- Finishing chemicals grow fastest at 6.73% a year during 2026–2035, as reconditioning of furniture, vehicle and footwear leather expands.
Tanning agents lead while finishing chemicals grow fastest
Why do chrome and chrome-free tanning agents lead?
Based on product type, the market is categorized into beamhouse chemicals, tanning agents, retanning dyeing and fatliquoring chemicals, and finishing chemicals. Tanning agents led with a 30.0% share of 2025 value, because processors stabilize most cattle hides as wet blue before export. Finishing chemicals grow fastest at 6.73% a year, as repairers and finishers buy more pigments, topcoats and protectors.
Why does footwear leather still absorb the most chemistry?
Based on end-use industry, the market is categorized into footwear manufacturing, sheepskin processing, upholstery manufacturing and refurbishment, and leather goods manufacturing. Footwear manufacturing led with a 32.0% share of 2025 value, because cattle and kangaroo leathers are largely made for shoe uppers. Upholstery manufacturing and refurbishment grows fastest at 6.57% a year, as owners repair furniture and car seats.
Why do bovine hides take most tanning volume?
Based on application, the market is categorized into bovine hide processing, ovine skin processing, kangaroo leather processing and finished leather reconditioning. Bovine hide processing led with a 52.0% share of 2025 value, because cattle hides are the largest raw material by weight. Finished leather reconditioning grows fastest at 7.27% a year, as professional cleaning and color restoration services widen their reach.
Contracts, distributors or trade counters?
Based on sales channel, the market is categorized into direct manufacturer contracts, technical distribution and specialist trade supply. Direct manufacturer contracts led with a 44.0% share of 2025 value, because large tanneries agree annual recipes and volumes with formulators. Specialist trade supply grows fastest at 6.64% a year, as repair businesses order kits, dyes and topcoats in small lots.
| Segment Group | Leading Sub-segment | Share, 2025 | Fastest-growing Sub-segment | CAGR, 2026–2035 |
|---|---|---|---|---|
| By Product Type | Tanning agents | 30.0% | Finishing chemicals | 6.73% |
| By End-Use Industry | Footwear manufacturing | 32.0% | Upholstery manufacturing and refurbishment | 6.57% |
| By Application | Bovine hide processing | 52.0% | Finished leather reconditioning | 7.27% |
| By Sales Channel | Direct manufacturer contracts | 44.0% | Specialist trade supply | 6.64% |
Request a Free Sample
Fill in your details and we'll send you a free sample report.
- Sample data tables & charts
- Research methodology
Specialty grades, export traceability and repair drive use
How does specialty formulation premiumization lift spending?
Specialty formulation premiumization lifts spending, because processors need chrome-free, vegetable and low-impact recipes that cost more per kilogram than commodity chrome salts. Packer Leather at Narangba in Queensland uses chrome, chrome-free and vegetable tannages on bovine, sheep, goat and kangaroo skins, according to its certification listing. The same site has held continuous environmental certification since May 1, 2008, with its current audit valid to Nov. 6, 2027. Henkel announced in February 2026 that it would acquire Stahl Group, a leather finishing and coatings maker with about 1,700 staff, according to a trade report. As a result, retanning, dyeing and fatliquoring grades gain value, alongside demand for tannin extracts in vegetable recipes.
Why do export processing and traceability support demand?
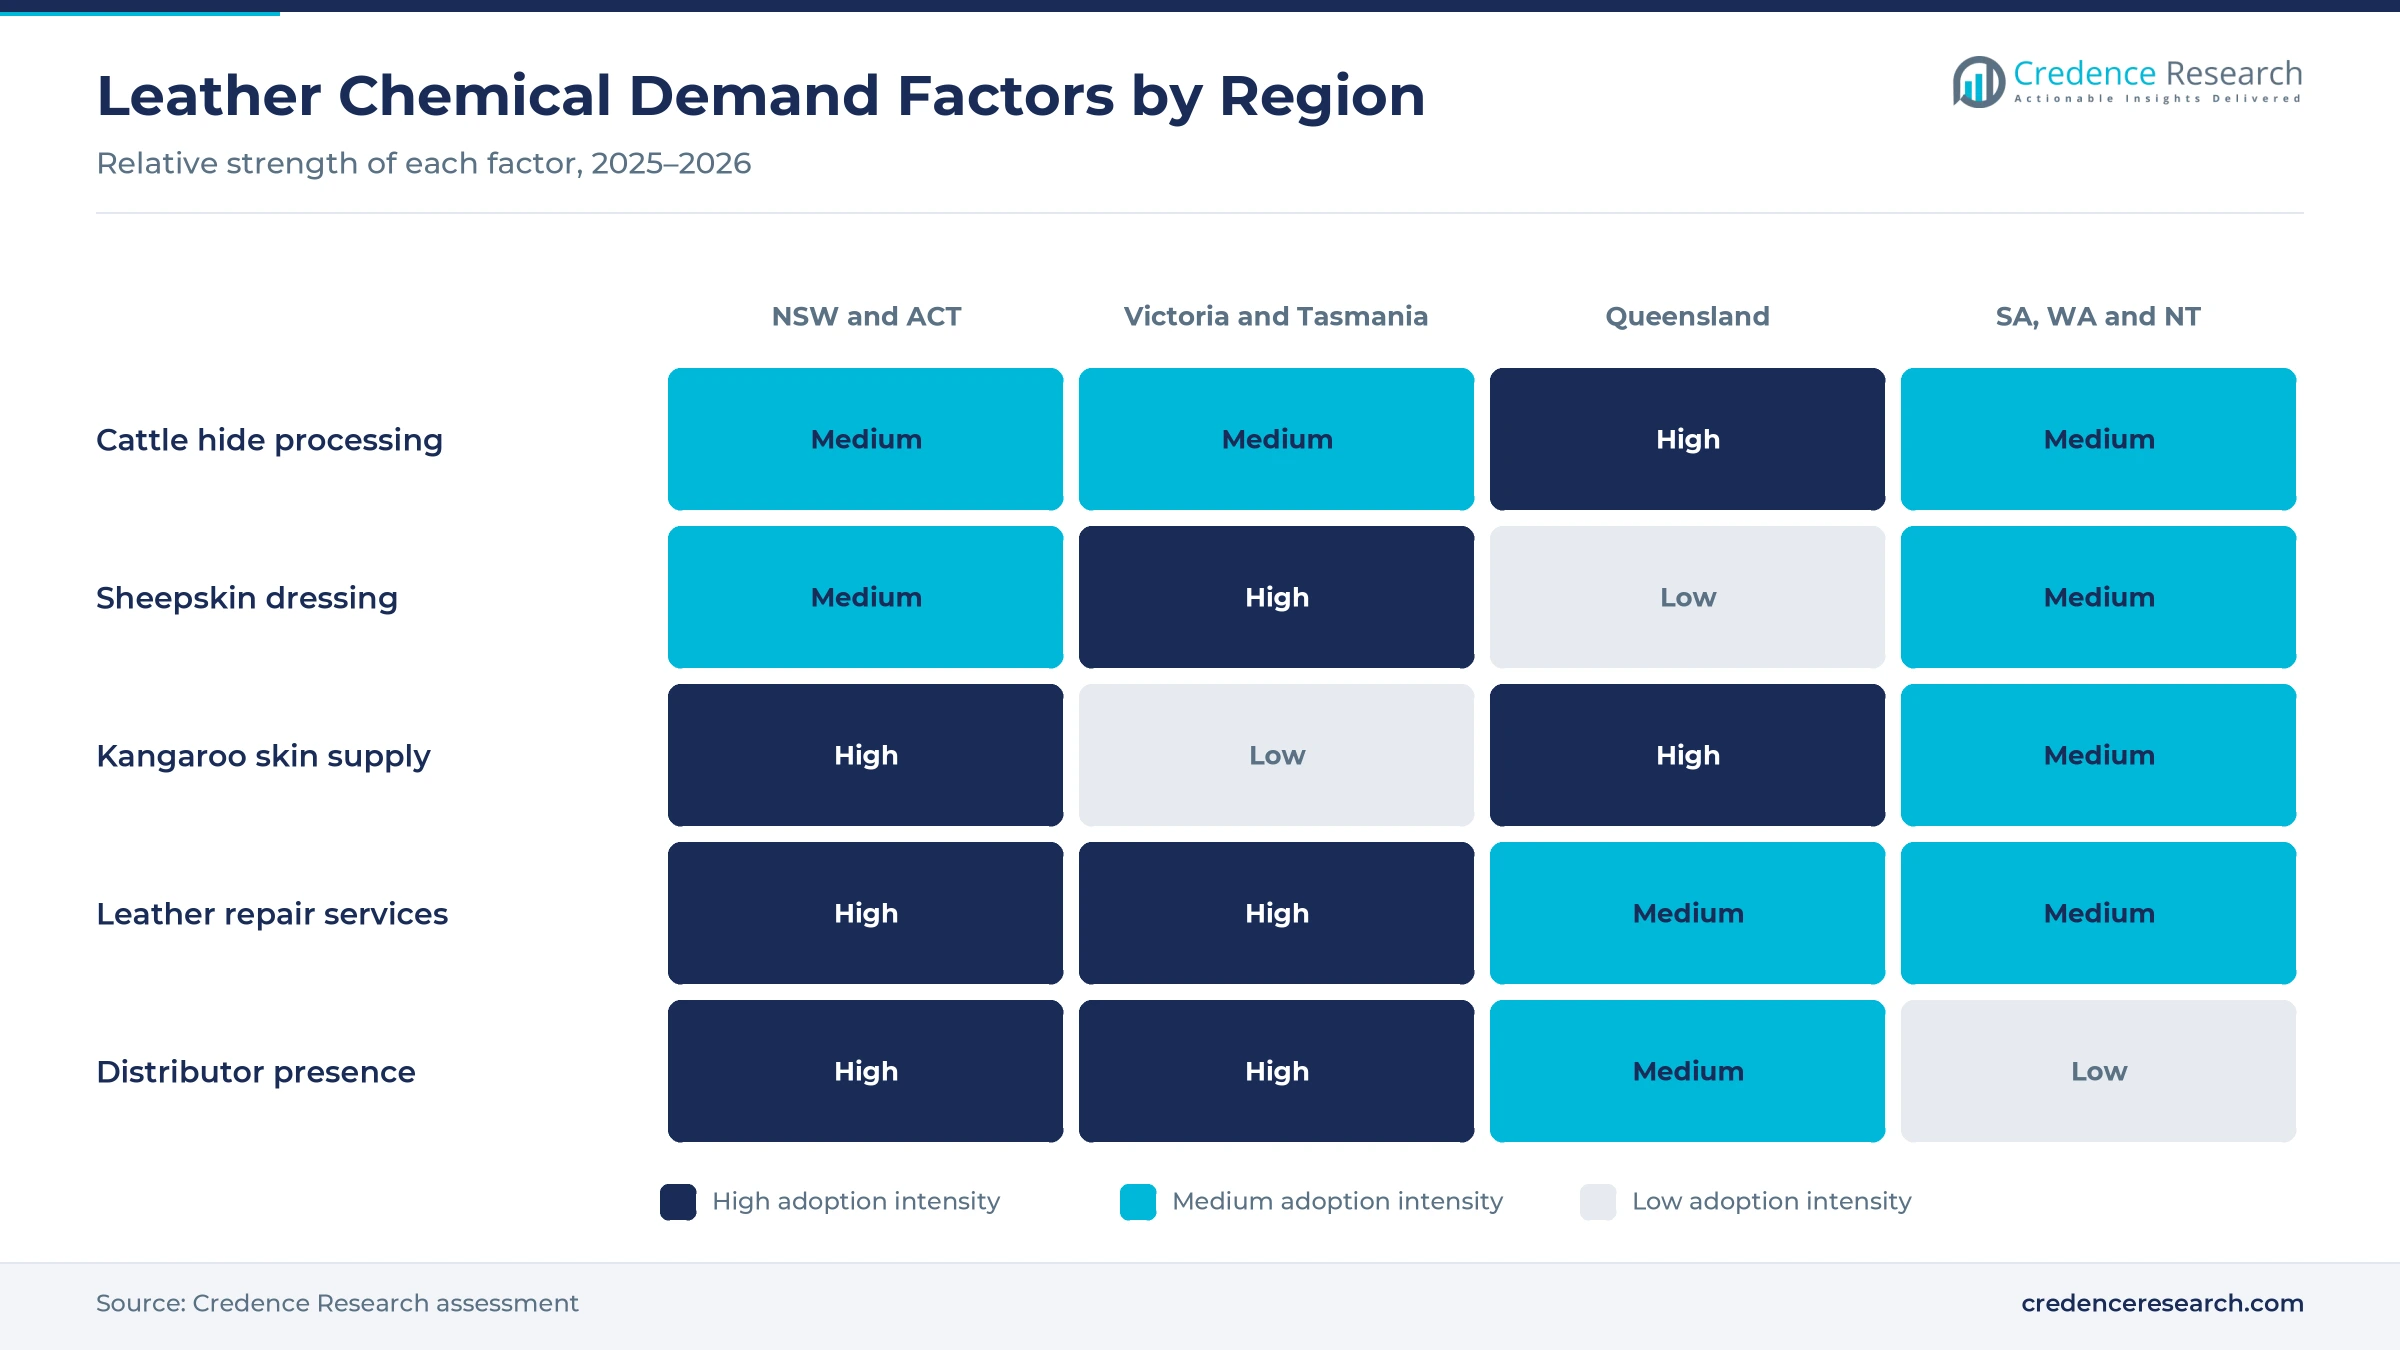
Export processing and traceability support demand, because most Australian hides leave the country as salted or wet-blue material that buyers expect to be documented. Nearly 9.6 million cattle were processed in 2025-26, the highest financial-year total since 1978, according to the red meat industry body. Queensland processed 1.083 million head in the June quarter 2026, or 43% of the national kill. Gunnedah Leather Processors, one of three Australian wet-blue producers, planned to lift capacity from about 400 to 630 metric tons of leather a week. In turn, tanning agents lead products with a 30.0% share, while audited processors buy soaking enzymes and beamhouse grades.
How does professional finishing and refurbishment add orders?
Professional finishing and refurbishment add orders, because furniture, vehicle and footwear owners now restore worn leather rather than replace it. Leather Finishing Products Australia, an Australian agent for Stahl, makes cleaners, conditioners, pigments, dyes, topcoats and repair kits and trains technicians in repairs. Its training covers cleaning, conditioning, leather recognition and color restoration, and clients receive a free technical hotline. Angelus finishing products also reach Australian buyers through local art retailers, with a 29.5 milliliter clear finisher sold in AUD. Consequently, finished leather reconditioning grows fastest among applications at 7.27% a year, and upholstery manufacturing and refurbishment grows at 6.57% a year.
Why does sheepskin and kangaroo processing keep niche demand?
Sheepskin and kangaroo processing keep niche demand, because both raw materials are Australian specialties that need distinct tanning and finishing recipes. UGG Australia runs its own Roman Tannery in Melbourne, dressing double-faced Merino sheepskins in a process that takes about ten days. New South Wales set a 2025 commercial kangaroo quota of 2,186,952 animals, while 634,087 were harvested, or 29.0% of quota. South Australia set a 2026 quota of 600,400 animals after a 2025 harvest of 100,102 to Oct. 31. As a result, sheepskin processing holds a steady share, while kangaroo leather processing grows more slowly after major sportswear brands left the material.
PFAS rules, consolidation and repair services gain ground
How is the shift to fluorine-free finishing changing recipes?
The shift to fluorine-free finishing is changing recipes, because water, oil and stain repellents once relied on chemistries now restricted in Australia. Australia banned PFOS, PFOA and PFHxS, including their salts and precursors, from July 1, 2025, under Schedule 7 of its environmental standard, according to a logistics compliance notice. The ban covers import, export, manufacture and use in commercial goods, with exemptions for trace contamination and research. Packer Leather also runs chrome-free and vegetable tannages alongside chrome. Consequently, finishing chemicals grow fastest among products at 6.73% a year, as finishers replace older repellents with documented, compliant grades and test incoming products more often.
Why is supplier consolidation rising across formulators?
Supplier consolidation is rising across formulators, because large chemical groups want leather finishing and coatings know-how to serve fashion, mobility and packaging customers together. Henkel completed its Stahl acquisition on Oct. 1, 2026, after regulatory clearances, in a deal valued at EUR 2.1 billion. Before the sale, Wendel owned 68.5% of Stahl, BASF 16.1% and Clariant 14.6%. Stahl products already reach Australian buyers through Leather Finishing Products Australia, which acts as its agent. As a result, direct manufacturer contracts keep a 44.0% share, while local agents gain access to wider coating and finishing ranges for tanneries, sheepskin processors and repairers.
Can repair services open a wider finishing market?
Repair services open a clear opening, because leather is common in Australian homes, offices and vehicles and most pieces need cleaning, conditioning and color work over time. Leather Finishing Products Australia has more than 30 years of experience and sells cleaners, protectors, tinting creams and topcoats to service businesses. Its founder began working with leather and vinyl in 1985 and sold an earlier repair business in 2010. Retail finishers from Angelus are also sold in 29.5 milliliter bottles to hobby and footwear users. Finished leather reconditioning is also the fastest-growing application, as repairers widen their services. Consequently, specialist trade supply grows fastest among channels at 6.64% a year, as small businesses add repair work.
Is there room to process more hides onshore?
Processing more hides onshore offers room to grow, because Australia exports much of its cattle hide supply at an early stage while slaughter is at multi-decade highs. Manufacturing added 5.3% of gross domestic product in 2025, according to the World Bank, which leaves scope for local value adding. Gunnedah Leather Processors lodged plans in December 2021 to invest in automation and 14 jobs to its existing 72, aiming to bring overseas steps onshore. Packer Leather supplies full-grain leather from bovine, sheep, goat and kangaroo skins, competing with European tanneries. As a result, retanning and finishing chemistry could gain if more crust and finished leather is made locally for domestic and export buyers.
Weak hide prices, plant closures and imports slow growth
Why do weak hide prices squeeze tannery budgets?
Weak hide prices put pressure on budgets, because tanneries and processors earn less from each hide and cut chemical spending. In April 2025, Australian hide prices were down roughly 28% to 61% on a year earlier, and heavy tick-free Queensland hides were quoted at $5.50, down 43%. As a result, some processors sell raw or salted hides rather than invest in tanning. Suppliers respond with lower-cost recipes, smaller batches and technical support that reduces chemical waste.
How do tannery closures thin the customer base?
Plant closures are a barrier to growth, because only a few tanneries and wet-blue processors remain in Australia. Gunnedah Leather Processors is described as one of three Australian producers of wet-blue hides. Consequently, the loss of a single site can remove a large share of regional demand for beamhouse and tanning agents. Distributors respond by widening their reach into sheepskin dressers, repairers and leather goods workshops that buy smaller volumes.
Why does brand withdrawal weigh on kangaroo leather?
Brand withdrawal is a risk for kangaroo leather, because Nike and Puma announced in 2023 that they would stop making football boots with kangaroo leather. In turn, processors lost large orders for light, strong shoe leather. NSW commercial harvests reached only 29.0% of quota in 2025, which shows weak demand for skins and meat. Processors respond by selling into gloves, whips, saddlery and specialist shoes that still value the material.
Can local buyers manage import and compliance costs?
Import dependence limits margins and raises costs, because most leather chemicals are made overseas and shipped through agents and distributors. PFAS rules also require importers to check that products do not contain banned substances. As a result, small buyers face higher prices, minimum orders and longer lead times for special grades. Suppliers respond with local stock, safety data support and compliant recipes that reduce paperwork for tanneries.
Sydney buyers lead while Queensland processors gain fastest
| Region | Value, 2025 (USD million) | Share, 2025 | CAGR, 2026–2035 |
|---|---|---|---|
| New South Wales and Australian Capital Territory | 61.2 | 33.7% | 5.66% |
| Victoria and Tasmania | 44.6 | 24.6% | 5.56% |
| South Australia Western Australia and Northern Territory | 41.2 | 22.7% | 6.06% |
| Queensland | 34.5 | 19.0% | 6.36% |
Sydney finishers and repairers keep New South Wales ahead
New South Wales and the Australian Capital Territory held a 33.7% share of 2025 value and grow at 5.66% a year. NSW processed 572,500 cattle in the June quarter 2026, up 11.7% on a year earlier. Gunnedah Leather Processors also runs a wet-blue plant in the north of the state. As a result, the region combines hide processing with the largest base of upholstery, footwear and vehicle leather repair businesses around Sydney.
Melbourne sheepskin dressing anchors Victoria and Tasmania
Victoria and Tasmania held a 24.6% share of 2025 value and grow at 5.56% a year. Victoria processed 587,000 cattle in the June quarter 2026, up 8.8% on a year earlier. UGG Australia also dresses Merino sheepskins at its Roman Tannery in Melbourne. Consequently, demand comes from sheepskin dressing, footwear and leather goods makers, while Victorian heavy hides fetch the best prices in the country.
Why does Queensland gain hide volume fastest?
Queensland held a 19.0% share of 2025 value and grows fastest at 6.36% a year. The state processed 1.083 million cattle in the June quarter 2026, its strongest June quarter since 2015. Packer Leather tans bovine, sheep, goat and kangaroo skins at Narangba, north of Brisbane. In turn, rising slaughter and certified tanning keep Queensland the fastest-growing user of beamhouse, tanning and retanning chemicals.
Kangaroo and sheep supply shape the south and west
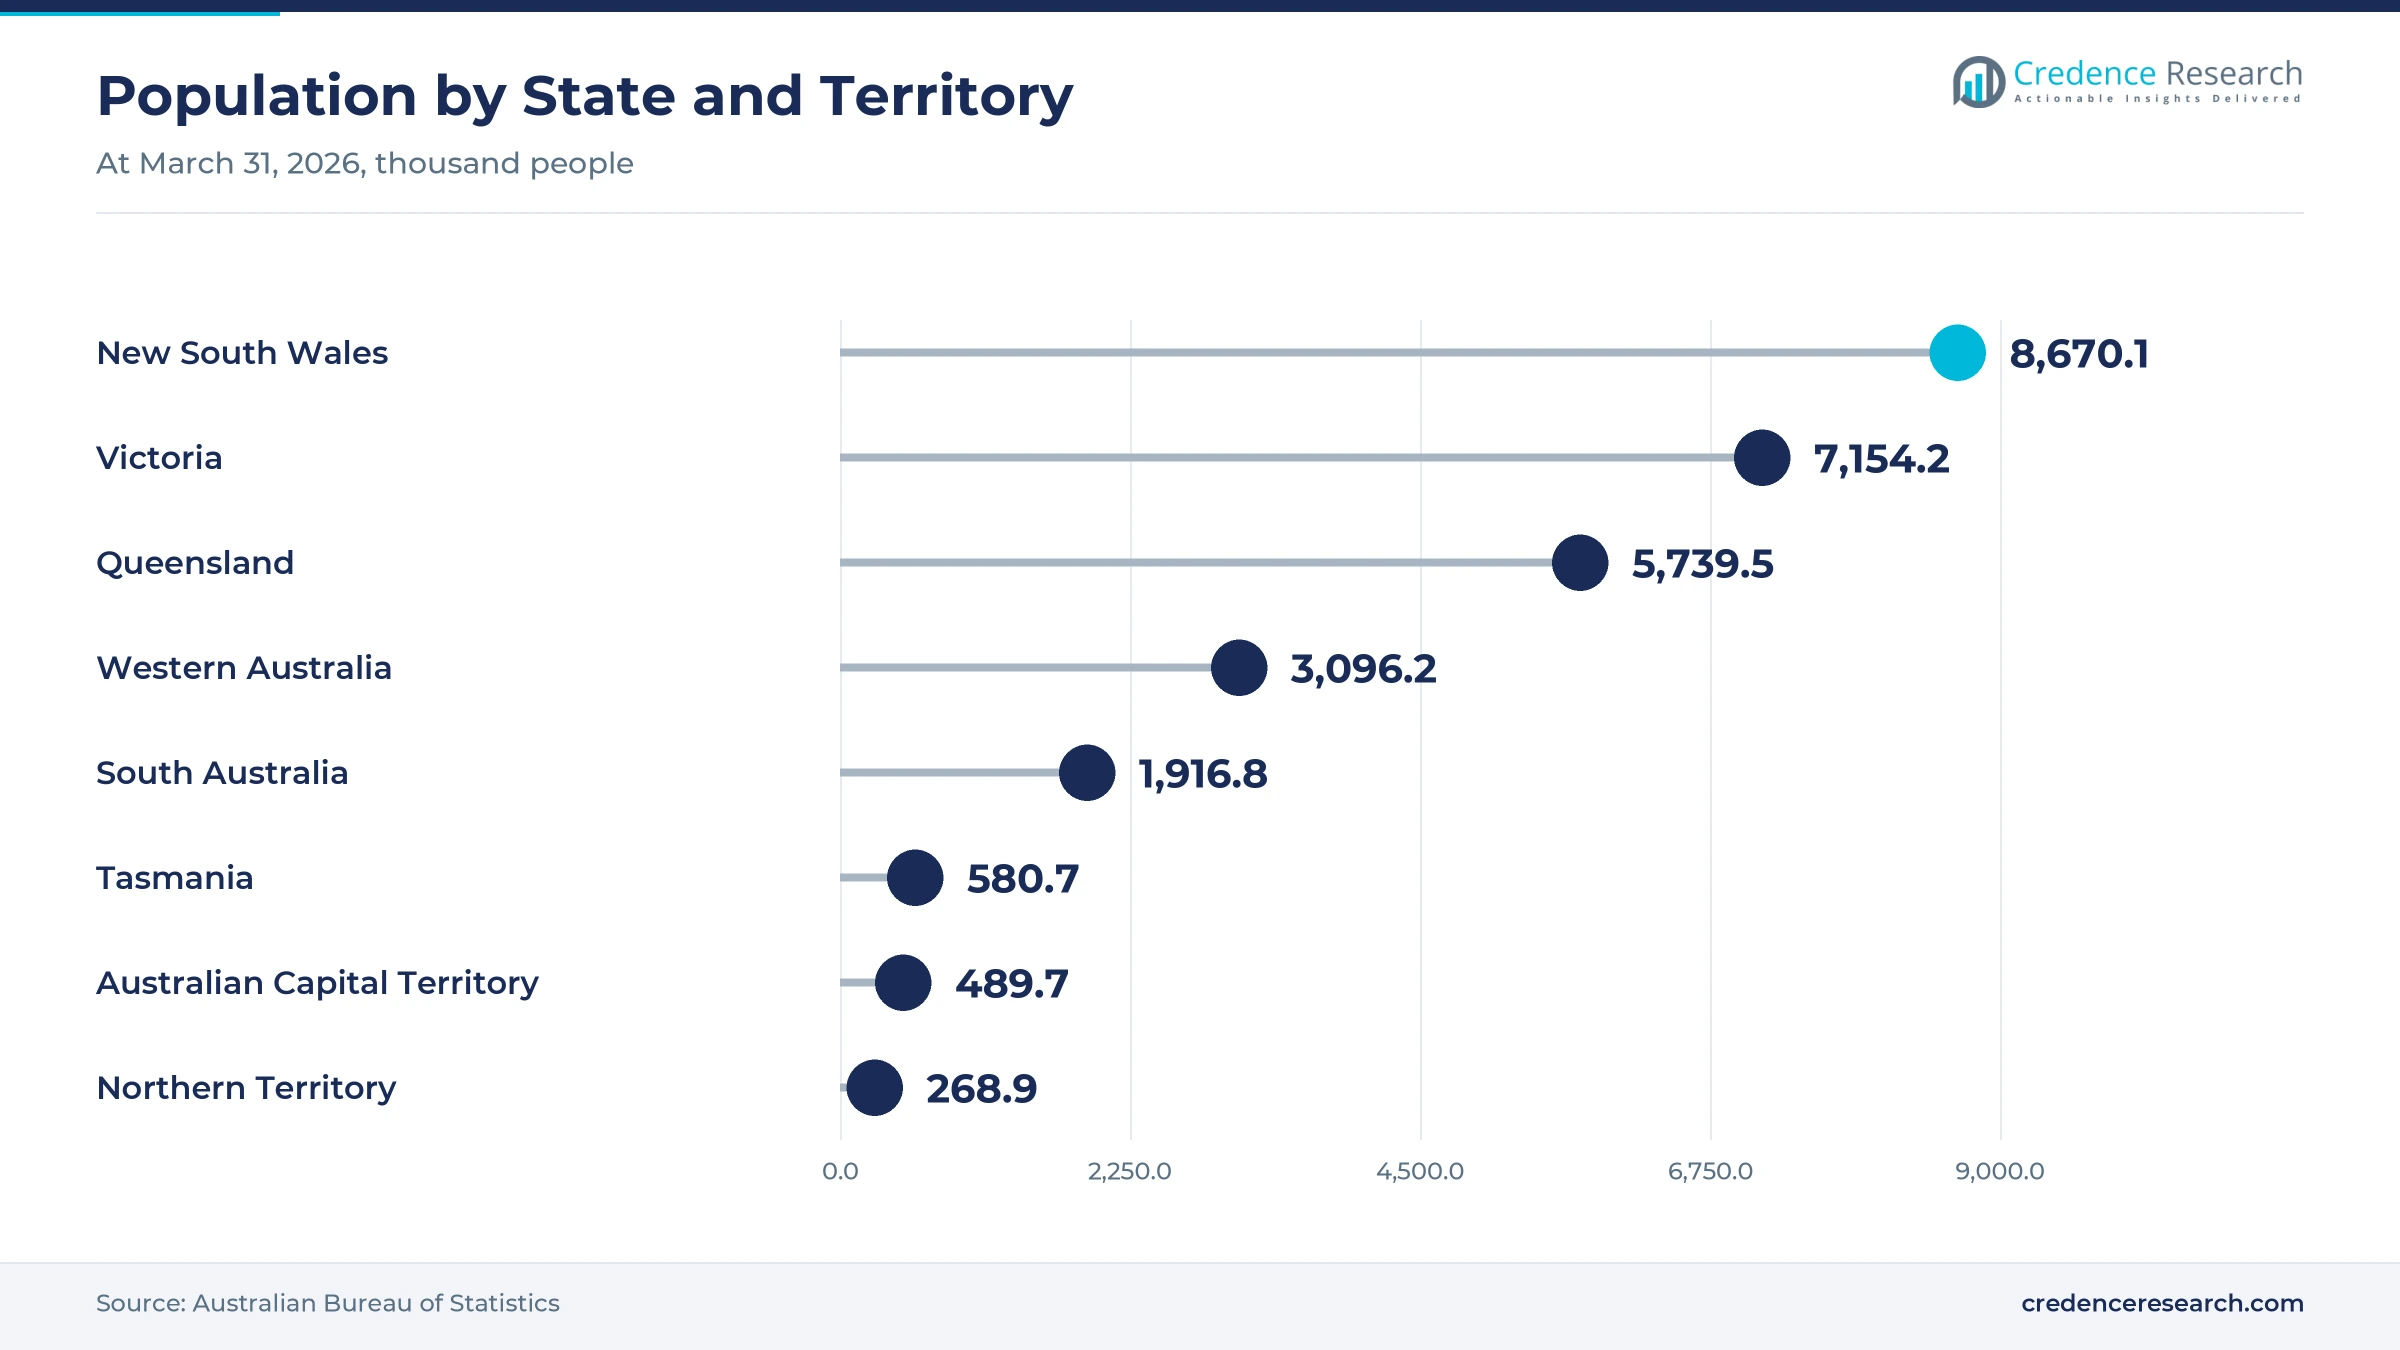
South Australia, Western Australia and the Northern Territory held a 22.7% share of 2025 value and grow at 6.06% a year. South Australia set a 2026 commercial kangaroo quota of 600,400 animals. Western Australia had the fastest population growth at 2.1% in the year to March 2026. As a result, sheepskin, kangaroo and cattle hide supply supports steady demand for processing chemicals across the three jurisdictions.
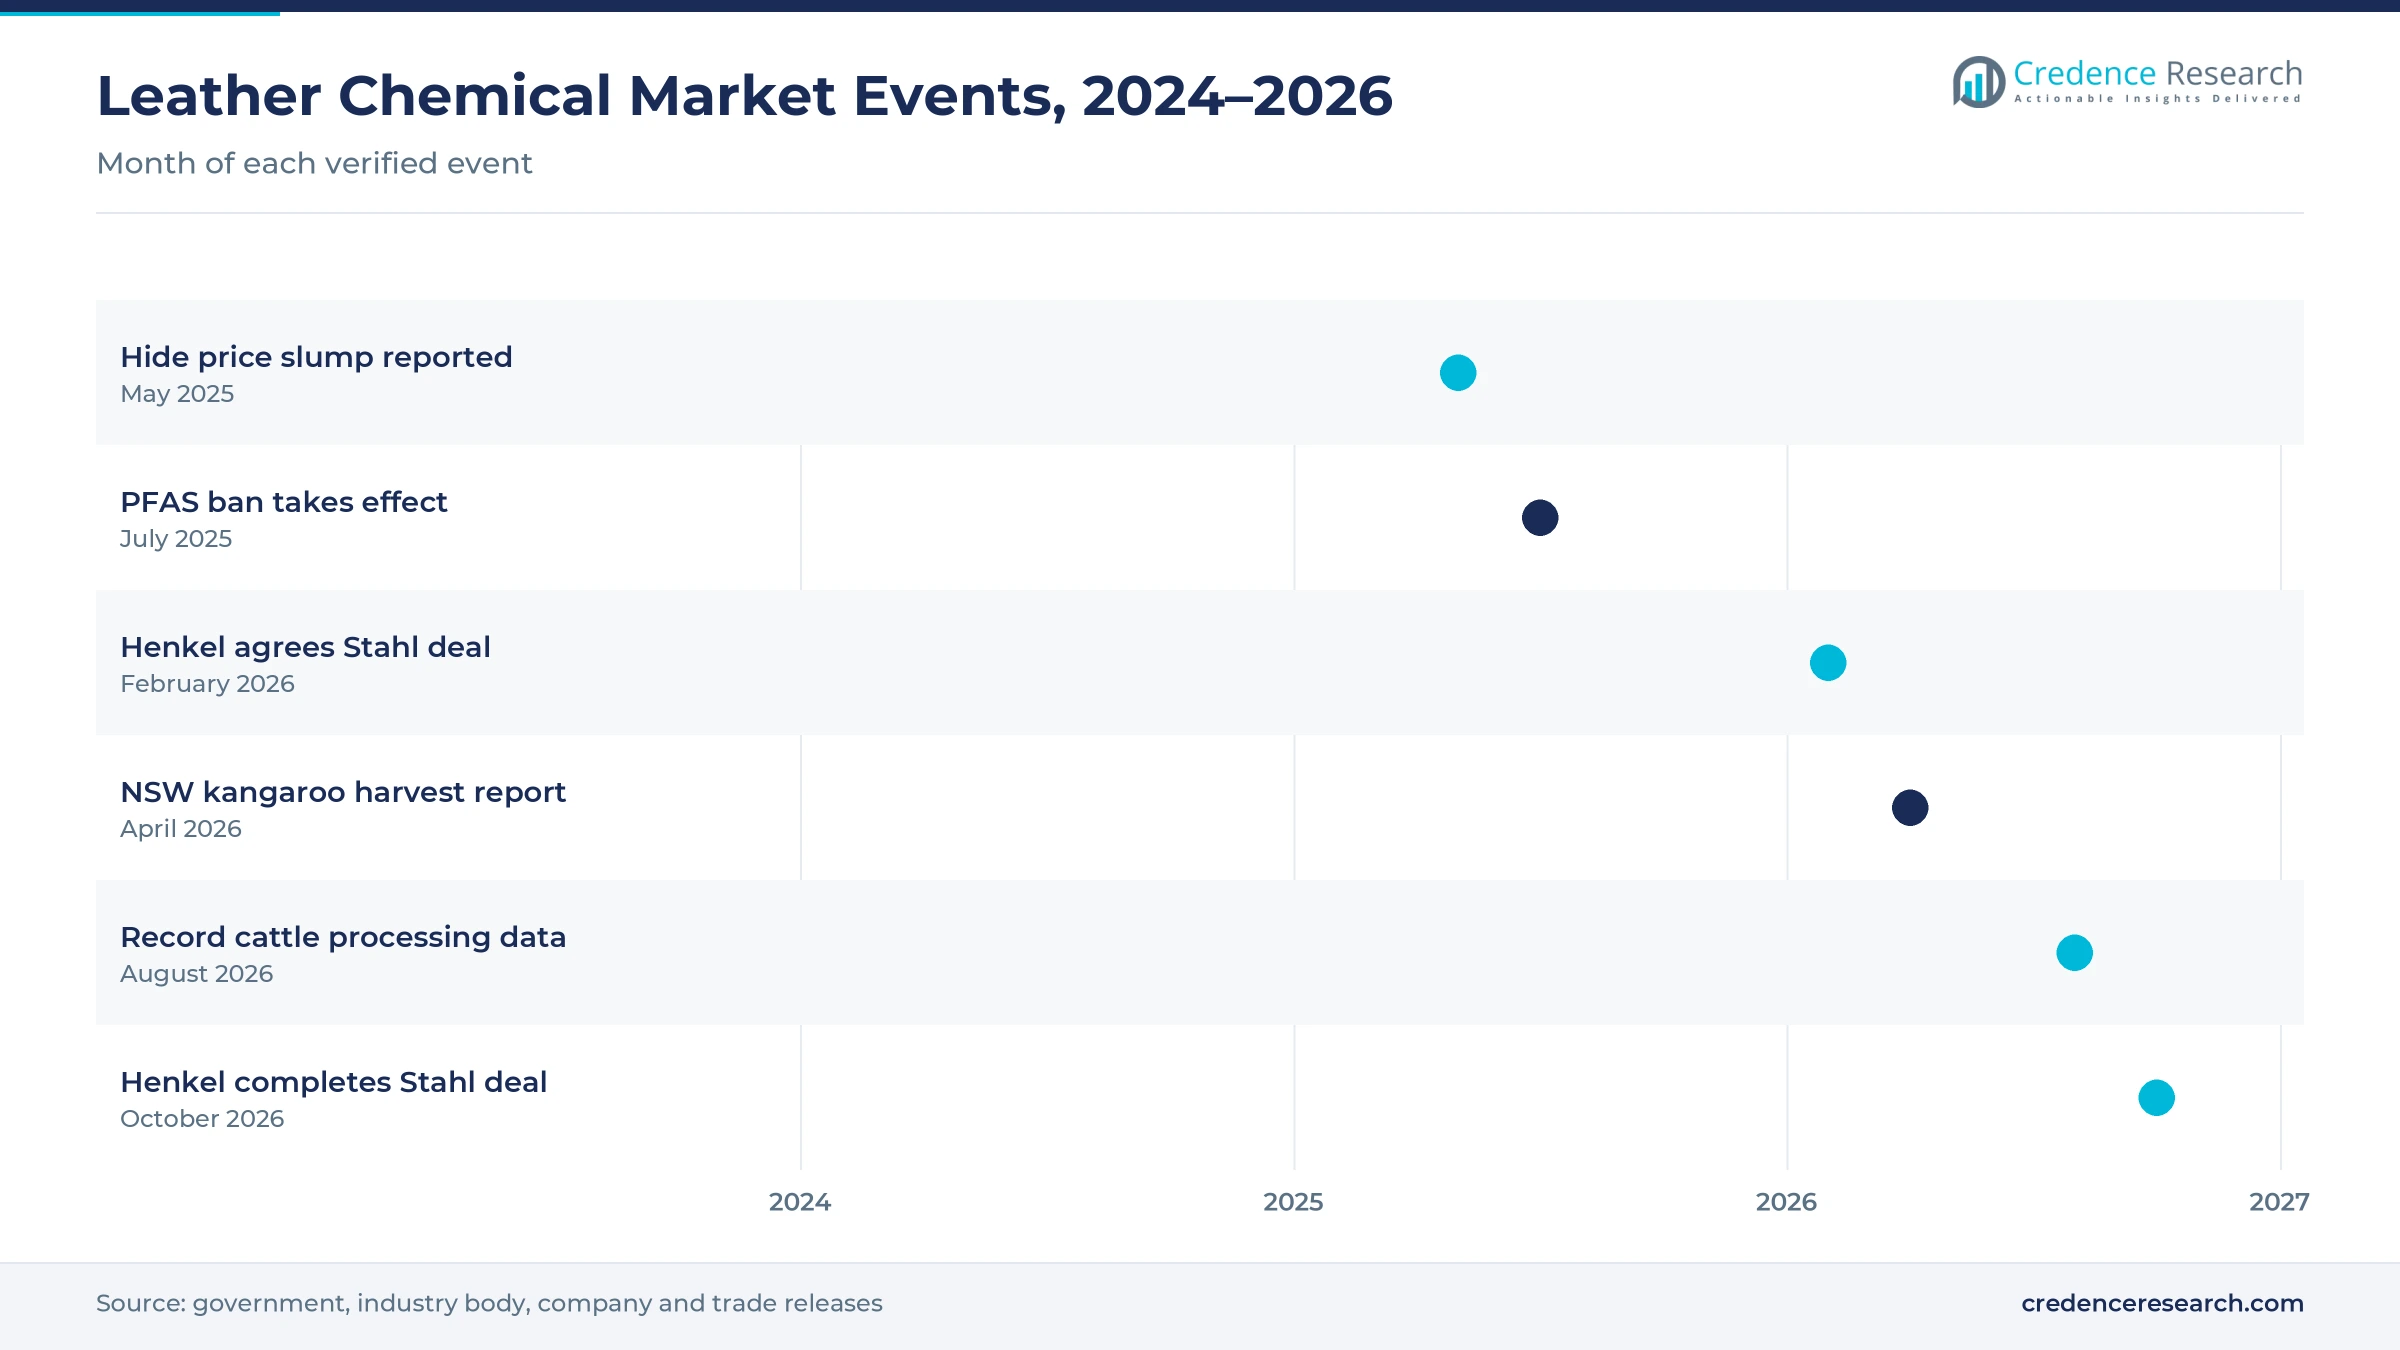
Supplier deals, PFAS rules and slaughter data, 2024–2026
| Development | Status and market relevance |
|---|---|
| In May 2025, Beef Central reported that Australian hide prices in April were down roughly 28% to 61% on a year earlier. | Signals pressure on tanning budgets |
| In July 2025, Australia banned the import, manufacture and use of PFOS, PFOA and PFHxS in commercial goods. | Moves finishers to fluorine-free grades |
| In February 2026, Henkel agreed to acquire Stahl Group from Wendel, BASF and Clariant in a EUR 2.1 billion deal. | Consolidates leather finishing supply |
| In April 2026, New South Wales reported a 2025 commercial kangaroo harvest of 634,087 animals, 29.0% of quota. | Shows weak kangaroo skin demand |
| In August 2026, Meat and Livestock Australia reported that nearly 9.6 million cattle were processed in 2025-26. | Lifts hide volumes for processing |
Mineral, vegetable, synthetic and enzyme systems compete
- Mineral-based systems use chrome and other metal salts to make stable, soft wet blue quickly, and they still handle most cattle hide volume.
- Vegetable-based systems use plant tannins to make firm, natural leather for saddlery, belts and footwear, although tanning takes longer.
- Synthetic organic systems use syntans, aldehydes and polymers for chrome-free and white leathers that suit car interiors and children's shoes.
- Enzyme-based systems use biological catalysts in soaking, liming and bating to cut sulfide use, water and processing time.
Need a Custom Version of This Report?
Tailor the scope, geography, or segments to your exact requirements.
- Custom geography or segment scope
- Direct access to our analyst team
Global formulators and local agents compete on service
Competition combines global formulators with Australian agents and distributors that hold stock and give technical support. Stahl, now part of Henkel after a deal completed on Oct. 1, 2026, reaches Australian buyers through Leather Finishing Products Australia, its local agent. Leather Finishing Products Australia also makes cleaners, conditioners, pigments, dyes, topcoats and repair kits, and trains technicians. Angelus finishing products are sold through Australian art and hobby retailers. DyStar offers leather dyes, fatliquors and auxiliaries under the Boehme name, although its direct Australian activity was not verified for this report. TFL, Fenice, UNITERS, Lederzentrum, Kelvin Bio Organics and Brother Enterprises supply tanning and finishing chemistry worldwide. Companies compete on recipe range, compliance data, technical service, stock depth and price.
Companies profiled and their roles in this market
| Company | Type | Role in the market |
|---|---|---|
| Stahl Holdings B.V. | Global formulator | Leather finishing and coatings; Henkel deal completed Oct. 2026 |
| Leather Finishing Products (Australia) Pty Ltd | Local agent and maker | Stahl agent; care, repair and finishing products |
| Angelus Shoe Polish Company | Finishing brand | Finishers and dyes sold through Australian retailers |
| DyStar Group | Global formulator | Leather dyes, fatliquors and auxiliaries |
Credence Research sees finishing and repair setting pace
Credence Research's view is that Australian demand for leather chemicals will grow steadily through 2035, as record cattle slaughter, export traceability and leather repair keep buyers spending on better recipes. Tanning agents should keep the largest product share, while finishing chemicals gain most. New South Wales and the ACT will remain the largest region, although Queensland adds demand fastest. However, weak hide prices, few remaining tanneries and PFAS compliance will reward suppliers with local stock, documented grades and strong technical service for both processors and repairers.
Hide throughput and chemical intensity anchor the model
The report uses 2025 as the base year, with values in USD million at current prices. Market values come from the Credence Research model, which combines hide and skin throughput, chemical use per hide, repair activity and price tiers. The four regional zones and their 2025 shares follow the client brief, while regional growth and segment splits by product type, end-use industry, application and sales channel are Credence Research estimates. Sources used are official statistics, government reports, industry body releases, certification listings, company pages and news reports, and no interviews or surveys were used.
Processing, traceability and repair shape demand to 2035
The market is expected to reach USD 332.1 million by 2035, a 5.86% CAGR during 2026–2035, as hide processing, compliance and leather repair keep demand rising. Spending is projected to rise from USD 199.0 million in 2026 as processors handle record cattle numbers. Growth should be strongest in finishing chemicals, finished leather reconditioning and Queensland, while New South Wales and the ACT keep the largest share. In contrast, weak hide prices, tannery closures and lower kangaroo leather demand could slow orders in some years.
Frequently Asked Questions
How big is the Australia leather chemicals market?
Which region leads demand?
Which region grows fastest?
Which product type holds the largest share?
Which product type grows fastest?
How do PFAS rules affect the market?
Who are the leading companies in this market?
What are the main risks to growth?
Table of Content
Chapter 1 Market Segmentation
- 1.1 Segmentation Framework
- 1.1.1 Product and Service Classification
- 1.1.2 Application and End-Use Classification
- 1.1.3 Technology and Solution Classification
- 1.1.4 Customer and Distribution Channel Classification
- 1.1.5 Geographic Segmentation
- 1.1.6 Market Segment Definitions and Boundaries
- 1.2 By Product Type
- 1.2.1 Beamhouse chemicals
- 1.2.2 Tanning agents
- 1.2.3 Retanning dyeing and fatliquoring chemicals
- 1.2.4 Finishing chemicals
- 1.3 By End-Use Industry
- 1.3.1 Footwear manufacturing
- 1.3.2 Sheepskin processing
- 1.3.3 Upholstery manufacturing and refurbishment
- 1.3.4 Leather goods manufacturing
- 1.4 By Application
- 1.4.1 Bovine hide processing
- 1.4.2 Ovine skin processing
- 1.4.3 Kangaroo leather processing
- 1.4.4 Finished leather reconditioning
- 1.5 By Sales Channel
- 1.5.1 Direct manufacturer contracts
- 1.5.2 Technical distribution
- 1.5.3 Specialist trade supply
Chapter 2 Introduction
- 2.1 Report Objectives and Scope
- 2.2 Product Definition and Industry Terminology
- 2.3 Market Inclusions and Exclusions
- 2.4 Research Process
- 2.4.1 Primary Research and Expert Interviews
- 2.4.2 Secondary Research and Source Review
- 2.4.3 Top-Down and Bottom-Up Estimation
- 2.4.4 Data Triangulation and Verification
- 2.5 Market Size Measurement Basis
- 2.5.1 2025: USD 181.5 million → 2035: USD 332.1 million
- 2.6 Historical and Forecast Reference Periods
- 2.6.1 Historical Period: 2018-2025
- 2.6.2 Base Year: 2025
- 2.6.3 Forecast Period: 2025-2035
- 2.7 Research Assumptions and Limitations
Chapter 3 Executive Summary
- 3.1 Market Snapshot and Key Findings
- 3.2 Base-Year Market Size, 2025
- 3.3 Forecast Market Size, 2035
- 3.4 Revenue and Volume Growth Outlook
- 3.5 Key Demand and Supply Indicators
- 3.6 Leading Market Segments
- 3.7 Fastest-Growing Market Opportunities
- 3.8 Regional Performance Highlights
- 3.9 Technology and Industry Transformation
- 3.10 Competitive Landscape Summary
- 3.11 Analyst View and Strategic Implications
Chapter 4 Australia Leather Chemicals Market Trends and Developments
- 4.1 Historical Industry Development, 2018-2025
- 4.2 Recent Market Trends and Developments
- 4.3 Demand and Customer Behavior Trends
- 4.4 Technology and Product Innovation
- 4.5 Artificial Intelligence, Automation and Digitalization
- 4.6 Local Manufacturing and Supply Chain Realignment
- 4.7 Industry Partnerships, Mergers and Acquisitions
- 4.8 Sustainability and Circular Economy Developments
- 4.9 Government and Private Sector Investment Trends
- 4.10 Emerging Business Models and Commercialization
- 4.11 Industry Developments and Announcements
Chapter 5 Australia Leather Chemicals Market Production, Supply and Demand Analysis
- 5.1 Demand Trend and Consumption Analysis, 2018-2025
- 5.2 Demand Forecast, 2025-2035
- 5.3 Production and Output Trend, 2018-2025
- 5.4 Production and Output Forecast, 2025-2035
- 5.5 Installed Capacity and Capacity Utilization
- 5.6 Company-Wise Production Plants and Statistics
- 5.6.1 Installed Production Capacity
- 5.6.2 Actual Production
- 5.6.3 Planned Capacity and Expansion Targets
- 5.7 Supply Chain Structure and Procurement Trends
- 5.8 Supply-Demand Gap and Bottlenecks
- 5.9 Import Dependence and Sourcing Structure
- 5.10 Contract Manufacturing and Outsourcing
- 5.11 Regional Supply and Demand Concentration
Chapter 6 Australia Leather Chemicals Market Pricing Analysis
- 6.1 Pricing Structure and Measurement
- 6.2 Historical Pricing Trends, 2018-2025
- 6.3 Pricing Outlook, 2025-2035
- 6.4 Average Selling Price and Unit Economics
- 6.5 Pricing by Product and Market Segment
- 6.6 Geographic Pricing Differences
- 6.7 Key Input, Energy, Labor and Logistics Costs
- 6.8 Contract Pricing and Purchasing Models
- 6.9 Pricing Sensitivity and Competitive Positioning
- 6.10 Price, Margin and Profitability Implications
Chapter 7 Australia Leather Chemicals Market Dynamics
- 7.1 Market Growth Drivers
- 7.1.1 Demand-Side Drivers
- 7.1.2 Technology and Innovation Drivers
- 7.1.3 Infrastructure and Investment Drivers
- 7.1.4 Regulatory and Policy Drivers
- 7.2 Market Restraints
- 7.2.1 Cost and Affordability Constraints
- 7.2.2 Technology and Adoption Barriers
- 7.2.3 Supply Chain and Operational Constraints
- 7.3 Market Challenges
- 7.3.1 Competitive Pressure and Margin Erosion
- 7.3.2 Skills, Infrastructure and Implementation Gaps
- 7.4 Emerging Market Opportunities
- 7.5 Market Dynamics Impact and Time-Horizon Assessment
Chapter 8 Australia Leather Chemicals Value Chain Analysis
- 8.1 Industry Value Chain Overview
- 8.2 Upstream Suppliers and Critical Inputs
- 8.3 Technology and Component Providers
- 8.4 Manufacturing or Service Delivery
- 8.5 Distribution, Channel Partners and Integrators
- 8.6 Downstream Applications and End Users
- 8.7 Value Addition and Profit Pools
- 8.8 Vertical Integration and Outsourcing
- 8.9 Supplier Concentration and Risk
- 8.10 Supply Chain Localization and Resilience
Chapter 9 Australia Leather Chemicals Market Regulations and Policies
- 9.1 Relevant Laws, Standards and Compliance Frameworks
- 9.2 Product, Service, Safety and Quality Requirements
- 9.3 Government Policies, Incentives and Subsidies
- 9.4 Imports, Exports and Trade Barriers
- 9.5 Public Procurement and Local Content Requirements
- 9.6 Environmental and Sustainability Compliance
- 9.7 Upcoming Policy Changes and Market Implications
Chapter 10 Australia Leather Chemicals Market Hotspots and Opportunities
- 10.1 Market Opportunity Mapping and Growth Hotspots
- 10.2 High-Growth Applications and Customer Groups
- 10.3 Underserved Markets and White-Space Opportunities
- 10.4 Emerging Technology and Product Opportunities
- 10.5 New Capacity and Investment Hotspots
- 10.6 Market Entry and Expansion Opportunities
- 10.7 Distribution and Partnership Opportunities
- 10.8 Near-Term and Long-Term Commercial Potential
- 10.9 Opportunity Attractiveness and Execution Risks
Chapter 11 Australia Leather Chemicals Market Outlook, 2025-2035
- 11.1 Market Size and Analysis
- 11.1.1 Revenue (Market Measurement: 2025: USD 181.5 million → 2035: USD 332.1 million)
- 11.1.2 Market Volume and Quantity Sold
- 11.1.3 Historical Market Size, 2018-2025
- 11.1.4 Base-Year Market Size, 2025
- 11.2 Market Forecast, 2025-2035
- 11.2.1 Revenue Forecast to 2035
- 11.2.2 Volume Forecast to 2035
- 11.2.3 CAGR and Year-on-Year Growth
- 11.2.4 Incremental Revenue Opportunity
- 11.3 Forecast Assumptions and Scenario Analysis
- 11.3.1 Base-Case Forecast
- 11.3.2 Optimistic and Conservative Scenarios
- 11.3.3 Technology, Pricing and Policy Sensitivities
- 11.4 Market Attractiveness and Growth Outlook
Chapter 12 Australia Leather Chemicals Market Segmentation and Outlook
- 12.1 Segmentation Summary and Market Shares, 2025
- 12.2 Largest and Fastest-Growing Segments
- 12.3 By Product Type - Market Size and Forecast, 2025-2035
- 12.3.1 Segment Definition and Scope
- 12.3.2 Historical Market Size, 2018-2025
- 12.3.3 Revenue Forecast, 2025-2035
- 12.3.4 Volume Forecast, 2025-2035
- 12.3.5 Base-Year Market Share, 2025
- 12.3.6 Segment CAGR and Growth Drivers
- 12.3.7 Subsegment Market Size and Forecast
- 12.3.7.1 Beamhouse chemicals
- 12.3.7.2 Tanning agents
- 12.3.7.3 Retanning dyeing and fatliquoring chemicals
- 12.3.7.4 Finishing chemicals
- 12.3.8 Subsegment Pricing and Adoption Trends
- 12.3.9 Leading Suppliers and Competition
- 12.3.10 Regional Demand and Opportunities
- 12.4 By End-Use Industry - Market Size and Forecast, 2025-2035
- 12.4.1 Segment Definition and Scope
- 12.4.2 Historical Market Size, 2018-2025
- 12.4.3 Revenue Forecast, 2025-2035
- 12.4.4 Volume Forecast, 2025-2035
- 12.4.5 Base-Year Market Share, 2025
- 12.4.6 Segment CAGR and Growth Drivers
- 12.4.7 Subsegment Market Size and Forecast
- 12.4.7.1 Footwear manufacturing
- 12.4.7.2 Sheepskin processing
- 12.4.7.3 Upholstery manufacturing and refurbishment
- 12.4.7.4 Leather goods manufacturing
- 12.4.8 Subsegment Pricing and Adoption Trends
- 12.4.9 Leading Suppliers and Competition
- 12.4.10 Regional Demand and Opportunities
- 12.5 By Application - Market Size and Forecast, 2025-2035
- 12.5.1 Segment Definition and Scope
- 12.5.2 Historical Market Size, 2018-2025
- 12.5.3 Revenue Forecast, 2025-2035
- 12.5.4 Volume Forecast, 2025-2035
- 12.5.5 Base-Year Market Share, 2025
- 12.5.6 Segment CAGR and Growth Drivers
- 12.5.7 Subsegment Market Size and Forecast
- 12.5.7.1 Bovine hide processing
- 12.5.7.2 Ovine skin processing
- 12.5.7.3 Kangaroo leather processing
- 12.5.7.4 Finished leather reconditioning
- 12.5.8 Subsegment Pricing and Adoption Trends
- 12.5.9 Leading Suppliers and Competition
- 12.5.10 Regional Demand and Opportunities
- 12.6 By Sales Channel - Market Size and Forecast, 2025-2035
- 12.6.1 Segment Definition and Scope
- 12.6.2 Historical Market Size, 2018-2025
- 12.6.3 Revenue Forecast, 2025-2035
- 12.6.4 Volume Forecast, 2025-2035
- 12.6.5 Base-Year Market Share, 2025
- 12.6.6 Segment CAGR and Growth Drivers
- 12.6.7 Subsegment Market Size and Forecast
- 12.6.7.1 Direct manufacturer contracts
- 12.6.7.2 Technical distribution
- 12.6.7.3 Specialist trade supply
- 12.6.8 Subsegment Pricing and Adoption Trends
- 12.6.9 Leading Suppliers and Competition
- 12.6.10 Regional Demand and Opportunities
- 12.7 Segment Growth Comparison
- 12.8 Segment Attractiveness and Priority Matrix
Chapter 13 Australia Leather Chemicals End-Use and Application Market Outlook
- 13.1 End-Use Industry and Customer Demand Structure
- 13.2 Leading Applications and Customer Groups
- 13.3 End-Use Market Size, Share and Forecast
- 13.4 Major End-Use Industry Deep Dives
- 13.4.1 Customer Requirements and Use Cases
- 13.4.2 Demand and Replacement Cycles
- 13.4.3 Technical and Regulatory Considerations
- 13.4.4 Purchasing and Procurement Models
- 13.4.5 Leading Vendors and Distribution Channels
- 13.4.6 Forecast and Commercial Opportunities
- 13.5 Emerging Applications and Cross-Segment Demand
- 13.6 End-Use Industry Investment Priorities
Chapter 14 Australia Leather Chemicals Geographic Market Outlook, 2025-2035
- 14.1 Domestic Market Distribution and Demand Clusters
- 14.2 State- or Province-Wise Market Size and Forecast, 2025-2035
- 14.3 City and Metropolitan Market Outlook
- 14.4 Industrial, Manufacturing and Commercial Clusters
- 14.5 Geographic Concentration of Key End Users
- 14.6 Local Pricing and Purchasing Differences
- 14.7 Domestic Production Facilities and Capacity Map
- 14.8 Local Infrastructure and Project Pipeline
- 14.9 State-Level Policy and Incentive Differences
- 14.10 Subnational Investment Hotspots and Opportunities
- 14.11 Distribution and Logistics Networks
- 14.12 Domestic Competitive Footprint
Chapter 15 Australia Leather Chemicals Technology, Innovation and Sustainability Outlook
- 15.1 Technology Landscape and Maturity
- 15.2 Product, Process and Service Innovation
- 15.3 AI, Automation and Digital Tools in the Industry
- 15.4 Technology Adoption and Performance Benchmarking
- 15.5 Innovation Pipeline and R&D Investment
- 15.6 Patent and Intellectual Property Trends
- 15.7 Energy Efficiency and Resource Management
- 15.8 Sustainability, Recycling and Circularity
- 15.9 Technology Roadmap, 2025-2035
- 15.10 Risks of Obsolescence and Technology Substitution
Chapter 16 Australia Leather Chemicals Market Key Strategic Imperatives
- 16.1 Growth and Market Entry Priorities
- 16.2 High-Return Products and Segments
- 16.3 Pricing, Profitability and Cost Optimization
- 16.4 Technology Investment and Product Differentiation
- 16.5 Supply Chain Localization and Resilience
- 16.6 Distribution and Customer Acquisition
- 16.7 Partnership, Acquisition and Capacity Strategy
- 16.8 Regional Expansion Priorities
- 16.9 Short-, Medium- and Long-Term Actions
Chapter 17 Competition Outlook
- 17.1 Industry Competition Characteristics
- 17.2 Market Structure and Concentration
- 17.3 Market Share and Competitive Positioning, 2025
- 17.4 Company-Wise Revenue and Product Benchmarking
- 17.5 Production and Service Capacity Benchmarking
- 17.6 Technology, Pricing and Differentiation
- 17.7 Regional Footprint and Distribution Strength
- 17.8 Mergers, Acquisitions and Strategic Alliances
- 17.9 New Entrants and Competitive Threats
- 17.10 Porter's Five Forces and Industry Attractiveness
- 17.11 Competitive Outlook, 2025-2035
Chapter 18 Company Profiles
- 18.1 Company Coverage and Selection Criteria
- 18.2 Stahl Holdings B.V.
- 18.2.1 Business Description
- 18.2.2 Company Ownership and Geographic Presence
- 18.2.3 Product and Service Portfolio
- 18.2.4 Manufacturing and Operating Footprint
- 18.2.5 Production Capacity and Expansion Plans
- 18.2.6 Financial Performance and Investment
- 18.2.7 Market Share and Competitive Position
- 18.2.8 Technology and Innovation Capabilities
- 18.2.9 Strategic Alliances or Partnerships
- 18.2.10 Recent Developments
- 18.2.11 Growth Strategy and Outlook
- 18.3 TFL Ledertechnik GmbH
- 18.4 DyStar Group
- 18.5 Brother Enterprises Holding Co., Ltd.
- 18.6 Fenice S.p.A.
- 18.7 UNITERS S.p.A.
- 18.8 Lederzentrum GmbH
- 18.9 Kelvin Bio Organics Pvt Ltd
- 18.10 Leather Finishing Products (Australia) Pty Ltd
- 18.11 Angelus Shoe Polish Company
- 18.12 Other Relevant Market Participants
Note: Every listed company is profiled on the structure shown under the first company. The company list is preliminary and may change based on research findings, market developments, data availability and client requirements.
Chapter 19 Disclaimer
- 19.1 Research and Forecast Disclaimer
- 19.2 Data Source and Estimation Limitations
Note: The depth of individual sections depends on data availability for this market. Volume, capacity, trade and other unit-based metrics are included where applicable.

