
Wellness blending and spice flavor work lift rhizome use
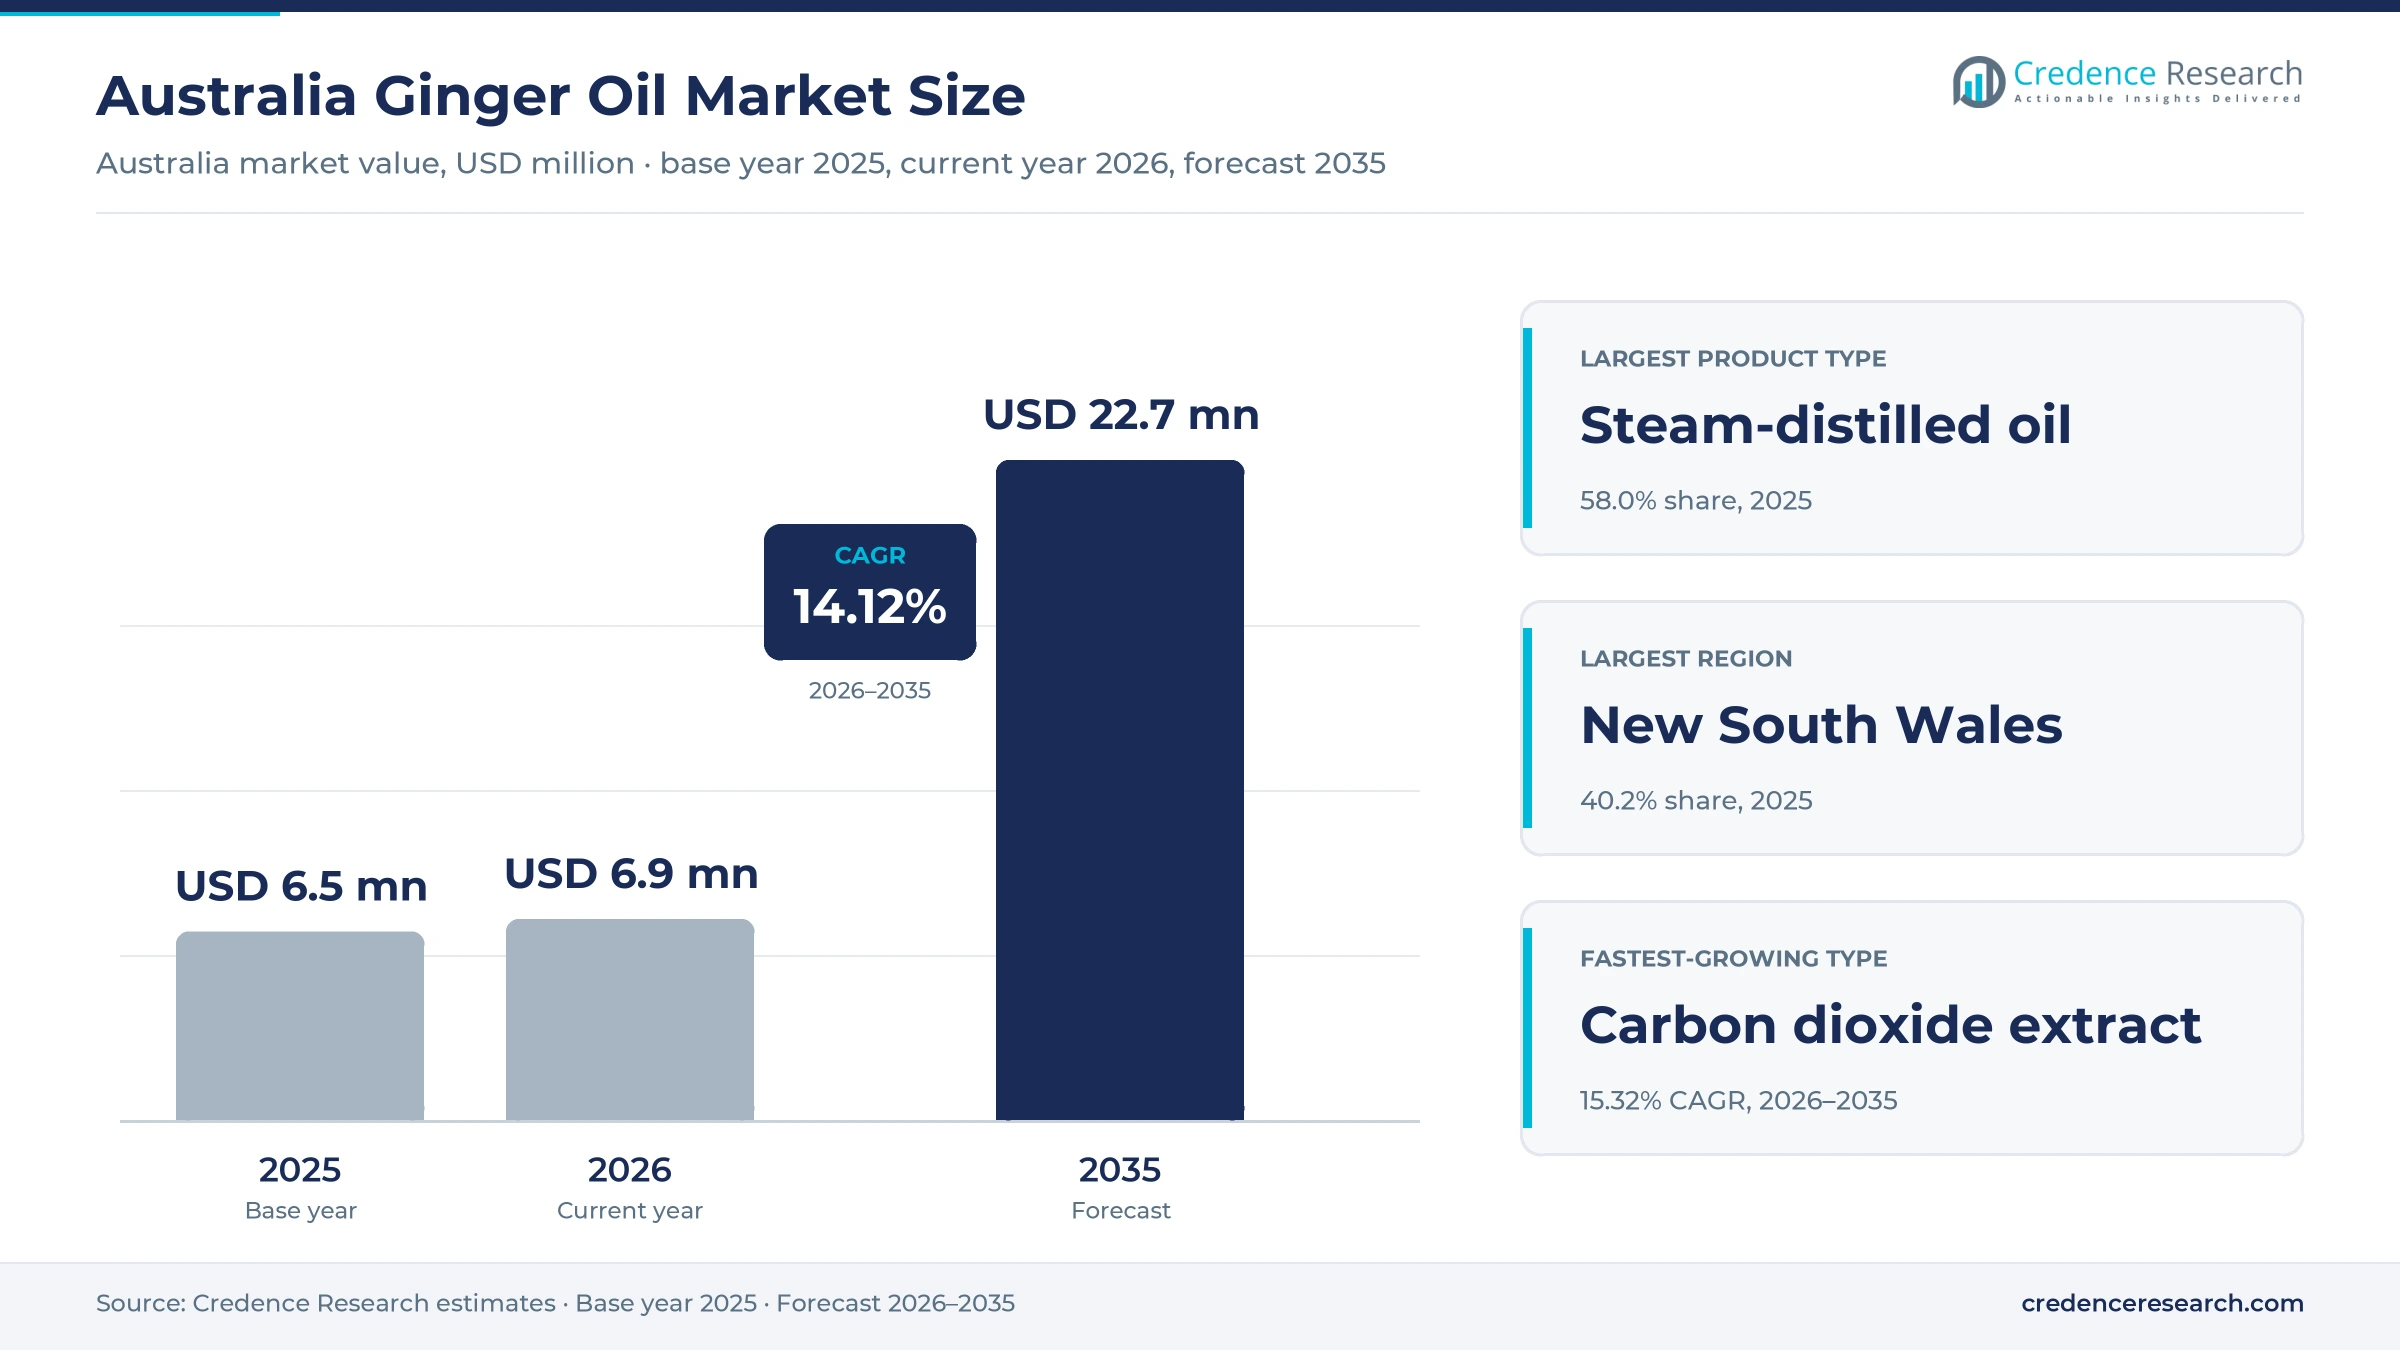
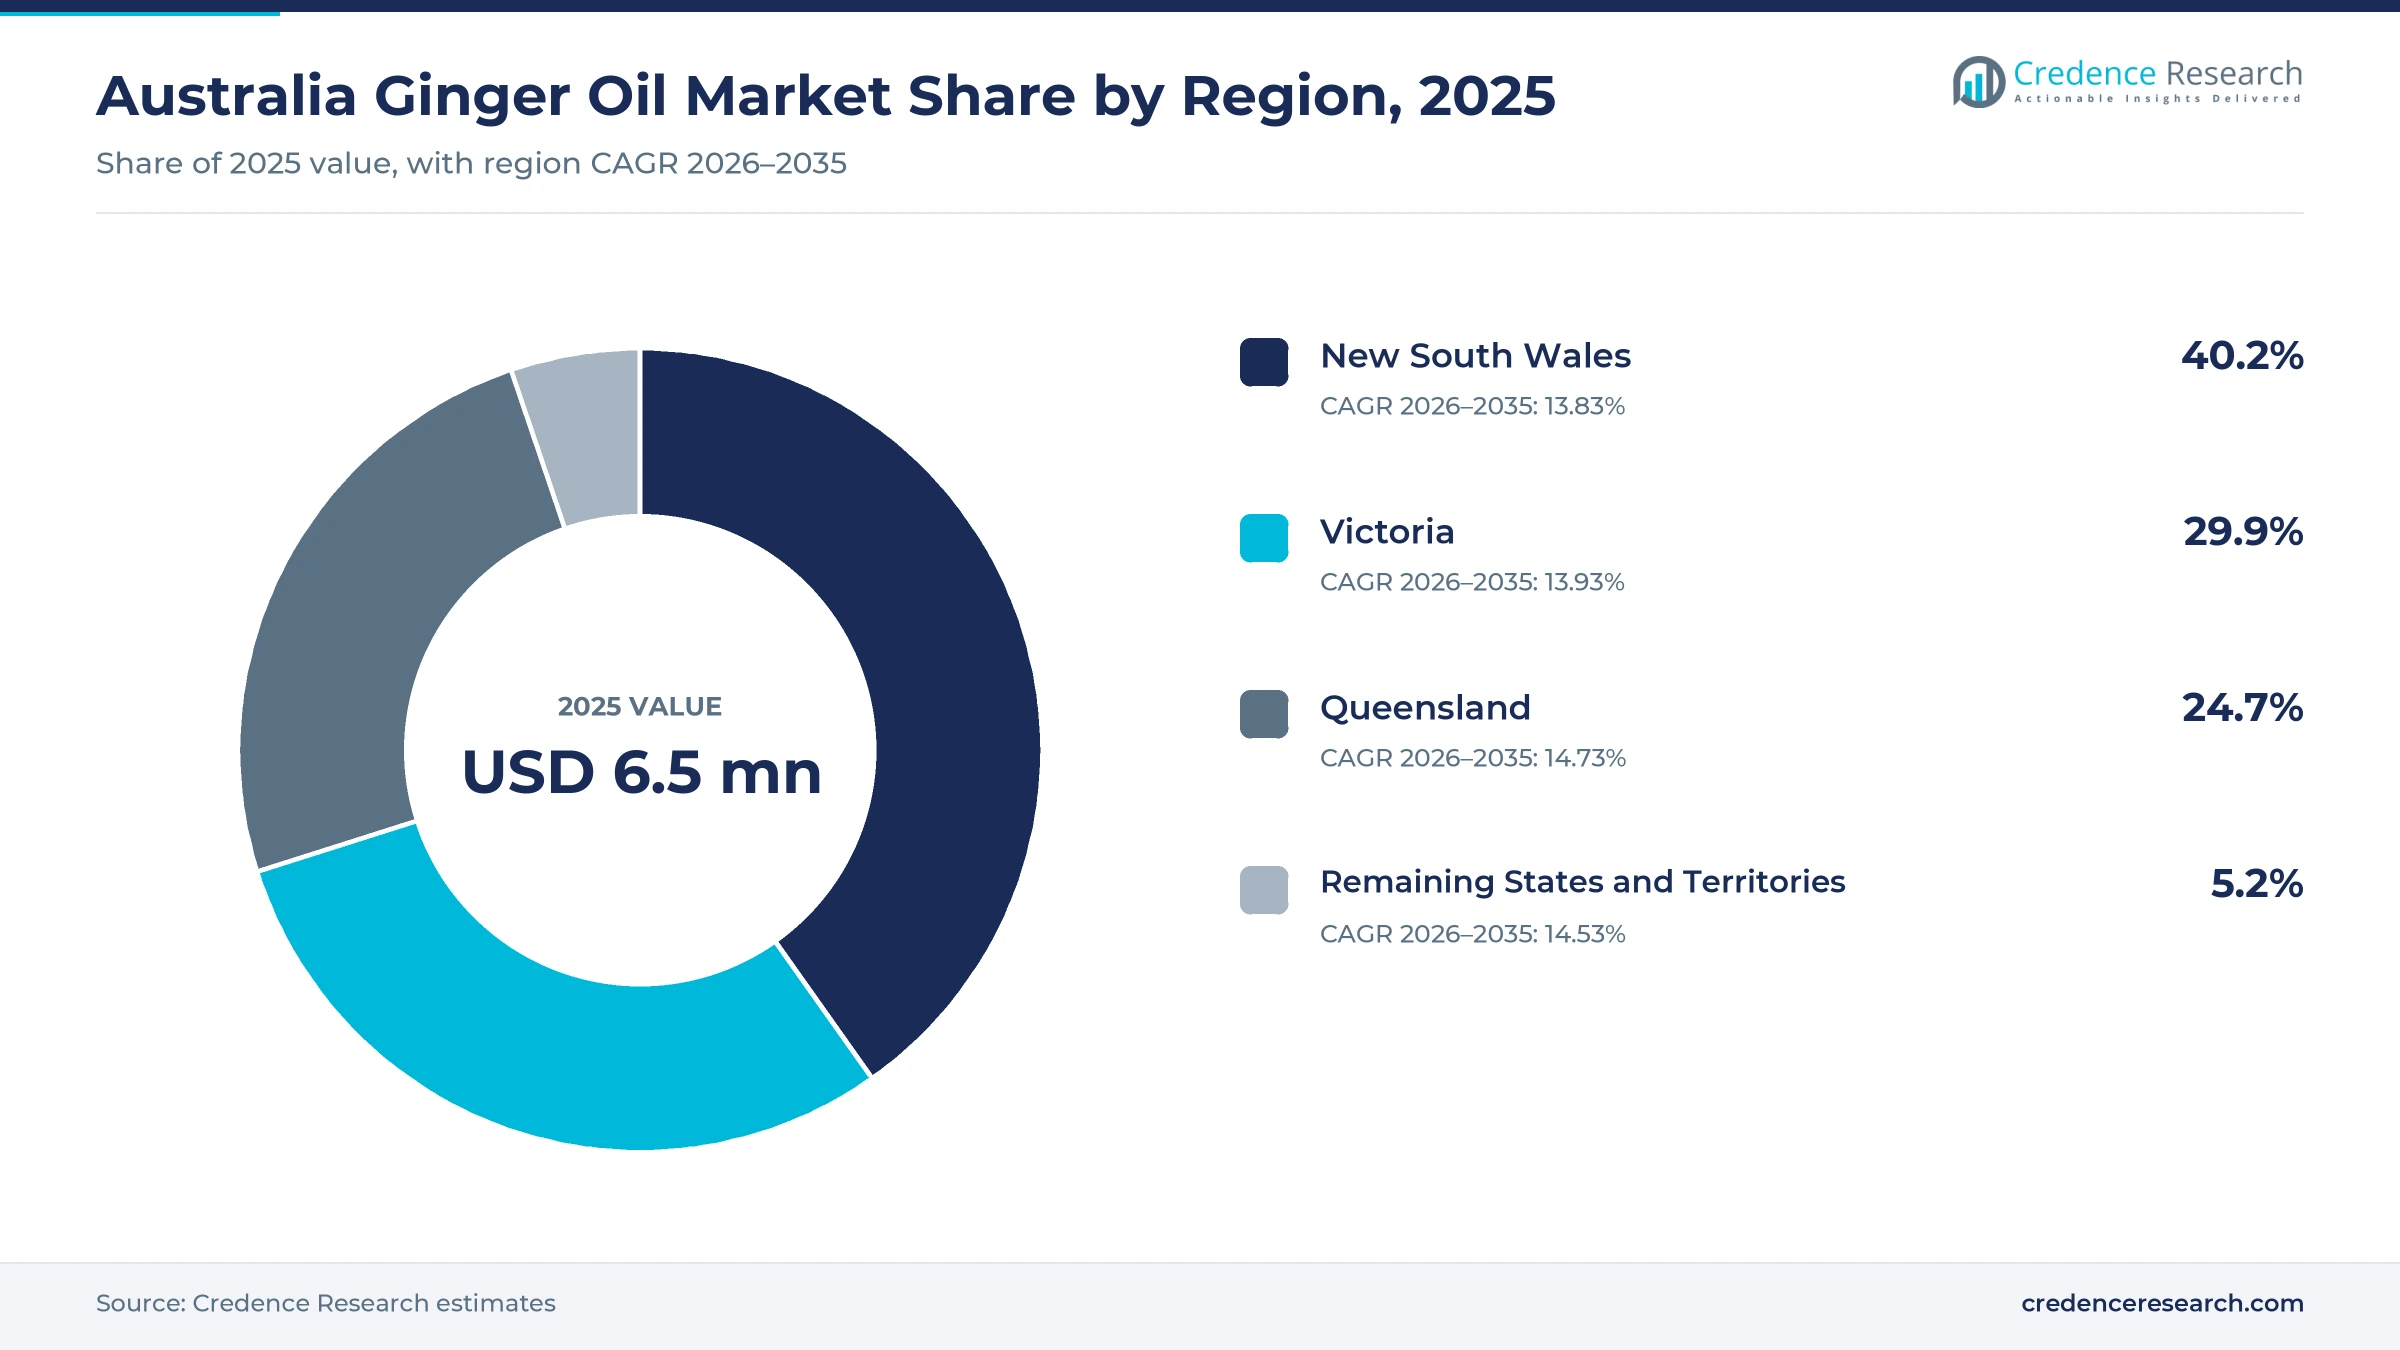
The Australia ginger oil market was valued at USD 6.5 million in 2025 and is projected to increase from USD 6.9 million in 2026 to USD 22.7 million by 2035, registering a CAGR of 14.12% during 2026–2035. Demand comes from aromatherapy blenders, skin and hair care formulators, cleaning product makers, beverage and confectionery flavor houses, and practitioners who buy small volumes of rhizome distillate and extract. New South Wales held the largest regional share, 40.2% in 2025, because blending houses, contract formulators and wellness retailers cluster around Sydney. Queensland is the fastest-growing region at 14.73% a year, as the state grows almost all of the national rhizome crop and supports processing work nearby. In turn, tighter ingredient documentation under the national food and therapeutic goods frameworks is pushing buyers toward suppliers that can show origin, batch data and composition for every lot.
Which distillates, extracts and oleoresins are counted?
The estimate measures spending in Australia on volatile distillate and extract obtained from the rhizome of Zingiber officinale, together with solvent-extracted oleoresin that carries both aroma and pungent principles. It counts material bought by blenders, formulators, flavor houses, practitioners and retail businesses for resale or for use in finished goods. Values are stated in USD million at current prices and exclude goods and services tax.
The estimate excludes fresh and dried rhizome, confectionery and beverage products, carrier oils and blends sold under consumer brand names at the shelf. The value chain runs from growers and overseas distillers through importers, ingredient distributors and wholesalers to blending houses, formulators, practitioners and specialty retailers across every state and territory.
Australia Ginger Oil Market Insights
- The Australia ginger oil market was valued at USD 6.5 million in 2025 and is projected to reach USD 22.7 million by 2035, at a 14.12% CAGR during 2026–2035.
- New South Wales held a 40.2% share of 2025 value, because blending houses and wellness retailers cluster around Sydney.
- Steam-distilled material led product types with a 58.0% share of 2025 value, because distillation remains the cheapest reliable route.
- Australia imported essential oils worth USD 24.01 million, or 972,074 kilograms, during 2023, with China, the United States and India the largest suppliers.
- Volatile carbon dioxide extract grows fastest at 15.32% a year during 2026–2035, as formulators seek fuller rhizome aroma without heat damage.
Steam distillation leads while carbon dioxide gains fastest
Why does steam distillation still carry most volume?
Based on product type, the market is categorized into steam-distilled essential oil, volatile carbon dioxide extract, solvent-extracted oleoresin and nonvolatile carbon dioxide extract. Steam-Distilled Essential Oil led with a 58.0% share of 2025 value, because distillers can run the rhizome at scale and quote a known composition. Volatile Carbon Dioxide Extract grows fastest at 15.32% a year, as buyers pay more for extracts that keep heat-sensitive aroma molecules intact.
Why does wellness blending absorb the most material?
Based on application, the market is categorized into aromatherapy and wellness, personal care and household formulation, food and beverage flavoring, and complementary medicine. Aromatherapy and Wellness led with a 42.0% share of 2025 value, because diffuser blends, massage bases and room sprays use warm spice notes in small doses. Complementary Medicine grows fastest at 14.79% a year, as practitioner products and documented ingredients gain ground.
Who writes the largest orders each year?
Based on customer type, the market is categorized into finished-product manufacturers, retail businesses and practitioner and direct buyers. Finished-Product Manufacturers led with a 46.0% share of 2025 value, because contract blenders and personal care plants buy against annual recipes. Practitioner and Direct Buyers grow fastest at 14.74% a year, as clinics, therapists and small makers order single kilograms with full batch paperwork.
Distributors, wholesale ranges or direct supply?
Based on distribution channel, the market is categorized into ingredient distributors, brand wholesale and direct supply. Ingredient Distributors led with a 44.0% share of 2025 value, because importers hold stock, documents and technical data for many formulators at once. Direct Supply grows fastest at 14.96% a year, as sellers ship from their own warehouses to practitioners and small brands.
| Segment Group | Leading Sub-segment | Share, 2025 | Fastest-growing Sub-segment | CAGR, 2026–2035 |
|---|---|---|---|---|
| By Product Type | Steam-Distilled Essential Oil | 58.0% | Volatile Carbon Dioxide Extract | 15.32% |
| By Application | Aromatherapy and Wellness | 42.0% | Complementary Medicine | 14.79% |
| By Customer Type | Finished-Product Manufacturers | 46.0% | Practitioner and Direct Buyers | 14.74% |
| By Distribution Channel | Ingredient Distributors | 44.0% | Direct Supply | 14.96% |
Request a Free Sample
Fill in your details and we'll send you a free sample report.
- Sample data tables & charts
- Research methodology
Aroma blending, flavor rules and local crops drive buying
How does aromatic ingredient demand lift volumes?
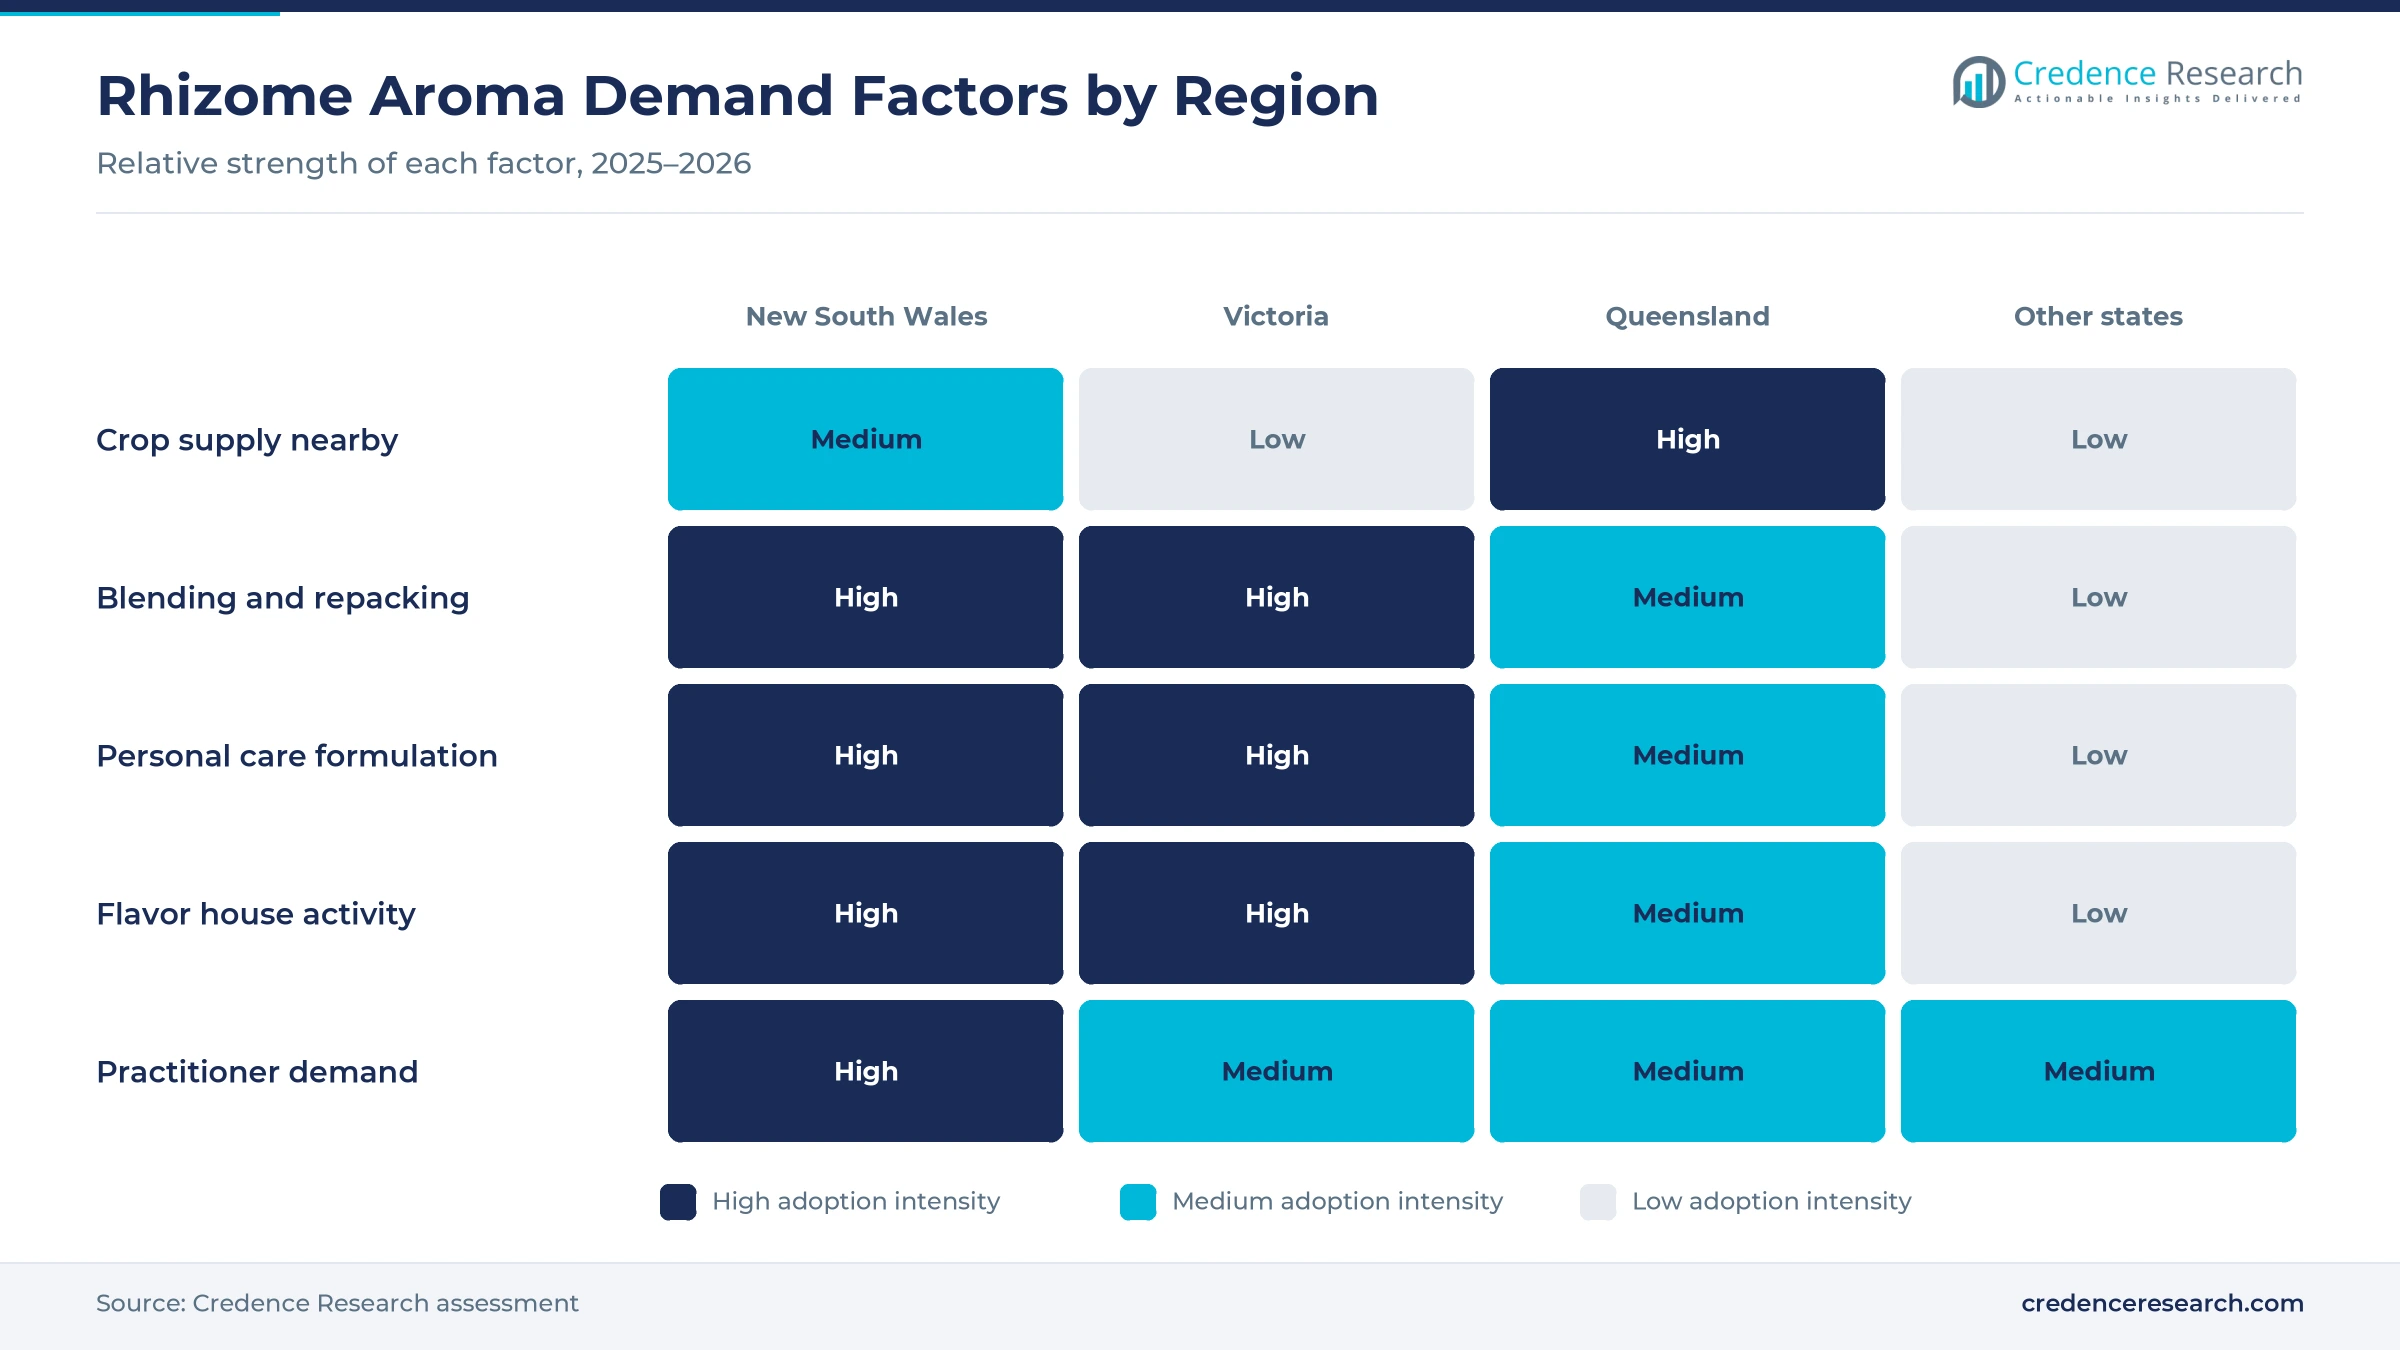
Aromatic ingredient demand lifts volumes, because diffuser blends, massage bases, room sprays and warming balms all call for a sharp spice note in small doses. Australia imported essential oils worth USD 24.01 million, or 972,074 kilograms, during 2023, and the largest suppliers were China at USD 6.01 million, the United States at USD 4.18 million and India at USD 2.97 million, according to recorded trade flows. Perfect Potion sells a steam-distilled rhizome product of Indian origin at AUD 28.95 for a small retail bottle, which shows how much value sits in packed goods. In turn, aromatherapy and wellness holds the largest application share at 42.0%, and ginger oil orders cluster around the largest blending hubs.
Why do food formulation requirements support demand?
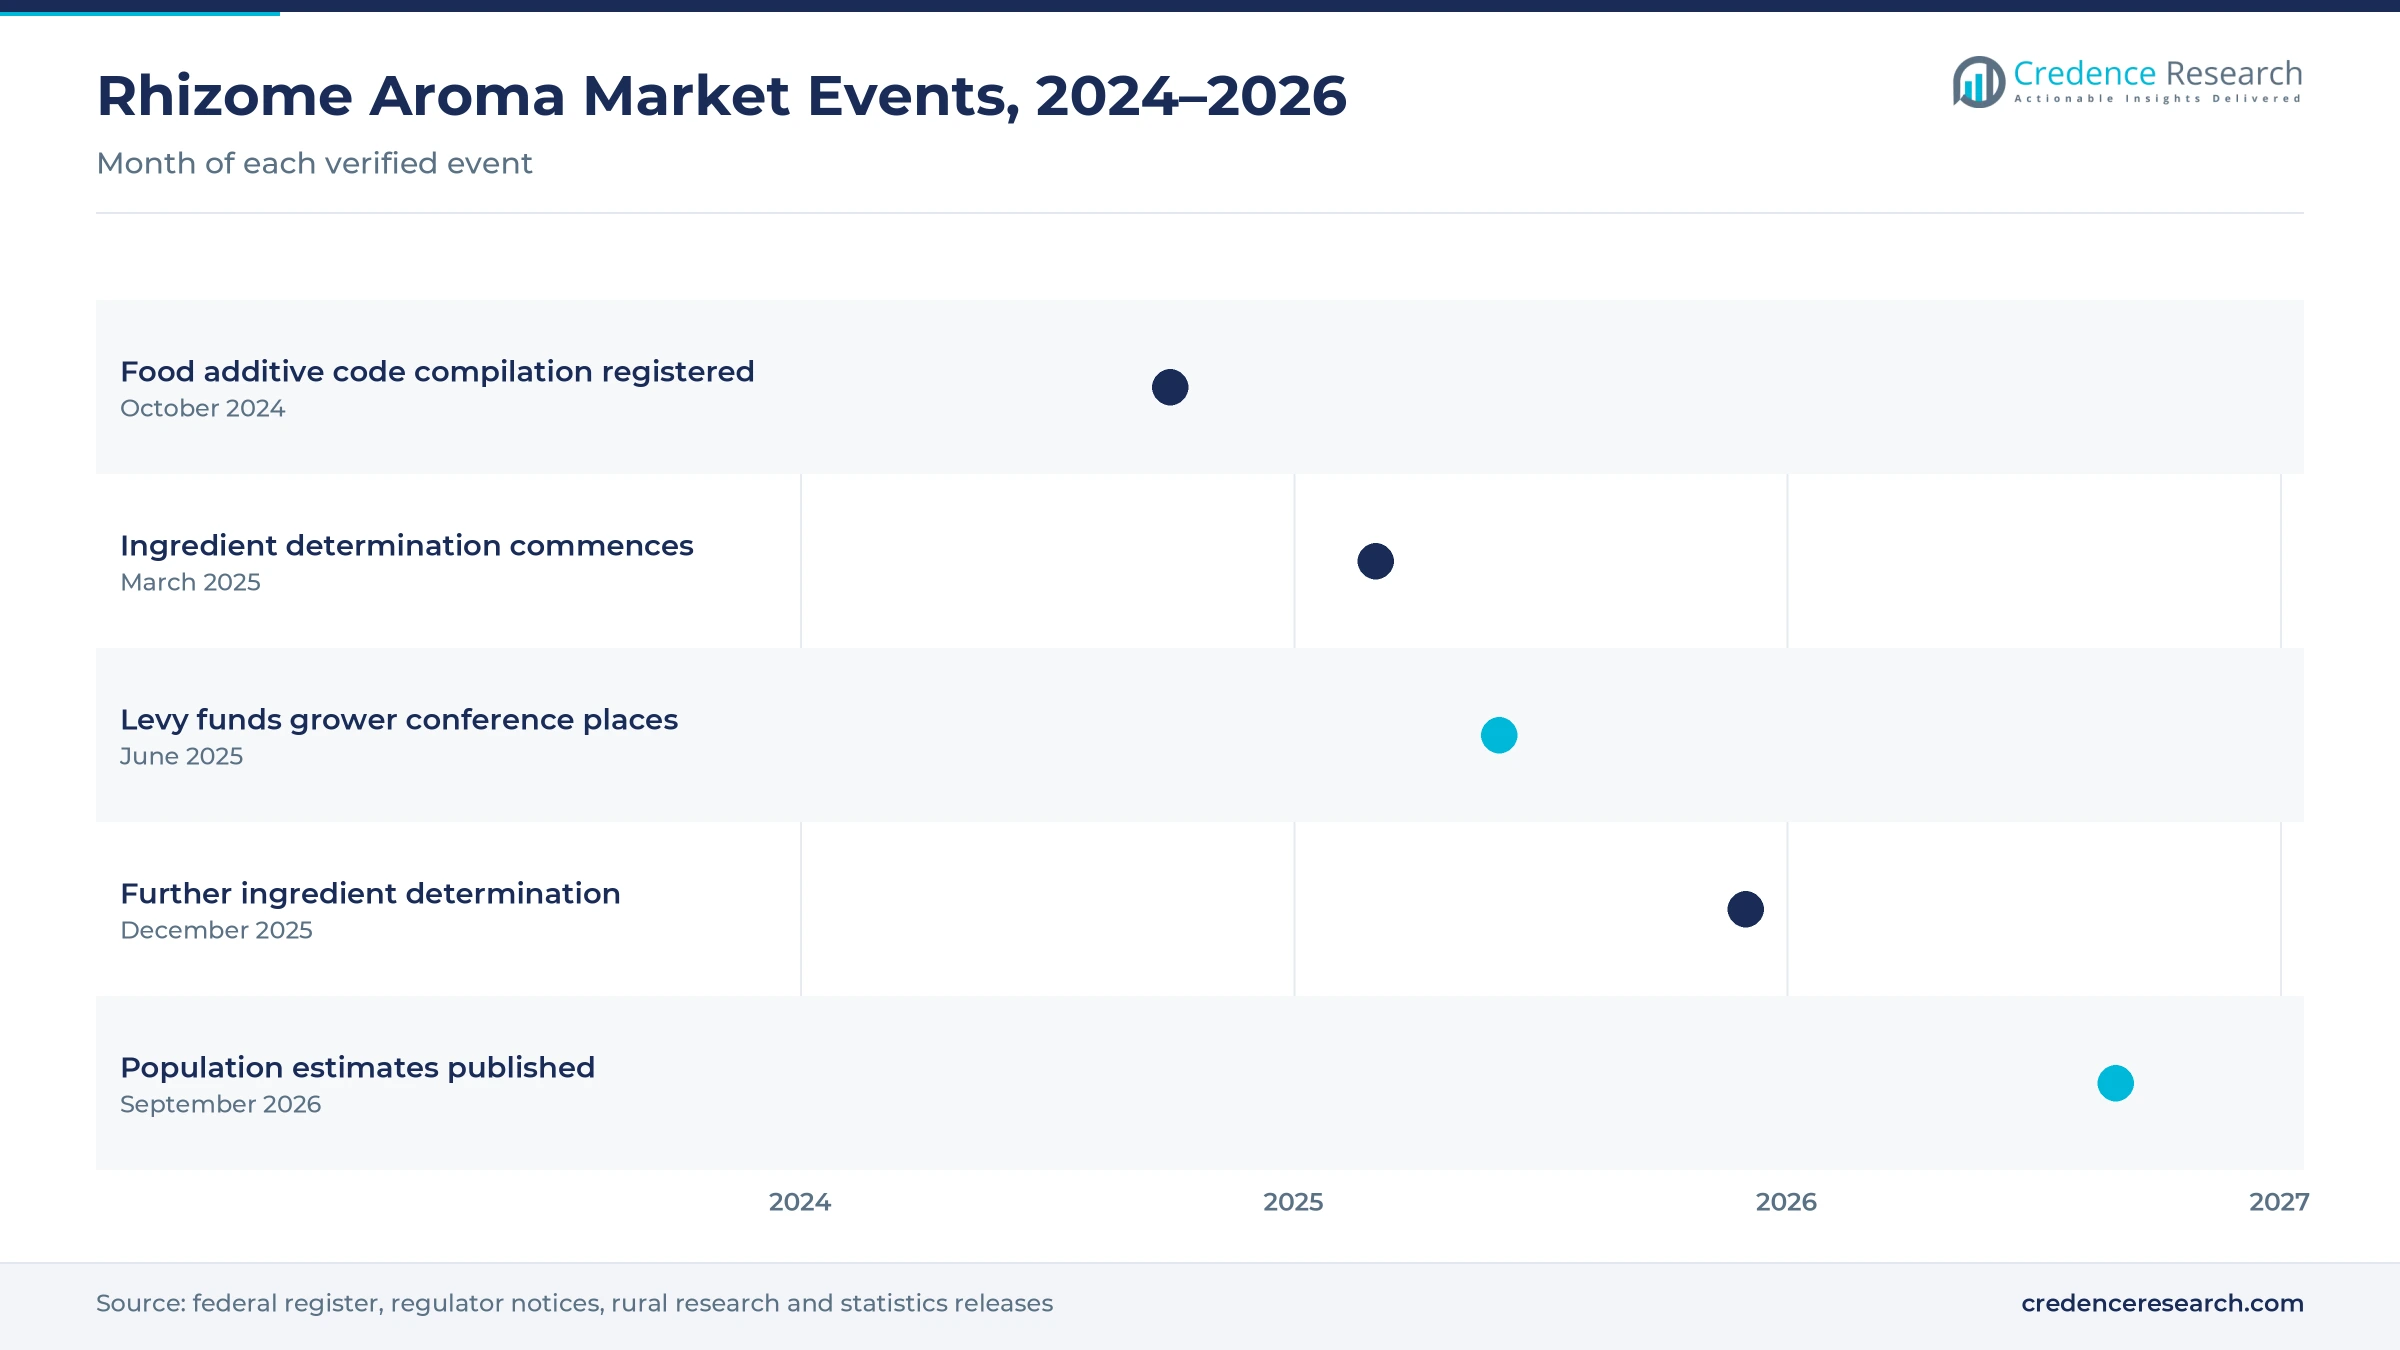
Food formulation requirements support demand, because beverage, confectionery and sauce makers need a consistent flavor source that fits the national food framework. Standard 1.3.1 on food additives remains in force, and its current compilation was registered on Oct. 21, 2024, with effect from Sept. 13, 2024, according to the federal register entry. Flavoring substances are handled through that framework rather than through product-by-product approval, so buyers rely on supplier composition data. Because citral runs from 51% to 71% in oils distilled from Australian rhizome clones, flavor houses can plan dosing with confidence. As a result, flavor houses in Victoria keep buying ginger oil, and that state grows at 13.93% a year.
How does the local rhizome crop widen supply options?
The local rhizome crop widens supply options, because growers and processors sit close to the buyers who need documented origin. About 50 growers operate in the sub-tropical and tropical production zones, Queensland accounts for around 98% of national production, and northern New South Wales holds smaller but growing areas, according to the rural research corporation. Around 20% of the crop is sold to the processing sector, while 80% goes to the domestic fresh market, which leaves room for extraction work. The industry also funds research through a statutory levy of 0.5% of the sale price on fresh and seed material. Consequently, Queensland holds a 24.7% share of 2025 value and keeps processors close to the crop.
Why does wholesale ingredient supply add new buyers?
Wholesale ingredient supply adds new buyers, because candle makers, soap makers and small skin care brands can now order trade packs without a factory contract. Buckley & Phillips Aromatics lists a 100% rhizome distillate of Indian origin, produced by steam distillation, in its 2026 and 2027 Australian wholesale range, according to the trade catalogue listing. Perfect Potion runs a separate wholesale store with a minimum order of AUD 250 and free shipping above AUD 500, which suits small businesses. doTERRA charges an AUD 35 membership fee in Australia and gives wholesale customers 25% off retail prices. As a result, ingredient distributors hold a 44.0% share, while direct supply grows at 14.96% a year.
Listed medicine rules, traceability and retail kits spread
How are listed medicine rules reshaping sourcing?
Listed medicine rules are reshaping sourcing, because wellness products that carry health claims must use permitted ingredients with stated specifications. The Therapeutic Goods Permissible Ingredients Determination No. 1 of 2025 commenced on March 1, 2025 and changed 43 ingredient entries, several of them plant oils, according to the regulator notice. A later determination commenced on Dec. 10, 2025, which shows how often the list moves. One rhizome distillate already sits on the therapeutic goods register as an ingredient entry, while an older aromatherapy listing was cancelled under section 30 of the act. Consequently, complementary medicine grows at 14.79% rates among wellness uses, and buyers favor suppliers that track every determination change before they buy ginger oil.
Why is batch documentation becoming a buying test?
Batch documentation is becoming a buying test, because formulators must prove origin and composition before a recipe is signed off. Research on 17 Australian rhizome clones found citral between 51% and 71% and a neral-to-geranial ratio of 0.61, which gives buyers a composition benchmark. The Jamaican cultivar in that work carried less citral and more pungent gingerols, so the same plant can yield very different profiles. Import records show material arriving from China, the United States, India, France and Bulgaria, each with its own profile. In turn, buyers who also purchase turmeric extracts now ask for gas chromatography reports with every lot, which lifts the appeal of documented distillate.
Can small-pack retail supply widen the buyer base?
Small-pack retail supply offers a clear opening, because households and clinics buy 10 to 12 milliliter bottles rather than drums. Perfect Potion prices a single retail bottle at AUD 28.95 and describes more than 35 years of blending experience in Australia. doTERRA sells its rhizome product through a membership model that returns 10% to 30% of order value in points, which encourages repeat purchases. Retail businesses hold a 46.0% share of value behind manufacturers, while practitioner and direct buyers grow fastest at 14.74% a year. As a result, sellers that pair small packs with aromatherapy practice training can defend margin.
Is there room for more extraction work onshore?
More extraction work onshore offers room to grow, because the shift toward documented local sourcing is gathering pace while most volatile material still arrives as finished imports. Only one fifth of the national crop reaches the processing sector today, so extraction value largely leaves the country. Carbon dioxide extraction equipment also suits small batches, and volatile carbon dioxide extract is the fastest-growing product type at 15.32% a year. Research funded through the ginger levy opened grower places at a Brisbane conference in June 2025 and funded a review of Chinese and Japanese research. The same program announced sponsorship of one place in a 2026 produce executive course. Consequently, processors that pair local rhizome with oleoresin production could capture value that leaves the country today.
Thin local pressing, price swings and small packs limit use
Why does thin local pressing capacity hold back supply?
Thin local pressing capacity limits growth, because only a small share of the national crop reaches processors able to distill or extract it. About one fifth of the crop is sold to the processing sector, so most extraction work happens overseas before the material returns as finished ginger oil. As a result, blenders depend on imported lots, carry longer lead times and cannot switch origin quickly when a recipe changes. Suppliers respond by holding buffer stock in Sydney and Melbourne and by qualifying two or three sources for every specification they sell.
How do composition swings unsettle recipes?
Composition swings are a barrier for formulators, because citral content in distilled rhizome material varies widely between clones, origins and seasons. In turn, a change of supplier can shift the aroma of a finished blend enough for customers to notice it on the shelf. Buyers respond with tighter specifications, retained samples and blending across several lots to hold a target profile. Suppliers that provide gas chromatography data with every batch keep formulation accounts far longer than those that cannot.
Why do small order sizes raise unit costs?
Small order sizes raise unit costs, because clinics, candle makers and soap makers buy ginger oil in grams rather than in drums. Perfect Potion sets a minimum wholesale order of AUD 250, and free shipping starts only above AUD 500 on that trade store. Consequently, freight, repacking, labeling and paperwork spread across very little material, which lifts the delivered price per kilogram. Distributors respond by stocking standard trade sizes, grouping orders for the same region and offering sample packs that reduce wasted stock.
Can buyers manage import and compliance workload?
Import dependence adds compliance workload, because most volatile material crosses a border before it is blended into a finished product. Therapeutic goods ingredient lists change several times a year, with determinations commencing in March 2025 and December 2025 alone. As a result, small buyers spend working hours checking entries and specifications rather than developing new products for their customers. Suppliers respond with local stock, safety data sheets, ingredient declarations and written specifications that cut much of that workload for brands and practitioners.
Sydney blenders lead while Queensland growers gain fastest
| Region | Value, 2025 (USD million) | Share, 2025 | CAGR, 2026–2035 |
|---|---|---|---|
| New South Wales | 2.6 | 40.2% | 13.83% |
| Victoria | 1.9 | 29.9% | 13.93% |
| Queensland | 1.6 | 24.7% | 14.73% |
| Remaining States and Territories | 0.3 | 5.2% | 14.53% |
Sydney blending houses keep New South Wales ahead
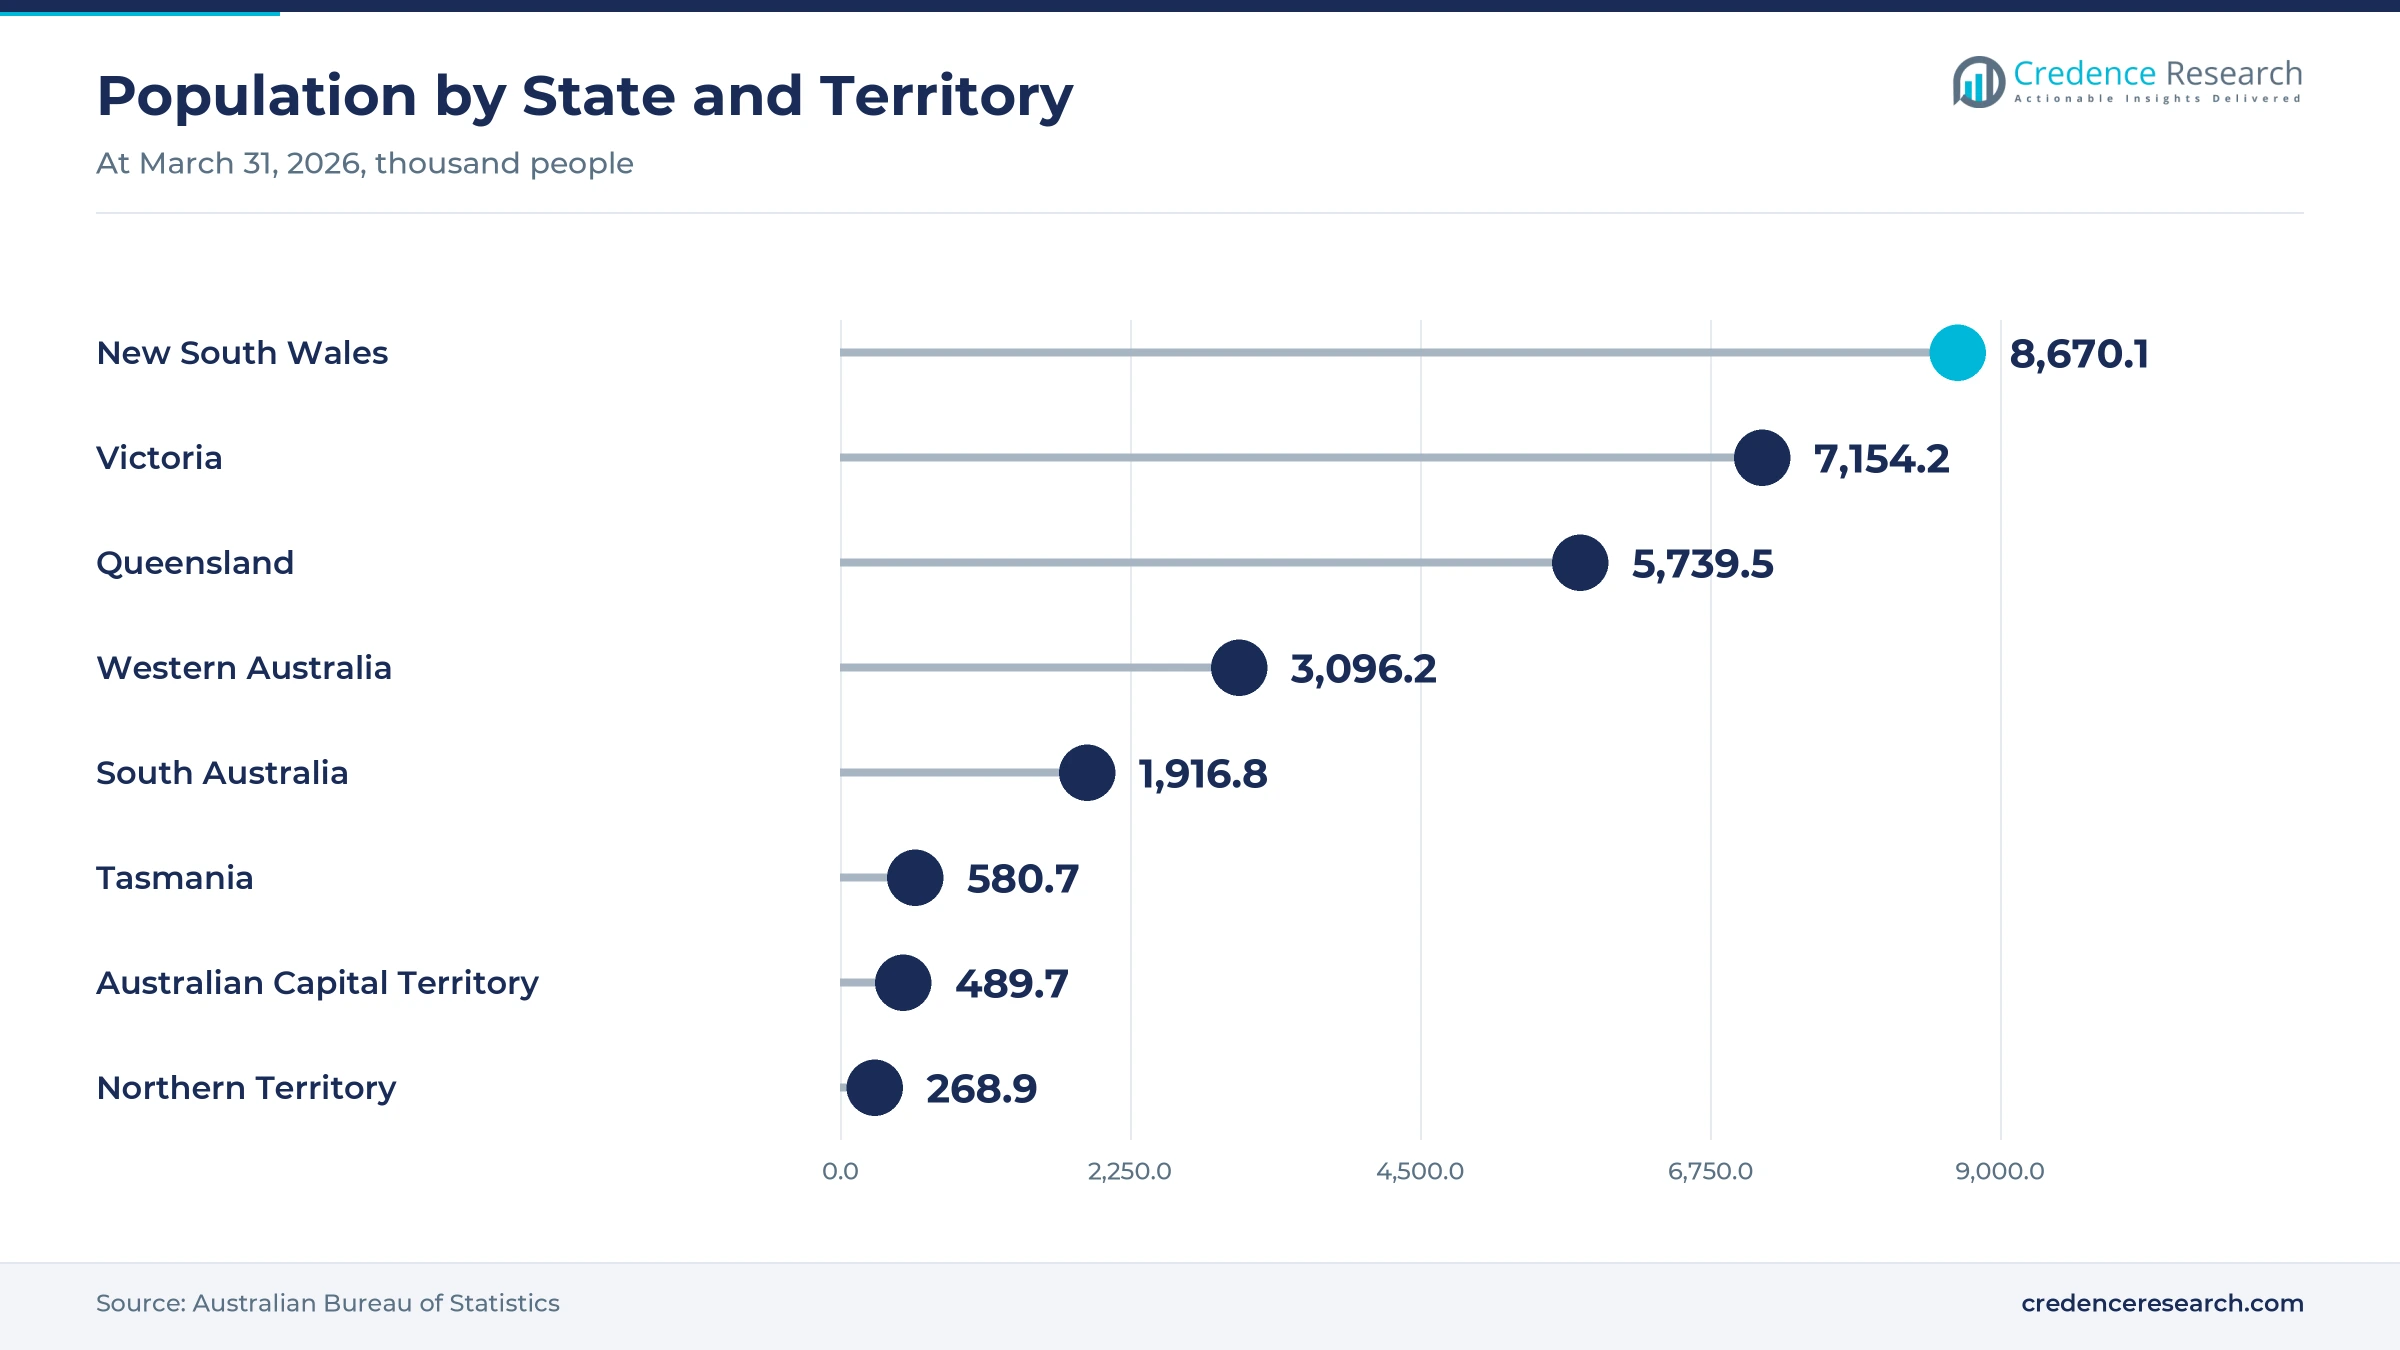
New South Wales held a 40.2% share of 2025 value and grows at 13.83% a year. The state had 8.67 million residents at March 31, 2026, the largest consumer base in the country. Northern New South Wales also holds smaller but growing areas of rhizome production. As a result, the region combines ingredient importers, contract blenders and wellness retailers with nearby crop supply, which keeps order volumes highest around Sydney.
Melbourne formulators anchor victorian demand
Victoria held a 29.9% share of 2025 value and grows at 13.93% a year. The state had 7.15 million residents at March 31, 2026 and grew 1.6% over the year to that date. Personal care, cleaning product, confectionery and beverage plants around Melbourne buy aroma materials against annual recipes and hold qualified supplier lists. Contract manufacturers in the city also repack ginger oil for brands that do not run their own blending rooms. Consequently, demand leans toward finished-product manufacturers and natural flavor ingredients rather than retail packs.
Why does Queensland gain crop-linked demand fastest?
Queensland held a 24.7% share of 2025 value and grows fastest at 14.73% a year. The state accounts for around 98% of national rhizome production and hosts most of the 50 commercial growers. It also had 5.74 million residents at March 31, 2026, with growth of 1.6% over the year. In turn, processors, wellness brands and levy-funded research sit close to the crop, which supports the fastest regional growth through 2035.
Western and smaller states buy through national suppliers
The remaining states and territories held a 5.2% share of 2025 value and grow at 14.53% a year. Western Australia recorded the fastest population growth at 2.1% in the year to March 2026, with 3.10 million residents. South Australia, Tasmania, the Australian Capital Territory and the Northern Territory together hold a much smaller base. As a result, buyers in these jurisdictions order through national distributors and online wholesale ranges rather than local importers.
Food, medicine and crop decisions dated 2024 to 2026
| Development | Status and market relevance |
|---|---|
| In October 2024, regulators registered the current compilation of Standard 1.3.1 on food additives for the national food code. | Keeps flavoring rules settled for buyers |
| In March 2025, the therapeutic goods regulator introduced a permissible ingredients determination that changed 43 ingredient entries. | Tightens wellness ingredient sourcing |
| In June 2025, the ginger research program opened four sponsored grower places at a Brisbane horticulture conference. | Builds grower links to processors |
| In December 2025, the regulator introduced a further permissible ingredients determination for listed medicine ingredients. | Shows how often entries change |
| In September 2026, the national statistics office published population estimates of 27.92 million residents. | Widens the wellness consumer base |
Distillation, carbon dioxide and solvent routes compete
- Steam distillation passes steam through sliced rhizome to collect volatile molecules, and it remains the cheapest reliable route at scale.
- Volatile carbon dioxide extraction uses pressurized gas at low temperature to capture delicate aroma molecules that heat would otherwise damage.
- Solvent extraction recovers oleoresin that carries both aroma and pungent principles, which suits flavor and nutraceutical buyers.
- Nonvolatile fractionation separates heavier pungent fractions for warming formulations, and it commands the highest price per kilogram.
Need a Custom Version of This Report?
Tailor the scope, geography, or segments to your exact requirements.
- Custom geography or segment scope
- Direct access to our analyst team
Direct sellers, local blenders and wholesalers compete
Competition combines global direct-selling brands, Australian blending houses and ingredient wholesalers that hold stock and documents. Perfect Potion sells a steam-distilled product of Indian origin at AUD 28.95 for a retail bottle, runs a separate wholesale store with an AUD 250 minimum order, and points to more than 35 years of blending work in Australia. Buckley & Phillips Aromatics lists a 100% rhizome distillate of Indian origin in its 2026 and 2027 Australian wholesale range. doTERRA sells its rhizome product through an AUD 35 membership that gives 25% off retail prices and returns 10% to 30% of order value in points. Young Living, Oil Garden, Sydney Essential Oil Company, New Directions Australia, N-Essentials, Ahimsa Oils and Australian Wholesale Oils also supply the market, although their current Australian ranges were not verified for this report. Companies compose on origin data, pack size, service and price.
Companies profiled and their roles in this market
| Company | Type | Role in the market |
|---|---|---|
| Perfect Potion | Australian blender and retailer | Steam-distilled Indian material, retail and wholesale stores |
| Buckley & Phillips Aromatics | Wholesale supplier | 100% rhizome distillate in the 2026 and 2027 trade range |
| doTERRA | Direct-selling brand | Membership pricing with points on repeat orders |
| Oil Garden | Retail brand | Aromatherapy range sold through pharmacy and grocery channels |
Credence Research sees formulation work setting the pace
Credence Research's view is that Australian demand for rhizome distillate and extract will grow quickly through 2035, as wellness blending, personal care formulation and documented flavor work all expand together. Steam-distilled material should keep the largest product share, while volatile carbon dioxide extract gains most. New South Wales will remain the largest region, although Queensland adds demand fastest from its crop base. However, thin local processing, composition swings and small order sizes will reward suppliers that hold stock, publish batch data and serve both manufacturers and practitioners.
Import flows and formulation intensity anchor the model
The report uses 2025 as the base year, with values in USD million at current prices. Market values come from the Credence Research model, which combines recorded import flows, formulation intensity in wellness and flavor work, pack size patterns and price tiers. The four regional zones and their 2025 shares follow the client brief, while regional growth and the splits by product type, application, customer type and distribution channel are Credence Research estimates. Sources used are official trade and population statistics, the federal register of legislation, regulator notices, a peer-reviewed composition study, rural research corporation pages and company and trade listings, and no interviews or surveys were used.
Wellness, flavor and compliance shape demand to 2035
The market is expected to reach USD 22.7 million by 2035, a 14.12% CAGR during 2026–2035, as wellness blending, personal care work and documented flavor sourcing keep demand rising. Spending is projected to rise from USD 6.9 million in 2026 as formulators widen their aroma ranges. Growth should be strongest in volatile carbon dioxide extract, practitioner and direct buying, and Queensland, while New South Wales keeps the largest share. In contrast, thin local processing capacity, composition swings between origins and compliance workload could slow orders in some years.
Frequently Asked Questions
How big is the Australia ginger oil market?
Which region leads demand?
Which region grows fastest?
Which product type holds the largest share?
Which product type grows fastest?
How do food and medicine rules affect buyers?
Who are the leading companies in this market?
What are the main risks to growth?
Table of Content
Chapter 1 Market Segmentation
- 1.1 Segmentation Framework
- 1.1.1 Product and Service Classification
- 1.1.2 Application and End-Use Classification
- 1.1.3 Technology and Solution Classification
- 1.1.4 Customer and Distribution Channel Classification
- 1.1.5 Geographic Segmentation
- 1.1.6 Market Segment Definitions and Boundaries
- 1.2 By Product Type
- 1.2.1 Steam-Distilled Essential Oil
- 1.2.2 Volatile Carbon Dioxide Extract
- 1.2.3 Solvent-Extracted Oleoresin
- 1.2.4 Nonvolatile Carbon Dioxide Extract
- 1.3 By Application
- 1.3.1 Aromatherapy and Wellness
- 1.3.2 Personal Care and Household Formulation
- 1.3.3 Food and Beverage Flavoring
- 1.3.4 Complementary Medicine
- 1.4 By Customer Type
- 1.4.1 Finished-Product Manufacturers
- 1.4.2 Retail Businesses
- 1.4.3 Practitioner and Direct Buyers
Chapter 2 Introduction
- 2.1 Report Objectives and Scope
- 2.2 Product Definition and Industry Terminology
- 2.3 Market Inclusions and Exclusions
- 2.4 Research Process
- 2.4.1 Primary Research and Expert Interviews
- 2.4.2 Secondary Research and Source Review
- 2.4.3 Top-Down and Bottom-Up Estimation
- 2.4.4 Data Triangulation and Verification
- 2.5 Market Size Measurement Basis
- 2.5.1 2025: USD 6.5 million → 2035: USD 22.7 million
- 2.6 Historical and Forecast Reference Periods
- 2.6.1 Historical Period: 2018-2025
- 2.6.2 Base Year: 2025
- 2.6.3 Forecast Period: 2025-2035
- 2.7 Research Assumptions and Limitations
Chapter 3 Executive Summary
- 3.1 Market Snapshot and Key Findings
- 3.2 Base-Year Market Size, 2025
- 3.3 Forecast Market Size, 2035
- 3.4 Revenue and Volume Growth Outlook
- 3.5 Key Demand and Supply Indicators
- 3.6 Leading Market Segments
- 3.7 Fastest-Growing Market Opportunities
- 3.8 Regional Performance Highlights
- 3.9 Technology and Industry Transformation
- 3.10 Competitive Landscape Summary
- 3.11 Analyst View and Strategic Implications
Chapter 4 Australia Ginger Oil Market Trends and Developments
- 4.1 Historical Industry Development, 2018-2025
- 4.2 Recent Market Trends and Developments
- 4.3 Demand and Customer Behavior Trends
- 4.4 Technology and Product Innovation
- 4.5 Artificial Intelligence, Automation and Digitalization
- 4.6 Local Manufacturing and Supply Chain Realignment
- 4.7 Industry Partnerships, Mergers and Acquisitions
- 4.8 Sustainability and Circular Economy Developments
- 4.9 Government and Private Sector Investment Trends
- 4.10 Emerging Business Models and Commercialization
- 4.11 Industry Developments and Announcements
Chapter 5 Australia Ginger Oil Market Production, Supply and Demand Analysis
- 5.1 Demand Trend and Consumption Analysis, 2018-2025
- 5.2 Demand Forecast, 2025-2035
- 5.3 Production and Output Trend, 2018-2025
- 5.4 Production and Output Forecast, 2025-2035
- 5.5 Installed Capacity and Capacity Utilization
- 5.6 Company-Wise Production Plants and Statistics
- 5.6.1 Installed Production Capacity
- 5.6.2 Actual Production
- 5.6.3 Planned Capacity and Expansion Targets
- 5.7 Supply Chain Structure and Procurement Trends
- 5.8 Supply-Demand Gap and Bottlenecks
- 5.9 Import Dependence and Sourcing Structure
- 5.10 Contract Manufacturing and Outsourcing
- 5.11 Regional Supply and Demand Concentration
Chapter 6 Australia Ginger Oil Market Pricing Analysis
- 6.1 Pricing Structure and Measurement
- 6.2 Historical Pricing Trends, 2018-2025
- 6.3 Pricing Outlook, 2025-2035
- 6.4 Average Selling Price and Unit Economics
- 6.5 Pricing by Product and Market Segment
- 6.6 Geographic Pricing Differences
- 6.7 Key Input, Energy, Labor and Logistics Costs
- 6.8 Contract Pricing and Purchasing Models
- 6.9 Pricing Sensitivity and Competitive Positioning
- 6.10 Price, Margin and Profitability Implications
Chapter 7 Australia Ginger Oil Market Dynamics
- 7.1 Market Growth Drivers
- 7.1.1 Demand-Side Drivers
- 7.1.2 Technology and Innovation Drivers
- 7.1.3 Infrastructure and Investment Drivers
- 7.1.4 Regulatory and Policy Drivers
- 7.2 Market Restraints
- 7.2.1 Cost and Affordability Constraints
- 7.2.2 Technology and Adoption Barriers
- 7.2.3 Supply Chain and Operational Constraints
- 7.3 Market Challenges
- 7.3.1 Competitive Pressure and Margin Erosion
- 7.3.2 Skills, Infrastructure and Implementation Gaps
- 7.4 Emerging Market Opportunities
- 7.5 Market Dynamics Impact and Time-Horizon Assessment
Chapter 8 Australia Ginger Oil Value Chain Analysis
- 8.1 Industry Value Chain Overview
- 8.2 Upstream Suppliers and Critical Inputs
- 8.3 Technology and Component Providers
- 8.4 Manufacturing or Service Delivery
- 8.5 Distribution, Channel Partners and Integrators
- 8.6 Downstream Applications and End Users
- 8.7 Value Addition and Profit Pools
- 8.8 Vertical Integration and Outsourcing
- 8.9 Supplier Concentration and Risk
- 8.10 Supply Chain Localization and Resilience
Chapter 9 Australia Ginger Oil Market Regulations and Policies
- 9.1 Relevant Laws, Standards and Compliance Frameworks
- 9.2 Product, Service, Safety and Quality Requirements
- 9.3 Government Policies, Incentives and Subsidies
- 9.4 Imports, Exports and Trade Barriers
- 9.5 Public Procurement and Local Content Requirements
- 9.6 Environmental and Sustainability Compliance
- 9.7 Upcoming Policy Changes and Market Implications
Chapter 10 Australia Ginger Oil Market Hotspots and Opportunities
- 10.1 Market Opportunity Mapping and Growth Hotspots
- 10.2 High-Growth Applications and Customer Groups
- 10.3 Underserved Markets and White-Space Opportunities
- 10.4 Emerging Technology and Product Opportunities
- 10.5 New Capacity and Investment Hotspots
- 10.6 Market Entry and Expansion Opportunities
- 10.7 Distribution and Partnership Opportunities
- 10.8 Near-Term and Long-Term Commercial Potential
- 10.9 Opportunity Attractiveness and Execution Risks
Chapter 11 Australia Ginger Oil Market Outlook, 2025-2035
- 11.1 Market Size and Analysis
- 11.1.1 Revenue (Market Measurement: 2025: USD 6.5 million → 2035: USD 22.7 million)
- 11.1.2 Market Volume and Quantity Sold
- 11.1.3 Historical Market Size, 2018-2025
- 11.1.4 Base-Year Market Size, 2025
- 11.2 Market Forecast, 2025-2035
- 11.2.1 Revenue Forecast to 2035
- 11.2.2 Volume Forecast to 2035
- 11.2.3 CAGR and Year-on-Year Growth
- 11.2.4 Incremental Revenue Opportunity
- 11.3 Forecast Assumptions and Scenario Analysis
- 11.3.1 Base-Case Forecast
- 11.3.2 Optimistic and Conservative Scenarios
- 11.3.3 Technology, Pricing and Policy Sensitivities
- 11.4 Market Attractiveness and Growth Outlook
Chapter 12 Australia Ginger Oil Market Segmentation and Outlook
- 12.1 Segmentation Summary and Market Shares, 2025
- 12.2 Largest and Fastest-Growing Segments
- 12.3 By Product Type - Market Size and Forecast, 2025-2035
- 12.3.1 Segment Definition and Scope
- 12.3.2 Historical Market Size, 2018-2025
- 12.3.3 Revenue Forecast, 2025-2035
- 12.3.4 Volume Forecast, 2025-2035
- 12.3.5 Base-Year Market Share, 2025
- 12.3.6 Segment CAGR and Growth Drivers
- 12.3.7 Subsegment Market Size and Forecast
- 12.3.7.1 Steam-Distilled Essential Oil
- 12.3.7.2 Volatile Carbon Dioxide Extract
- 12.3.7.3 Solvent-Extracted Oleoresin
- 12.3.7.4 Nonvolatile Carbon Dioxide Extract
- 12.3.8 Subsegment Pricing and Adoption Trends
- 12.3.9 Leading Suppliers and Competition
- 12.3.10 Regional Demand and Opportunities
- 12.4 By Application - Market Size and Forecast, 2025-2035
- 12.4.1 Segment Definition and Scope
- 12.4.2 Historical Market Size, 2018-2025
- 12.4.3 Revenue Forecast, 2025-2035
- 12.4.4 Volume Forecast, 2025-2035
- 12.4.5 Base-Year Market Share, 2025
- 12.4.6 Segment CAGR and Growth Drivers
- 12.4.7 Subsegment Market Size and Forecast
- 12.4.7.1 Aromatherapy and Wellness
- 12.4.7.2 Personal Care and Household Formulation
- 12.4.7.3 Food and Beverage Flavoring
- 12.4.7.4 Complementary Medicine
- 12.4.8 Subsegment Pricing and Adoption Trends
- 12.4.9 Leading Suppliers and Competition
- 12.4.10 Regional Demand and Opportunities
- 12.5 By Customer Type - Market Size and Forecast, 2025-2035
- 12.5.1 Segment Definition and Scope
- 12.5.2 Historical Market Size, 2018-2025
- 12.5.3 Revenue Forecast, 2025-2035
- 12.5.4 Volume Forecast, 2025-2035
- 12.5.5 Base-Year Market Share, 2025
- 12.5.6 Segment CAGR and Growth Drivers
- 12.5.7 Subsegment Market Size and Forecast
- 12.5.7.1 Finished-Product Manufacturers
- 12.5.7.2 Retail Businesses
- 12.5.7.3 Practitioner and Direct Buyers
- 12.5.8 Subsegment Pricing and Adoption Trends
- 12.5.9 Leading Suppliers and Competition
- 12.5.10 Regional Demand and Opportunities
- 12.6 Segment Growth Comparison
- 12.7 Segment Attractiveness and Priority Matrix
Chapter 13 Australia Ginger Oil End-Use and Application Market Outlook
- 13.1 End-Use Industry and Customer Demand Structure
- 13.2 Leading Applications and Customer Groups
- 13.3 End-Use Market Size, Share and Forecast
- 13.4 Major End-Use Industry Deep Dives
- 13.4.1 Customer Requirements and Use Cases
- 13.4.2 Demand and Replacement Cycles
- 13.4.3 Technical and Regulatory Considerations
- 13.4.4 Purchasing and Procurement Models
- 13.4.5 Leading Vendors and Distribution Channels
- 13.4.6 Forecast and Commercial Opportunities
- 13.5 Emerging Applications and Cross-Segment Demand
- 13.6 End-Use Industry Investment Priorities
Chapter 14 Australia Ginger Oil Geographic Market Outlook, 2025-2035
- 14.1 Domestic Market Distribution and Demand Clusters
- 14.2 State- or Province-Wise Market Size and Forecast, 2025-2035
- 14.3 City and Metropolitan Market Outlook
- 14.4 Industrial, Manufacturing and Commercial Clusters
- 14.5 Geographic Concentration of Key End Users
- 14.6 Local Pricing and Purchasing Differences
- 14.7 Domestic Production Facilities and Capacity Map
- 14.8 Local Infrastructure and Project Pipeline
- 14.9 State-Level Policy and Incentive Differences
- 14.10 Subnational Investment Hotspots and Opportunities
- 14.11 Distribution and Logistics Networks
- 14.12 Domestic Competitive Footprint
Chapter 15 Australia Ginger Oil Technology, Innovation and Sustainability Outlook
- 15.1 Technology Landscape and Maturity
- 15.2 Product, Process and Service Innovation
- 15.3 AI, Automation and Digital Tools in the Industry
- 15.4 Technology Adoption and Performance Benchmarking
- 15.5 Innovation Pipeline and R&D Investment
- 15.6 Patent and Intellectual Property Trends
- 15.7 Energy Efficiency and Resource Management
- 15.8 Sustainability, Recycling and Circularity
- 15.9 Technology Roadmap, 2025-2035
- 15.10 Risks of Obsolescence and Technology Substitution
Chapter 16 Australia Ginger Oil Market Key Strategic Imperatives
- 16.1 Growth and Market Entry Priorities
- 16.2 High-Return Products and Segments
- 16.3 Pricing, Profitability and Cost Optimization
- 16.4 Technology Investment and Product Differentiation
- 16.5 Supply Chain Localization and Resilience
- 16.6 Distribution and Customer Acquisition
- 16.7 Partnership, Acquisition and Capacity Strategy
- 16.8 Regional Expansion Priorities
- 16.9 Short-, Medium- and Long-Term Actions
Chapter 17 Competition Outlook
- 17.1 Industry Competition Characteristics
- 17.2 Market Structure and Concentration
- 17.3 Market Share and Competitive Positioning, 2025
- 17.4 Company-Wise Revenue and Product Benchmarking
- 17.5 Production and Service Capacity Benchmarking
- 17.6 Technology, Pricing and Differentiation
- 17.7 Regional Footprint and Distribution Strength
- 17.8 Mergers, Acquisitions and Strategic Alliances
- 17.9 New Entrants and Competitive Threats
- 17.10 Porter's Five Forces and Industry Attractiveness
- 17.11 Competitive Outlook, 2025-2035
Chapter 18 Company Profiles
- 18.1 Company Coverage and Selection Criteria
- 18.2 doTERRA
- 18.2.1 Business Description
- 18.2.2 Company Ownership and Geographic Presence
- 18.2.3 Product and Service Portfolio
- 18.2.4 Manufacturing and Operating Footprint
- 18.2.5 Production Capacity and Expansion Plans
- 18.2.6 Financial Performance and Investment
- 18.2.7 Market Share and Competitive Position
- 18.2.8 Technology and Innovation Capabilities
- 18.2.9 Strategic Alliances or Partnerships
- 18.2.10 Recent Developments
- 18.2.11 Growth Strategy and Outlook
- 18.3 Young Living
- 18.4 Oil Garden
- 18.5 Perfect Potion
- 18.6 Sydney Essential Oil Company
- 18.7 New Directions Australia
- 18.8 N-Essentials
- 18.9 Buckley & Phillips Aromatics
- 18.10 Ahimsa Oils
- 18.11 Australian Wholesale Oils
- 18.12 Other Relevant Market Participants
Note: Every listed company is profiled on the structure shown under the first company. The company list is preliminary and may change based on research findings, market developments, data availability and client requirements.
Chapter 19 Disclaimer
- 19.1 Research and Forecast Disclaimer
- 19.2 Data Source and Estimation Limitations
Note: The depth of individual sections depends on data availability for this market. Volume, capacity, trade and other unit-based metrics are included where applicable.

