
Steel protection and mine upkeep anchor coating demand
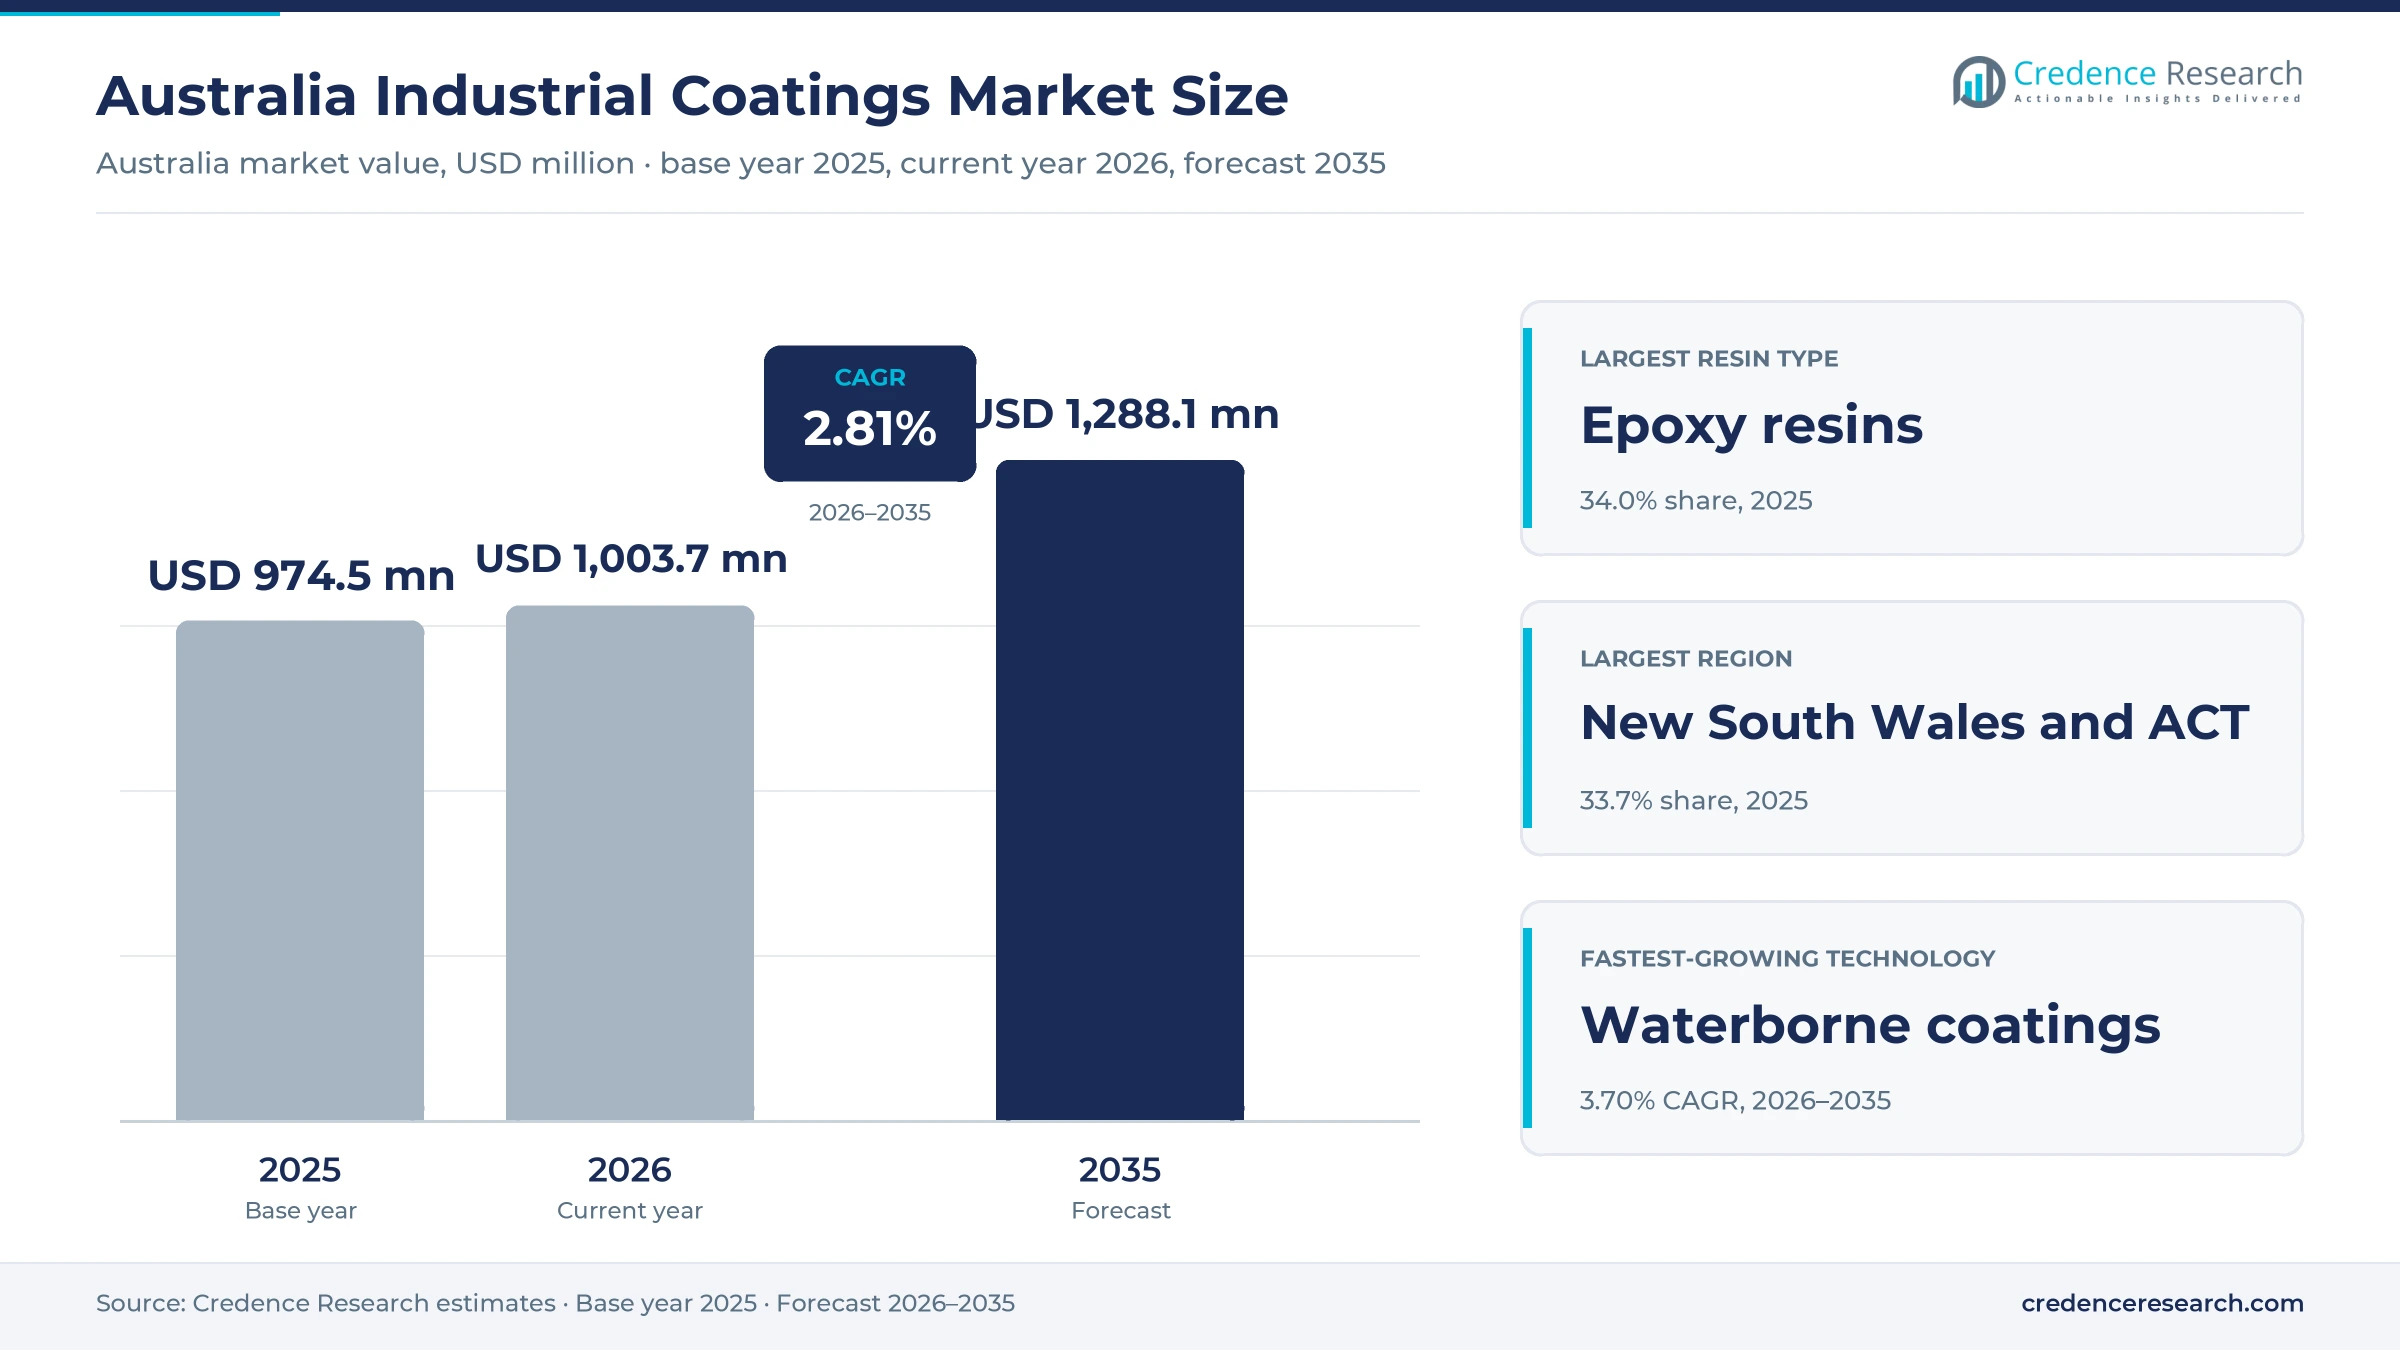
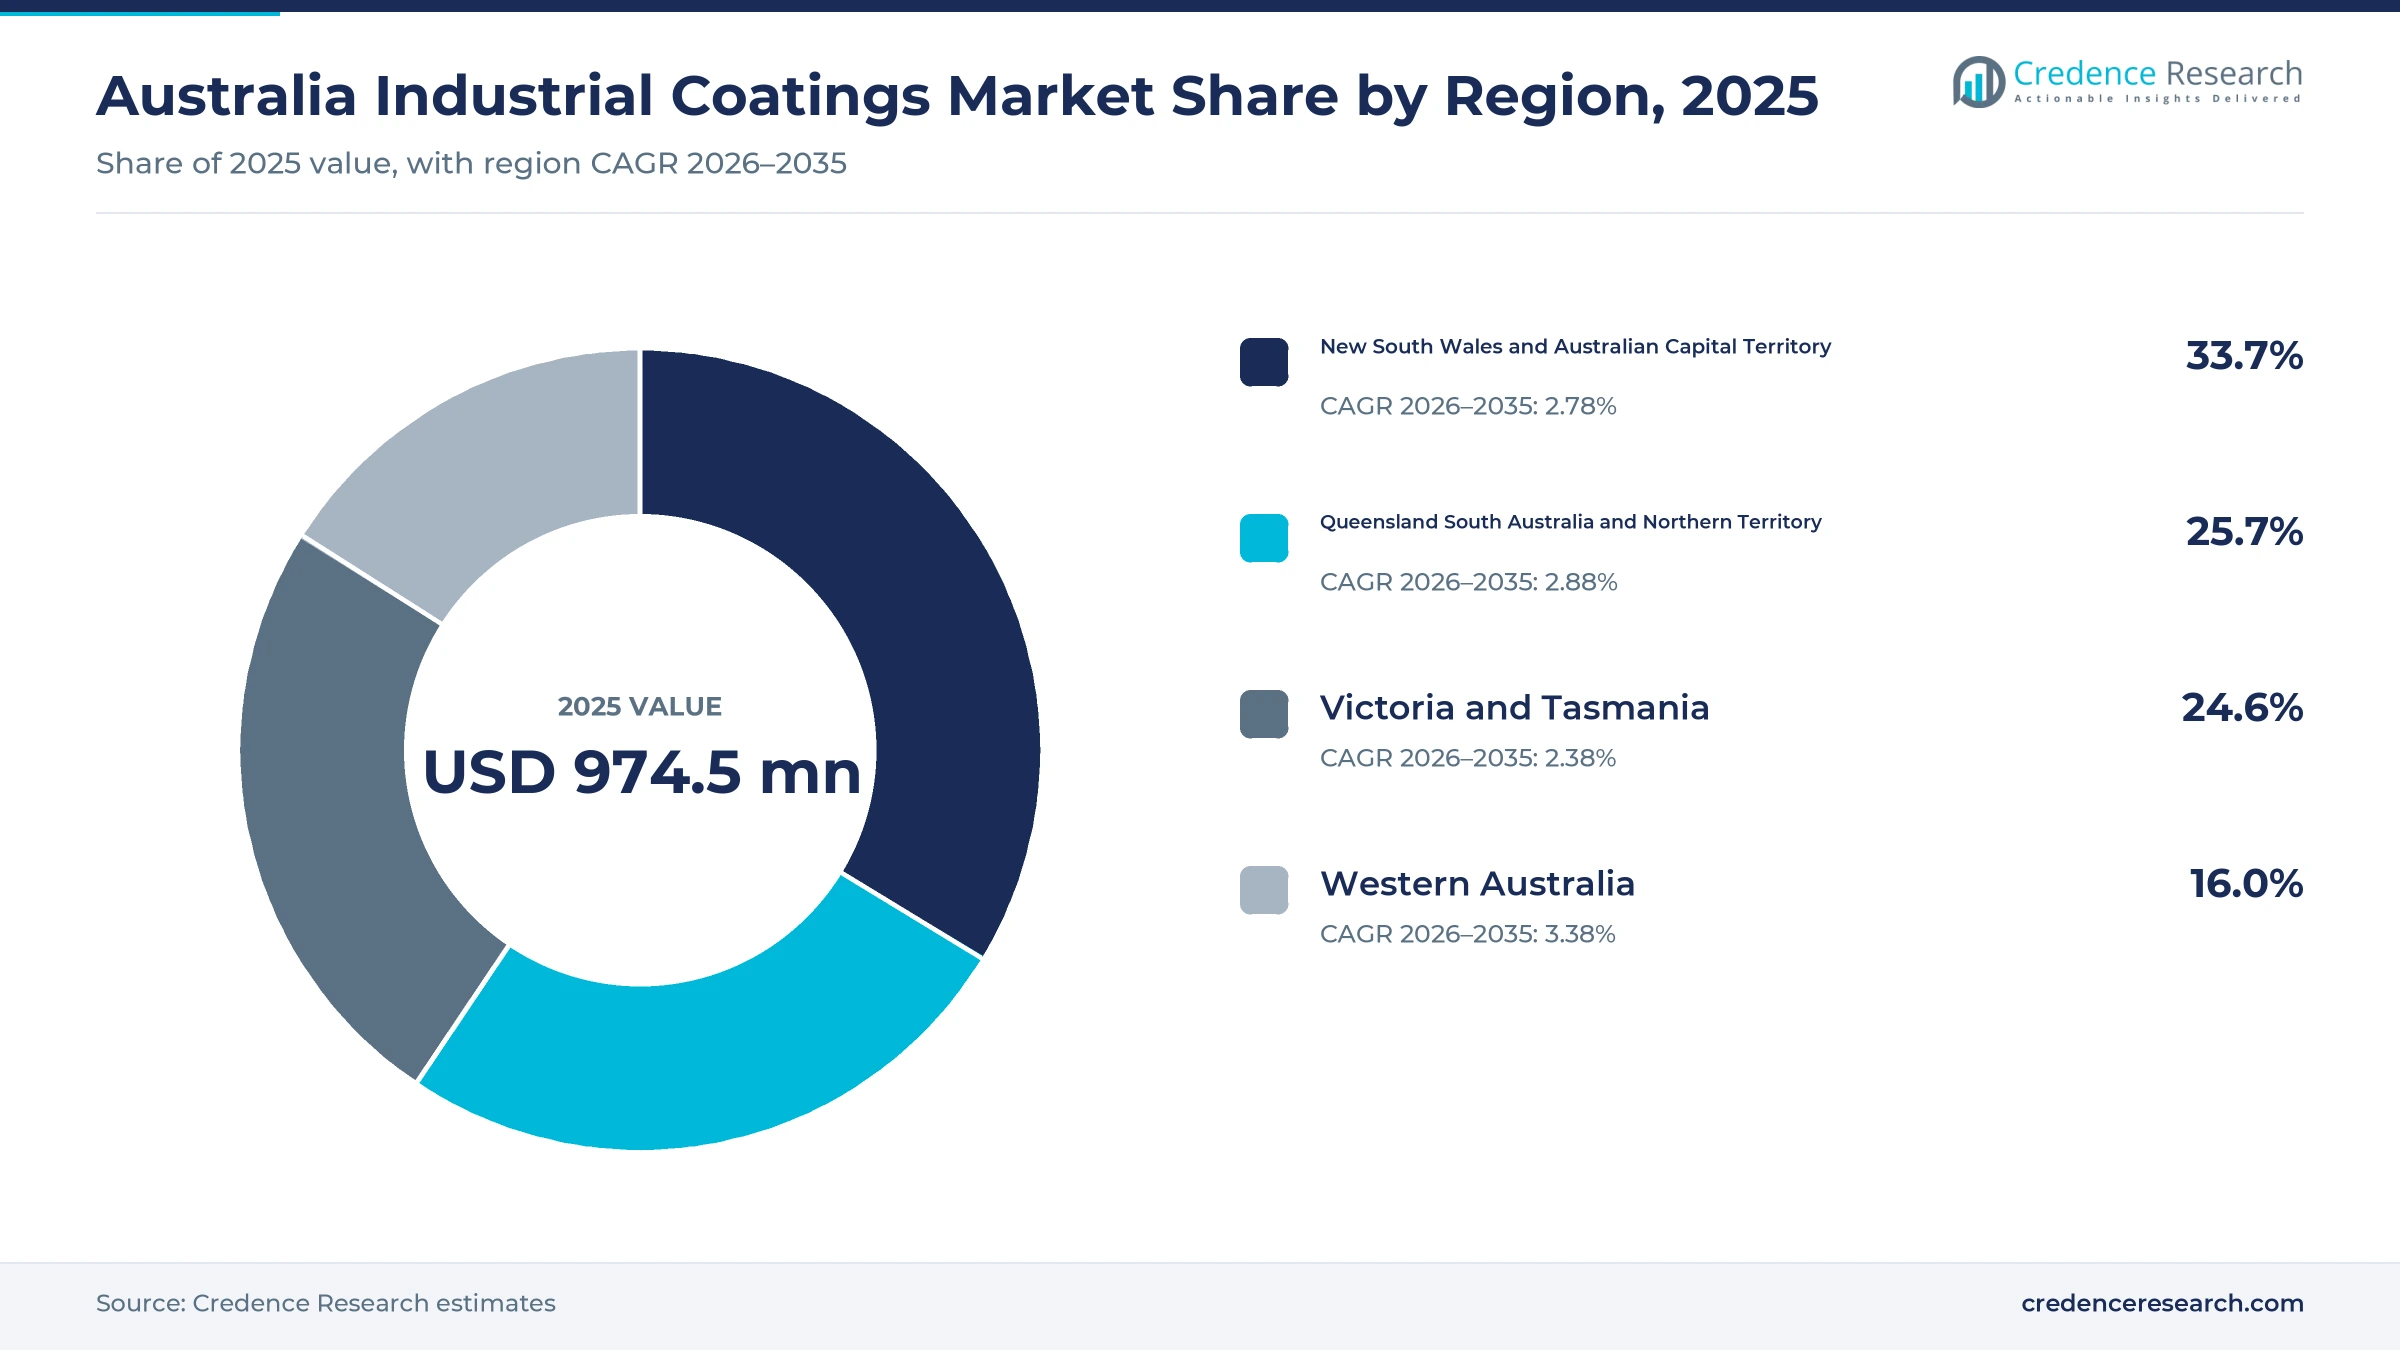
The Australia industrial coatings market was valued at USD 974.5 million in 2025 and is projected to increase from USD 1.00 billion in 2026 to USD 1.29 billion by 2035, registering a CAGR of 2.81% during 2026–2035. Demand comes from fabricators, mine operators, asset owners, vehicle builders and coating contractors that protect steel, concrete and equipment against corrosion, abrasion and weather. New South Wales and the Australian Capital Territory held the largest regional share, 33.7% in 2025, because Sydney motorway, rail and utility projects use large volumes of protective systems. Western Australia is the fastest-growing region at 3.38% a year, as iron ore operations and naval shipbuilding at Henderson need repeated recoating and new steel protection. In turn, the planned merger of two global coating suppliers and new workplace exposure limits are pushing buyers toward lower-solvent, longer-life systems.
Which protective and product finishes are counted?
The estimate measures spending in Australia on liquid and powder coatings applied to structural steel, plant, pipework, machinery, vehicles, equipment and manufactured metal products. It covers epoxy, polyurethane, acrylic, polyester and specialty resin systems used for new construction, maintenance recoating and repair refinishing. Values are stated in USD million at current prices and exclude goods and services tax.
The estimate excludes decorative house paint, wood stains, road marking paint and raw resins sold to formulators. The value chain runs from local and overseas formulators through direct project supply, industrial distributors and refinish dealers to fabricators, asset owners, mine operators and professional coating businesses.
Australia Industrial Coatings Market Insights
- The Australia industrial coatings market was valued at USD 974.5 million in 2025 and is projected to reach USD 1.29 billion by 2035, at a 2.81% CAGR during 2026–2035.
- New South Wales and the Australian Capital Territory held a 33.7% share of 2025 value, as Sydney transport and utility works use heavy-duty steel protection.
- Epoxy resins led resin types with a 34.0% share of 2025 value, because zinc-rich and barrier epoxy coats form the base of most steel protection systems.
- The national major public infrastructure pipeline reached $242 billion over five years in November 2025, its highest level since tracking began five years earlier.
- Waterborne coatings grow fastest at 3.70% a year during 2026–2035, as fabricators cut solvent use ahead of tighter workplace exposure limits.
Epoxy systems lead while waterborne grades grow fastest
Why do epoxy systems hold the largest resin share?
Based on resin type, the market is categorized into epoxy resins, polyurethane resins, acrylic resins and polyester and specialty resins. Epoxy Resins led with a 34.0% share of 2025 value, because zinc-rich primers and high-build epoxy coats protect most bridge, mine and plant steel. Polyurethane Resins grow fastest at 3.09% a year, as asset owners specify durable, color-stable topcoats over epoxy layers.
How fast are solvent systems giving way to cleaner grades?
Based on technology, the market is categorized into solventborne coatings, waterborne coatings, powder coatings and high-solids and radiation-cured coatings. Solventborne Coatings led with a 42.0% share of 2025 value, because field painting of large steel structures still relies on solvent-based epoxies. Waterborne Coatings grow fastest at 3.70% a year, as fabricators cut volatile emissions and worker exposure in shop painting.
Why do resources and infrastructure buy the most?
Based on end-use industry, the market is categorized into general industrial manufacturing, resources and infrastructure, automotive and vehicle industries, and specialty manufacturing. Resources and Infrastructure led with a 38.0% share of 2025 value, because bridges, pipelines, processing plants and mine equipment need heavy protection. Resources and Infrastructure grows fastest at 3.20% a year, as public works and mine sites renew coating systems.
Is maintenance recoating overtaking new steel work?
Based on application, the market is categorized into new asset protection, maintenance recoating and repair refinishing. Maintenance Recoating led with a 44.0% share of 2025 value, because aging bridges, tanks, conveyors and plant need recoating on fixed cycles. Maintenance Recoating grows fastest at 2.99% a year, as owners extend asset lives rather than replace steel structures.
| Segment Group | Leading Sub-segment | Share, 2025 | Fastest-growing Sub-segment | CAGR, 2026–2035 |
|---|---|---|---|---|
| By Resin Type | Epoxy Resins | 34.0% | Polyurethane Resins | 3.09% |
| By Technology | Solventborne Coatings | 42.0% | Waterborne Coatings | 3.70% |
| By End-Use Industry | Resources and Infrastructure | 38.0% | Resources and Infrastructure | 3.20% |
| By Application | Maintenance Recoating | 44.0% | Maintenance Recoating | 2.99% |
Request a Free Sample
Fill in your details and we'll send you a free sample report.
- Sample data tables & charts
- Research methodology
Public works, mine upkeep and cleaner chemistry lift use
How does infrastructure asset protection lift spending?
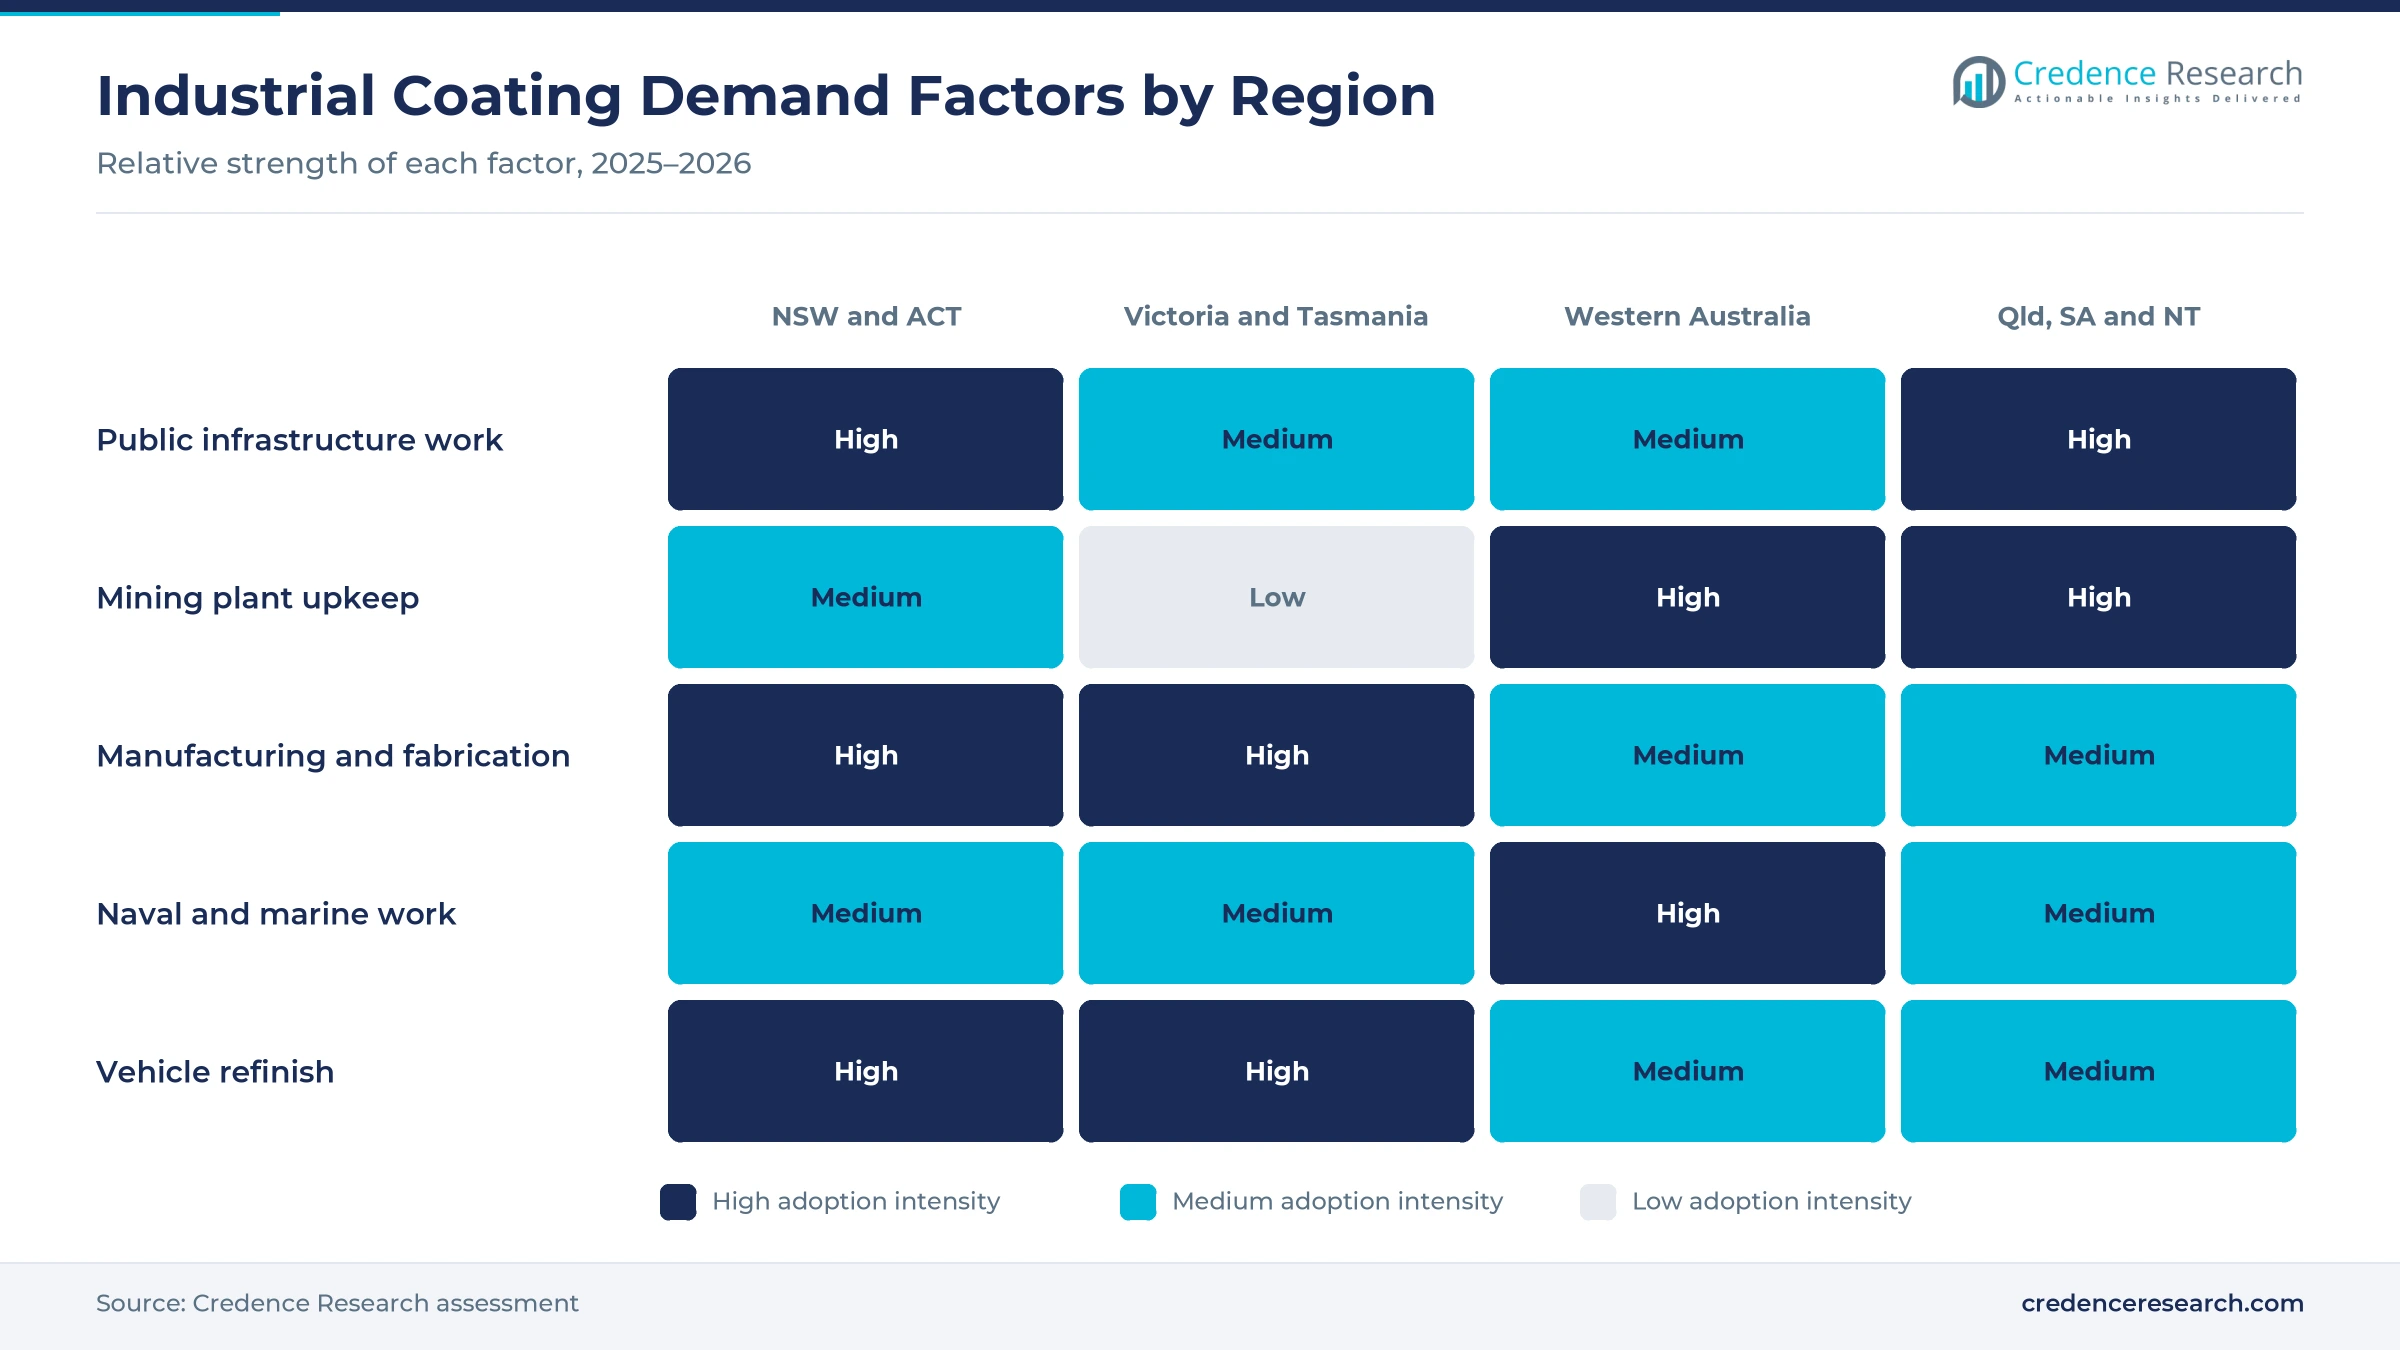
Infrastructure asset protection lifts spending, because every new bridge, rail line, transmission tower and treatment plant needs a corrosion protection system designed for decades of service. The major public infrastructure pipeline reached $242 billion over five years in November 2025, up $29 billion in a year, according to Infrastructure Australia. Engineering construction work commenced rose 20.7% to $37.6 billion in the June quarter 2026, which adds new steel to protect. On the Rozelle Interchange in Sydney, bridge steel received a four-coat system of zinc-rich epoxy primer, epoxy stripe coat, epoxy MIO and MIO topcoat. As a result, resources and infrastructure lead end uses with a 38.0% share, and demand rises for corrosion protection systems.
Why do resources maintenance and equipment renewal matter?
Resources maintenance and equipment renewal support demand, because mine plant, conveyors, tanks and haul equipment wear quickly in abrasive, wet and coastal conditions. Resources and energy export earnings were estimated at $385 billion in 2024-25, which keeps operators spending on plant upkeep. Mining equipment and machinery investment rose 5.4% in the June quarter 2026, according to national statistics. Western Australian engineering work done reached $39.9 billion in 2025-26, up 12.5% on a year earlier. Axalta also appointed a Mackay distributor that serves mining, construction, agriculture and transport customers in central Queensland. Consequently, maintenance recoating leads applications, helped by the upkeep of large fleets of underground mining equipment.
How does performance-led formulation substitution add value?
Performance-led formulation substitution adds value, because buyers trade older solvent paints for systems that last longer, cure faster and emit less. AkzoNobel launched its Interpon D Futura powder collection in Australia and New Zealand in January 2025, citing zero volatile organic compounds and reusable overspray. The range carries warranties of up to 25 years and an environmental product declaration that specifiers can check. New workplace exposure limits apply across Australia from Dec. 1, 2026, which tightens attention on solvent exposure in spray shops. In turn, waterborne coatings grow fastest among technologies at 3.70% a year, while polyurethane topcoats gain on long-life steel work.
Why does naval and specialty manufacturing support demand?
Naval and specialty manufacturing support demand, because warships, rail cars and heavy equipment need qualified coating systems for hulls, tanks, decks and fabricated parts. On Aug. 5, 2025, the government chose the Mogami-class design for the Navy's general purpose frigates, with later ships to be built at Henderson in Western Australia. The first ship is due for delivery in 2029, and the government plans $55 billion in surface fleet spending over the decade. Manufacturing added 5.3% of gross domestic product in 2025, according to the World Bank, which sustains plant and product finishing. As a result, specialty manufacturing grows steadily, while Western Australia gains the most new naval coating work.
Supplier mergers and a shift to powder lines gain pace
How is the shift to fewer suppliers reshaping supply?
Supplier consolidation is reshaping coating supply, because the largest global formulators want scale in protective, powder and refinish lines. AkzoNobel and Axalta announced an all-stock merger of equals on Nov. 18, 2025, with a combined enterprise value of about $25 billion, according to the companies. Shareholders of both companies approved the deal on Aug. 5, 2026, and closing is expected in late 2026 or early 2027. Hempel already owns Wattyl, which brought factories in Kilburn, South Australia and Footscray, Victoria, plus the Wattyl Protective Coatings brand. Consequently, fewer suppliers will hold larger shares of specifications, refinish dealer networks and distributor shelf space across the country.
Why are powder and low-emission lines rising in shops?
Powder and low-emission lines are rising in shops, because fabricators and product makers want lower solvent use, less waste and simpler compliance. Powder coatings contain no solvent, and overspray can be recovered and reused on the line, which lowers material losses. AkzoNobel promotes its Australian powder range with an environmental product declaration and warranties of up to 25 years. Jotun reported particularly strong growth in protective coatings and South East Asia and Pacific in its second quarter of 2026, with underlying revenue up 11%. Solventborne coatings still held 42.0% of 2025 value, which leaves room to switch. As a result, powder coatings gain ground, while solventborne products lose share as shop painting moves to cleaner lines.
Can bridge renewal programs open a recoating market?
Bridge renewal programs open a clear market, because many older steel crossings now need major repairs, repainting and component replacement before 2032. Brisbane's Story Bridge needs about $3.6 billion of renewal over 20 years, including $1.35 billion before 2032, according to Brisbane City Council. The council has committed $135 million to priority works and plans a full closure from Dec. 27, 2026, for resurfacing and joint maintenance. Ten regions across New South Wales, Tasmania and Queensland are also forecast to see public investment rise by at least 200%. Consequently, maintenance recoating grows at 2.99% a year, and blast-and-paint contractors gain multiyear work.
Is energy transmission a new steel protection opening?
Energy transmission offers a new opening for steel protection, because lattice towers, substations, wind structures and pumped hydro plant all need long-life corrosion systems. Renewable energy projects, including transmission lines, solar, wind and pumped hydro, are estimated at $163 billion over five years. Utilities investment in the public pipeline is projected to more than double to $36 billion. Buildings and structures investment rose 2.1% in the June quarter 2026, led by data centers and renewable energy projects. The 2026-27 capital spending estimate was also revised up 15.5% from the previous estimate. As a result, resources and infrastructure demand grows at 3.20% a year among end uses through 2035.
Labor gaps, lumpy projects and solvent rules slow growth
Why do labor shortages delay coating work?
Labor shortages delay coating work, because the infrastructure sector is short of about 141,000 workers needed to deliver the public pipeline. Blasters, painters and inspectors with protective coating skills are part of that gap. As a result, projects slip, recoating cycles stretch and contractors pay more for crews. Suppliers respond with faster-curing, fewer-coat systems and training programs that help applicators finish work with smaller teams on site.
How do lumpy project cycles affect suppliers?
Lumpy project cycles are a barrier to steady growth, because engineering work done swings sharply when large projects finish. Northern Territory work done fell 66.6% in 2025-26, while Victoria fell 5.6% on a year earlier. Consequently, coating orders in those regions can drop quickly between major packages. Suppliers respond by balancing new project work with maintenance contracts, distributor stock and refinish sales that hold volume between peaks.
Can buyers manage tighter solvent and exposure rules?
Tighter exposure rules raise compliance costs, because new workplace exposure limits apply from Dec. 1, 2026, and some limits are lower than before. In turn, spray shops and contractors must review ventilation, respirators and monitoring for solvent and isocyanate products. Small coating businesses face the highest compliance cost per job. Suppliers respond with waterborne, high-solids and powder alternatives plus safety data support that simplifies workplace assessments.
Why does import dependence pressure margins?
Import dependence pressures margins, because most resins, pigments and specialty additives are made overseas and priced in foreign currencies. Long shipping routes also add lead time for special colors and grades. As a result, small fabricators and contractors face higher prices and minimum order sizes. Local formulators respond by holding regional stock and tinting standard ranges close to customers in each state.
Sydney projects lead while Western Australia grows fastest
| Region | Value, 2025 (USD million) | Share, 2025 | CAGR, 2026–2035 |
|---|---|---|---|
| New South Wales and Australian Capital Territory | 328.4 | 33.7% | 2.78% |
| Queensland South Australia and Northern Territory | 250.4 | 25.7% | 2.88% |
| Victoria and Tasmania | 239.7 | 24.6% | 2.38% |
| Western Australia | 155.9 | 16.0% | 3.38% |
Sydney transport and utility works keep New South Wales ahead
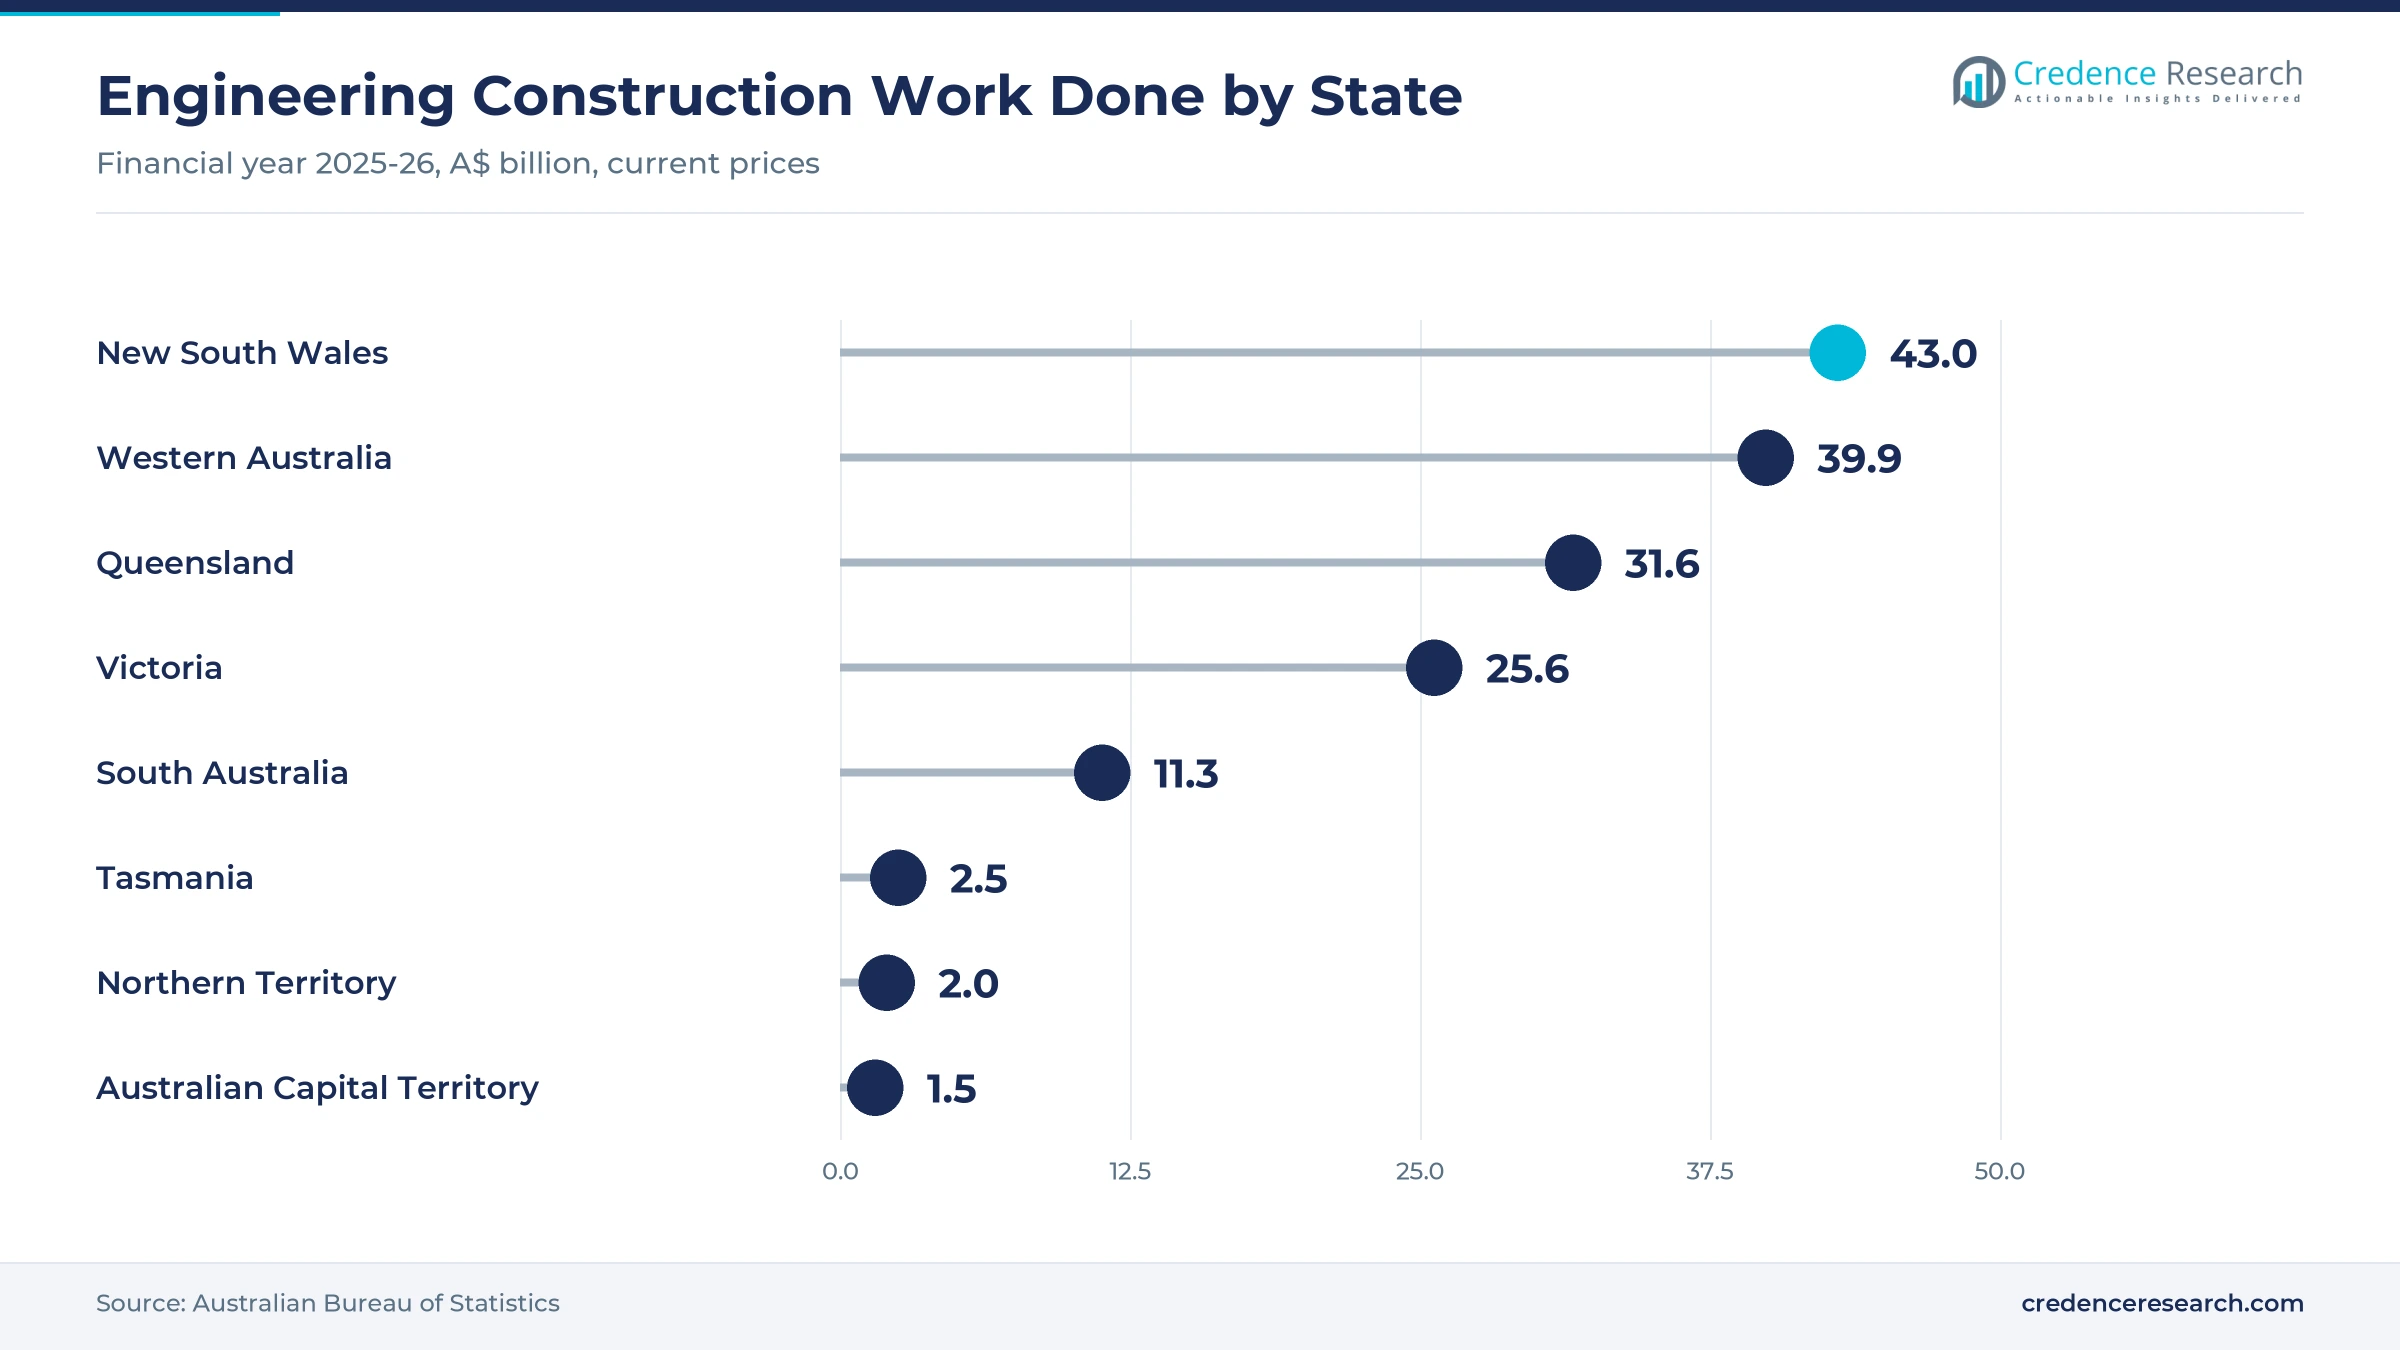
New South Wales and the Australian Capital Territory held a 33.7% share of 2025 value and grow at 2.78% a year. New South Wales recorded $43.0 billion of engineering work done in 2025-26, the most of any state, up 5.2% on a year earlier. Sydney motorway interchanges, rail lines, water plants and transmission links all specify multicoat steel protection with long recoat intervals. As a result, these projects keep large orders flowing for epoxy and polyurethane systems used in building construction and civil works.
Brisbane bridges and mine upkeep lift Queensland and the south
Queensland, South Australia and the Northern Territory held a 25.7% share of 2025 value and grow at 2.88% a year. Queensland recorded $31.6 billion of engineering work done in 2025-26, while South Australia rose 24.2% to $11.3 billion. Brisbane City Council has committed $135 million to priority Story Bridge works before 2032. As a result, bridge renewal in Brisbane, mine upkeep in central Queensland and new South Australian projects offset lower activity in the Northern Territory, where work done fell sharply.
Manufacturing and maintenance anchor Victoria and Tasmania
Victoria and Tasmania held a 24.6% share of 2025 value and grow at 2.38% a year. Victoria recorded $25.6 billion of engineering work done in 2025-26, down 5.6% on a year earlier, while Tasmania recorded $2.5 billion. Wattyl had a paint factory in Footscray, Melbourne, when Hempel agreed to buy it in 2021. Consequently, demand leans on manufacturing, vehicle refinish and maintenance recoating, and Tasmanian workshops also paint bridge steel that is shipped to mainland projects such as the Rozelle Interchange in Sydney.
Why does Western Australia gain coating volume fastest?
Western Australia held a 16.0% share of 2025 value and grows fastest at 3.38% a year. The state recorded $39.9 billion of engineering work done in 2025-26, up 12.5% on a year earlier. Henderson is also set to build later general purpose frigates for the Navy. In turn, iron ore plant upkeep, gas facilities and shipbuilding keep Western Australia the fastest-growing user of heavy-duty protective systems.
Mergers, frigate plans and pipeline data, 2025–2026
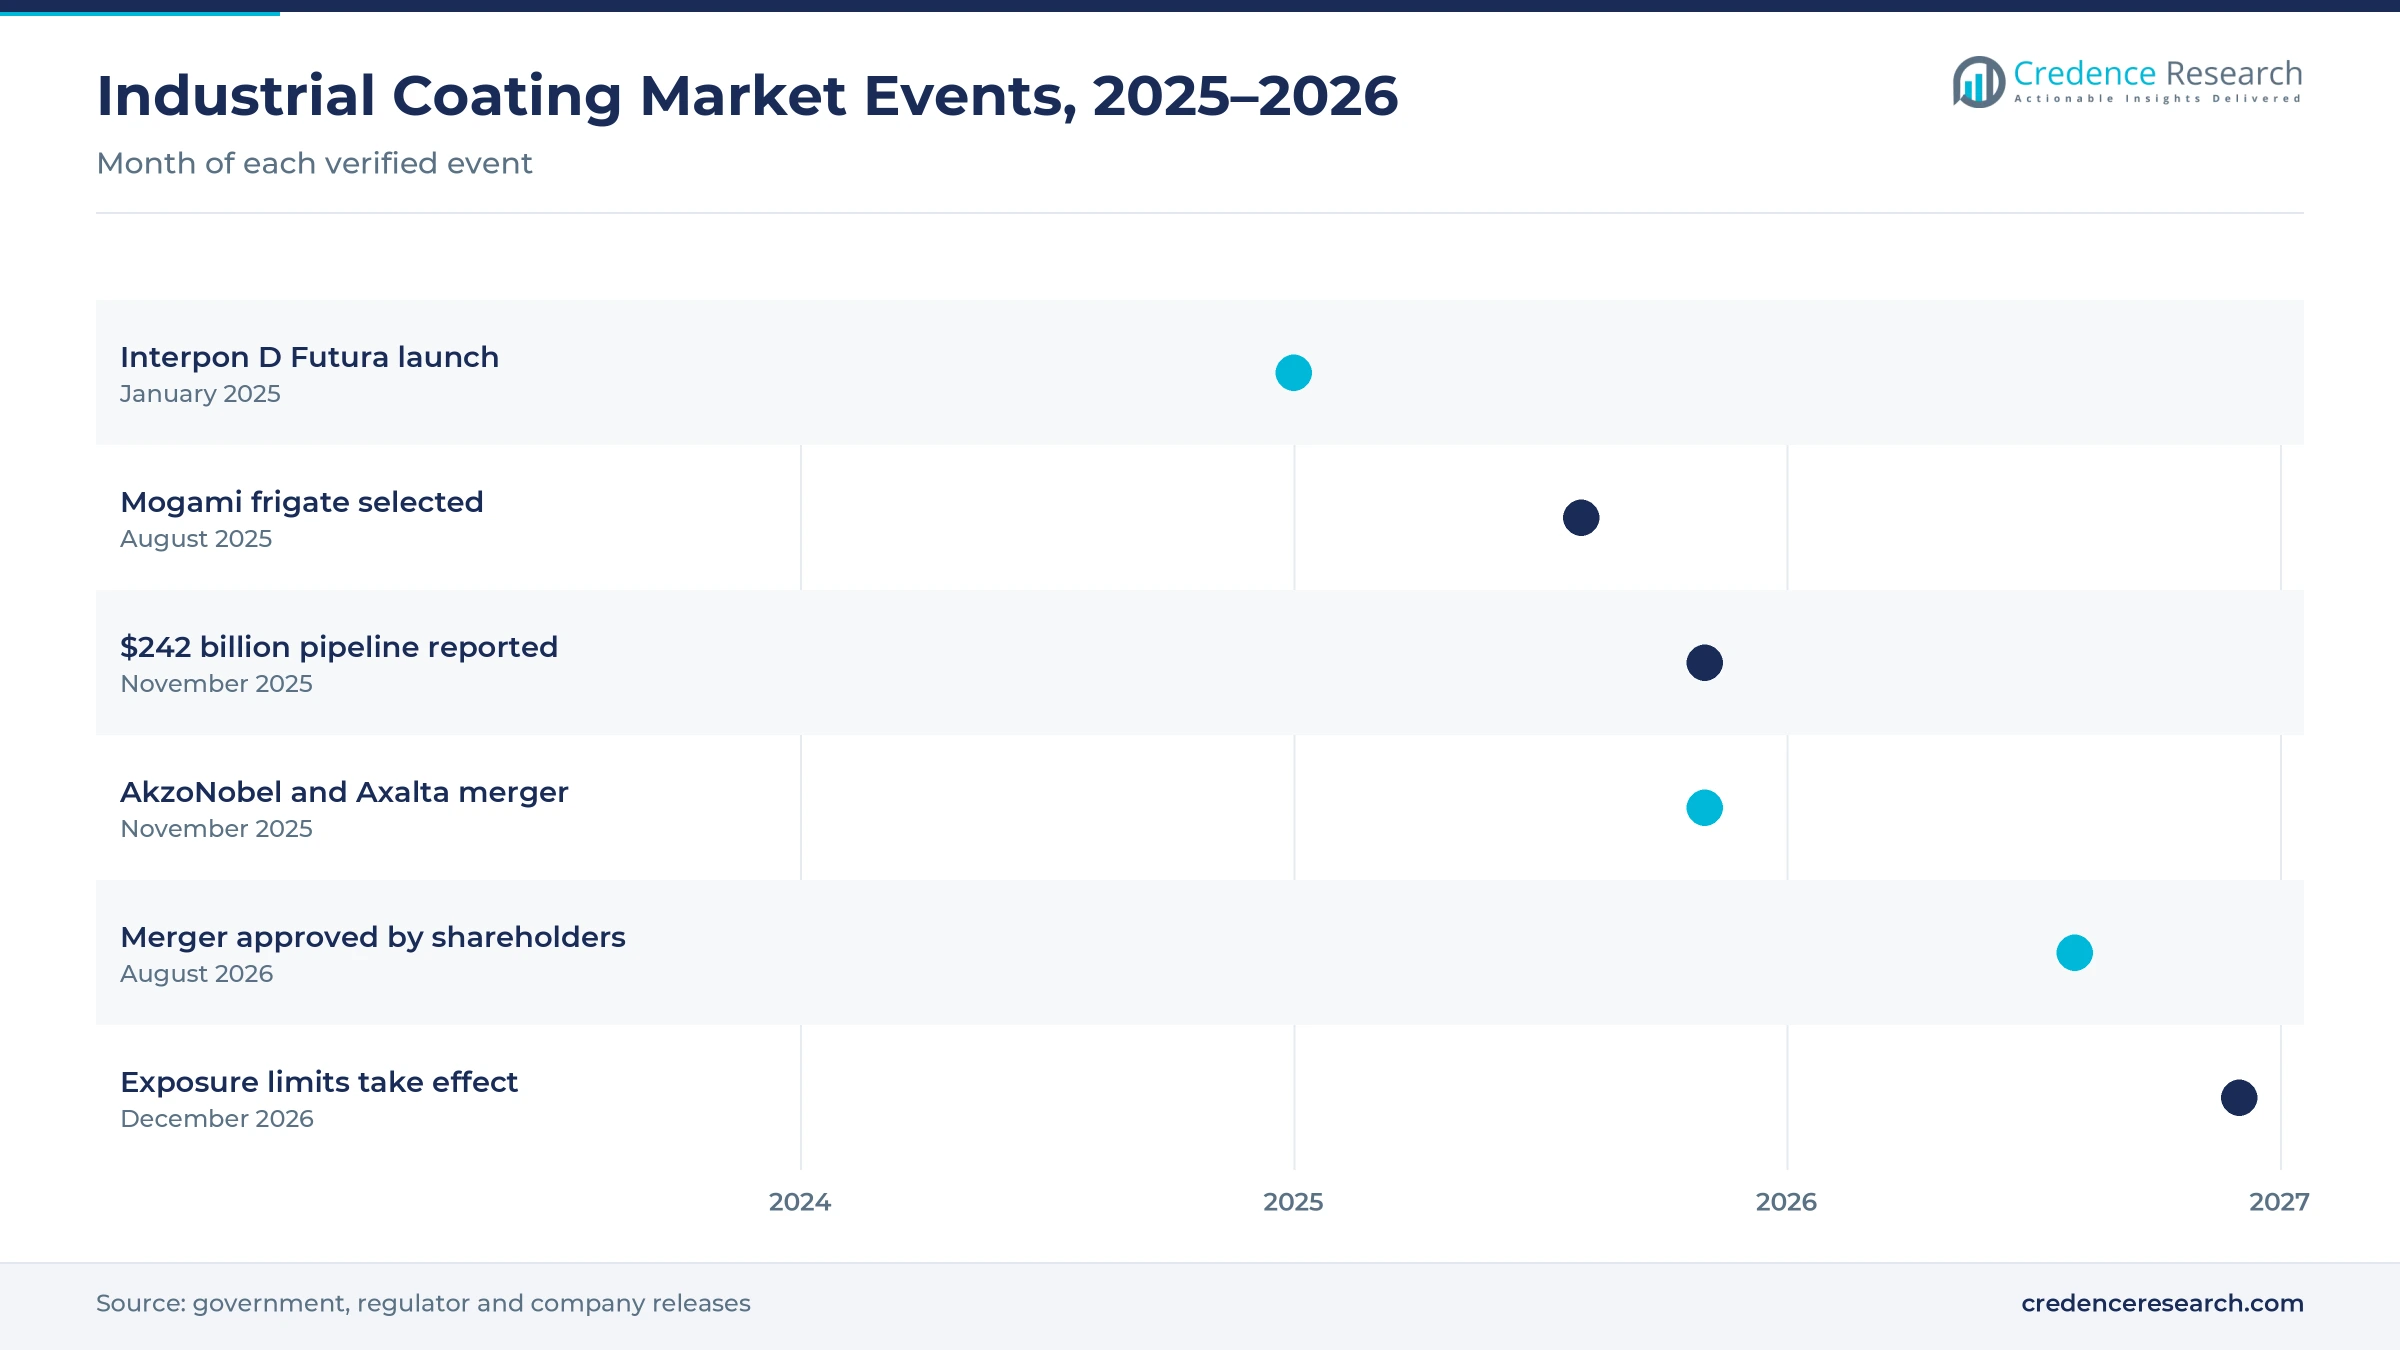
| Development | Status and market relevance |
|---|---|
| In January 2025, AkzoNobel introduced its Interpon D Futura powder collection in Australia and New Zealand. | Promotes zero-VOC powder finishes |
| In August 2025, the government selected the Mogami-class frigate, with later ships to be built at Henderson. | Adds naval coating demand in WA |
| In November 2025, Infrastructure Australia reported a $242 billion major public infrastructure pipeline. | Supports new steel protection work |
| In November 2025, AkzoNobel and Axalta announced an all-stock merger of equals. | Consolidates protective and refinish supply |
| In August 2026, shareholders of AkzoNobel and Axalta approved the merger, with closing expected by early 2027. | Moves consolidation toward completion |
Solventborne, waterborne, powder and high-solids compete
- Solventborne systems remain the standard for field painting of bridges, tanks and plant, because they tolerate cold, damp and variable site conditions.
- Waterborne systems cut solvent emissions in shop painting of machinery, frames and fabricated steel, although they need careful humidity control.
- Powder systems apply dry resin that is cured in ovens, giving tough finishes with no solvent and reusable overspray.
- High-solids and radiation-cured systems build thick films in fewer coats or cure in seconds, which shortens painting time for steel and parts.
Need a Custom Version of This Report?
Tailor the scope, geography, or segments to your exact requirements.
- Custom geography or segment scope
- Direct access to our analyst team
Global formulators compete through specs and service
Competition combines global formulators with local manufacturing, technical consultants and distributor networks. DuluxGroup supplies bridge and plant steel through Dulux Protective Coatings, whose systems protected Rozelle Interchange bridge steel in Sydney. Hempel agreed to buy Wattyl in 2021, gaining factories in South Australia and Victoria and the Wattyl Protective Coatings brand. AkzoNobel sells Interpon powder coatings in Australia, and its planned merger with Axalta would join powder and refinish ranges. Axalta serves refinish and industrial customers through regional distributors such as AJP in Mackay. Sherwin-Williams Protective and Marine lists offices in New South Wales and Victoria. Sika offers protective coatings and linings, while Carboline products are supplied through Resene Paints Australia in Queensland. Jotun reports strong protective coatings growth across South East Asia and Pacific. Companies compete on specifications, warranties, technical service and stock depth.
Companies profiled and their roles in this market
| Company | Type | Role in the market |
|---|---|---|
| DuluxGroup | Local formulator | Dulux Protective Coatings for bridges and plant steel |
| Hempel | Global formulator | Owns Wattyl and Wattyl Protective Coatings |
| AkzoNobel | Global formulator | Interpon powder coatings; merger with Axalta pending |
| Axalta Coating Systems | Global formulator | Refinish and industrial coatings through distributors |
| Sherwin-Williams | Global formulator | Protective and marine offices in NSW and Victoria |
| Sika | Global formulator | Protective coatings and linings |
| Carboline | Specialist formulator | Supplied through Resene Paints Australia |
Credence Research sees maintenance and WA setting pace
Credence Research's view is that Australian demand for industrial coatings will grow steadily through 2035, as public works, mine upkeep and bridge renewal keep owners spending on steel protection. Epoxy resins should keep the largest resin share, while waterborne coatings gain most among technologies. New South Wales and the ACT will remain the largest region, although Western Australia adds demand fastest. However, labor shortages, lumpy project cycles and stricter exposure rules will reward suppliers with strong specifications, technical service and lower-emission systems.
Steel tonnage and recoat cycles anchor the model
The report uses 2025 as the base year, with values in USD million at current prices. Market values come from the Credence Research model, which combines engineering construction activity, steel and equipment protection needs, recoating cycles and price tiers. The four regional zones and their 2025 shares follow the client brief, while regional growth and segment splits by resin type, technology, end-use industry and application are Credence Research estimates. Sources used are official statistics, government releases, company announcements, supplier pages and trade press, and no interviews or surveys were used.
Asset renewal and cleaner systems shape demand to 2035
The market is expected to reach USD 1.29 billion by 2035, a 2.81% CAGR during 2026–2035, as infrastructure, resources upkeep and cleaner coating systems keep demand rising. Spending is projected to rise from USD 1.00 billion in 2026 as new projects and maintenance programs add steel to protect. Growth should be strongest in waterborne coatings, maintenance recoating and Western Australia, while New South Wales and the ACT keep the largest share. In contrast, labor shortages and project gaps could slow orders in some years.
Frequently Asked Questions
How big is the Australia industrial coatings market?
Which region leads demand?
Which region grows fastest?
Which resin type holds the largest share?
Which technology grows fastest?
How does supplier consolidation affect buyers?
Who are the leading companies in this market?
What are the main risks to growth?
Table of Content
Chapter 1 Market Segmentation
- 1.1 Segmentation Framework
- 1.1.1 Product and Service Classification
- 1.1.2 Application and End-Use Classification
- 1.1.3 Technology and Solution Classification
- 1.1.4 Customer and Distribution Channel Classification
- 1.1.5 Geographic Segmentation
- 1.1.6 Market Segment Definitions and Boundaries
- 1.2 By Resin Type
- 1.2.1 Epoxy Resins
- 1.2.2 Polyurethane Resins
- 1.2.3 Acrylic Resins
- 1.2.4 Polyester and Specialty Resins
- 1.3 By Technology
- 1.3.1 Solventborne Coatings
- 1.3.2 Waterborne Coatings
- 1.3.3 Powder Coatings
- 1.3.4 High-Solids and Radiation-Cured Coatings
- 1.4 By End-Use Industry
- 1.4.1 General Industrial Manufacturing
- 1.4.2 Resources and Infrastructure
- 1.4.3 Automotive and Vehicle Industries
- 1.4.4 Specialty Manufacturing
- 1.5 By Application
- 1.5.1 New Asset Protection
- 1.5.2 Maintenance Recoating
- 1.5.3 Repair Refinishing
Chapter 2 Introduction
- 2.1 Report Objectives and Scope
- 2.2 Product Definition and Industry Terminology
- 2.3 Market Inclusions and Exclusions
- 2.4 Research Process
- 2.4.1 Primary Research and Expert Interviews
- 2.4.2 Secondary Research and Source Review
- 2.4.3 Top-Down and Bottom-Up Estimation
- 2.4.4 Data Triangulation and Verification
- 2.5 Market Size Measurement Basis
- 2.5.1 2025: USD 974.5 million → 2035: USD 1.29 billion
- 2.6 Historical and Forecast Reference Periods
- 2.6.1 Historical Period: 2018-2025
- 2.6.2 Base Year: 2025
- 2.6.3 Forecast Period: 2025-2035
- 2.7 Research Assumptions and Limitations
Chapter 3 Executive Summary
- 3.1 Market Snapshot and Key Findings
- 3.2 Base-Year Market Size, 2025
- 3.3 Forecast Market Size, 2035
- 3.4 Revenue and Volume Growth Outlook
- 3.5 Key Demand and Supply Indicators
- 3.6 Leading Market Segments
- 3.7 Fastest-Growing Market Opportunities
- 3.8 Regional Performance Highlights
- 3.9 Technology and Industry Transformation
- 3.10 Competitive Landscape Summary
- 3.11 Analyst View and Strategic Implications
Chapter 4 Australia Industrial Coatings Market Trends and Developments
- 4.1 Historical Industry Development, 2018-2025
- 4.2 Recent Market Trends and Developments
- 4.3 Demand and Customer Behavior Trends
- 4.4 Technology and Product Innovation
- 4.5 Artificial Intelligence, Automation and Digitalization
- 4.6 Local Manufacturing and Supply Chain Realignment
- 4.7 Industry Partnerships, Mergers and Acquisitions
- 4.8 Sustainability and Circular Economy Developments
- 4.9 Government and Private Sector Investment Trends
- 4.10 Emerging Business Models and Commercialization
- 4.11 Industry Developments and Announcements
Chapter 5 Australia Industrial Coatings Market Production, Supply and Demand Analysis
- 5.1 Demand Trend and Consumption Analysis, 2018-2025
- 5.2 Demand Forecast, 2025-2035
- 5.3 Production and Output Trend, 2018-2025
- 5.4 Production and Output Forecast, 2025-2035
- 5.5 Installed Capacity and Capacity Utilization
- 5.6 Company-Wise Production Plants and Statistics
- 5.6.1 Installed Production Capacity
- 5.6.2 Actual Production
- 5.6.3 Planned Capacity and Expansion Targets
- 5.7 Supply Chain Structure and Procurement Trends
- 5.8 Supply-Demand Gap and Bottlenecks
- 5.9 Import Dependence and Sourcing Structure
- 5.10 Contract Manufacturing and Outsourcing
- 5.11 Regional Supply and Demand Concentration
Chapter 6 Australia Industrial Coatings Market Pricing Analysis
- 6.1 Pricing Structure and Measurement
- 6.2 Historical Pricing Trends, 2018-2025
- 6.3 Pricing Outlook, 2025-2035
- 6.4 Average Selling Price and Unit Economics
- 6.5 Pricing by Product and Market Segment
- 6.6 Geographic Pricing Differences
- 6.7 Key Input, Energy, Labor and Logistics Costs
- 6.8 Contract Pricing and Purchasing Models
- 6.9 Pricing Sensitivity and Competitive Positioning
- 6.10 Price, Margin and Profitability Implications
Chapter 7 Australia Industrial Coatings Market Dynamics
- 7.1 Market Growth Drivers
- 7.1.1 Demand-Side Drivers
- 7.1.2 Technology and Innovation Drivers
- 7.1.3 Infrastructure and Investment Drivers
- 7.1.4 Regulatory and Policy Drivers
- 7.2 Market Restraints
- 7.2.1 Cost and Affordability Constraints
- 7.2.2 Technology and Adoption Barriers
- 7.2.3 Supply Chain and Operational Constraints
- 7.3 Market Challenges
- 7.3.1 Competitive Pressure and Margin Erosion
- 7.3.2 Skills, Infrastructure and Implementation Gaps
- 7.4 Emerging Market Opportunities
- 7.5 Market Dynamics Impact and Time-Horizon Assessment
Chapter 8 Australia Industrial Coatings Value Chain Analysis
- 8.1 Industry Value Chain Overview
- 8.2 Upstream Suppliers and Critical Inputs
- 8.3 Technology and Component Providers
- 8.4 Manufacturing or Service Delivery
- 8.5 Distribution, Channel Partners and Integrators
- 8.6 Downstream Applications and End Users
- 8.7 Value Addition and Profit Pools
- 8.8 Vertical Integration and Outsourcing
- 8.9 Supplier Concentration and Risk
- 8.10 Supply Chain Localization and Resilience
Chapter 9 Australia Industrial Coatings Market Regulations and Policies
- 9.1 Relevant Laws, Standards and Compliance Frameworks
- 9.2 Product, Service, Safety and Quality Requirements
- 9.3 Government Policies, Incentives and Subsidies
- 9.4 Imports, Exports and Trade Barriers
- 9.5 Public Procurement and Local Content Requirements
- 9.6 Environmental and Sustainability Compliance
- 9.7 Upcoming Policy Changes and Market Implications
Chapter 10 Australia Industrial Coatings Market Hotspots and Opportunities
- 10.1 Market Opportunity Mapping and Growth Hotspots
- 10.2 High-Growth Applications and Customer Groups
- 10.3 Underserved Markets and White-Space Opportunities
- 10.4 Emerging Technology and Product Opportunities
- 10.5 New Capacity and Investment Hotspots
- 10.6 Market Entry and Expansion Opportunities
- 10.7 Distribution and Partnership Opportunities
- 10.8 Near-Term and Long-Term Commercial Potential
- 10.9 Opportunity Attractiveness and Execution Risks
Chapter 11 Australia Industrial Coatings Market Outlook, 2025-2035
- 11.1 Market Size and Analysis
- 11.1.1 Revenue (Market Measurement: 2025: USD 974.5 million → 2035: USD 1.29 billion)
- 11.1.2 Market Volume and Quantity Sold
- 11.1.3 Historical Market Size, 2018-2025
- 11.1.4 Base-Year Market Size, 2025
- 11.2 Market Forecast, 2025-2035
- 11.2.1 Revenue Forecast to 2035
- 11.2.2 Volume Forecast to 2035
- 11.2.3 CAGR and Year-on-Year Growth
- 11.2.4 Incremental Revenue Opportunity
- 11.3 Forecast Assumptions and Scenario Analysis
- 11.3.1 Base-Case Forecast
- 11.3.2 Optimistic and Conservative Scenarios
- 11.3.3 Technology, Pricing and Policy Sensitivities
- 11.4 Market Attractiveness and Growth Outlook
Chapter 12 Australia Industrial Coatings Market Segmentation and Outlook
- 12.1 Segmentation Summary and Market Shares, 2025
- 12.2 Largest and Fastest-Growing Segments
- 12.3 By Resin Type - Market Size and Forecast, 2025-2035
- 12.3.1 Segment Definition and Scope
- 12.3.2 Historical Market Size, 2018-2025
- 12.3.3 Revenue Forecast, 2025-2035
- 12.3.4 Volume Forecast, 2025-2035
- 12.3.5 Base-Year Market Share, 2025
- 12.3.6 Segment CAGR and Growth Drivers
- 12.3.7 Subsegment Market Size and Forecast
- 12.3.7.1 Epoxy Resins
- 12.3.7.2 Polyurethane Resins
- 12.3.7.3 Acrylic Resins
- 12.3.7.4 Polyester and Specialty Resins
- 12.3.8 Subsegment Pricing and Adoption Trends
- 12.3.9 Leading Suppliers and Competition
- 12.3.10 Regional Demand and Opportunities
- 12.4 By Technology - Market Size and Forecast, 2025-2035
- 12.4.1 Segment Definition and Scope
- 12.4.2 Historical Market Size, 2018-2025
- 12.4.3 Revenue Forecast, 2025-2035
- 12.4.4 Volume Forecast, 2025-2035
- 12.4.5 Base-Year Market Share, 2025
- 12.4.6 Segment CAGR and Growth Drivers
- 12.4.7 Subsegment Market Size and Forecast
- 12.4.7.1 Solventborne Coatings
- 12.4.7.2 Waterborne Coatings
- 12.4.7.3 Powder Coatings
- 12.4.7.4 High-Solids and Radiation-Cured Coatings
- 12.4.8 Subsegment Pricing and Adoption Trends
- 12.4.9 Leading Suppliers and Competition
- 12.4.10 Regional Demand and Opportunities
- 12.5 By End-Use Industry - Market Size and Forecast, 2025-2035
- 12.5.1 Segment Definition and Scope
- 12.5.2 Historical Market Size, 2018-2025
- 12.5.3 Revenue Forecast, 2025-2035
- 12.5.4 Volume Forecast, 2025-2035
- 12.5.5 Base-Year Market Share, 2025
- 12.5.6 Segment CAGR and Growth Drivers
- 12.5.7 Subsegment Market Size and Forecast
- 12.5.7.1 General Industrial Manufacturing
- 12.5.7.2 Resources and Infrastructure
- 12.5.7.3 Automotive and Vehicle Industries
- 12.5.7.4 Specialty Manufacturing
- 12.5.8 Subsegment Pricing and Adoption Trends
- 12.5.9 Leading Suppliers and Competition
- 12.5.10 Regional Demand and Opportunities
- 12.6 By Application - Market Size and Forecast, 2025-2035
- 12.6.1 Segment Definition and Scope
- 12.6.2 Historical Market Size, 2018-2025
- 12.6.3 Revenue Forecast, 2025-2035
- 12.6.4 Volume Forecast, 2025-2035
- 12.6.5 Base-Year Market Share, 2025
- 12.6.6 Segment CAGR and Growth Drivers
- 12.6.7 Subsegment Market Size and Forecast
- 12.6.7.1 New Asset Protection
- 12.6.7.2 Maintenance Recoating
- 12.6.7.3 Repair Refinishing
- 12.6.8 Subsegment Pricing and Adoption Trends
- 12.6.9 Leading Suppliers and Competition
- 12.6.10 Regional Demand and Opportunities
- 12.7 Segment Growth Comparison
- 12.8 Segment Attractiveness and Priority Matrix
Chapter 13 Australia Industrial Coatings End-Use and Application Market Outlook
- 13.1 End-Use Industry and Customer Demand Structure
- 13.2 Leading Applications and Customer Groups
- 13.3 End-Use Market Size, Share and Forecast
- 13.4 Major End-Use Industry Deep Dives
- 13.4.1 Customer Requirements and Use Cases
- 13.4.2 Demand and Replacement Cycles
- 13.4.3 Technical and Regulatory Considerations
- 13.4.4 Purchasing and Procurement Models
- 13.4.5 Leading Vendors and Distribution Channels
- 13.4.6 Forecast and Commercial Opportunities
- 13.5 Emerging Applications and Cross-Segment Demand
- 13.6 End-Use Industry Investment Priorities
Chapter 14 Australia Industrial Coatings Geographic Market Outlook, 2025-2035
- 14.1 Domestic Market Distribution and Demand Clusters
- 14.2 State- or Province-Wise Market Size and Forecast, 2025-2035
- 14.3 City and Metropolitan Market Outlook
- 14.4 Industrial, Manufacturing and Commercial Clusters
- 14.5 Geographic Concentration of Key End Users
- 14.6 Local Pricing and Purchasing Differences
- 14.7 Domestic Production Facilities and Capacity Map
- 14.8 Local Infrastructure and Project Pipeline
- 14.9 State-Level Policy and Incentive Differences
- 14.10 Subnational Investment Hotspots and Opportunities
- 14.11 Distribution and Logistics Networks
- 14.12 Domestic Competitive Footprint
Chapter 15 Australia Industrial Coatings Technology, Innovation and Sustainability Outlook
- 15.1 Technology Landscape and Maturity
- 15.2 Product, Process and Service Innovation
- 15.3 AI, Automation and Digital Tools in the Industry
- 15.4 Technology Adoption and Performance Benchmarking
- 15.5 Innovation Pipeline and R&D Investment
- 15.6 Patent and Intellectual Property Trends
- 15.7 Energy Efficiency and Resource Management
- 15.8 Sustainability, Recycling and Circularity
- 15.9 Technology Roadmap, 2025-2035
- 15.10 Risks of Obsolescence and Technology Substitution
Chapter 16 Australia Industrial Coatings Market Key Strategic Imperatives
- 16.1 Growth and Market Entry Priorities
- 16.2 High-Return Products and Segments
- 16.3 Pricing, Profitability and Cost Optimization
- 16.4 Technology Investment and Product Differentiation
- 16.5 Supply Chain Localization and Resilience
- 16.6 Distribution and Customer Acquisition
- 16.7 Partnership, Acquisition and Capacity Strategy
- 16.8 Regional Expansion Priorities
- 16.9 Short-, Medium- and Long-Term Actions
Chapter 17 Competition Outlook
- 17.1 Industry Competition Characteristics
- 17.2 Market Structure and Concentration
- 17.3 Market Share and Competitive Positioning, 2025
- 17.4 Company-Wise Revenue and Product Benchmarking
- 17.5 Production and Service Capacity Benchmarking
- 17.6 Technology, Pricing and Differentiation
- 17.7 Regional Footprint and Distribution Strength
- 17.8 Mergers, Acquisitions and Strategic Alliances
- 17.9 New Entrants and Competitive Threats
- 17.10 Porter's Five Forces and Industry Attractiveness
- 17.11 Competitive Outlook, 2025-2035
Chapter 18 Company Profiles
- 18.1 Company Coverage and Selection Criteria
- 18.2 DuluxGroup
- 18.2.1 Business Description
- 18.2.2 Company Ownership and Geographic Presence
- 18.2.3 Product and Service Portfolio
- 18.2.4 Manufacturing and Operating Footprint
- 18.2.5 Production Capacity and Expansion Plans
- 18.2.6 Financial Performance and Investment
- 18.2.7 Market Share and Competitive Position
- 18.2.8 Technology and Innovation Capabilities
- 18.2.9 Strategic Alliances or Partnerships
- 18.2.10 Recent Developments
- 18.2.11 Growth Strategy and Outlook
- 18.3 PPG Industries
- 18.4 AkzoNobel
- 18.5 Hempel
- 18.6 Axalta Coating Systems
- 18.7 Jotun
- 18.8 Sherwin-Williams
- 18.9 Sika
- 18.10 Carboline
- 18.11 Wagon Paints Australia
- 18.12 Other Relevant Market Participants
Note: Every listed company is profiled on the structure shown under the first company. The company list is preliminary and may change based on research findings, market developments, data availability and client requirements.
Chapter 19 Disclaimer
- 19.1 Research and Forecast Disclaimer
- 19.2 Data Source and Estimation Limitations
Note: The depth of individual sections depends on data availability for this market. Volume, capacity, trade and other unit-based metrics are included where applicable.

