
Hospital, dairy and food hygiene keep iodine demand steady
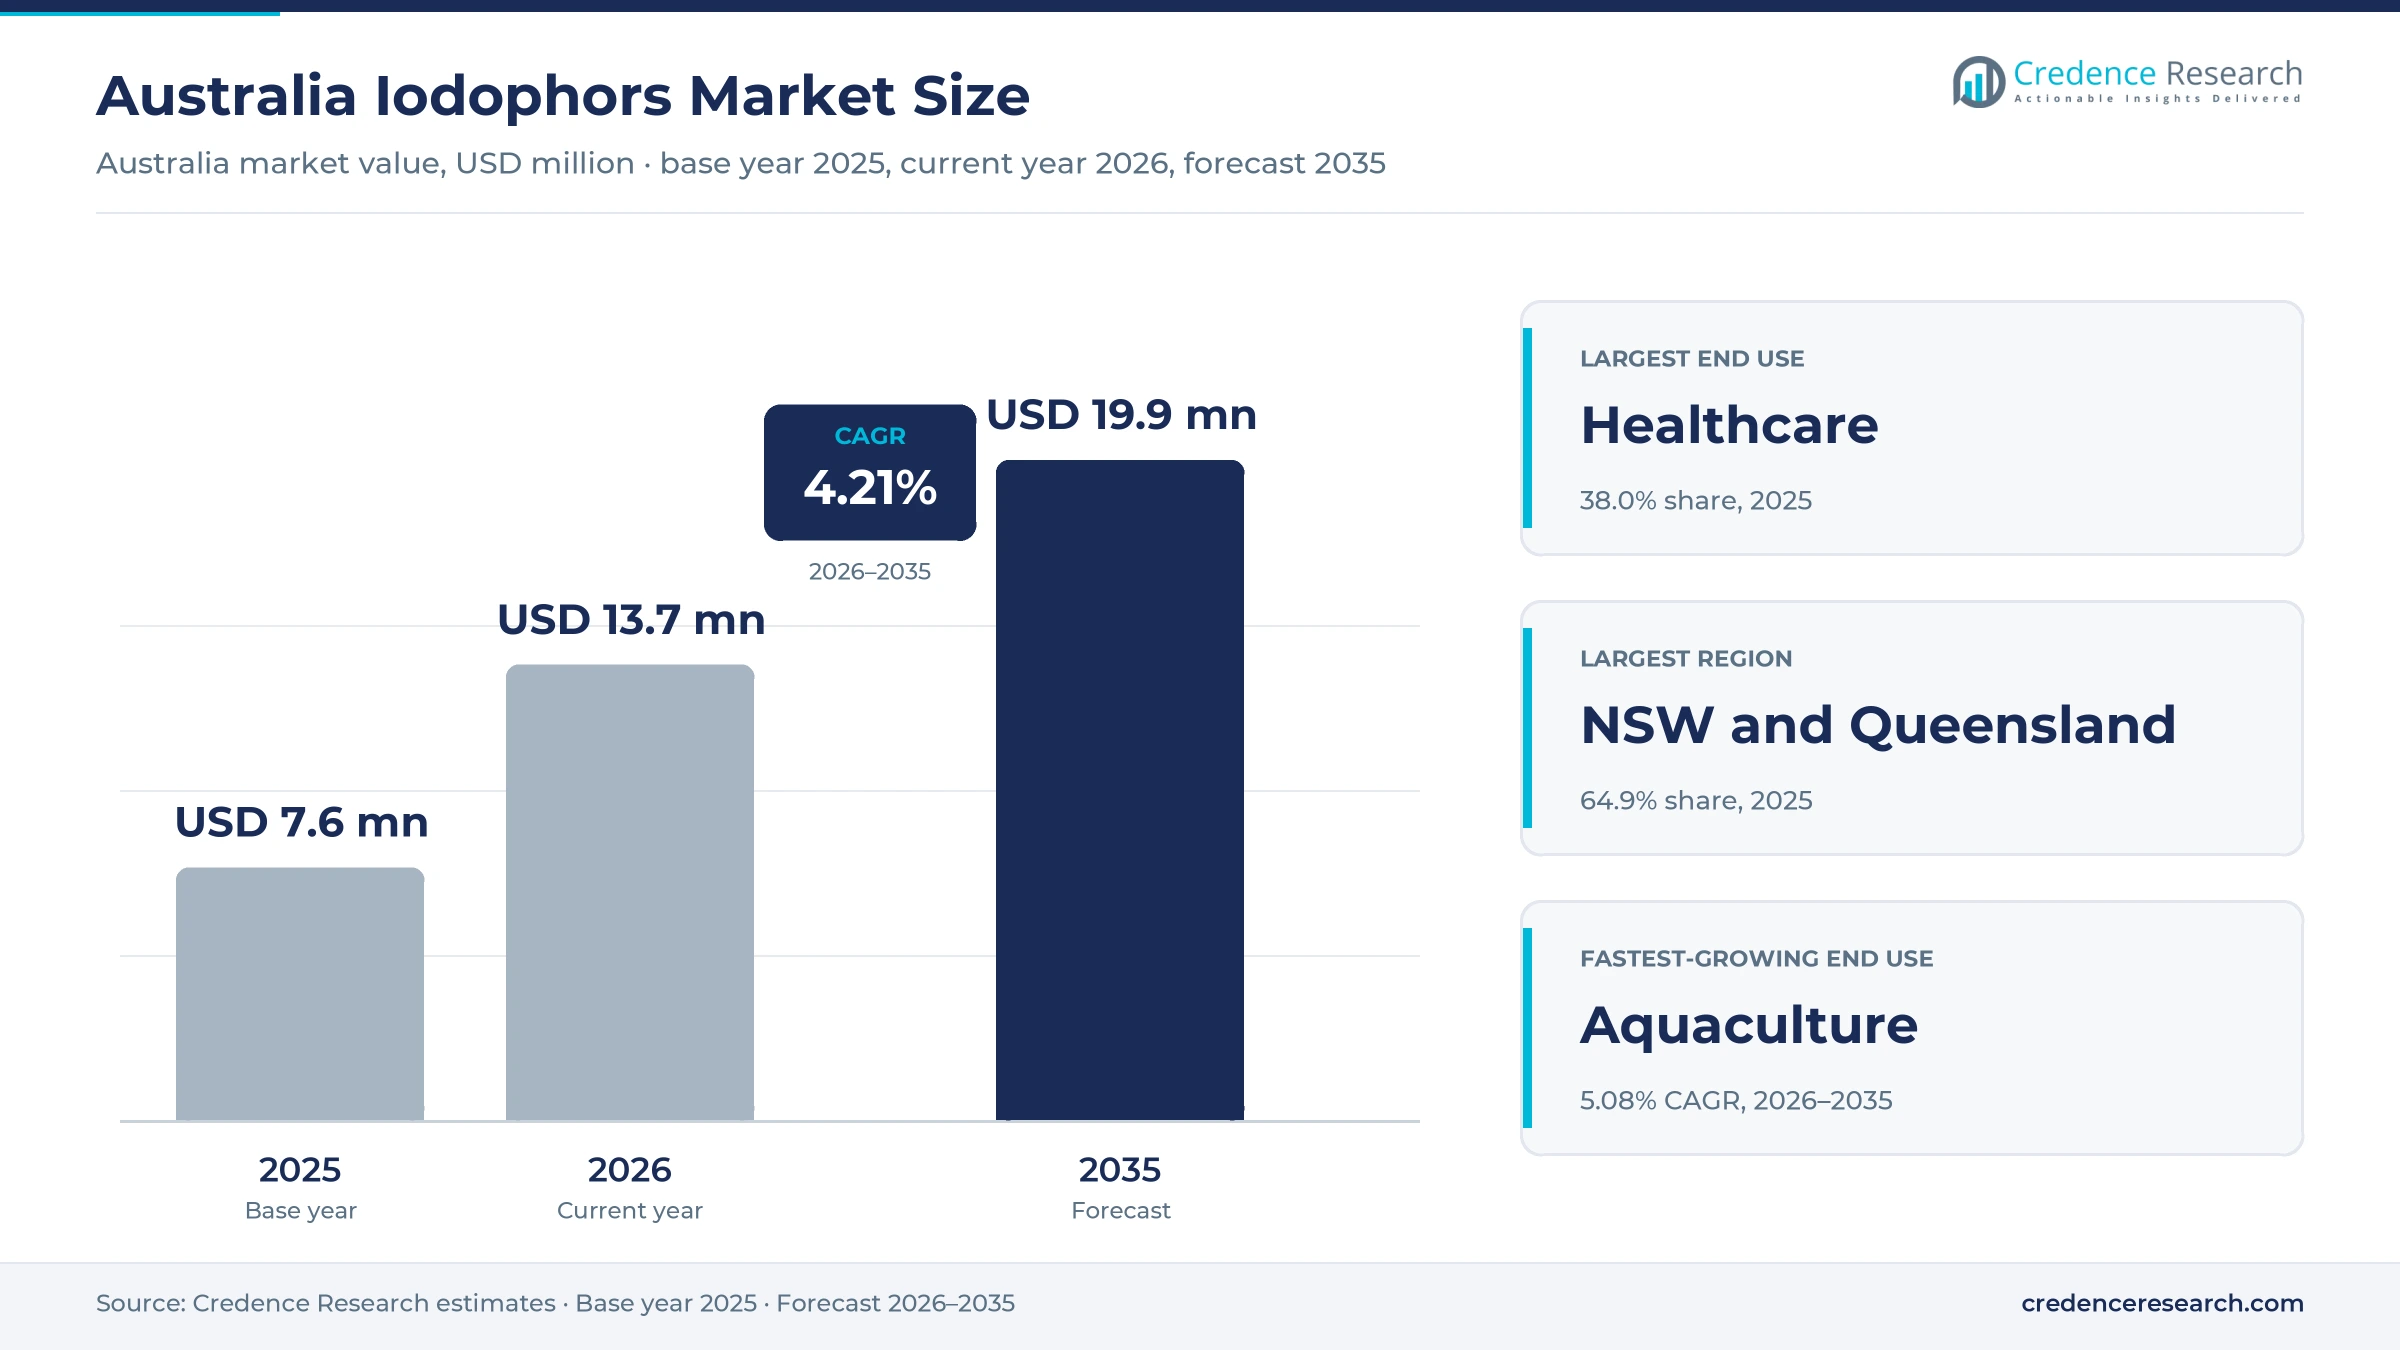
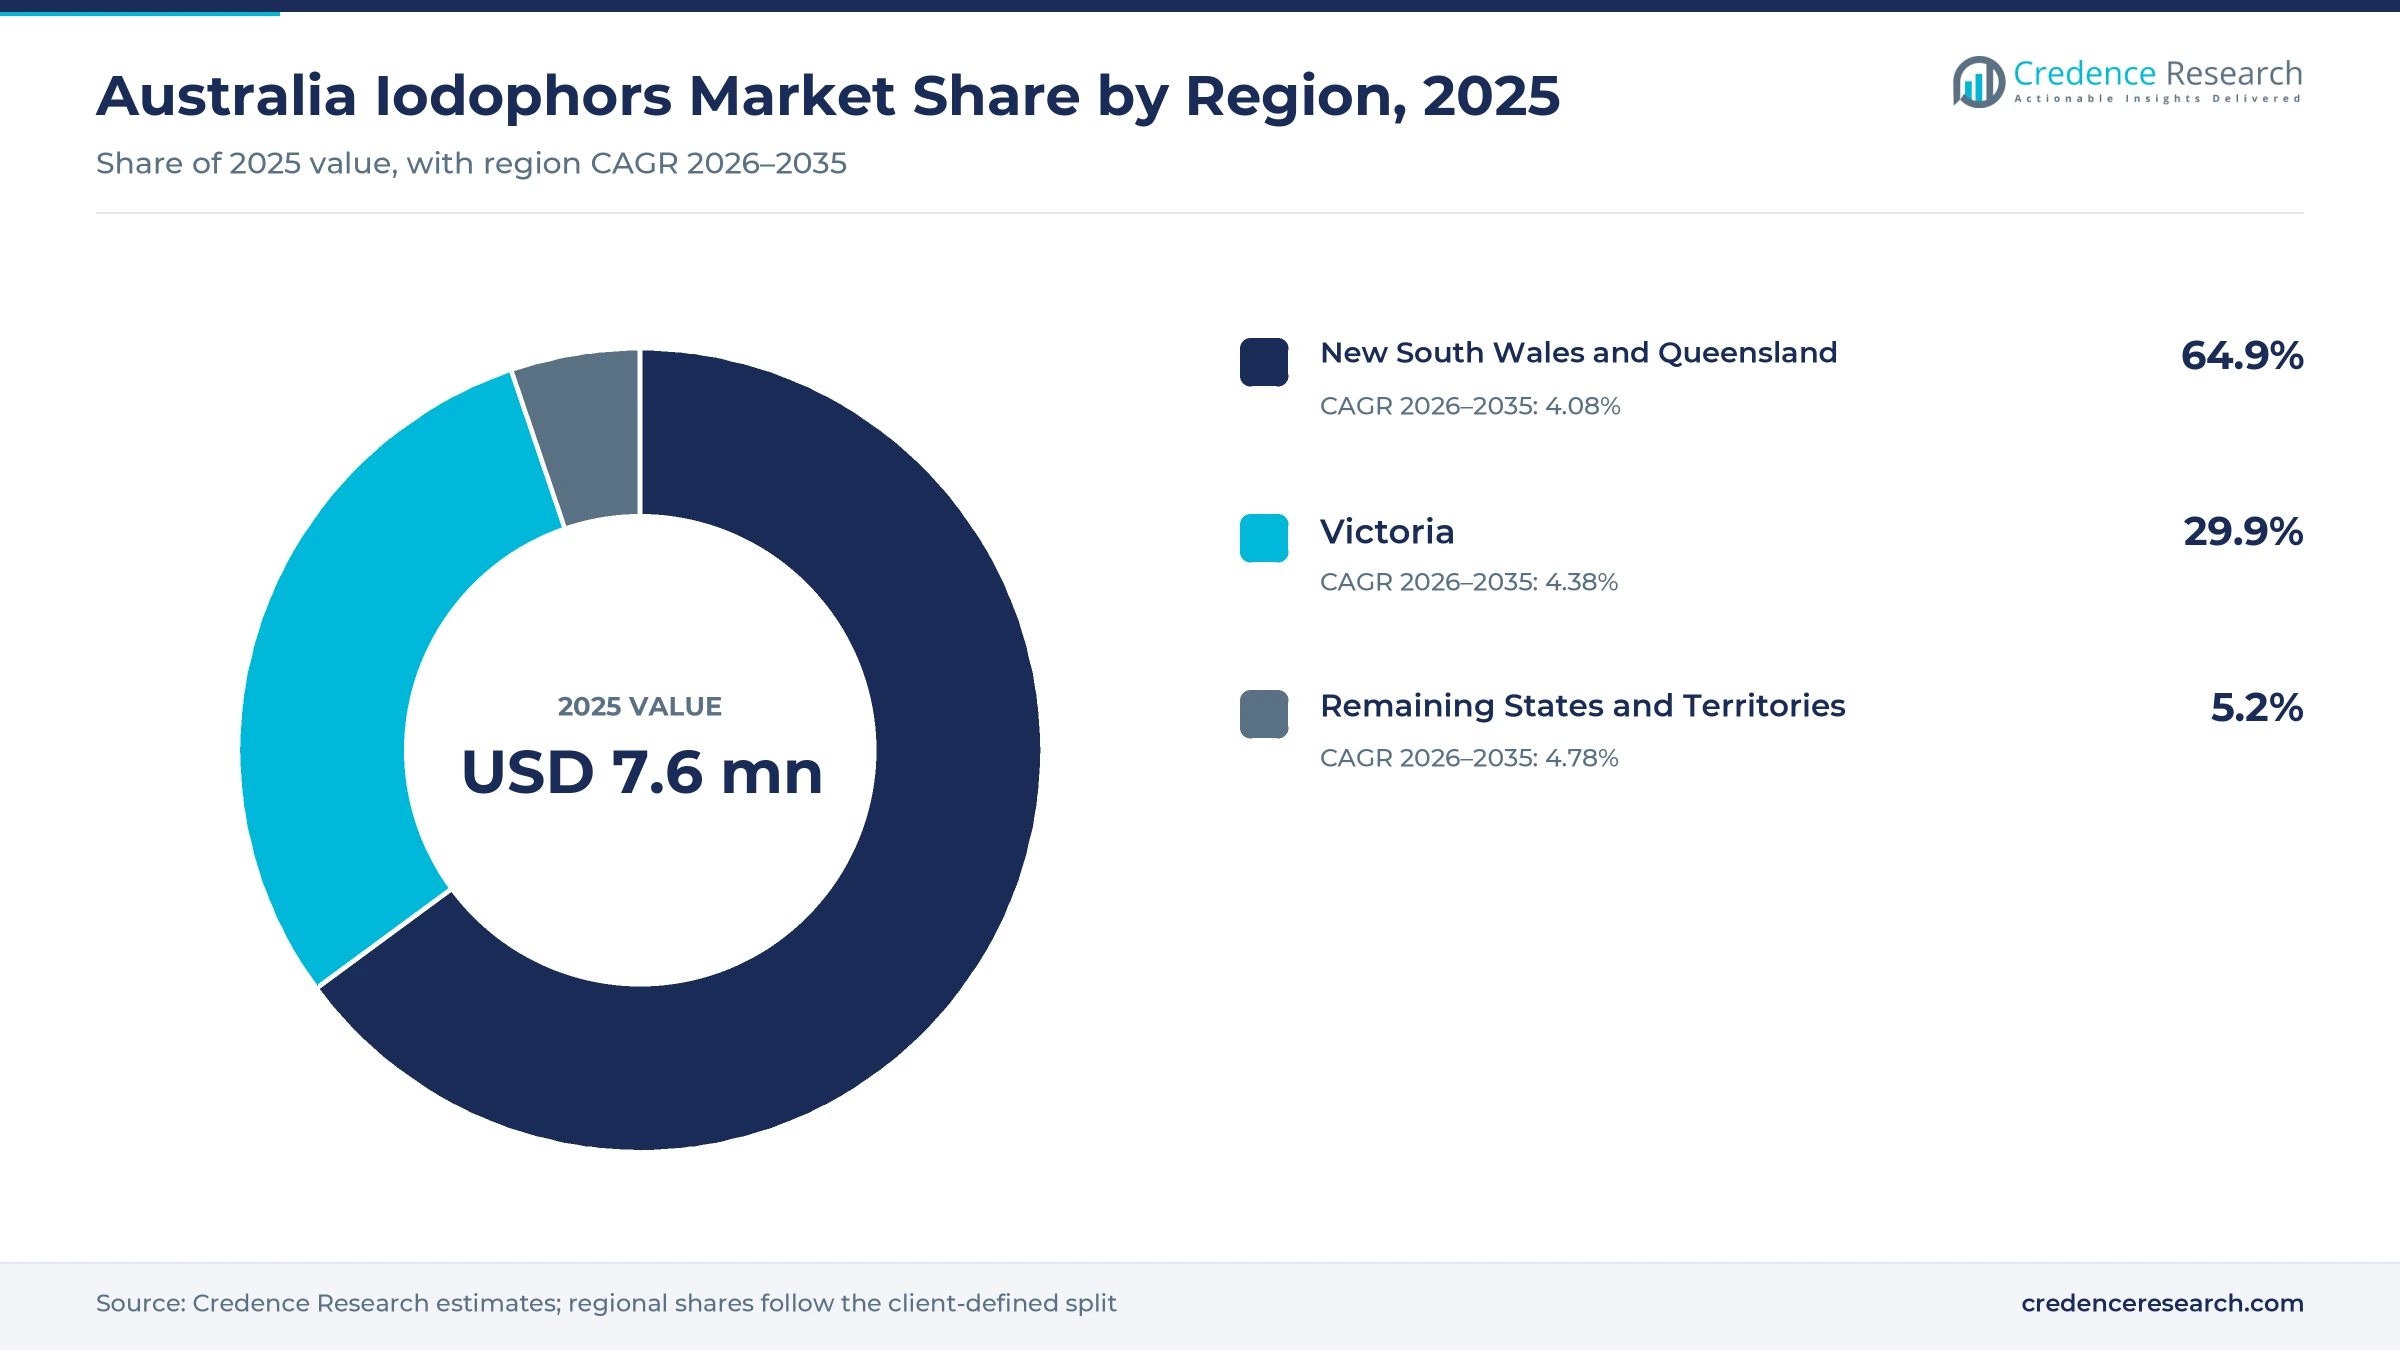
The Australia iodophors market was valued at USD 7.6 million in 2025 and is projected to increase from USD 13.7 million in 2026 to USD 19.9 million by 2035, registering a CAGR of 4.21% during 2026–2035. Demand comes from hospitals and clinics that prepare skin and treat wounds, dairy farms that dip teats after milking, food processors that sanitize equipment and aquaculture farms that disinfect gear. New South Wales and Queensland held the largest regional share, 64.9% in 2025, because the two states hold more than half of the national population and hospital activity. Remaining States and Territories is the fastest-growing region at 4.78% a year, as Western Australia adds people faster than any other state. In turn, new national food safety rules now ask more food businesses to show that equipment and surfaces are cleaned and sanitized.
Which iodine disinfectants does the estimate cover?
The estimate measures the value of iodophor products sold in Australia, including povidone-iodine antiseptic solutions, ointments and scrubs, iodine teat dips and sprays, and iodine sanitizers for food plants, farms and facilities. It counts purchases by hospitals, clinics, dairy and livestock farms, food processors, aquaculture farms, cleaning contractors and households.
The estimate excludes elemental iodine sold as a raw chemical, iodized salt, iodine contrast media, chlorhexidine and alcohol antiseptics, and chlorine sanitizers. The value chain runs from iodine and polymer suppliers through local blenders and medicine sponsors to wholesalers, rural merchandise stores, pharmacies and end users.
Australia Iodophors Market Insights
- The Australia iodophors market was valued at USD 7.6 million in 2025 and is projected to reach USD 19.9 million by 2035, registering a CAGR of 4.21% during 2026–2035.
- New South Wales and Queensland held a 64.9% share of 2025 value, because the two states have the most people, hospitals and food plants.
- Healthcare led end-use demand with a 38.0% share of 2025 value, because hospitals and clinics use povidone-iodine for skin preparation and wound care.
- Australian dairy farms produced 8,315 million liters of milk in 2024/25 from about 1.3 million cows, which keeps teat dip and parlor sanitizer use steady.
- Aquaculture grows fastest among end uses at 5.08% a year during 2026–2035, as fish and shellfish farms spend more on disinfection and biosecurity.
Non-foaming grades and healthcare buyers lead value
Why do non-foaming grades lead value?
Based on product type, the market is categorized into non-foaming iodophor and foaming iodophor. Non-Foaming Iodophor led with a 63.0% share of 2025 value, because antiseptic solutions, teat dips and clean-in-place sanitizers must rinse freely without foam. Foaming Iodophor grows faster at 4.58% a year, as surgical scrubs and foaming teat preparations gain use on farms and in hospitals.
How do hospitals and dairy farms split demand?
Based on end-use industry, the market is categorized into healthcare, dairy and veterinary, food and beverage processing, aquaculture and facility sanitation. Healthcare led with a 38.0% share of 2025 value, because hospitals buy povidone-iodine for surgery, wound care and procedures. Aquaculture grows fastest at 5.08% a year, as farmed seafood output and disease controls expand.
Why does human antisepsis lead applications?
Based on application, the market is categorized into human antisepsis, animal hygiene, equipment and surface sanitation, and aquaculture biosecurity. Human Antisepsis led with a 41.0% share of 2025 value, because skin preparation and wound treatment use iodine every day in hospitals and clinics. Aquaculture Biosecurity grows fastest at 5.07% a year, as hatcheries and farms disinfect eggs, nets and equipment.
How do buyers reach iodine disinfectant suppliers?
Based on sales channel, the market is categorized into direct enterprise sales, specialist distribution and consumer retail. Direct Enterprise Sales led with a 45.0% share of 2025 value, because hospital networks and large food plants buy under supply contracts. Specialist Distribution grows fastest at 4.40% a year, as rural merchandise stores and medical wholesalers serve farms and small clinics.
| Segment Group | Leading Sub-segment | Share, 2025 | Fastest-growing Sub-segment | CAGR, 2026–2035 |
|---|---|---|---|---|
| By Product Type | Non-Foaming Iodophor | 63.0% | Foaming Iodophor | 4.58% |
| By End-Use Industry | Healthcare | 38.0% | Aquaculture | 5.08% |
| By Application | Human Antisepsis | 41.0% | Aquaculture Biosecurity | 5.07% |
| By Sales Channel | Direct Enterprise Sales | 45.0% | Specialist Distribution | 4.40% |
Request a Free Sample
Fill in your details and we'll send you a free sample report.
- Sample data tables & charts
- Research methodology
Antisepsis, milking hygiene and food rules lift volumes
How does recurring healthcare antisepsis lift demand?
Recurring healthcare antisepsis lifts demand, because hospitals and clinics prepare skin and treat wounds with povidone-iodine every day. Australians aged 65 and over made up 18.1% of the population in 2025, up from 17.4% in 2023, according to the World Bank. Older patients need more surgery, wound dressings and procedures, which raises antiseptic use in hospitals and aged care homes. The Australian Bureau of Statistics announced that the population reached 27.92 million in March 2026, after growing 1.4% in a year. Betadine Antiseptic Topical Solution, a povidone-iodine 100 mg/mL product sponsored by iNova Pharmaceuticals, remains listed for supply. As a result, healthcare holds 38.0% of 2025 value, while related skin antiseptic products compete for the same procedures.
Why does repeat dairy hygiene use support volumes?
Repeat dairy hygiene use supports volumes, because dairy farmers disinfect teats and milking equipment at every milking to control mastitis. Australian farms produced 8,315 million liters of milk in 2024/25, according to Dairy Australia, only 0.7% less than the year before. The national herd held about 1.3 million cows on 3,772 dairy farms, which gives suppliers a large and regular customer base. Victoria produced 5,266 million liters, or 63.3% of national milk, while New South Wales added 1,071 million liters. In turn, animal hygiene holds a steady place in demand, and farmers buy teat dips alongside herd management tools that track udder health.
How do documented food sanitation rules lift demand?
Documented food sanitation rules lift demand, because more food businesses must now prove that surfaces and equipment are cleaned and sanitized. Food Safety Standard 3.2.2A applied to affected businesses from Dec. 8, 2023, according to the Victorian Department of Health. The standard asks food handlers to complete training that covers cleaning and sanitizing food contact surfaces and equipment. Category one and two businesses must also show, through records or a demonstration, that cleaning and sanitizing meet the prescribed provisions. Victoria applies the standard to class 1, 2 and 3A businesses. As a result, equipment and surface sanitation grows at a steady pace, and food plants add iodine sanitizers alongside other food plant disinfection products.
Why do animal disease responses raise disinfection demand?
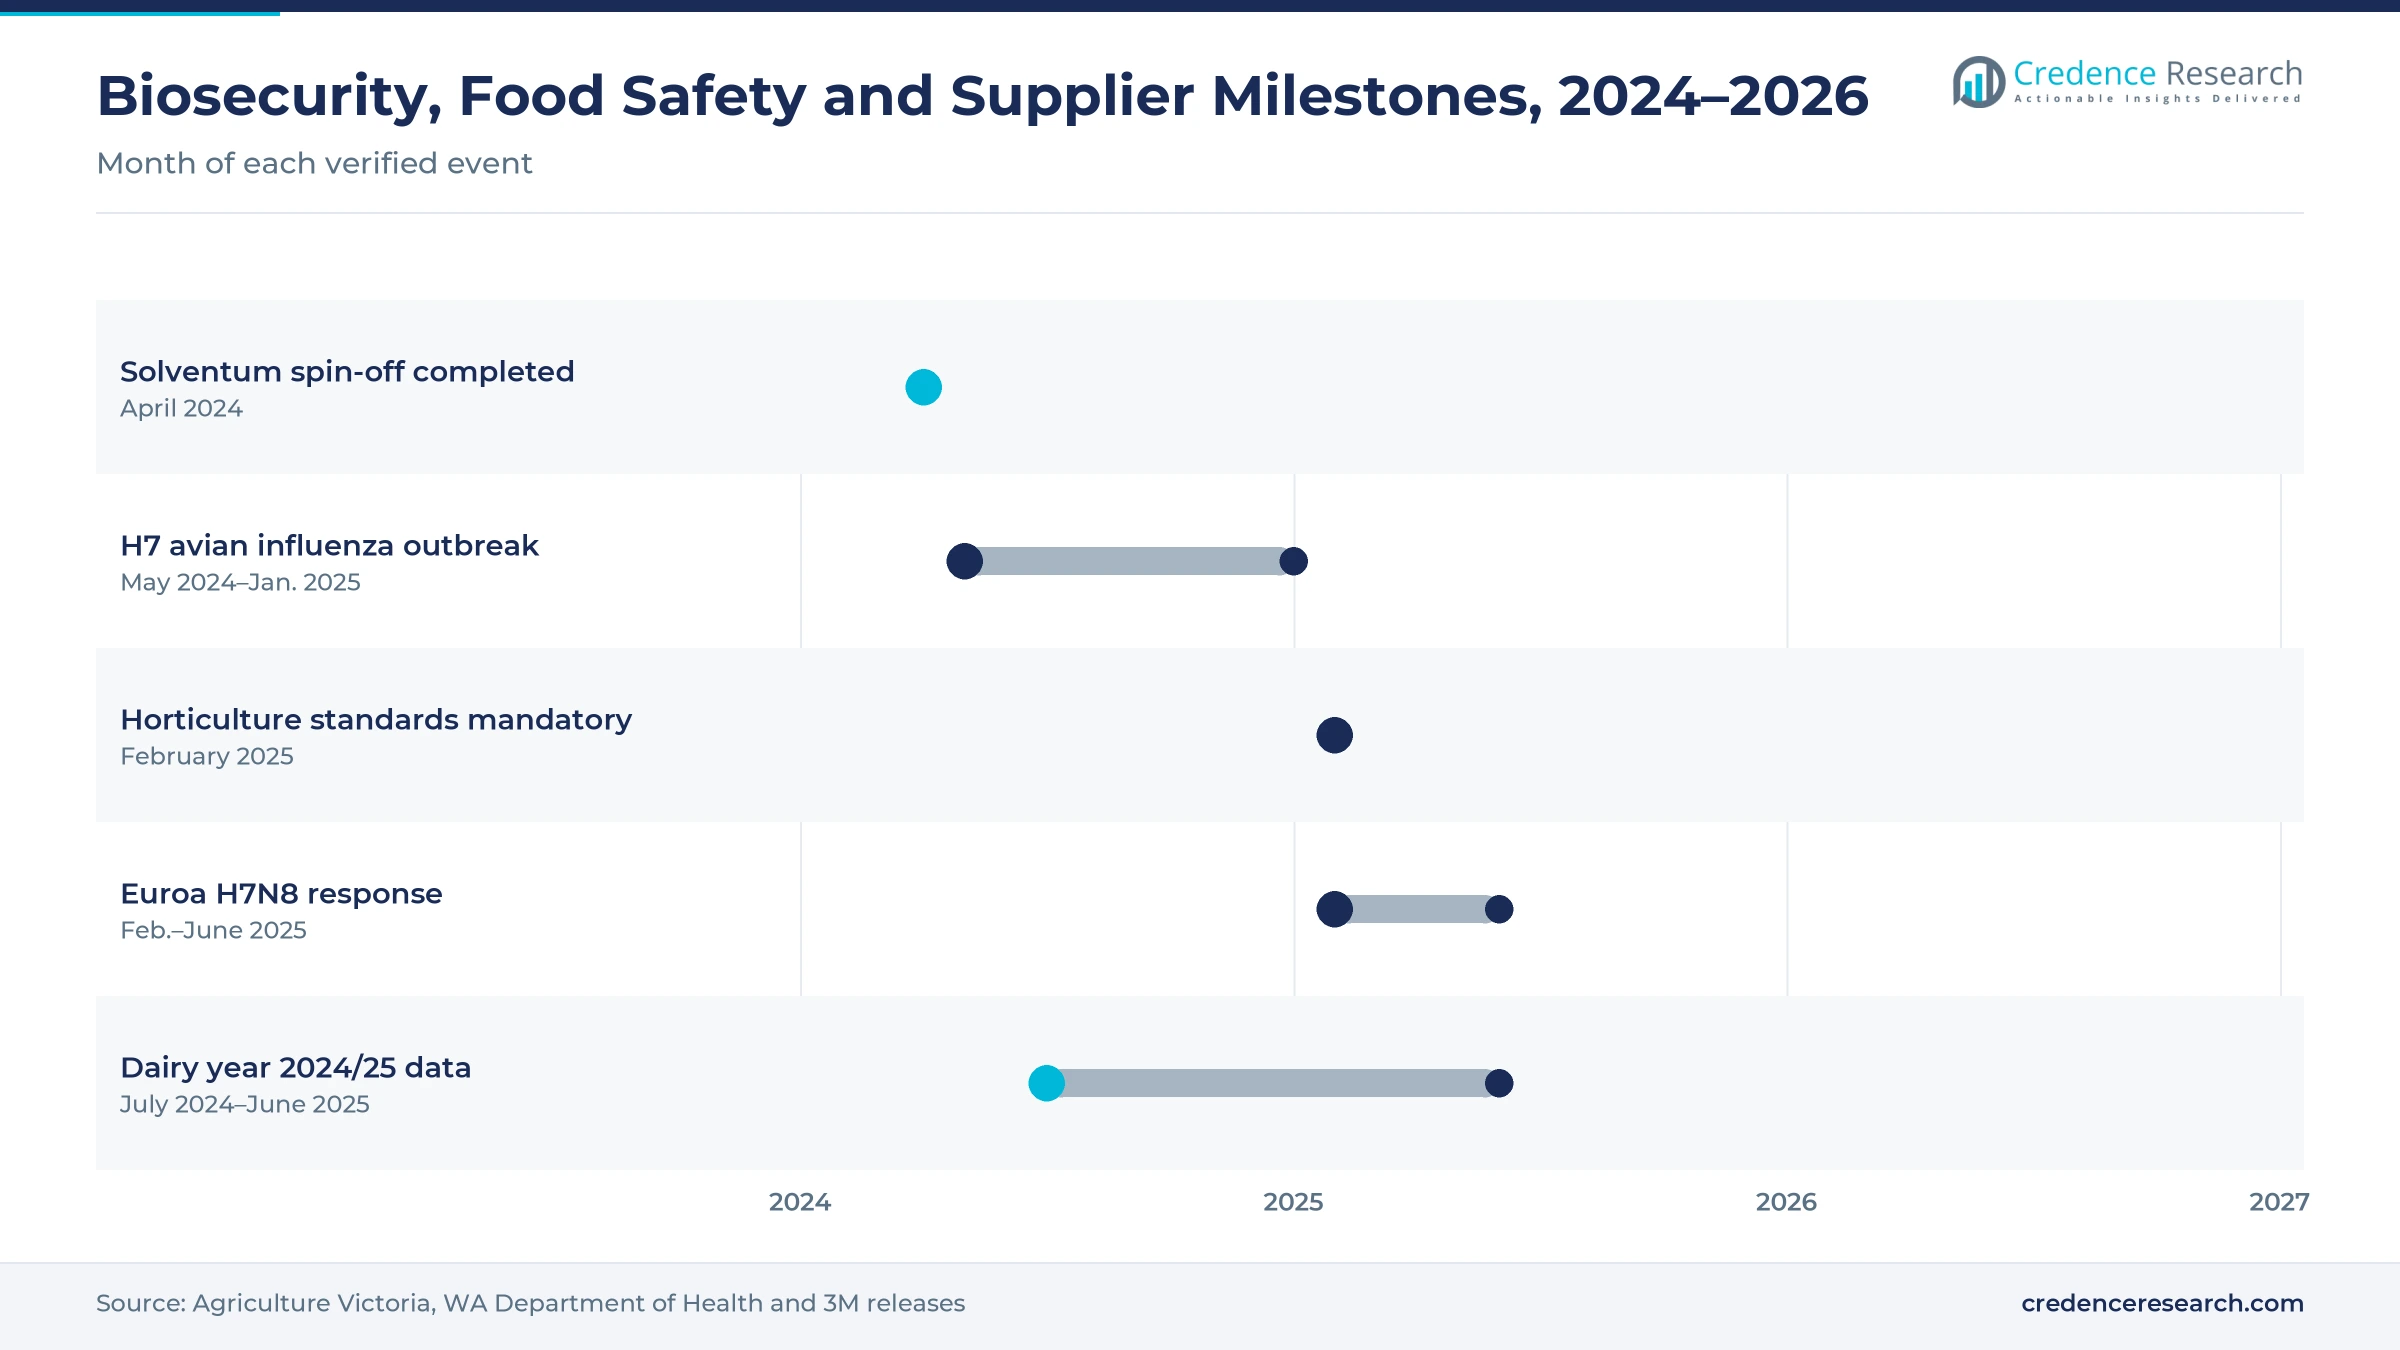
Animal disease responses raise disinfection demand, because outbreaks require farms, vehicles and equipment to be cleaned and disinfected quickly. Victoria confirmed H7 avian influenza on eight commercial poultry properties between May 22 and June 24, 2024, and tested 38,000 birds during the response. A second H7N8 outbreak near Euroa affected four commercial poultry properties in February 2025, according to Agriculture Victoria. More than 100 people were deployed to clean and disinfect sites, and Agriculture Victoria announced on June 13, 2025, that the control area had been lifted after 350 property visits. In turn, farms keep larger stocks of footbath and equipment disinfectants, and iodine products sit alongside other animal disinfectants in biosecurity plans.
Slow-release wound care and biosecurity reshape demand
How is the shift to slow-release wound products changing use?
The shift to slow-release wound products is changing use, because clinicians want iodine that works longer with less tissue irritation. Smith & Nephew Iodosorb dressings, sold in Australia in 5 g, 10 g and 17 g sizes, release iodine gradually as the cadexomer swells in wound fluid. Orion Laboratories, trading as Evaris Pharma, also sponsors a povidone-iodine 100 mg/g antiseptic ointment listed for 2024-25. Its Riodine 10% solution, introduced as a ready-to-use product, is sold in hospitals and medical practices without dilution. As a result, wound care keeps human antisepsis at 41.0% of 2025 value, while older patients with chronic wounds add steady demand for dressings, ointments and solutions.
Why is the rise of horticulture hygiene rules notable?
The rise of horticulture hygiene rules is notable, because growers of fresh produce now face national standards on washing and sanitation. Regulators introduced standards for berries, leafy vegetables and melons, gazetted on Aug. 12, 2022, after the food standards board approved them on June 8, 2022. Growers then had a 30-month transition, with implementation required by February 2025. The standards for leafy vegetables and melons cover washing and sanitation of harvested produce, while all three cover premises and equipment. In turn, growers and packing sheds buy more sanitizers for wash lines, bins and tools, which supports equipment and surface sanitation demand outside traditional food factories.
Can aquaculture biosecurity open new demand?
Aquaculture biosecurity can open new demand, because fish and shellfish farms disinfect eggs, nets, tanks and boats to stop disease. Australian aquaculture production had a real gross value of about A$2.31 billion in 2024-25, according to federal fisheries data. Aquaculture made up as much as 58% of the gross value of the wider fisheries and aquaculture sector, estimated at close to A$4 billion. More than 40 species are farmed commercially, led by salmonids, tuna, oysters, prawns and barramundi. As a result, aquaculture grows fastest among end uses at 5.08% a year, and hatcheries offer suppliers a new opening for iodine disinfectants.
Is there room to grow with private hospital surgery?
Suppliers have room to grow with private hospital surgery, because every operation needs skin preparation and many need wound care afterward. Australian hospitals recorded 3.1 million hospitalizations involving surgery in 2024-25, or 24% of all hospitalizations, according to the Australian Institute of Health and Welfare. Private hospitals handled 58% of those surgical hospitalizations, and surgery made up 35% of private hospital activity. Solventum also became an independent health care company on April 1, 2024, after 3M completed the spin-off of its health care business, as 3M announced that day. In turn, suppliers that serve private hospital groups through direct contracts can win steady antiseptic volumes as surgery numbers grow.
Rival actives, skin sensitivity and price pressure weigh
How do rival antiseptics limit iodine use?
Rival antiseptics limit iodine use, because many hospitals prefer chlorhexidine and alcohol products for routine skin preparation. As a result, povidone-iodine often becomes the choice for patients with chlorhexidine allergy, mucous membranes or specific wound types. Suppliers respond with clinical guidance, combination products and wound care ranges, which help keep iodine on hospital formularies and in theater packs. Hospitals still keep iodine products on hand for surgery, wound care and patients who cannot use other agents.
Why do skin sensitivity and staining slow adoption?
Skin sensitivity and staining slow adoption, because some patients, farmers and workers react to iodine and many users dislike brown stains on skin and surfaces. In turn, buyers sometimes switch to colorless products for routine tasks. Suppliers respond with lower-iodine and emollient formulas, which reduce irritation on teats and skin while keeping the broad germ-killing action that users value. Clear labeling and training also help users apply the right amount each time.
How does price pressure squeeze suppliers?
Price pressure squeezes suppliers, because hospital networks, food plants and large dairy farms buy under contracts that reward the lowest delivered cost. As a result, smaller blenders find it hard to compete with global hygiene companies on price and service. Suppliers respond with bulk packs, local blending and service programs, which help them hold contracts on total value rather than price per liter alone. Contract renewals every few years keep this pressure in place for most suppliers.
Why does import dependence create supply risk?
Import dependence creates supply risk, because Australia relies on overseas iodine and polymer supply for most iodophor production. In turn, freight delays or raw material price swings can raise costs for local blenders and medicine sponsors. Buyers respond with longer contracts, multiple approved products and buffer stock, which keep hospitals and farms supplied when shipments arrive late or demand rises during disease outbreaks. Local blending of imported concentrates also shortens lead times for farms and food plants.
New South Wales and Queensland lead national demand
| Region | Value, 2025 (USD million) | Share, 2025 | CAGR, 2026–2035 |
|---|---|---|---|
| New South Wales and Queensland | 4.9 | 64.9% | 4.08% |
| Victoria | 2.3 | 29.9% | 4.38% |
| Remaining States and Territories | 0.4 | 5.2% | 4.78% |
Why do New South Wales and Queensland hold the top share?
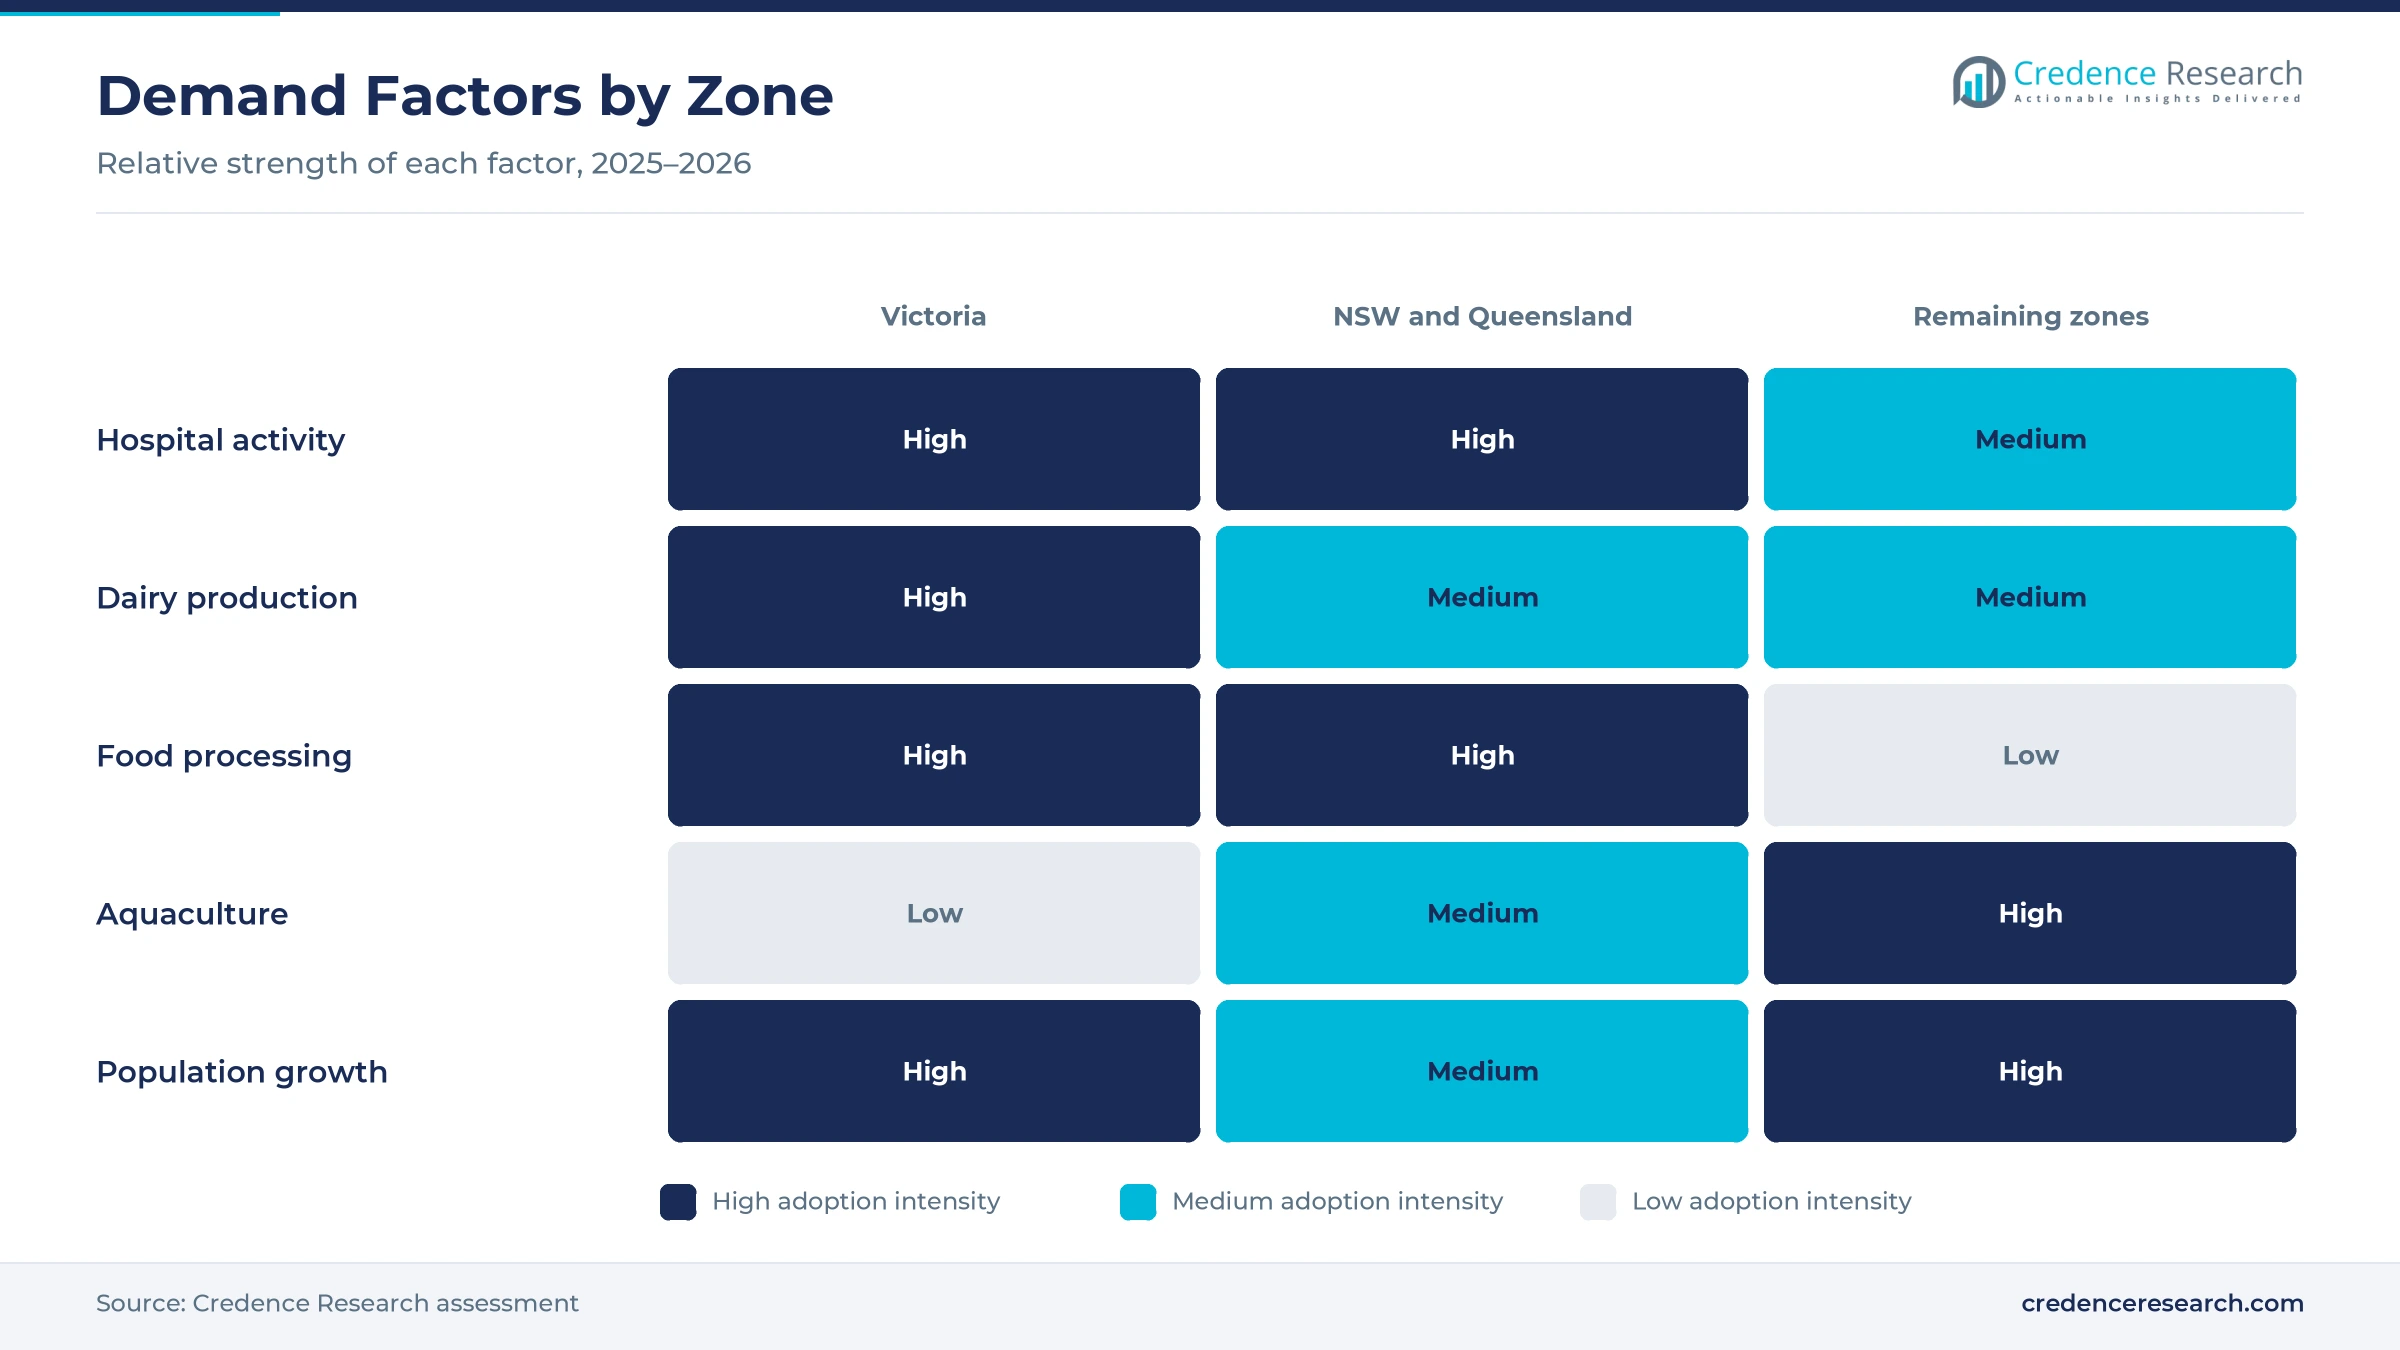
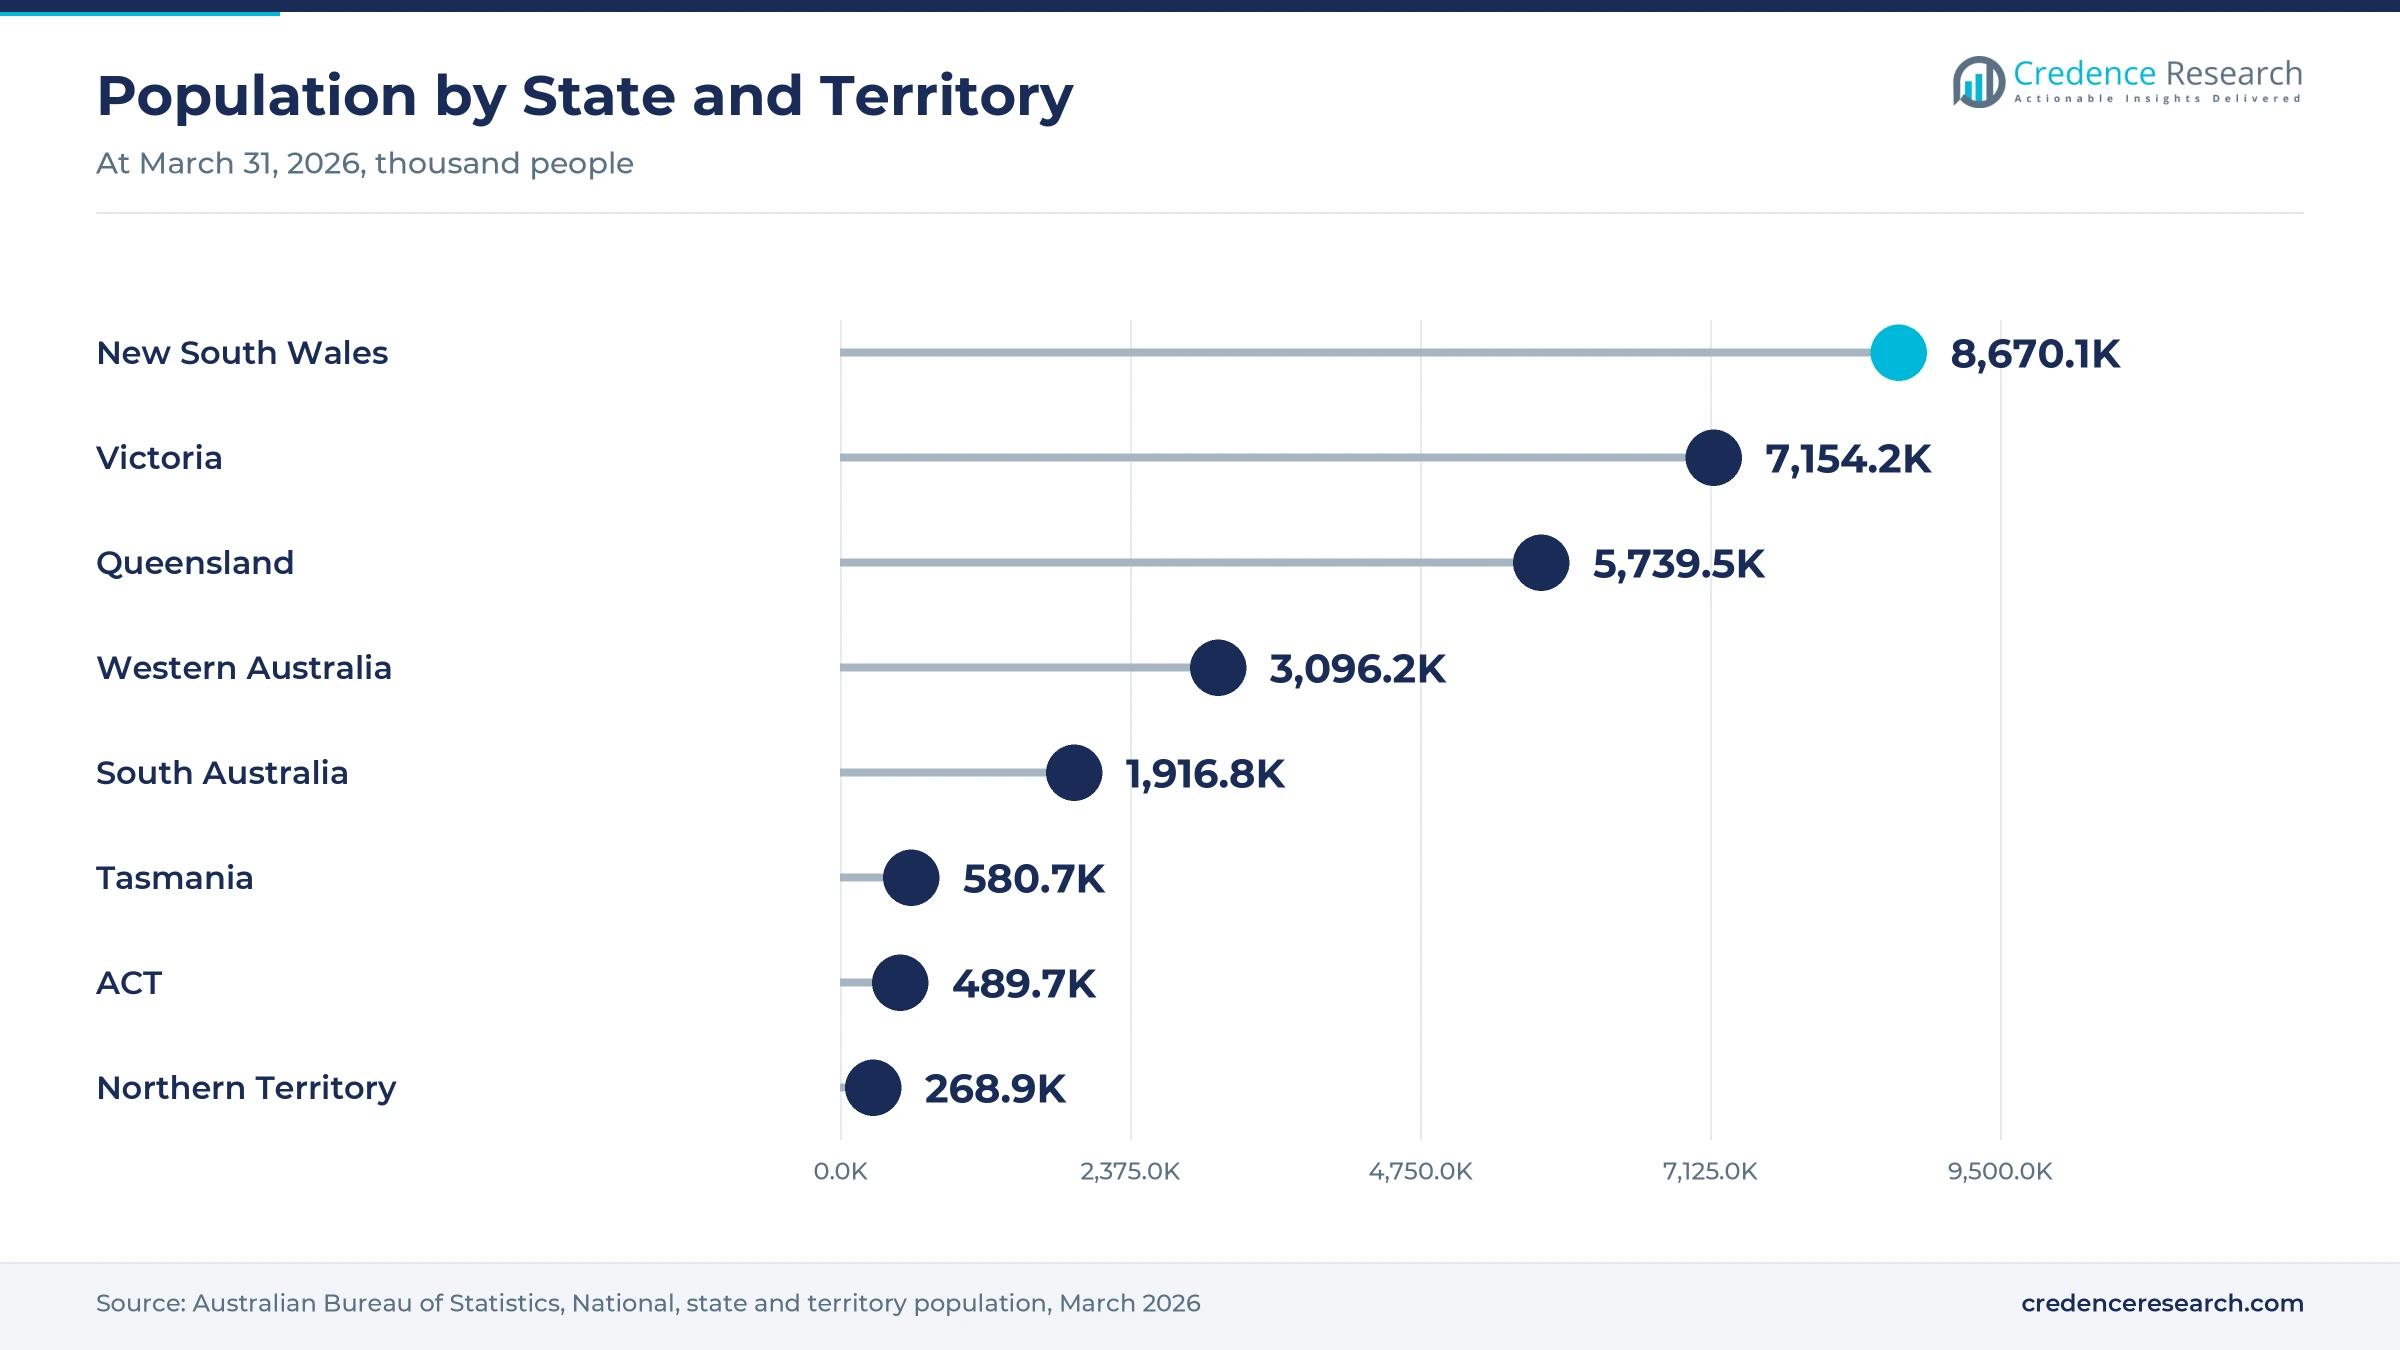
New South Wales and Queensland held a 64.9% share of 2025 value and grow at 4.08% a year, because the two states had 14.41 million people in March 2026. That base supports the largest networks of hospitals, private surgical centers and food processing plants in the country. Queensland also grew 1.6% in the year to March 2026, which adds steady hospital and pharmacy demand. As a result, the zone leads human antisepsis and equipment sanitation spending.
How does Victoria support iodophor demand?
Victoria held a 29.9% share of 2025 value and grows at 4.38% a year, because the state combines a large hospital network with the center of Australian dairying. Victorian farms produced 63.3% of national milk in 2024/25, which makes the state the main buyer of teat dips and parlor sanitizers. Victoria also launched two avian influenza responses in 2024 and 2025, which raised farm disinfection activity.
Why are the remaining states and territories growing fastest?
Remaining States and Territories held a 5.2% share of 2025 value and grow fastest at 4.78% a year, because Western Australia had the fastest population growth of any state, at 2.1%, in the year to March 2026. The zone also includes Tasmania, which produced 10.8% of national milk in 2024/25 and hosts a large salmon farming industry. As a result, dairy, aquaculture and hospital demand rise together across the zone.
Biosecurity, food safety and supplier milestones, 2024–2026
| Development | Status and market relevance |
|---|---|
| In April 2024, Solventum became an independent health care company after 3M completed the spin-off of its health care business. | Separates a major infection prevention supplier |
| In May 2024, Victoria confirmed H7 avian influenza on commercial poultry farms, with eight infected properties by June 24, 2024. | Outbreak declared over on Jan. 14, 2025 |
| In February 2025, a new H7N8 avian influenza outbreak near Euroa affected four commercial poultry properties in Victoria. | Control area lifted on June 13, 2025 |
| In February 2025, national food safety standards for berries, leafy vegetables and melons became mandatory for growers. | Adds washing and sanitation duties |
Povidone and surfactant complexes set product performance
- Povidone-iodine complexes bind iodine to a water-soluble polymer, which gives hospital solutions, ointments and scrubs steady germ-killing action with less irritation than free iodine. These complexes remain a standard choice for surgical skin preparation in Australian hospitals.
- Surfactant-iodine complexes combine iodine with detergents, which lets teat dips and food plant sanitizers clean and disinfect in one step. Dairy farms and food plants value this because it saves time at each milking or cleaning cycle.
- Alternative polymer-iodine complexes such as cadexomer iodine release iodine as the carrier swells in wound fluid, which suits slow-release dressings for chronic wounds.
Need a Custom Version of This Report?
Tailor the scope, geography, or segments to your exact requirements.
- Custom geography or segment scope
- Direct access to our analyst team
Antiseptic sponsors and hygiene suppliers compete on range
Competition combines medicine sponsors that supply hospitals and pharmacies with hygiene and dairy equipment companies that supply farms and food plants. iNova Pharmaceuticals sponsors Betadine Antiseptic Topical Solution, a povidone-iodine 100 mg/mL product, while Orion Laboratories, trading as Evaris Pharma, sponsors a povidone-iodine antiseptic ointment and the Riodine 10% solution. Smith & Nephew supplies Iodosorb cadexomer iodine dressings in several sizes through Australian medical distributors. Rivals compete on product registration, clinical evidence, range breadth, reliable supply and price. Because hospital networks and large farms buy under contracts, suppliers with full ranges and local stock win more volume. Distributors and rural merchandise stores also help brands reach small clinics and family dairy farms.
Which companies supply Australian buyers?
| Company | Type | Role in the market |
|---|---|---|
| iNova Pharmaceuticals | Medicine sponsor | Betadine povidone-iodine antiseptic solution |
| Orion Laboratories Pty Ltd T/A Evaris Pharma | Medicine sponsor | Riodine solution and povidone-iodine ointment |
| Smith & Nephew Pty Ltd | Wound care supplier | Iodosorb cadexomer iodine dressings |
Credence Research view on iodine antiseptic demand
Credence Research's view is that the Australia iodophors market will grow steadily because hospital antisepsis, milking hygiene and food sanitation all create repeat use every day. Healthcare remains the largest value pool, while aquaculture and horticulture add the fastest growth as biosecurity and food safety rules widen. Animal disease outbreaks will keep farm disinfection a priority for producers in every state. Suppliers with registered products, broad ranges and reliable local stock should gain the most, while rival antiseptics and price pressure limit margins.
How the national iodine disinfectant estimate was built
The report uses 2025 as the base year on a calendar basis, and market values come from the Credence Research model. That model combines population statistics, hospital activity data, dairy production statistics, aquaculture statistics, food safety rules, animal disease response records and medicine registration listings. Segment splits and zone growth rates are Credence Research estimates, while zone shares follow the client-defined split. Sources used are official statistics, government publications, industry body data and supplier listings, and no interviews or surveys were used.
Biosecurity and food safety carry growth to 2035
The Australia iodophors market is expected to reach USD 19.9 million by 2035, a 4.21% CAGR during 2026–2035, as hospitals, farms and food businesses keep disinfecting skin, animals and equipment. Growth should be strongest in aquaculture, horticulture and foaming products, because biosecurity and food safety rules reach more producers. Hospital surgery numbers will keep healthcare the largest end use. Further disease outbreaks would lift farm demand quickly, while wider use of rival antiseptics could slow growth in hospitals.
Frequently Asked Questions
How big is the Australia iodophors market?
Which end-use industry leads Australian iodophor value?
Which region leads the Australian market?
How much milk do Australian dairy farms produce?
Which food safety rules affect sanitizer demand?
Which product type is growing faster?
Who are the leading companies in the Australian market?
What are the main challenges for suppliers?
Table of Content
Chapter 1 Market Segmentation
- 1.1 Segmentation Framework
- 1.1.1 Product and Service Classification
- 1.1.2 Application and End-Use Classification
- 1.1.3 Technology and Solution Classification
- 1.1.4 Customer and Distribution Channel Classification
- 1.1.5 Geographic Segmentation
- 1.1.6 Market Segment Definitions and Boundaries
- 1.2 By Product Type
- 1.2.1 Non-Foaming Iodophor
- 1.2.2 Foaming Iodophor
- 1.3 By End-Use Industry
- 1.3.1 Healthcare
- 1.3.2 Dairy and Veterinary
- 1.3.3 Food and Beverage Processing
- 1.3.4 Aquaculture
- 1.3.5 Facility Sanitation
- 1.4 By Application
- 1.4.1 Human Antisepsis
- 1.4.2 Animal Hygiene
- 1.4.3 Equipment and Surface Sanitation
- 1.4.4 Aquaculture Biosecurity
- 1.5 By Sales Channel
- 1.5.1 Direct Enterprise Sales
- 1.5.2 Specialist Distribution
- 1.5.3 Consumer Retail
Chapter 2 Introduction
- 2.1 Report Objectives and Scope
- 2.2 Product Definition and Industry Terminology
- 2.3 Market Inclusions and Exclusions
- 2.4 Research Process
- 2.4.1 Primary Research and Expert Interviews
- 2.4.2 Secondary Research and Source Review
- 2.4.3 Top-Down and Bottom-Up Estimation
- 2.4.4 Data Triangulation and Verification
- 2.5 Market Size Measurement Basis
- 2.5.1 2025: USD 7.6 million → 2035: USD 19.9 million
- 2.6 Historical and Forecast Reference Periods
- 2.6.1 Historical Period: 2018-2025
- 2.6.2 Base Year: 2025
- 2.6.3 Forecast Period: 2025-2035
- 2.7 Research Assumptions and Limitations
Chapter 3 Executive Summary
- 3.1 Market Snapshot and Key Findings
- 3.2 Base-Year Market Size, 2025
- 3.3 Forecast Market Size, 2035
- 3.4 Revenue and Volume Growth Outlook
- 3.5 Key Demand and Supply Indicators
- 3.6 Leading Market Segments
- 3.7 Fastest-Growing Market Opportunities
- 3.8 Regional Performance Highlights
- 3.9 Technology and Industry Transformation
- 3.10 Competitive Landscape Summary
- 3.11 Analyst View and Strategic Implications
Chapter 4 Australia Iodophors Market Trends and Developments
- 4.1 Historical Industry Development, 2018-2025
- 4.2 Recent Market Trends and Developments
- 4.3 Demand and Customer Behavior Trends
- 4.4 Technology and Product Innovation
- 4.5 Artificial Intelligence, Automation and Digitalization
- 4.6 Local Manufacturing and Supply Chain Realignment
- 4.7 Industry Partnerships, Mergers and Acquisitions
- 4.8 Sustainability and Circular Economy Developments
- 4.9 Government and Private Sector Investment Trends
- 4.10 Emerging Business Models and Commercialization
- 4.11 Industry Developments and Announcements
Chapter 5 Australia Iodophors Market Production, Supply and Demand Analysis
- 5.1 Demand Trend and Consumption Analysis, 2018-2025
- 5.2 Demand Forecast, 2025-2035
- 5.3 Production and Output Trend, 2018-2025
- 5.4 Production and Output Forecast, 2025-2035
- 5.5 Installed Capacity and Capacity Utilization
- 5.6 Company-Wise Production Plants and Statistics
- 5.6.1 Installed Production Capacity
- 5.6.2 Actual Production
- 5.6.3 Planned Capacity and Expansion Targets
- 5.7 Supply Chain Structure and Procurement Trends
- 5.8 Supply-Demand Gap and Bottlenecks
- 5.9 Import Dependence and Sourcing Structure
- 5.10 Contract Manufacturing and Outsourcing
- 5.11 Regional Supply and Demand Concentration
Chapter 6 Australia Iodophors Market Pricing Analysis
- 6.1 Pricing Structure and Measurement
- 6.2 Historical Pricing Trends, 2018-2025
- 6.3 Pricing Outlook, 2025-2035
- 6.4 Average Selling Price and Unit Economics
- 6.5 Pricing by Product and Market Segment
- 6.6 Geographic Pricing Differences
- 6.7 Key Input, Energy, Labor and Logistics Costs
- 6.8 Contract Pricing and Purchasing Models
- 6.9 Pricing Sensitivity and Competitive Positioning
- 6.10 Price, Margin and Profitability Implications
Chapter 7 Australia Iodophors Market Dynamics
- 7.1 Market Growth Drivers
- 7.1.1 Demand-Side Drivers
- 7.1.2 Technology and Innovation Drivers
- 7.1.3 Infrastructure and Investment Drivers
- 7.1.4 Regulatory and Policy Drivers
- 7.2 Market Restraints
- 7.2.1 Cost and Affordability Constraints
- 7.2.2 Technology and Adoption Barriers
- 7.2.3 Supply Chain and Operational Constraints
- 7.3 Market Challenges
- 7.3.1 Competitive Pressure and Margin Erosion
- 7.3.2 Skills, Infrastructure and Implementation Gaps
- 7.4 Emerging Market Opportunities
- 7.5 Market Dynamics Impact and Time-Horizon Assessment
Chapter 8 Australia Iodophors Value Chain Analysis
- 8.1 Industry Value Chain Overview
- 8.2 Upstream Suppliers and Critical Inputs
- 8.3 Technology and Component Providers
- 8.4 Manufacturing or Service Delivery
- 8.5 Distribution, Channel Partners and Integrators
- 8.6 Downstream Applications and End Users
- 8.7 Value Addition and Profit Pools
- 8.8 Vertical Integration and Outsourcing
- 8.9 Supplier Concentration and Risk
- 8.10 Supply Chain Localization and Resilience
Chapter 9 Australia Iodophors Market Regulations and Policies
- 9.1 Relevant Laws, Standards and Compliance Frameworks
- 9.2 Product, Service, Safety and Quality Requirements
- 9.3 Government Policies, Incentives and Subsidies
- 9.4 Imports, Exports and Trade Barriers
- 9.5 Public Procurement and Local Content Requirements
- 9.6 Environmental and Sustainability Compliance
- 9.7 Upcoming Policy Changes and Market Implications
Chapter 10 Australia Iodophors Market Hotspots and Opportunities
- 10.1 Market Opportunity Mapping and Growth Hotspots
- 10.2 High-Growth Applications and Customer Groups
- 10.3 Underserved Markets and White-Space Opportunities
- 10.4 Emerging Technology and Product Opportunities
- 10.5 New Capacity and Investment Hotspots
- 10.6 Market Entry and Expansion Opportunities
- 10.7 Distribution and Partnership Opportunities
- 10.8 Near-Term and Long-Term Commercial Potential
- 10.9 Opportunity Attractiveness and Execution Risks
Chapter 11 Australia Iodophors Market Outlook, 2025-2035
- 11.1 Market Size and Analysis
- 11.1.1 Revenue (Market Measurement: 2025: USD 7.6 million → 2035: USD 19.9 million)
- 11.1.2 Market Volume and Quantity Sold
- 11.1.3 Historical Market Size, 2018-2025
- 11.1.4 Base-Year Market Size, 2025
- 11.2 Market Forecast, 2025-2035
- 11.2.1 Revenue Forecast to 2035
- 11.2.2 Volume Forecast to 2035
- 11.2.3 CAGR and Year-on-Year Growth
- 11.2.4 Incremental Revenue Opportunity
- 11.3 Forecast Assumptions and Scenario Analysis
- 11.3.1 Base-Case Forecast
- 11.3.2 Optimistic and Conservative Scenarios
- 11.3.3 Technology, Pricing and Policy Sensitivities
- 11.4 Market Attractiveness and Growth Outlook
Chapter 12 Australia Iodophors Market Segmentation and Outlook
- 12.1 Segmentation Summary and Market Shares, 2025
- 12.2 Largest and Fastest-Growing Segments
- 12.3 By Product Type - Market Size and Forecast, 2025-2035
- 12.3.1 Segment Definition and Scope
- 12.3.2 Historical Market Size, 2018-2025
- 12.3.3 Revenue Forecast, 2025-2035
- 12.3.4 Volume Forecast, 2025-2035
- 12.3.5 Base-Year Market Share, 2025
- 12.3.6 Segment CAGR and Growth Drivers
- 12.3.7 Subsegment Market Size and Forecast
- 12.3.7.1 Non-Foaming Iodophor
- 12.3.7.2 Foaming Iodophor
- 12.3.8 Subsegment Pricing and Adoption Trends
- 12.3.9 Leading Suppliers and Competition
- 12.3.10 Regional Demand and Opportunities
- 12.4 By End-Use Industry - Market Size and Forecast, 2025-2035
- 12.4.1 Segment Definition and Scope
- 12.4.2 Historical Market Size, 2018-2025
- 12.4.3 Revenue Forecast, 2025-2035
- 12.4.4 Volume Forecast, 2025-2035
- 12.4.5 Base-Year Market Share, 2025
- 12.4.6 Segment CAGR and Growth Drivers
- 12.4.7 Subsegment Market Size and Forecast
- 12.4.7.1 Healthcare
- 12.4.7.2 Dairy and Veterinary
- 12.4.7.3 Food and Beverage Processing
- 12.4.7.4 Aquaculture
- 12.4.7.5 Facility Sanitation
- 12.4.8 Subsegment Pricing and Adoption Trends
- 12.4.9 Leading Suppliers and Competition
- 12.4.10 Regional Demand and Opportunities
- 12.5 By Application - Market Size and Forecast, 2025-2035
- 12.5.1 Segment Definition and Scope
- 12.5.2 Historical Market Size, 2018-2025
- 12.5.3 Revenue Forecast, 2025-2035
- 12.5.4 Volume Forecast, 2025-2035
- 12.5.5 Base-Year Market Share, 2025
- 12.5.6 Segment CAGR and Growth Drivers
- 12.5.7 Subsegment Market Size and Forecast
- 12.5.7.1 Human Antisepsis
- 12.5.7.2 Animal Hygiene
- 12.5.7.3 Equipment and Surface Sanitation
- 12.5.7.4 Aquaculture Biosecurity
- 12.5.8 Subsegment Pricing and Adoption Trends
- 12.5.9 Leading Suppliers and Competition
- 12.5.10 Regional Demand and Opportunities
- 12.6 By Sales Channel - Market Size and Forecast, 2025-2035
- 12.6.1 Segment Definition and Scope
- 12.6.2 Historical Market Size, 2018-2025
- 12.6.3 Revenue Forecast, 2025-2035
- 12.6.4 Volume Forecast, 2025-2035
- 12.6.5 Base-Year Market Share, 2025
- 12.6.6 Segment CAGR and Growth Drivers
- 12.6.7 Subsegment Market Size and Forecast
- 12.6.7.1 Direct Enterprise Sales
- 12.6.7.2 Specialist Distribution
- 12.6.7.3 Consumer Retail
- 12.6.8 Subsegment Pricing and Adoption Trends
- 12.6.9 Leading Suppliers and Competition
- 12.6.10 Regional Demand and Opportunities
- 12.7 Segment Growth Comparison
- 12.8 Segment Attractiveness and Priority Matrix
Chapter 13 Australia Iodophors End-Use and Application Market Outlook
- 13.1 End-Use Industry and Customer Demand Structure
- 13.2 Leading Applications and Customer Groups
- 13.3 End-Use Market Size, Share and Forecast
- 13.4 Major End-Use Industry Deep Dives
- 13.4.1 Customer Requirements and Use Cases
- 13.4.2 Demand and Replacement Cycles
- 13.4.3 Technical and Regulatory Considerations
- 13.4.4 Purchasing and Procurement Models
- 13.4.5 Leading Vendors and Distribution Channels
- 13.4.6 Forecast and Commercial Opportunities
- 13.5 Emerging Applications and Cross-Segment Demand
- 13.6 End-Use Industry Investment Priorities
Chapter 14 Australia Iodophors Geographic Market Outlook, 2025-2035
- 14.1 Domestic Market Distribution and Demand Clusters
- 14.2 State- or Province-Wise Market Size and Forecast, 2025-2035
- 14.3 City and Metropolitan Market Outlook
- 14.4 Industrial, Manufacturing and Commercial Clusters
- 14.5 Geographic Concentration of Key End Users
- 14.6 Local Pricing and Purchasing Differences
- 14.7 Domestic Production Facilities and Capacity Map
- 14.8 Local Infrastructure and Project Pipeline
- 14.9 State-Level Policy and Incentive Differences
- 14.10 Subnational Investment Hotspots and Opportunities
- 14.11 Distribution and Logistics Networks
- 14.12 Domestic Competitive Footprint
Chapter 15 Australia Iodophors Technology, Innovation and Sustainability Outlook
- 15.1 Technology Landscape and Maturity
- 15.2 Product, Process and Service Innovation
- 15.3 AI, Automation and Digital Tools in the Industry
- 15.4 Technology Adoption and Performance Benchmarking
- 15.5 Innovation Pipeline and R&D Investment
- 15.6 Patent and Intellectual Property Trends
- 15.7 Energy Efficiency and Resource Management
- 15.8 Sustainability, Recycling and Circularity
- 15.9 Technology Roadmap, 2025-2035
- 15.10 Risks of Obsolescence and Technology Substitution
Chapter 16 Australia Iodophors Market Key Strategic Imperatives
- 16.1 Growth and Market Entry Priorities
- 16.2 High-Return Products and Segments
- 16.3 Pricing, Profitability and Cost Optimization
- 16.4 Technology Investment and Product Differentiation
- 16.5 Supply Chain Localization and Resilience
- 16.6 Distribution and Customer Acquisition
- 16.7 Partnership, Acquisition and Capacity Strategy
- 16.8 Regional Expansion Priorities
- 16.9 Short-, Medium- and Long-Term Actions
Chapter 17 Competition Outlook
- 17.1 Industry Competition Characteristics
- 17.2 Market Structure and Concentration
- 17.3 Market Share and Competitive Positioning, 2025
- 17.4 Company-Wise Revenue and Product Benchmarking
- 17.5 Production and Service Capacity Benchmarking
- 17.6 Technology, Pricing and Differentiation
- 17.7 Regional Footprint and Distribution Strength
- 17.8 Mergers, Acquisitions and Strategic Alliances
- 17.9 New Entrants and Competitive Threats
- 17.10 Porter's Five Forces and Industry Attractiveness
- 17.11 Competitive Outlook, 2025-2035
Chapter 18 Company Profiles
- 18.1 Company Coverage and Selection Criteria
- 18.2 Ecolab Pty Ltd
- 18.2.1 Business Description
- 18.2.2 Company Ownership and Geographic Presence
- 18.2.3 Product and Service Portfolio
- 18.2.4 Manufacturing and Operating Footprint
- 18.2.5 Production Capacity and Expansion Plans
- 18.2.6 Financial Performance and Investment
- 18.2.7 Market Share and Competitive Position
- 18.2.8 Technology and Innovation Capabilities
- 18.2.9 Strategic Alliances or Partnerships
- 18.2.10 Recent Developments
- 18.2.11 Growth Strategy and Outlook
- 18.3 DeLaval Australia
- 18.4 iNova Pharmaceuticals
- 18.5 GEA Group
- 18.6 Daviesway
- 18.7 Orion Laboratories Pty Ltd T/A Evaris Pharma
- 18.8 Solventum
- 18.9 LumaCina Australia Pty Ltd
- 18.10 Pfizer Australia Pty Ltd
- 18.11 Smith & Nephew Pty Ltd
- 18.12 Other Relevant Market Participants
Note: Every listed company is profiled on the structure shown under the first company. The company list is preliminary and may change based on research findings, market developments, data availability and client requirements.
Chapter 19 Disclaimer
- 19.1 Research and Forecast Disclaimer
- 19.2 Data Source and Estimation Limitations
Note: The depth of individual sections depends on data availability for this market. Volume, capacity, trade and other unit-based metrics are included where applicable.

