
Electric panels and hydronic upgrades keep demand rising
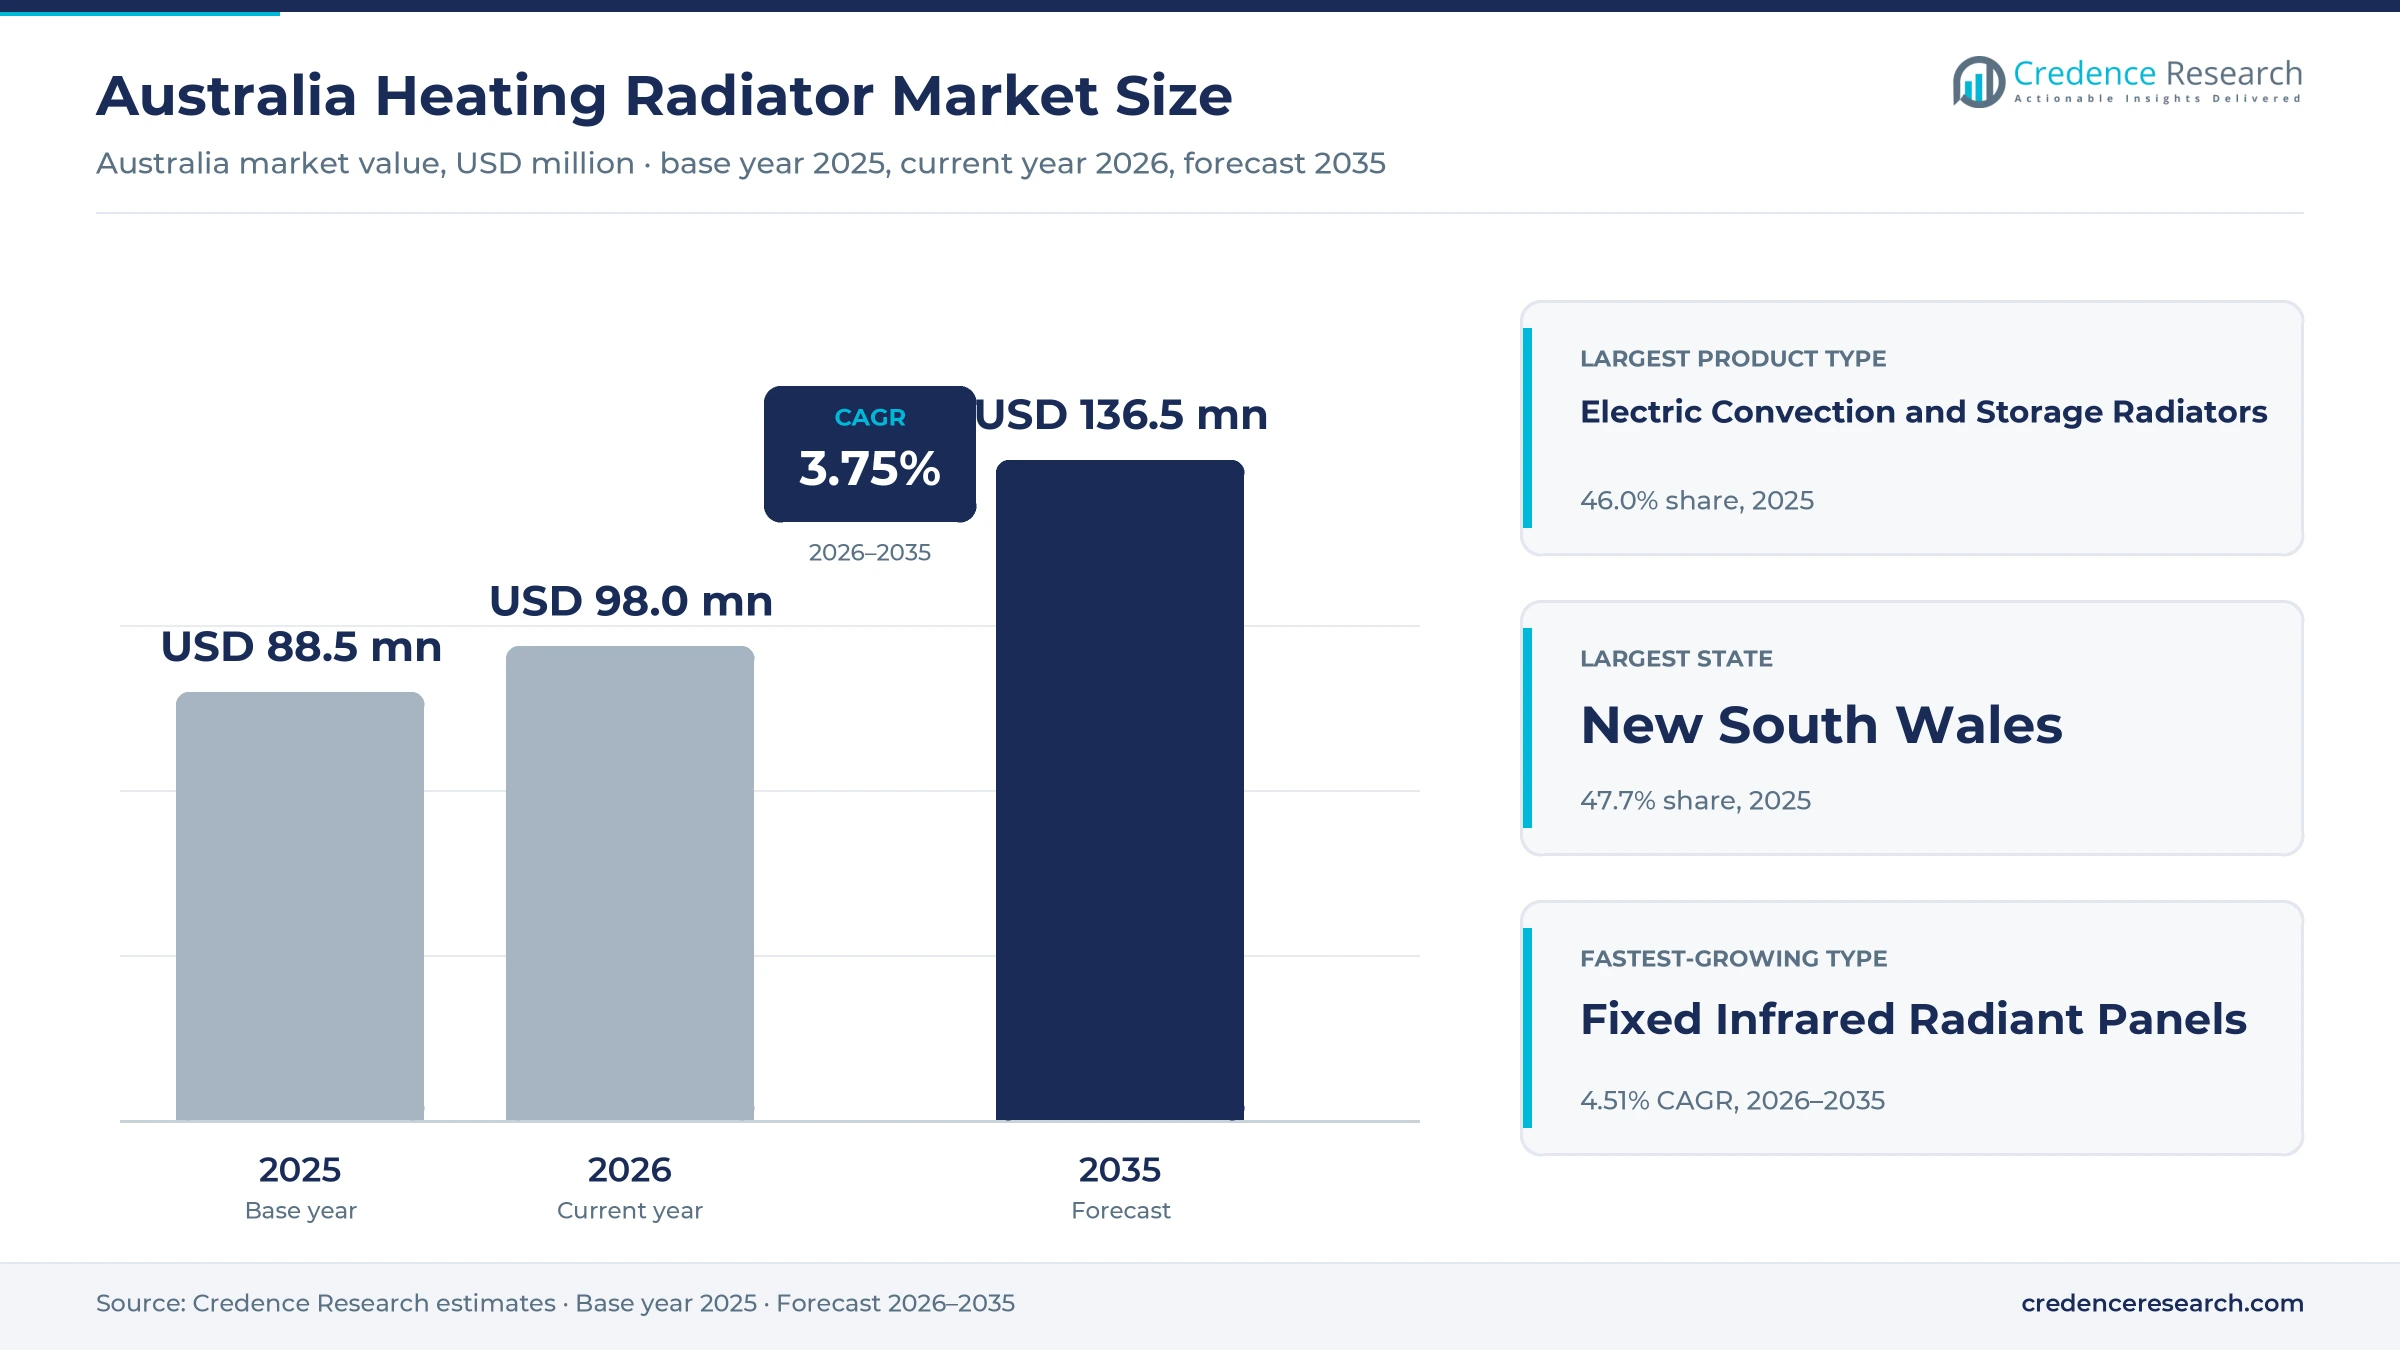
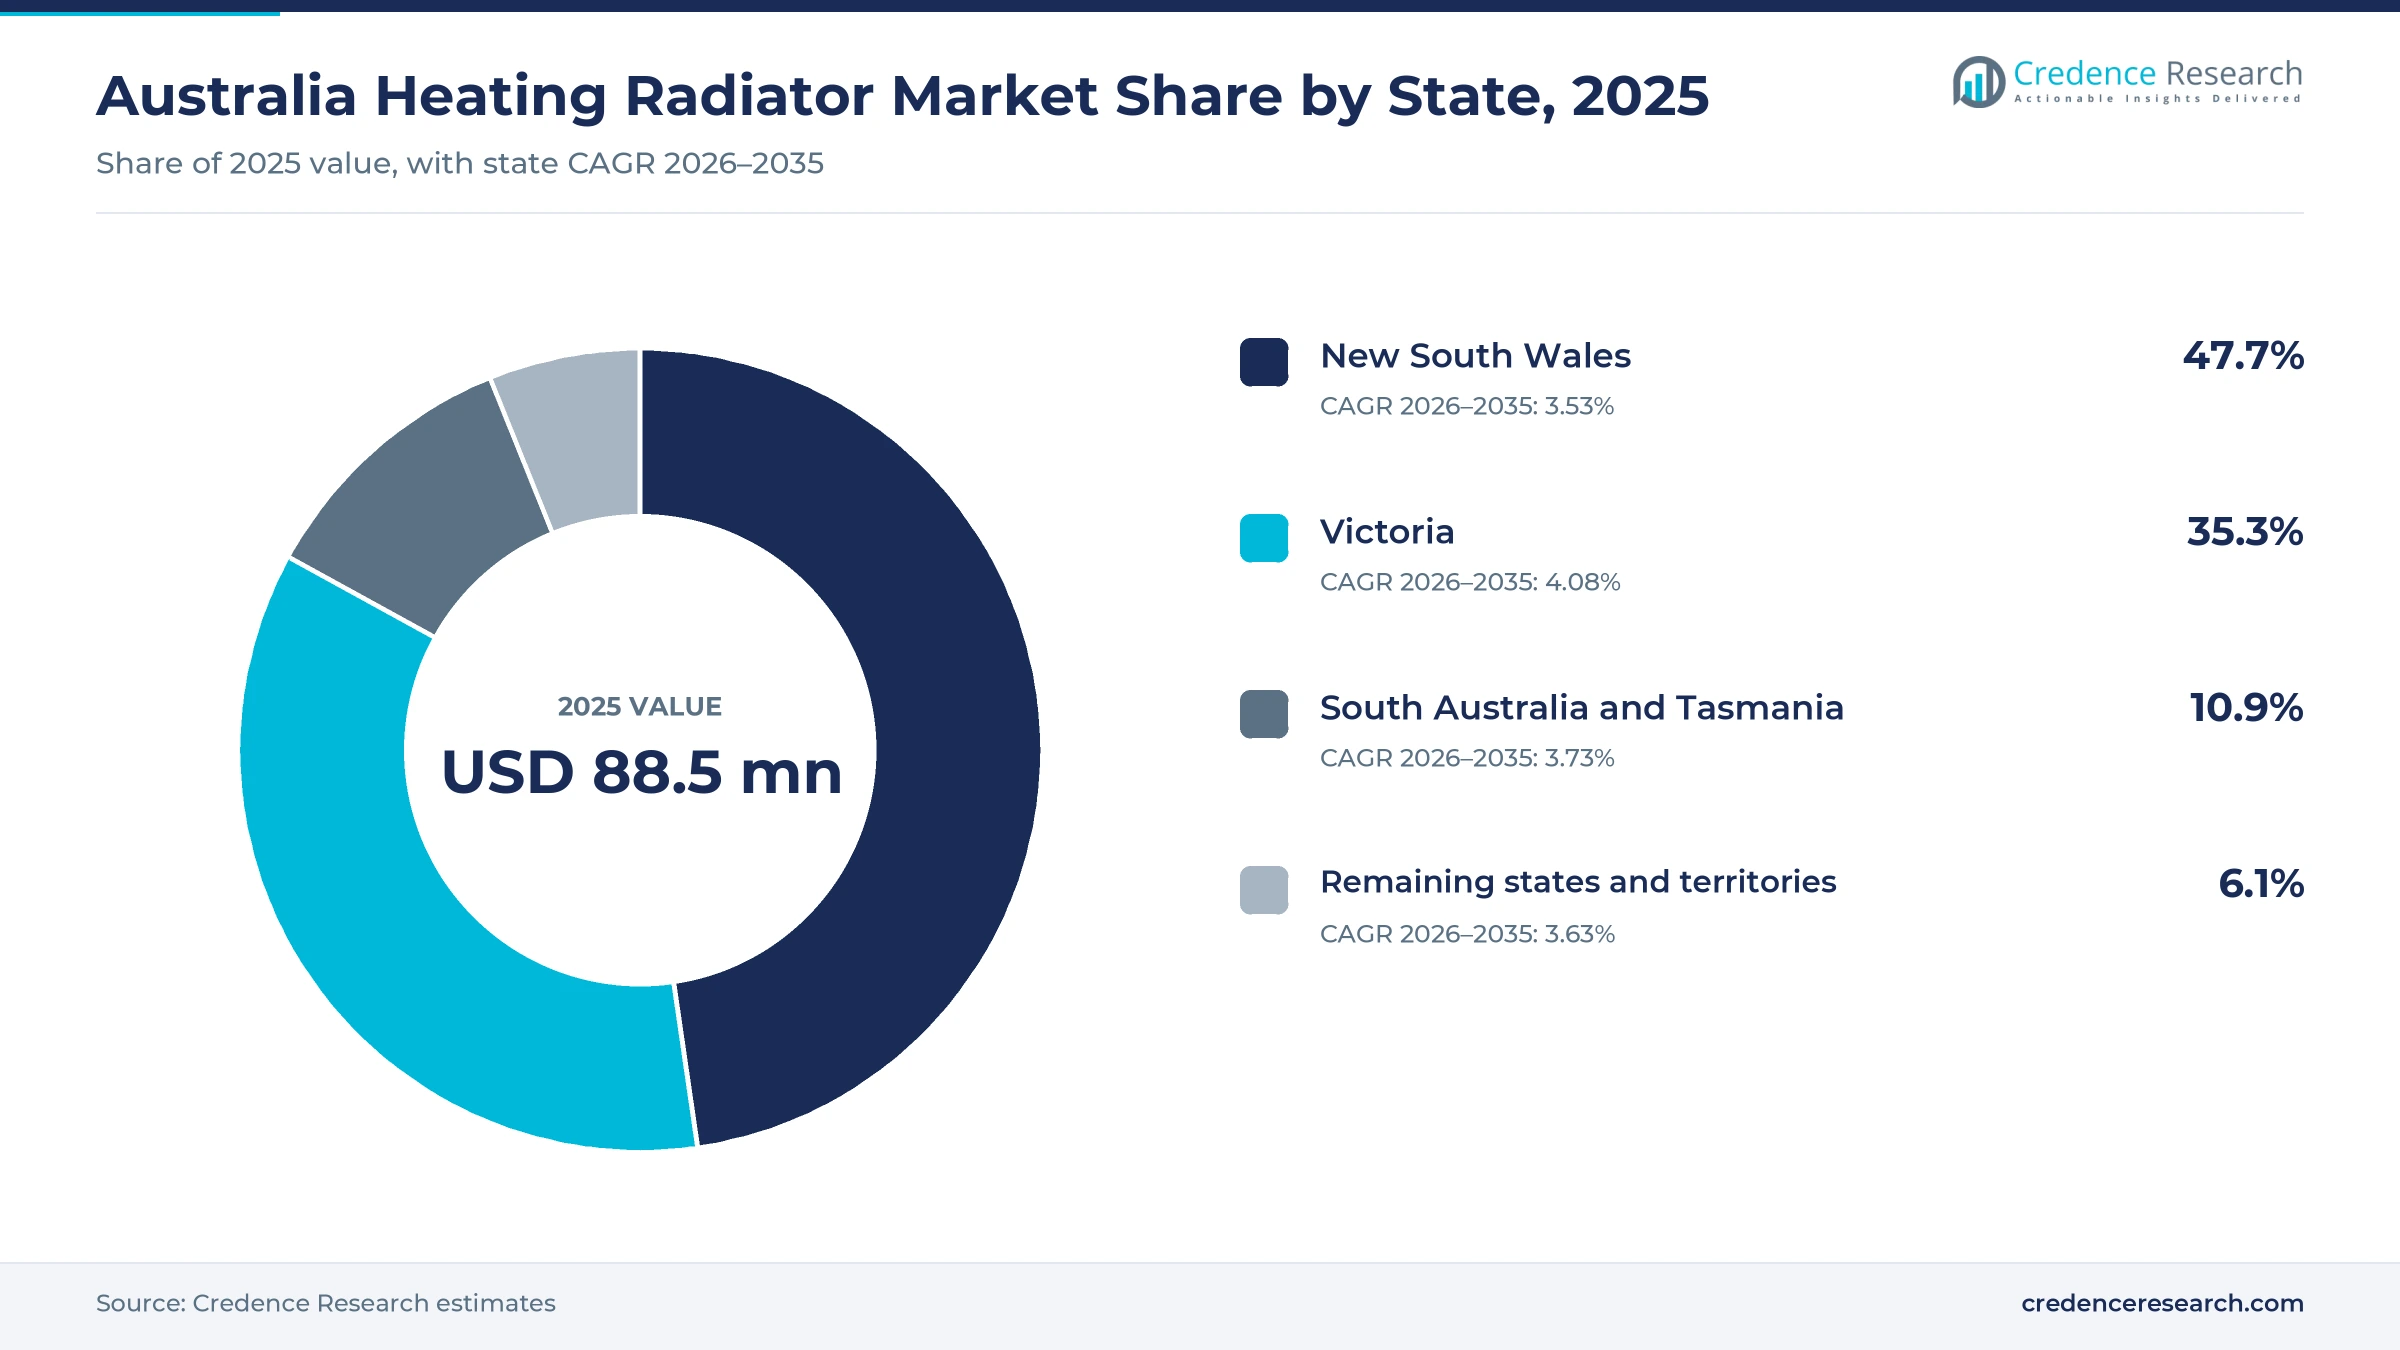
The Australia heating radiator market was valued at USD 88.5 million in 2025 and is projected to increase from USD 98.0 million in 2026 to USD 136.5 million by 2035, registering a CAGR of 3.75% during 2026–2035. Demand comes from households, builders, landlords, schools, hospitals and offices that heat living areas, bedrooms and bathrooms with electric panels, oil-filled columns, infrared panels, hydronic radiators and heated towel rails. New South Wales held the largest state share, 47.7% in 2025, because it has the largest population and a large stock of apartments and freestanding homes. Victoria is the fastest-growing state at 4.08% a year, as its cold winters and all-electric building rules move buyers away from gas heating. In turn, suppliers are adding Wi-Fi controls, electronic thermostats and heat pump-driven hydronic systems that cut running costs in new and renovated homes.
Which heating radiators are counted in Australia?
The estimate measures spending in Australia on electric convection and storage radiators, oil-filled column heaters, fixed infrared radiant panels, hydronic radiators and electric towel rail radiators. It covers primary space heating, supplementary zone heating and towel warming bought by households and by private and public organizations through appliance retailers, specialist trade suppliers and direct project contracts. Values are stated in USD million at current prices and exclude goods and services tax.
The estimate excludes reverse-cycle air conditioners, ducted gas heaters, gas space heaters, underfloor heating cables, boilers and heat pumps sold without emitters, and installation labor billed separately. The value chain runs from European and Asian brands and local towel rail makers through importers, plumbing merchants, appliance chains and hydronic installers to builders, landlords and homeowners.
Australia Heating Radiator Market Insights
- The Australia heating radiator market was valued at USD 88.5 million in 2025 and is projected to reach USD 136.5 million by 2035, at a 3.75% CAGR during 2026–2035.
- New South Wales held 47.7% of 2025 value, because the state had 8.67 million residents at March 2026, the most of any state.
- Electric convection and storage radiators led product types with 46.0% of 2025 value, because portable panels and oil-filled columns suit most rooms.
- Victoria requires all new homes to be all-electric from Jan. 1, 2027, which moves new-home heating from gas units toward electric emitters.
- Fixed infrared radiant panels grow fastest at 4.51% a year during 2026–2035, as builders fit slim ceiling and wall panels in all-electric homes.
Convection units lead while infrared panels grow fastest
Why do convection and storage radiators lead demand?
Based on product type, the market is categorized into electric convection and storage radiators, fixed infrared radiant panels, hydronic radiators and electric towel rail radiators. Electric convection and storage radiators led with 46.0% of 2025 value, because portable panels and oil-filled columns need no installer. Fixed infrared radiant panels grow fastest at 4.51% a year, as all-electric homes fit slim panels on ceilings and walls.
Which heating uses account for most spending?
Based on application, the market is categorized into primary space heating, supplementary zone heating and towel warming. Primary space heating led with 52.0% of 2025 value, because hydronic systems and fixed panels heat whole homes through long winters. Primary space heating also grows fastest at 4.01% a year, as Victorian homes replace gas central heating with electric emitters.
Which buyers purchase the most radiators?
Based on end user, the market is categorized into households, private-sector organizations and public-sector organizations. Households led with 68.0% of 2025 value, because homeowners and renters buy most portable and fixed units for bedrooms, living rooms and bathrooms across every state. Public-sector organisations grow fastest at 4.34% a year, as new schools, hospitals and public housing are built all-electric under Victorian rules that apply to new public buildings.
Appliance chains, trade counters or project orders?
Based on distribution channel, the market is categorized into appliance retail supply, specialist trade supply and direct project supply. Appliance retail supply led with 44.0% of 2025 value, because households buy panels and columns from appliance chains each winter. Direct project supply grows fastest at 4.33% a year, as builders order fixed panels and towel rails for whole projects.
| Segment Group | Leading Sub-segment | Share, 2025 | Fastest-growing Sub-segment | CAGR, 2026–2035 |
|---|---|---|---|---|
| By Product Type | Electric convection and storage radiators | 46.0% | Fixed infrared radiant panels | 4.51% |
| By Application | Primary space heating | 52.0% | Primary space heating | 4.01% |
| By End User | Households | 68.0% | Public-sector organisations | 4.34% |
| By Distribution Channel | Appliance retail supply | 44.0% | Direct project supply | 4.33% |
Request a Free Sample
Fill in your details and we'll send you a free sample report.
- Sample data tables & charts
- Research methodology
Home building, hydronics and Victorian rules lift sales
How do new home building and renovations lift demand?
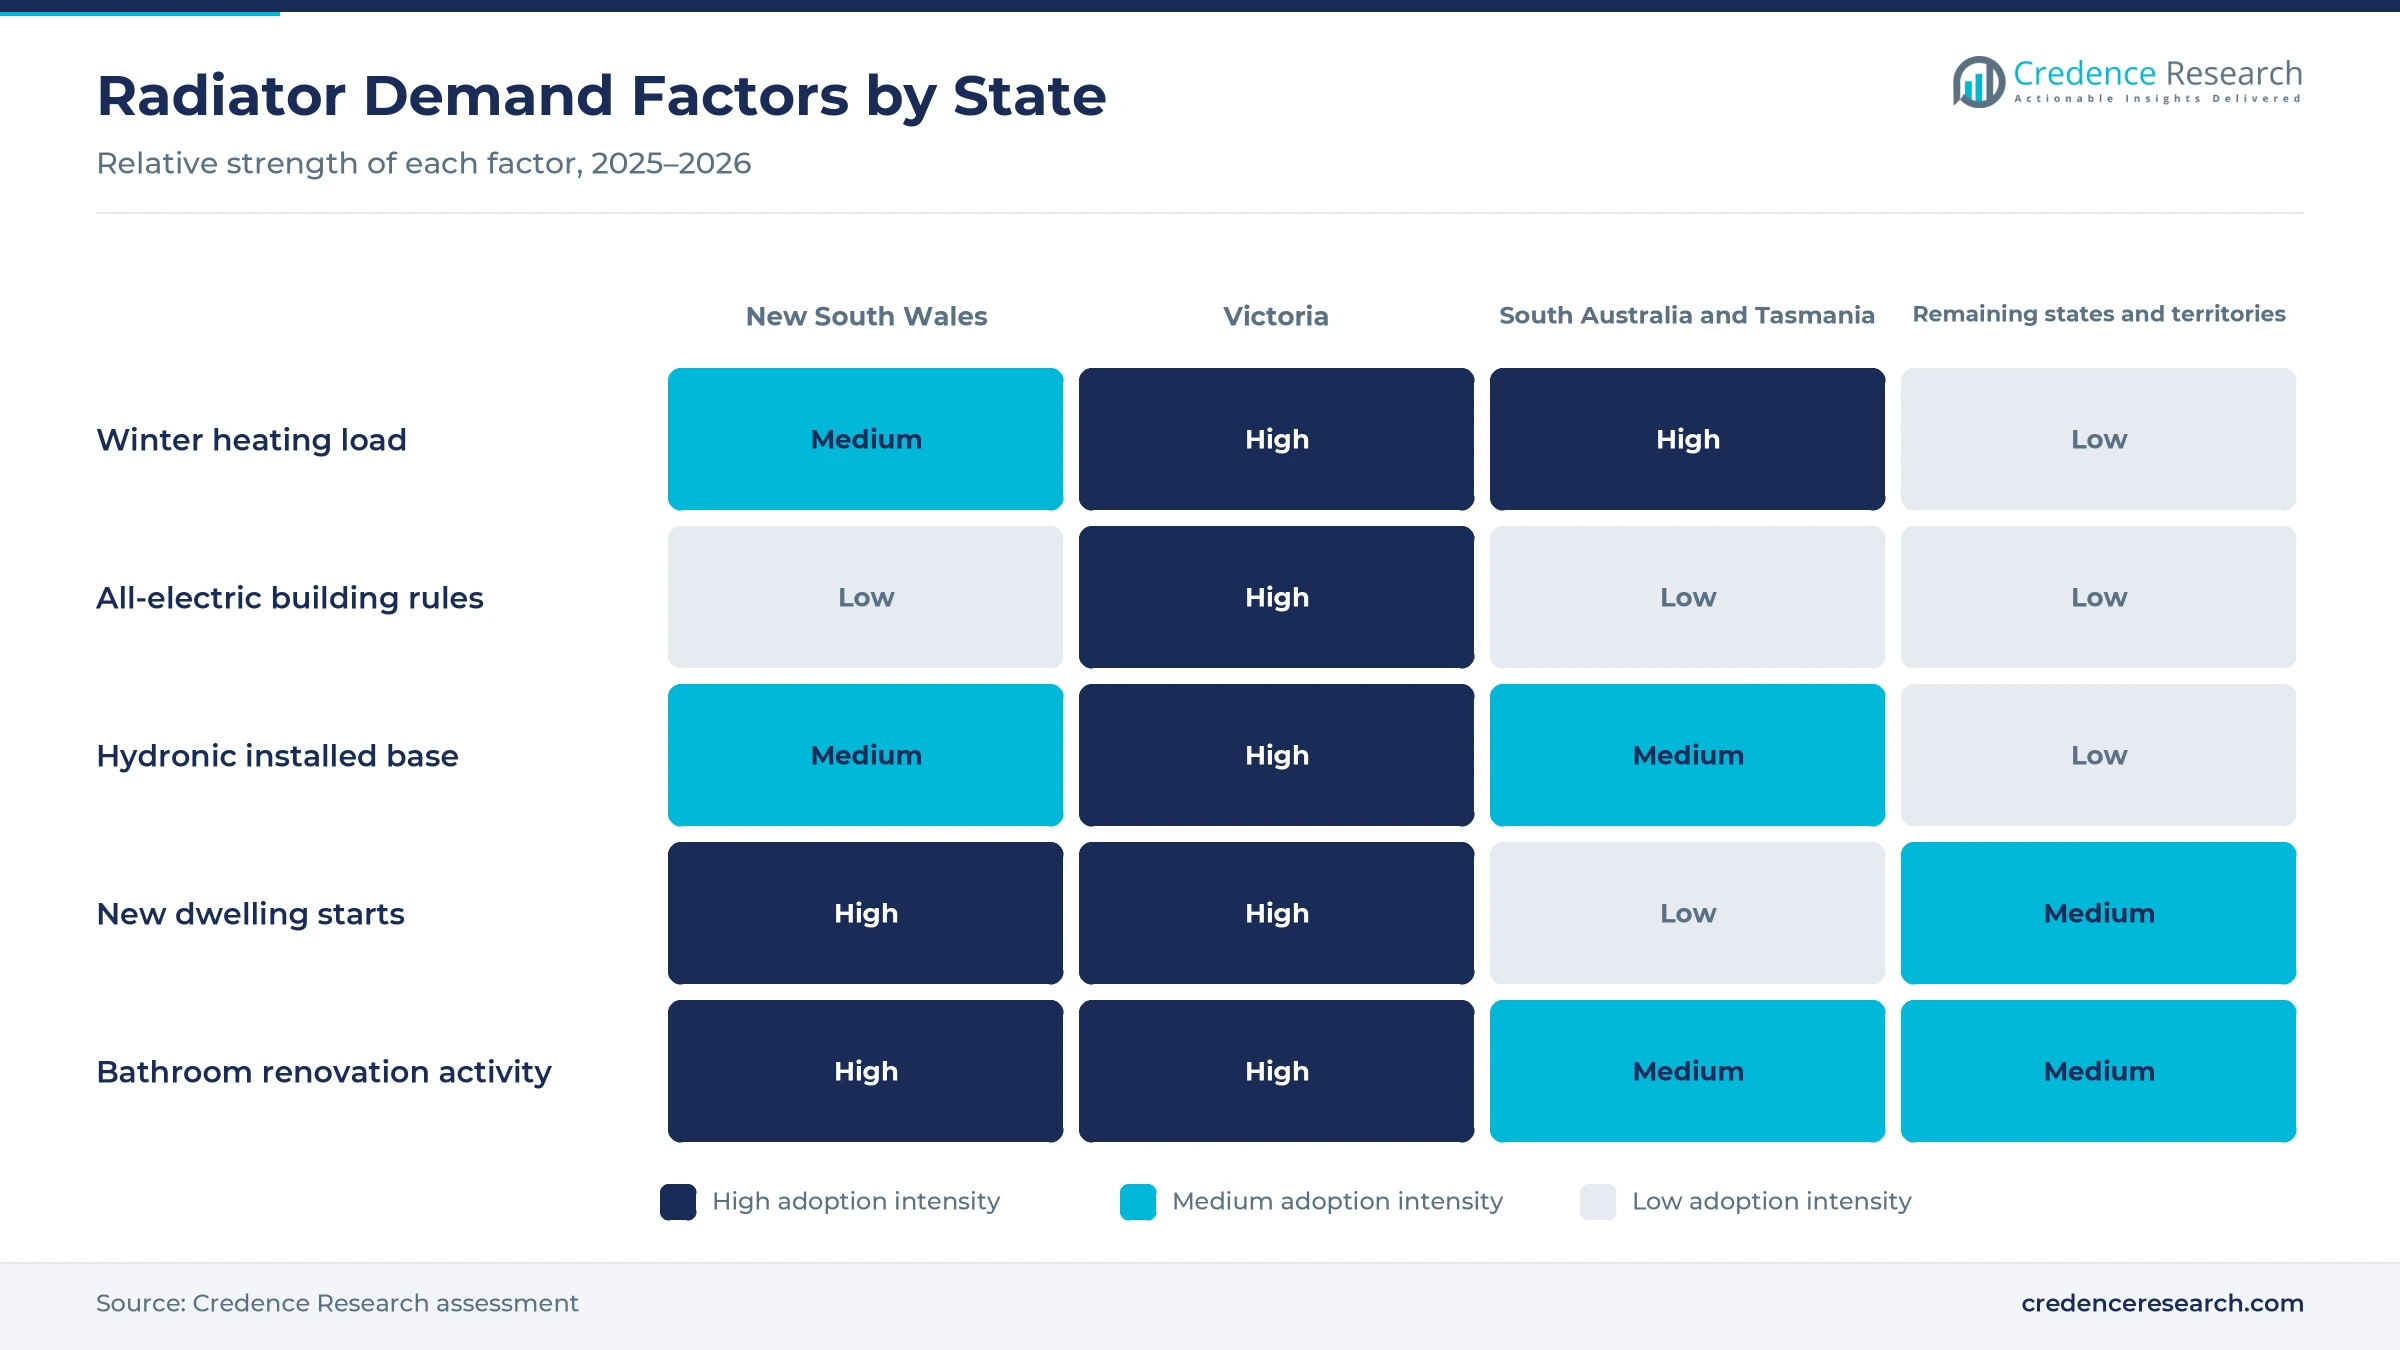
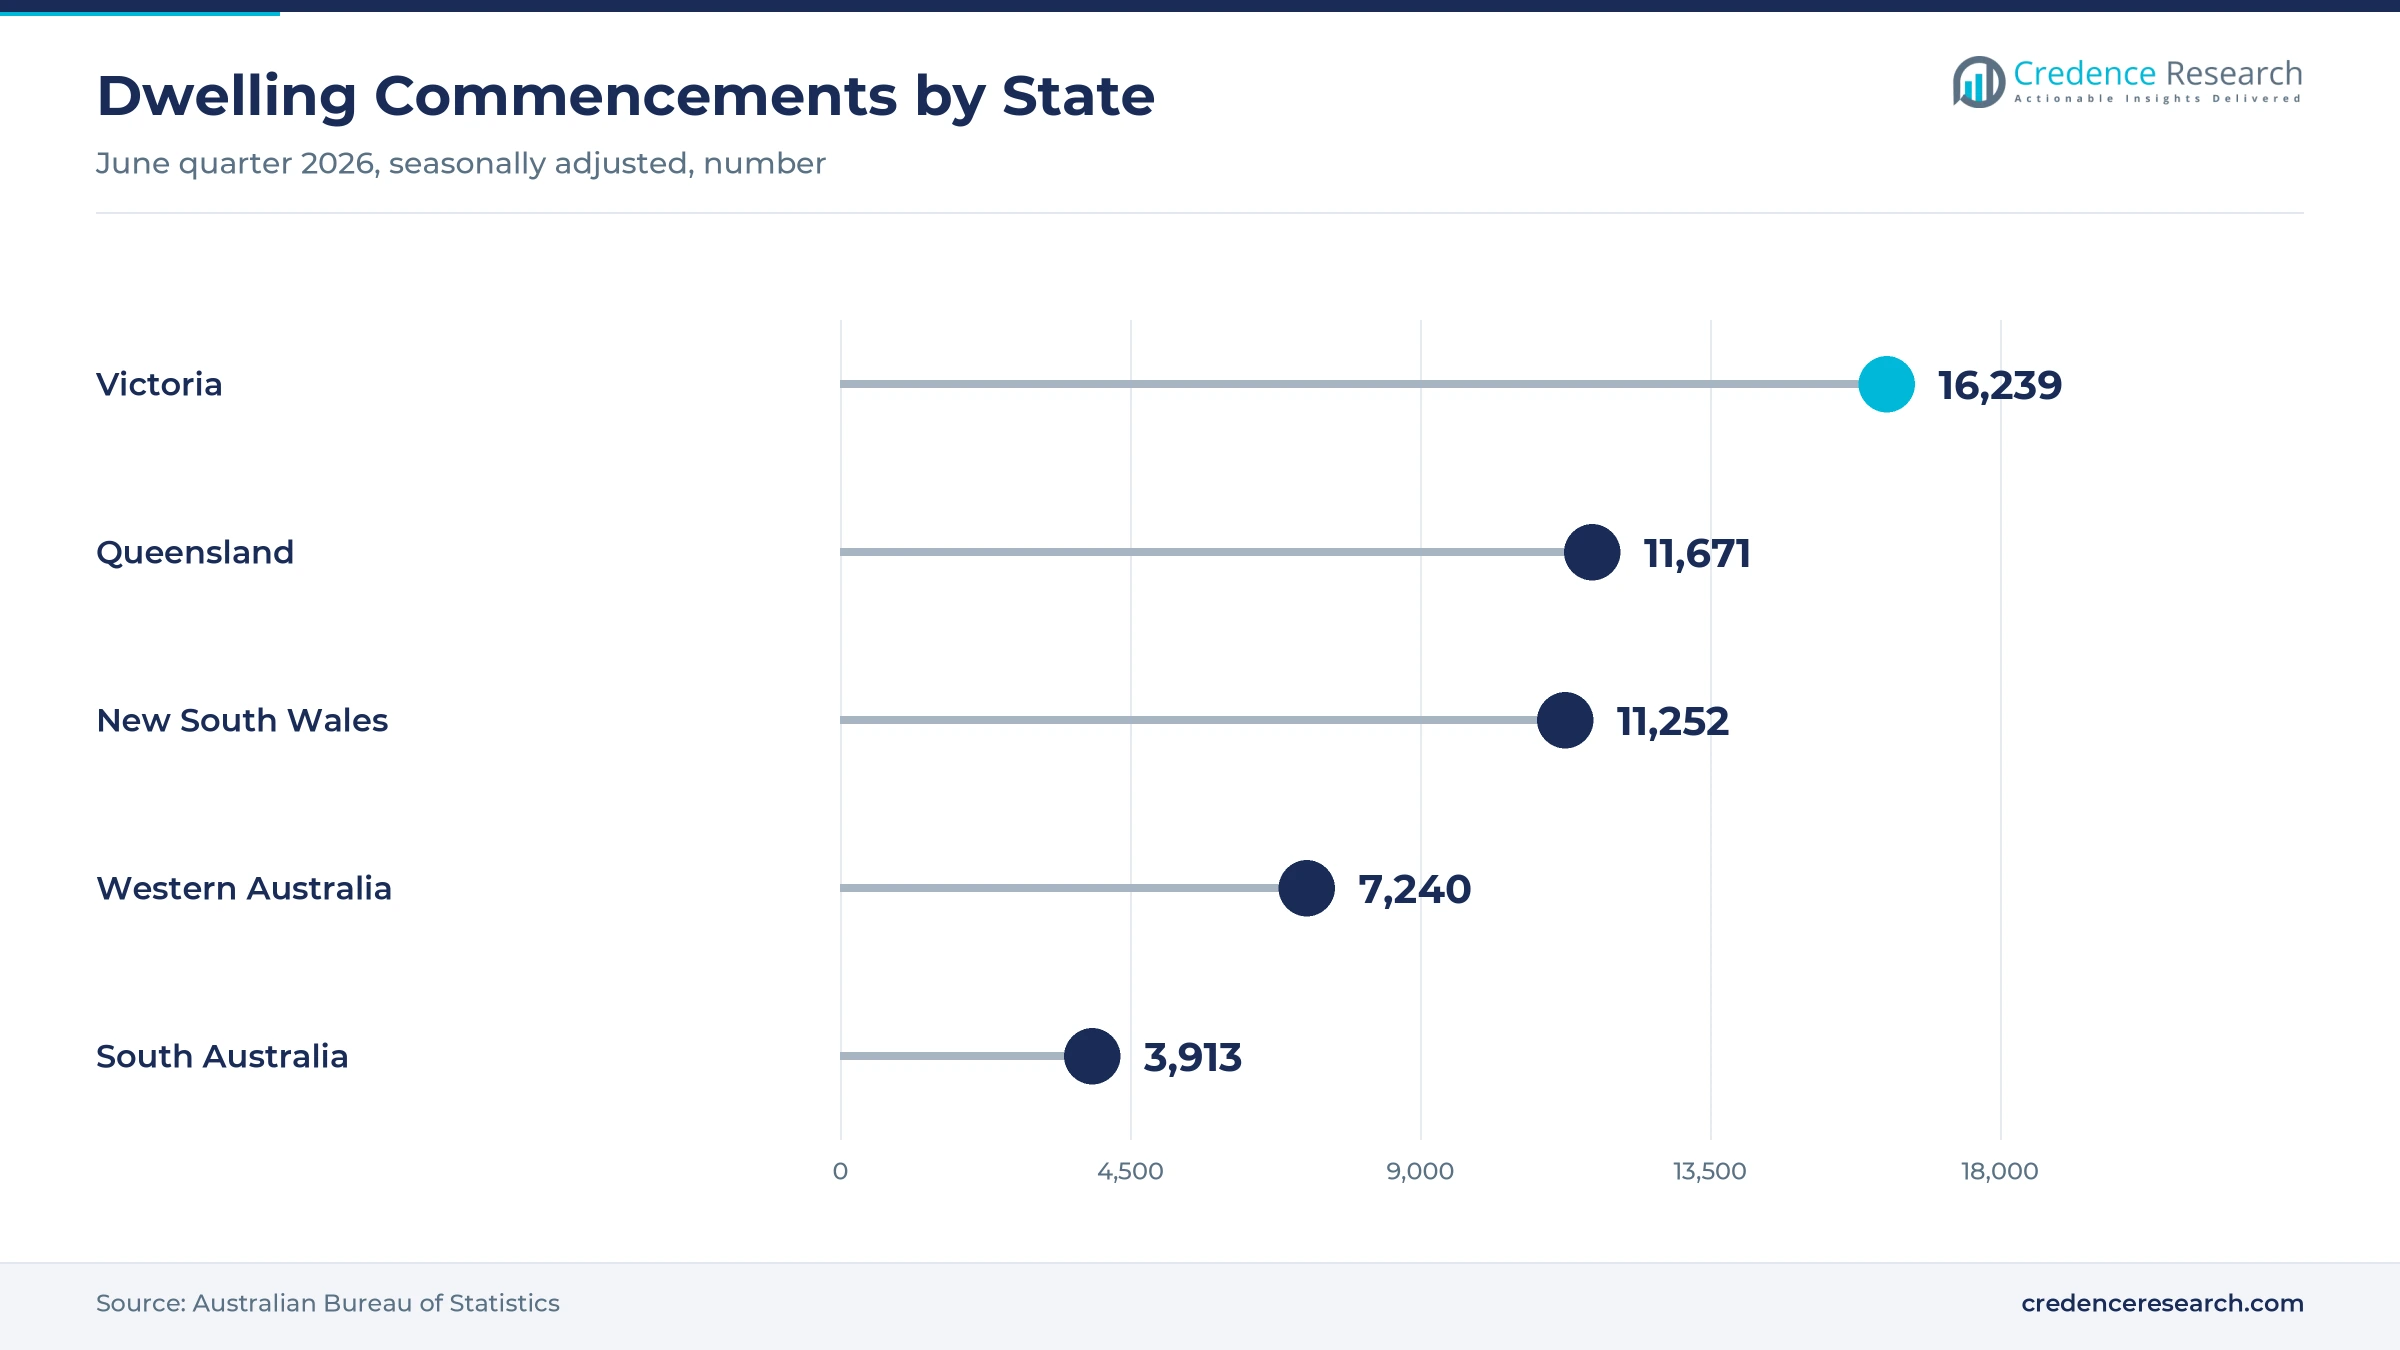
New home building and renovation work lift demand, because every new dwelling needs fixed or portable heating for living areas, bedrooms and bathrooms. Total dwelling commencements reached 52,201 in the June quarter 2026, seasonally adjusted, according to the Australian Bureau of Statistics. Victoria started 16,239 dwellings in that quarter, ahead of Queensland at 11,671 and New South Wales at 11,252. The National Housing Accord also targets 1.2 million new well-located homes over five years from July 1, 2024. As a result, builders order towel rails, panel heaters and hydronic underfloor systems for whole projects, which lifts direct project supply.
Why does selective hydronic electrification support sales?
Selective hydronic electrification supports radiator sales, because homes with existing hydronic pipework can swap a gas boiler for an electric heat pump and keep their panels. Stiebel Eltron states that its WPL 25 AC unit delivers 14 kilowatts at a coefficient of performance of 5.09, with flow temperatures up to 65 degrees Celsius for radiators, according to its product listing. Foster Hydronic Heating has served Melbourne homes for more than 50 years, which shows the size of the installed base. Hunt Heating also bought HydroHeat Supplies in May 2023 to widen supply Australia-wide. Consequently, hydronic radiators keep a large share of primary space heating, which leads applications with 52.0% of 2025 value.
How do Victoria's all-electric rules reshape heating demand?
Victoria's all-electric rules reshape heating demand, because the state has the highest household gas use in Australia and cold winters in Melbourne and the highlands. All new homes and most new commercial buildings must be all-electric from Jan. 1, 2027, according to the Victorian government. Since Jan. 1, 2024, new homes that need a planning permit have connected only to electric networks. Victorian Energy Upgrades discounts of up to AUD 1,610 also support replacing gas space heaters, while existing all-electric homes save about AUD 1,700 a year. As a result, Victoria becomes the fastest-growing state, as gas heating gives way to electric panels and heat pump hydronics in new and existing homes.
Why do running-cost upgrades and finance support purchases?
Running-cost upgrades and finance schemes support purchases, because households replace old heaters with units that use timers, thermostats and lower settings. Tasmania's Energy Saver Loan Scheme offered interest-free loans of AUD 500 to AUD 10,000 for electric heating, repaid over one to three years, before it closed on Sept. 1, 2025. De'Longhi's Dragon 4 oil column heater offers 2,400 watts, three power settings, a 24-hour timer and a seven-year warranty. Victorian households replacing gas hot water with electric units also save about AUD 330 a year. Consequently, electric convection and storage radiators lead product types with 46.0% of 2025 value, as buyers trade up to controlled models.
App control, heat pump hydronics and towel rails gain ground
How is the rise of app-controlled panels changing ranges?
The rise of app-controlled panels is changing product ranges, because households want to schedule heat by room and cut wasted hours. Olimpia Splendid launched its Caldo Plus WiFi panel range on May 15, 2026, in four models from 1,000 to 2,400 watts, according to a trade news report. The range sells for AUD 749 to AUD 899 through The Good Guys and includes a 1 to 24 hour countdown timer. The OS Home app also lets users set schedules and adjust temperatures from a phone. As a result, buyers link panels with smart thermostats and connected controls, which lifts mid and premium tier sales.
Why is the shift to heat pump hydronics rising?
The shift to heat pump hydronics is rising, because owners of large homes want whole-house radiant comfort without gas. Stiebel Eltron runs its Australian headquarters from Port Melbourne, with a 300 square meter showroom and 16 staff that displays heat pumps powering hydronic heating and hot water. Its Perth showroom adds 280 square meters of display space for builders and homeowners in Western Australia. Hydrotherm also makes towel rails by hand from copper tube and brass fittings in Thomastown, in electric and hydronic versions. Consequently, premium buyers pair heat pumps with low-temperature panels, which supports hydronic radiator demand in Victoria and Tasmania, where long winters reward steady radiant heat.
Can bathroom upgrades open towel rail demand?
Bathroom upgrades open a clear opening for towel rail radiators, because renovators and builders now treat heated rails as a standard comfort item. Thermogroup's Thermorail single bar rail draws only 18 watts and sells through Tradelink for about AUD 265. Hydrotherm offers electric, hydronic and non-heated rails in a range of sizes and finishes from Victoria. Builders also started 31,707 new houses in the June quarter 2026, each with at least one bathroom. As a result, electric towel rail radiators gain from both new houses and renovations, while buyers in colder states compare rails with towel warmers sold for laundries and bedrooms.
Is there room to grow in compact urban homes?
Compact urban homes offer a growth opening, because apartments and townhouses need slim heaters that fit small rooms and strata rules. About 87.7% of Australians lived in urban areas in 2025, according to the World Bank. Builders also started 19,126 new other residential dwellings, mostly apartments and townhouses, in the June quarter 2026. Australia's population reached 27.9 million at March 2026, up 392,700 in a year. Consequently, slim wall panels, infrared quartz heaters and ceiling panels gain in apartments, where gas connections are rare, wall space is limited and body corporate rules often restrict outdoor units.
Reverse-cycle units, power bills and skills slow sales
How do reverse-cycle air conditioners limit demand?
Reverse-cycle air conditioners limit demand, because Victorian rules point rental heating toward these units. From March 1, 2027, a failed heater in a rental home must be replaced with an efficient reverse-cycle unit in the main living area. As a result, landlords buy fewer panels for living rooms. Suppliers respond by targeting bedrooms, bathrooms and homes with existing hydronic pipework, where radiant heat still suits buyers.
Why do electricity costs slow resistive heater use?
Electricity costs slow resistive heater use, because convection panels and oil-filled columns turn each kilowatt hour into the same amount of heat. A 2,400 watt column heater running for long winter evenings can lift power bills sharply. Consequently, some households limit heating hours or switch to heat pumps. Brands respond with thermostats, eco modes, timers and app scheduling that cut running time without losing comfort.
How do installation costs and skills hold back hydronics?
Installation costs and skills hold back hydronic upgrades, because pipework, panels and heat pumps need plumbers and electricians trained in low-temperature design. Retrofitting older homes can also mean lifting floors or cutting walls. In turn, hydronic projects cost far more than portable panels. Installers reduce this barrier by reusing existing pipework, staging upgrades room by room and quoting heat pump and panel packages together.
Will imports and short seasons squeeze suppliers?
Imports and short seasons squeeze suppliers, because most panels and columns are made in Europe or Asia and sell in a few winter months. A mild winter can leave importers with excess stock and price discounts. As a result, margins swing from year to year, especially in appliance retail. Suppliers reduce this risk with year-round towel rail sales, project contracts and local stock held close to builders.
New South Wales leads as Victoria grows fastest
| State | Value, 2025 (USD million) | Share, 2025 | CAGR, 2026–2035 |
|---|---|---|---|
| New South Wales | 42.2 | 47.7% | 3.53% |
| Victoria | 31.2 | 35.3% | 4.08% |
| South Australia and Tasmania | 9.6 | 10.9% | 3.73% |
| Remaining states and territories | 5.4 | 6.1% | 3.63% |
Population and apartment stock keep New South Wales on top
New South Wales held a 47.7% share of 2025 value and grows at 3.53% a year. The state had 8.67 million residents at March 2026, the largest population of any state, and started 11,252 dwellings in the June quarter 2026. Cold winters in Canberra's surrounds, the Blue Mountains and the tablelands also lift demand. As a result, the state keeps the largest regional share of panel, column and towel rail purchases through 2035.
How does Victoria become the fastest-growing state?
Victoria held a 35.3% share of 2025 value and grows fastest at 4.08% a year, because its all-electric rules move new homes away from gas heating from Jan. 1, 2027. The state added 109,500 residents in the year to March 2026, reaching 7.15 million, and started 16,239 dwellings in the June quarter 2026. Hydronic installers such as Foster Hydronic Heating and towel rail maker Hydrotherm also operate in Melbourne. Consequently, Victoria adds the most new demand for electric panels and heat pump hydronics.
What drives demand in South Australia and Tasmania?
South Australia and Tasmania held 10.9% of 2025 value and grow at 3.73% a year. Tasmania grew only 0.6% in population in the year to March 2026, and its interest-free Energy Saver Loan Scheme funded electric heating until Sept. 1, 2025. South Australia had 1.92 million residents and started 3,913 dwellings in the June quarter 2026. As a result, demand here comes from hydronic upgrades, panel heaters and towel rails in older homes.
What role do the remaining states and territories play?
The remaining states and territories held 6.1% of 2025 value and grow at 3.63% a year. Western Australia grew fastest in population, at 2.1% in the year to March 2026, while Canberra's cold winters lift panel use in the territory. As a result, demand here centers on bedrooms, bathrooms and new homes in Perth, Canberra and southern Queensland.
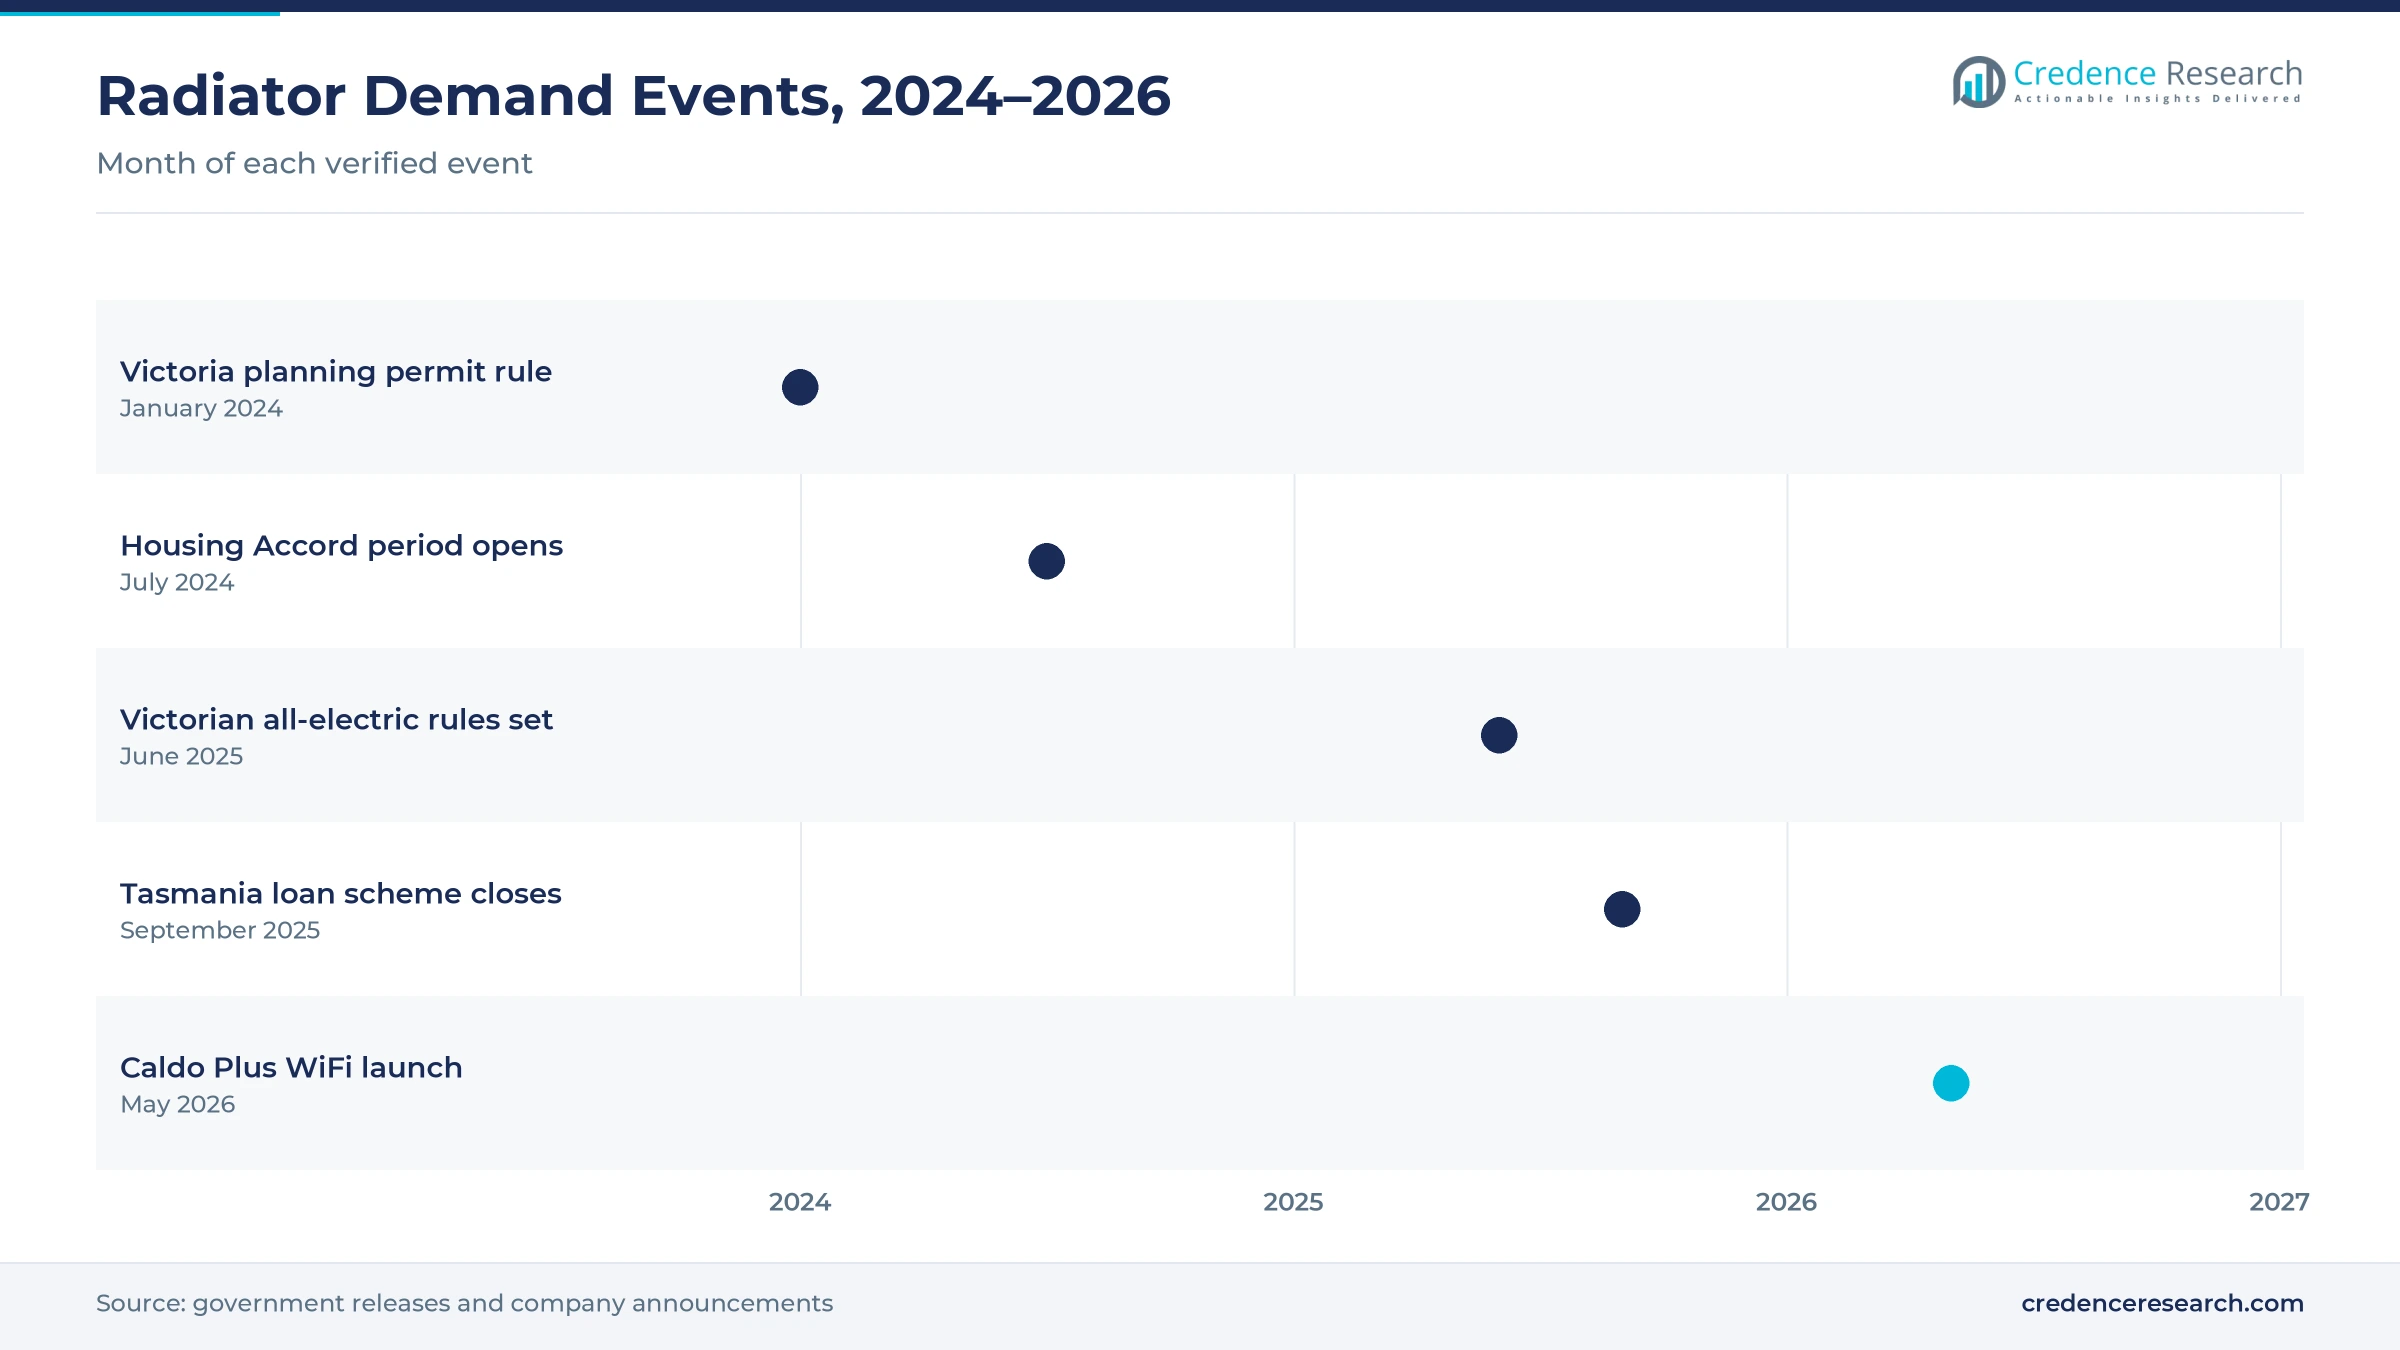
Building rules, housing goals and launches, 2024–2026
| Development | Status and market relevance |
|---|---|
| In January 2024, Victoria began requiring new homes and subdivisions that need a planning permit to connect only to all-electric networks. | Moves new-home heating toward electric emitters |
| In July 2024, the National Housing Accord period opened, with a target of 1.2 million new well-located homes over five years. | Supports new-build heater demand |
| In June 2025, the Victorian government announced that all new homes must be all-electric from Jan. 1, 2027, with rental heating rules from March 1, 2027. | Sets the largest policy shift for heating |
| In September 2025, Tasmania's Energy Saver Loan Scheme closed to new applications after funding electric heating upgrades. | Pulled forward heater upgrades in 2025 |
| In May 2026, Olimpia Splendid launched its Caldo Plus WiFi panel heater range in Australia, from 1,000 to 2,400 watts. | Widens app-controlled panel choice |
Thermostats, apps and low-temperature hydronics reshape heat
- Electronic thermostats hold room temperature within a narrow band, which cuts wasted heat compared with manual dials.
- Wi-Fi app control lets households schedule heat by room and adjust settings from a phone, as in the Caldo Plus WiFi range.
- Low-temperature heat pump hydronics feed panels at up to 65 degrees Celsius, which lets homes keep radiators while dropping gas boilers.
- Safety features such as tilt switches, safety thermostats and cool-touch handles make portable column heaters safer in homes with children.
Need a Custom Version of This Report?
Tailor the scope, geography, or segments to your exact requirements.
- Custom geography or segment scope
- Direct access to our analyst team
Brands compete on control, comfort and installer reach
Competition combines European appliance brands, hydronic specialists and local towel rail makers. De'Longhi sells oil column heaters such as the Dragon 4 with timers and long warranties, while Olimpia Splendid launched its Caldo Plus WiFi panel range in May 2026. Glen Dimplex Australia sells Dimplex panel heaters and has grown through local acquisitions, including a majority stake in Thermofilm in 2021. Stiebel Eltron Australia supplies heat pumps that power hydronic radiators from its Port Melbourne base. Hunt Heating, Foster Hydronic Heating and other installers design and fit hydronic systems, while Hydrotherm and Thermogroup make and sell heated towel rails. Rinnai Australia and H2O Plumbing & Heating Tasmania are also covered in the supplier field. Companies compete on control features, running cost, warranty, design and installer reach.
Companies profiled and their roles in this market
| Company | Type | Role in the market |
|---|---|---|
| De'Longhi Australia | Appliance brand | Dragon 4 oil column heaters, 2,400 watts, 24-hour timer |
| Olimpia Splendid Australia | Appliance brand | Caldo Plus WiFi panel heaters, launched May 2026 |
| Glen Dimplex Australia | Appliance brand | Dimplex panel heaters; majority stake in Thermofilm, 2021 |
| Stiebel Eltron Australia | Heat pump supplier | WPL heat pumps for radiator hydronic heating; Port Melbourne base |
| Hunt Heating | Hydronic supplier | Hydronic systems; acquired HydroHeat Supplies in May 2023 |
| Foster Hydronic Heating | Hydronic installer | Melbourne design, installation and service, 50+ years |
| Hydrotherm Towel Rails | Local maker | Hand-made copper tube rails, electric and hydronic, Thomastown |
| Thermogroup | Local brand | Thermorail heated towel rails sold through Tradelink |
Credence Research sees electrification setting the pace
Credence Research's view is that Australian radiator demand will grow steadily through 2035, as all-electric building rules, new housing and bathroom upgrades lift sales. Electric convection and storage units should keep the largest product share, while fixed infrared panels and heat pump hydronics gain most from gas phase-out. New South Wales will remain the largest state, although Victoria adds demand fastest. However, reverse-cycle air conditioners and power costs will reward suppliers that offer controlled, efficient units and strong installer support.
Dwelling stock and replacement cycles anchor the model
The report uses 2025 as the base year, with values in USD million at current prices. Market values come from the Credence Research model, which combines dwelling stock, new dwelling starts, heater replacement cycles and price tiers. State shares follow the client data set, while state growth and segment splits by product type, application, end user and distribution channel are Credence Research estimates. Sources used are official statistics, government releases, company product pages and trade news reports, and no interviews or surveys were used.
New homes and gas phase-out shape radiator demand to 2035
The market is expected to reach USD 136.5 million by 2035, a 3.75% CAGR during 2026–2035, as new homes, electrification rules and bathroom upgrades keep demand rising. Growth should be strongest in fixed infrared panels, primary space heating and Victoria, while New South Wales keeps the largest share. Heat pump hydronics and app-controlled panels will widen premium demand after 2027. In contrast, reverse-cycle air conditioners, high power prices and installer shortages could slow radiator sales in some homes.
Frequently Asked Questions
How big is the Australia heating radiator market?
Which state leads radiator demand?
Which state grows fastest?
Which product type holds the largest share?
How does hydronic electrification affect demand?
Which product type grows fastest?
Who are the leading companies in this market?
What are the main risks to growth?
Table of Content
Chapter 1 Market Segmentation
- 1.1 Segmentation Framework
- 1.1.1 Product and Service Classification
- 1.1.2 Application and End-Use Classification
- 1.1.3 Technology and Solution Classification
- 1.1.4 Customer and Distribution Channel Classification
- 1.1.5 Geographic Segmentation
- 1.1.6 Market Segment Definitions and Boundaries
- 1.2 By Product Type
- 1.2.1 Electric convection and storage radiators
- 1.2.2 Fixed infrared radiant panels
- 1.2.3 Hydronic radiators
- 1.2.4 Electric towel rail radiators
- 1.3 By Application
- 1.3.1 Primary space heating
- 1.3.2 Supplementary zone heating
- 1.3.3 Towel warming
- 1.4 By End User
- 1.4.1 Households
- 1.4.2 Private-sector organisations
- 1.4.3 Public-sector organisations
- 1.5 By State
- 1.5.1 Victoria
- 1.5.2 New South Wales
- 1.5.3 South Australia and Tasmania
- 1.5.4 Remaining states and territories
Chapter 2 Introduction
- 2.1 Report Objectives and Scope
- 2.2 Product Definition and Industry Terminology
- 2.3 Market Inclusions and Exclusions
- 2.4 Research Process
- 2.4.1 Primary Research and Expert Interviews
- 2.4.2 Secondary Research and Source Review
- 2.4.3 Top-Down and Bottom-Up Estimation
- 2.4.4 Data Triangulation and Verification
- 2.5 Market Size Measurement Basis
- 2.5.1 2025: USD 88.5 million → 2035: USD 136.5 million
- 2.6 Historical and Forecast Reference Periods
- 2.6.1 Historical Period: 2018-2025
- 2.6.2 Base Year: 2025
- 2.6.3 Forecast Period: 2025-2035
- 2.7 Research Assumptions and Limitations
Chapter 3 Executive Summary
- 3.1 Market Snapshot and Key Findings
- 3.2 Base-Year Market Size, 2025
- 3.3 Forecast Market Size, 2035
- 3.4 Revenue and Volume Growth Outlook
- 3.5 Key Demand and Supply Indicators
- 3.6 Leading Market Segments
- 3.7 Fastest-Growing Market Opportunities
- 3.8 Regional Performance Highlights
- 3.9 Technology and Industry Transformation
- 3.10 Competitive Landscape Summary
- 3.11 Analyst View and Strategic Implications
Chapter 4 Australia Heating Radiator Market Trends and Developments
- 4.1 Historical Industry Development, 2018-2025
- 4.2 Recent Market Trends and Developments
- 4.3 Demand and Customer Behavior Trends
- 4.4 Technology and Product Innovation
- 4.5 Artificial Intelligence, Automation and Digitalization
- 4.6 Local Manufacturing and Supply Chain Realignment
- 4.7 Industry Partnerships, Mergers and Acquisitions
- 4.8 Sustainability and Circular Economy Developments
- 4.9 Government and Private Sector Investment Trends
- 4.10 Emerging Business Models and Commercialization
- 4.11 Industry Developments and Announcements
Chapter 5 Australia Heating Radiator Market Production, Supply and Demand Analysis
- 5.1 Demand Trend and Consumption Analysis, 2018-2025
- 5.2 Demand Forecast, 2025-2035
- 5.3 Production and Output Trend, 2018-2025
- 5.4 Production and Output Forecast, 2025-2035
- 5.5 Installed Capacity and Capacity Utilization
- 5.6 Company-Wise Production Plants and Statistics
- 5.6.1 Installed Production Capacity
- 5.6.2 Actual Production
- 5.6.3 Planned Capacity and Expansion Targets
- 5.7 Supply Chain Structure and Procurement Trends
- 5.8 Supply-Demand Gap and Bottlenecks
- 5.9 Import Dependence and Sourcing Structure
- 5.10 Contract Manufacturing and Outsourcing
- 5.11 Regional Supply and Demand Concentration
Chapter 6 Australia Heating Radiator Market Pricing Analysis
- 6.1 Pricing Structure and Measurement
- 6.2 Historical Pricing Trends, 2018-2025
- 6.3 Pricing Outlook, 2025-2035
- 6.4 Average Selling Price and Unit Economics
- 6.5 Pricing by Product and Market Segment
- 6.6 Geographic Pricing Differences
- 6.7 Key Input, Energy, Labor and Logistics Costs
- 6.8 Contract Pricing and Purchasing Models
- 6.9 Pricing Sensitivity and Competitive Positioning
- 6.10 Price, Margin and Profitability Implications
Chapter 7 Australia Heating Radiator Market Dynamics
- 7.1 Market Growth Drivers
- 7.1.1 Demand-Side Drivers
- 7.1.2 Technology and Innovation Drivers
- 7.1.3 Infrastructure and Investment Drivers
- 7.1.4 Regulatory and Policy Drivers
- 7.2 Market Restraints
- 7.2.1 Cost and Affordability Constraints
- 7.2.2 Technology and Adoption Barriers
- 7.2.3 Supply Chain and Operational Constraints
- 7.3 Market Challenges
- 7.3.1 Competitive Pressure and Margin Erosion
- 7.3.2 Skills, Infrastructure and Implementation Gaps
- 7.4 Emerging Market Opportunities
- 7.5 Market Dynamics Impact and Time-Horizon Assessment
Chapter 8 Australia Heating Radiator Value Chain Analysis
- 8.1 Industry Value Chain Overview
- 8.2 Upstream Suppliers and Critical Inputs
- 8.3 Technology and Component Providers
- 8.4 Manufacturing or Service Delivery
- 8.5 Distribution, Channel Partners and Integrators
- 8.6 Downstream Applications and End Users
- 8.7 Value Addition and Profit Pools
- 8.8 Vertical Integration and Outsourcing
- 8.9 Supplier Concentration and Risk
- 8.10 Supply Chain Localization and Resilience
Chapter 9 Australia Heating Radiator Market Regulations and Policies
- 9.1 Relevant Laws, Standards and Compliance Frameworks
- 9.2 Product, Service, Safety and Quality Requirements
- 9.3 Government Policies, Incentives and Subsidies
- 9.4 Imports, Exports and Trade Barriers
- 9.5 Public Procurement and Local Content Requirements
- 9.6 Environmental and Sustainability Compliance
- 9.7 Upcoming Policy Changes and Market Implications
Chapter 10 Australia Heating Radiator Market Hotspots and Opportunities
- 10.1 Market Opportunity Mapping and Growth Hotspots
- 10.2 High-Growth Applications and Customer Groups
- 10.3 Underserved Markets and White-Space Opportunities
- 10.4 Emerging Technology and Product Opportunities
- 10.5 New Capacity and Investment Hotspots
- 10.6 Market Entry and Expansion Opportunities
- 10.7 Distribution and Partnership Opportunities
- 10.8 Near-Term and Long-Term Commercial Potential
- 10.9 Opportunity Attractiveness and Execution Risks
Chapter 11 Australia Heating Radiator Market Outlook, 2025-2035
- 11.1 Market Size and Analysis
- 11.1.1 Revenue (Market Measurement: 2025: USD 88.5 million → 2035: USD 136.5 million)
- 11.1.2 Market Volume and Quantity Sold
- 11.1.3 Historical Market Size, 2018-2025
- 11.1.4 Base-Year Market Size, 2025
- 11.2 Market Forecast, 2025-2035
- 11.2.1 Revenue Forecast to 2035
- 11.2.2 Volume Forecast to 2035
- 11.2.3 CAGR and Year-on-Year Growth
- 11.2.4 Incremental Revenue Opportunity
- 11.3 Forecast Assumptions and Scenario Analysis
- 11.3.1 Base-Case Forecast
- 11.3.2 Optimistic and Conservative Scenarios
- 11.3.3 Technology, Pricing and Policy Sensitivities
- 11.4 Market Attractiveness and Growth Outlook
Chapter 12 Australia Heating Radiator Market Segmentation and Outlook
- 12.1 Segmentation Summary and Market Shares, 2025
- 12.2 Largest and Fastest-Growing Segments
- 12.3 By Product Type - Market Size and Forecast, 2025-2035
- 12.3.1 Segment Definition and Scope
- 12.3.2 Historical Market Size, 2018-2025
- 12.3.3 Revenue Forecast, 2025-2035
- 12.3.4 Volume Forecast, 2025-2035
- 12.3.5 Base-Year Market Share, 2025
- 12.3.6 Segment CAGR and Growth Drivers
- 12.3.7 Subsegment Market Size and Forecast
- 12.3.7.1 Electric convection and storage radiators
- 12.3.7.2 Fixed infrared radiant panels
- 12.3.7.3 Hydronic radiators
- 12.3.7.4 Electric towel rail radiators
- 12.3.8 Subsegment Pricing and Adoption Trends
- 12.3.9 Leading Suppliers and Competition
- 12.3.10 Regional Demand and Opportunities
- 12.4 By Application - Market Size and Forecast, 2025-2035
- 12.4.1 Segment Definition and Scope
- 12.4.2 Historical Market Size, 2018-2025
- 12.4.3 Revenue Forecast, 2025-2035
- 12.4.4 Volume Forecast, 2025-2035
- 12.4.5 Base-Year Market Share, 2025
- 12.4.6 Segment CAGR and Growth Drivers
- 12.4.7 Subsegment Market Size and Forecast
- 12.4.7.1 Primary space heating
- 12.4.7.2 Supplementary zone heating
- 12.4.7.3 Towel warming
- 12.4.8 Subsegment Pricing and Adoption Trends
- 12.4.9 Leading Suppliers and Competition
- 12.4.10 Regional Demand and Opportunities
- 12.5 By End User - Market Size and Forecast, 2025-2035
- 12.5.1 Segment Definition and Scope
- 12.5.2 Historical Market Size, 2018-2025
- 12.5.3 Revenue Forecast, 2025-2035
- 12.5.4 Volume Forecast, 2025-2035
- 12.5.5 Base-Year Market Share, 2025
- 12.5.6 Segment CAGR and Growth Drivers
- 12.5.7 Subsegment Market Size and Forecast
- 12.5.7.1 Households
- 12.5.7.2 Private-sector organisations
- 12.5.7.3 Public-sector organisations
- 12.5.8 Subsegment Pricing and Adoption Trends
- 12.5.9 Leading Suppliers and Competition
- 12.5.10 Regional Demand and Opportunities
- 12.6 By State - Market Size and Forecast, 2025-2035
- 12.6.1 Segment Definition and Scope
- 12.6.2 Historical Market Size, 2018-2025
- 12.6.3 Revenue Forecast, 2025-2035
- 12.6.4 Volume Forecast, 2025-2035
- 12.6.5 Base-Year Market Share, 2025
- 12.6.6 Segment CAGR and Growth Drivers
- 12.6.7 Subsegment Market Size and Forecast
- 12.6.7.1 Victoria
- 12.6.7.2 New South Wales
- 12.6.7.3 South Australia and Tasmania
- 12.6.7.4 Remaining states and territories
- 12.6.8 Subsegment Pricing and Adoption Trends
- 12.6.9 Leading Suppliers and Competition
- 12.6.10 Regional Demand and Opportunities
- 12.7 Segment Growth Comparison
- 12.8 Segment Attractiveness and Priority Matrix
Chapter 13 Australia Heating Radiator End-Use and Application Market Outlook
- 13.1 End-Use Industry and Customer Demand Structure
- 13.2 Leading Applications and Customer Groups
- 13.3 End-Use Market Size, Share and Forecast
- 13.4 Major End-Use Industry Deep Dives
- 13.4.1 Customer Requirements and Use Cases
- 13.4.2 Demand and Replacement Cycles
- 13.4.3 Technical and Regulatory Considerations
- 13.4.4 Purchasing and Procurement Models
- 13.4.5 Leading Vendors and Distribution Channels
- 13.4.6 Forecast and Commercial Opportunities
- 13.5 Emerging Applications and Cross-Segment Demand
- 13.6 End-Use Industry Investment Priorities
Chapter 14 Australia Heating Radiator Geographic Market Outlook, 2025-2035
- 14.1 Domestic Market Distribution and Demand Clusters
- 14.2 State- or Province-Wise Market Size and Forecast, 2025-2035
- 14.3 City and Metropolitan Market Outlook
- 14.4 Industrial, Manufacturing and Commercial Clusters
- 14.5 Geographic Concentration of Key End Users
- 14.6 Local Pricing and Purchasing Differences
- 14.7 Domestic Production Facilities and Capacity Map
- 14.8 Local Infrastructure and Project Pipeline
- 14.9 State-Level Policy and Incentive Differences
- 14.10 Subnational Investment Hotspots and Opportunities
- 14.11 Distribution and Logistics Networks
- 14.12 Domestic Competitive Footprint
Chapter 15 Australia Heating Radiator Technology, Innovation and Sustainability Outlook
- 15.1 Technology Landscape and Maturity
- 15.2 Product, Process and Service Innovation
- 15.3 AI, Automation and Digital Tools in the Industry
- 15.4 Technology Adoption and Performance Benchmarking
- 15.5 Innovation Pipeline and R&D Investment
- 15.6 Patent and Intellectual Property Trends
- 15.7 Energy Efficiency and Resource Management
- 15.8 Sustainability, Recycling and Circularity
- 15.9 Technology Roadmap, 2025-2035
- 15.10 Risks of Obsolescence and Technology Substitution
Chapter 16 Australia Heating Radiator Market Key Strategic Imperatives
- 16.1 Growth and Market Entry Priorities
- 16.2 High-Return Products and Segments
- 16.3 Pricing, Profitability and Cost Optimization
- 16.4 Technology Investment and Product Differentiation
- 16.5 Supply Chain Localization and Resilience
- 16.6 Distribution and Customer Acquisition
- 16.7 Partnership, Acquisition and Capacity Strategy
- 16.8 Regional Expansion Priorities
- 16.9 Short-, Medium- and Long-Term Actions
Chapter 17 Competition Outlook
- 17.1 Industry Competition Characteristics
- 17.2 Market Structure and Concentration
- 17.3 Market Share and Competitive Positioning, 2025
- 17.4 Company-Wise Revenue and Product Benchmarking
- 17.5 Production and Service Capacity Benchmarking
- 17.6 Technology, Pricing and Differentiation
- 17.7 Regional Footprint and Distribution Strength
- 17.8 Mergers, Acquisitions and Strategic Alliances
- 17.9 New Entrants and Competitive Threats
- 17.10 Porter's Five Forces and Industry Attractiveness
- 17.11 Competitive Outlook, 2025-2035
Chapter 18 Company Profiles
- 18.1 Company Coverage and Selection Criteria
- 18.2 Hunt Heating
- 18.2.1 Business Description
- 18.2.2 Company Ownership and Geographic Presence
- 18.2.3 Product and Service Portfolio
- 18.2.4 Manufacturing and Operating Footprint
- 18.2.5 Production Capacity and Expansion Plans
- 18.2.6 Financial Performance and Investment
- 18.2.7 Market Share and Competitive Position
- 18.2.8 Technology and Innovation Capabilities
- 18.2.9 Strategic Alliances or Partnerships
- 18.2.10 Recent Developments
- 18.2.11 Growth Strategy and Outlook
- 18.3 De'Longhi Australia
- 18.4 Glen Dimplex Australia
- 18.5 Rinnai Australia
- 18.6 Stiebel Eltron Australia
- 18.7 Olimpia Splendid Australia
- 18.8 Hydrotherm Towel Rails
- 18.9 Thermogroup
- 18.10 Foster Hydronic Heating
- 18.11 H2O Plumbing & Heating Tasmania
- 18.12 Other Relevant Market Participants
Note: Every listed company is profiled on the structure shown under the first company. The company list is preliminary and may change based on research findings, market developments, data availability and client requirements.
Chapter 19 Disclaimer
- 19.1 Research and Forecast Disclaimer
- 19.2 Data Source and Estimation Limitations
Note: The depth of individual sections depends on data availability for this market. Volume, capacity, trade and other unit-based metrics are included where applicable.

