
Seaweed extract supply and wellness buying shape demand
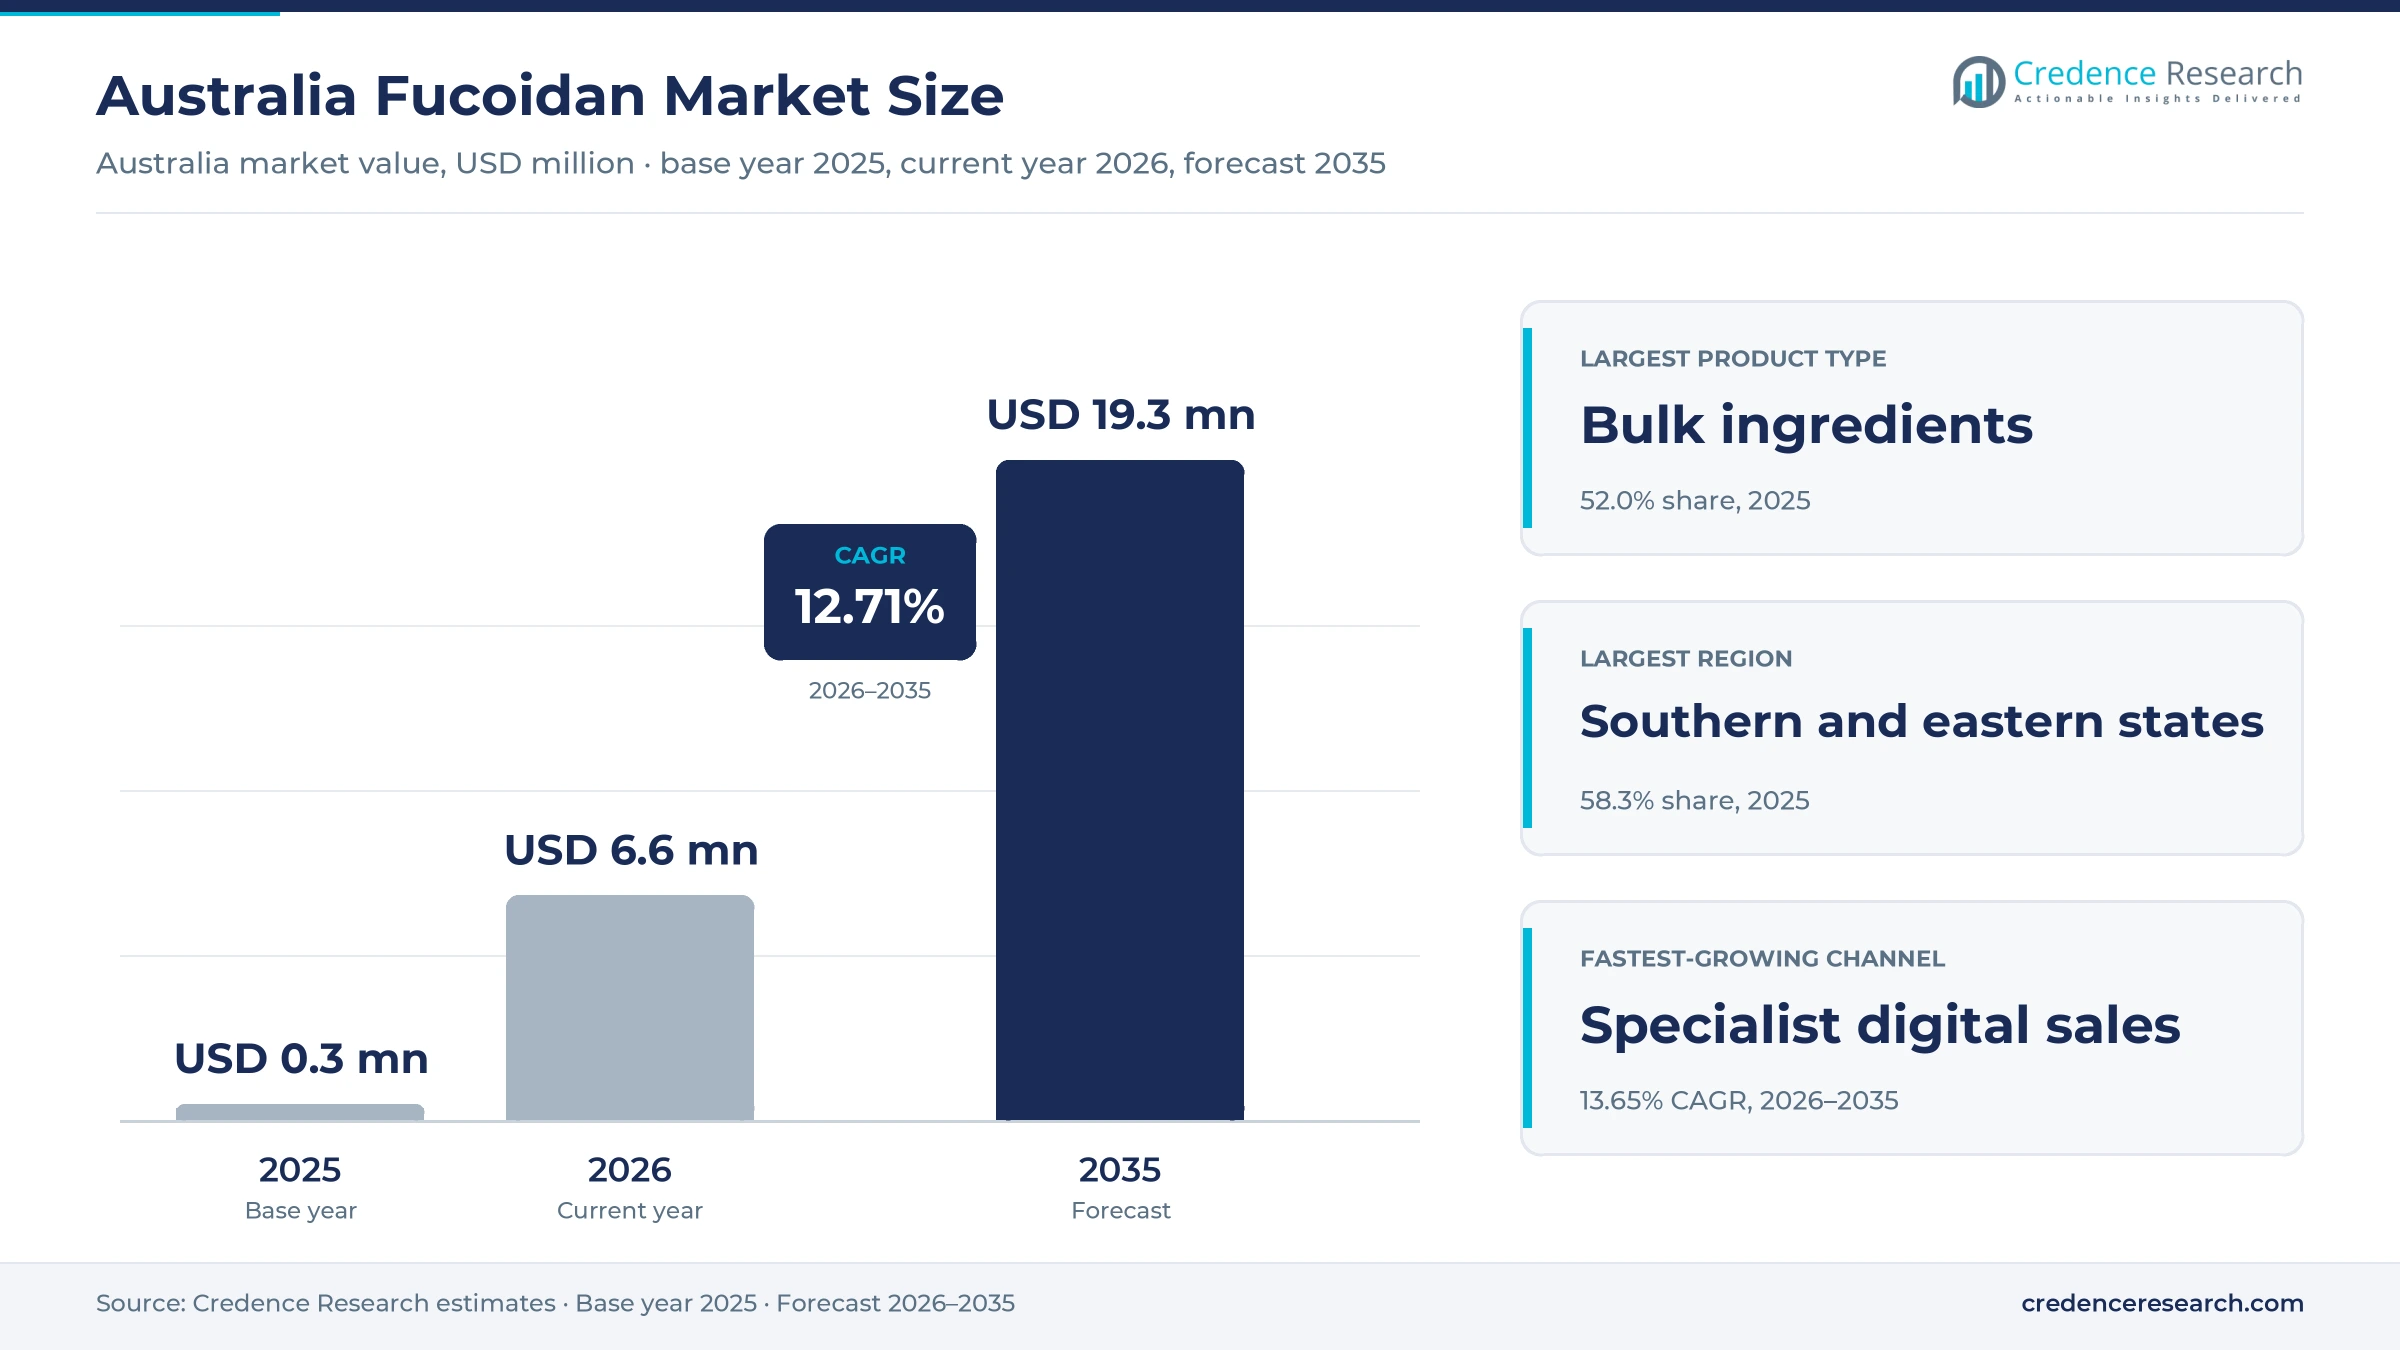
The Australia fucoidan market was valued at USD 0.3 million in 2025 and is projected to increase from USD 6.6 million in 2026 to USD 19.3 million by 2035, registering a CAGR of 12.71% during 2026–2035. Demand comes from supplement brands, skin care formulators and research buyers that use high-purity brown seaweed extracts in capsules, creams and test programs. The southern and eastern states held the largest regional share, 58.3% in 2025, because Tasmanian harvesting and extraction sit there alongside the largest consumer base. Western and South Australia follow, with Queensland and the Northern Territory close behind. Growth rests on completed extraction capacity, repeat purchasing by wellness consumers and trial results that let brands describe specific health uses. In turn, suppliers compete on purity, documented safety clearances and the ability to ship ingredient-grade powder to contract manufacturers on agreed specifications.
Which seaweed extract products does the estimate cover?
The estimate measures the value of fucoidan sold in Australia as bulk ingredient powder, finished oral formulations and finished topical formulations. It counts material supplied to supplement brands, cosmetic formulators, veterinary product makers and research groups under contract supply, specialist online sales and pharmacy or practitioner channels.
The estimate excludes whole seaweed foods, alginates, agar and other hydrocolloids, and unprocessed biomass sold for fertilizer. The value chain runs from wild harvest and farmed brown seaweed through aqueous extraction and purification to contract manufacturers, brand owners and the retail and clinical channels that reach end users.
Australia Fucoidan Market Insights
- The Australia fucoidan market was valued at USD 0.3 million in 2025 and is projected to reach USD 19.3 million by 2035, registering a CAGR of 12.71% during 2026–2035.
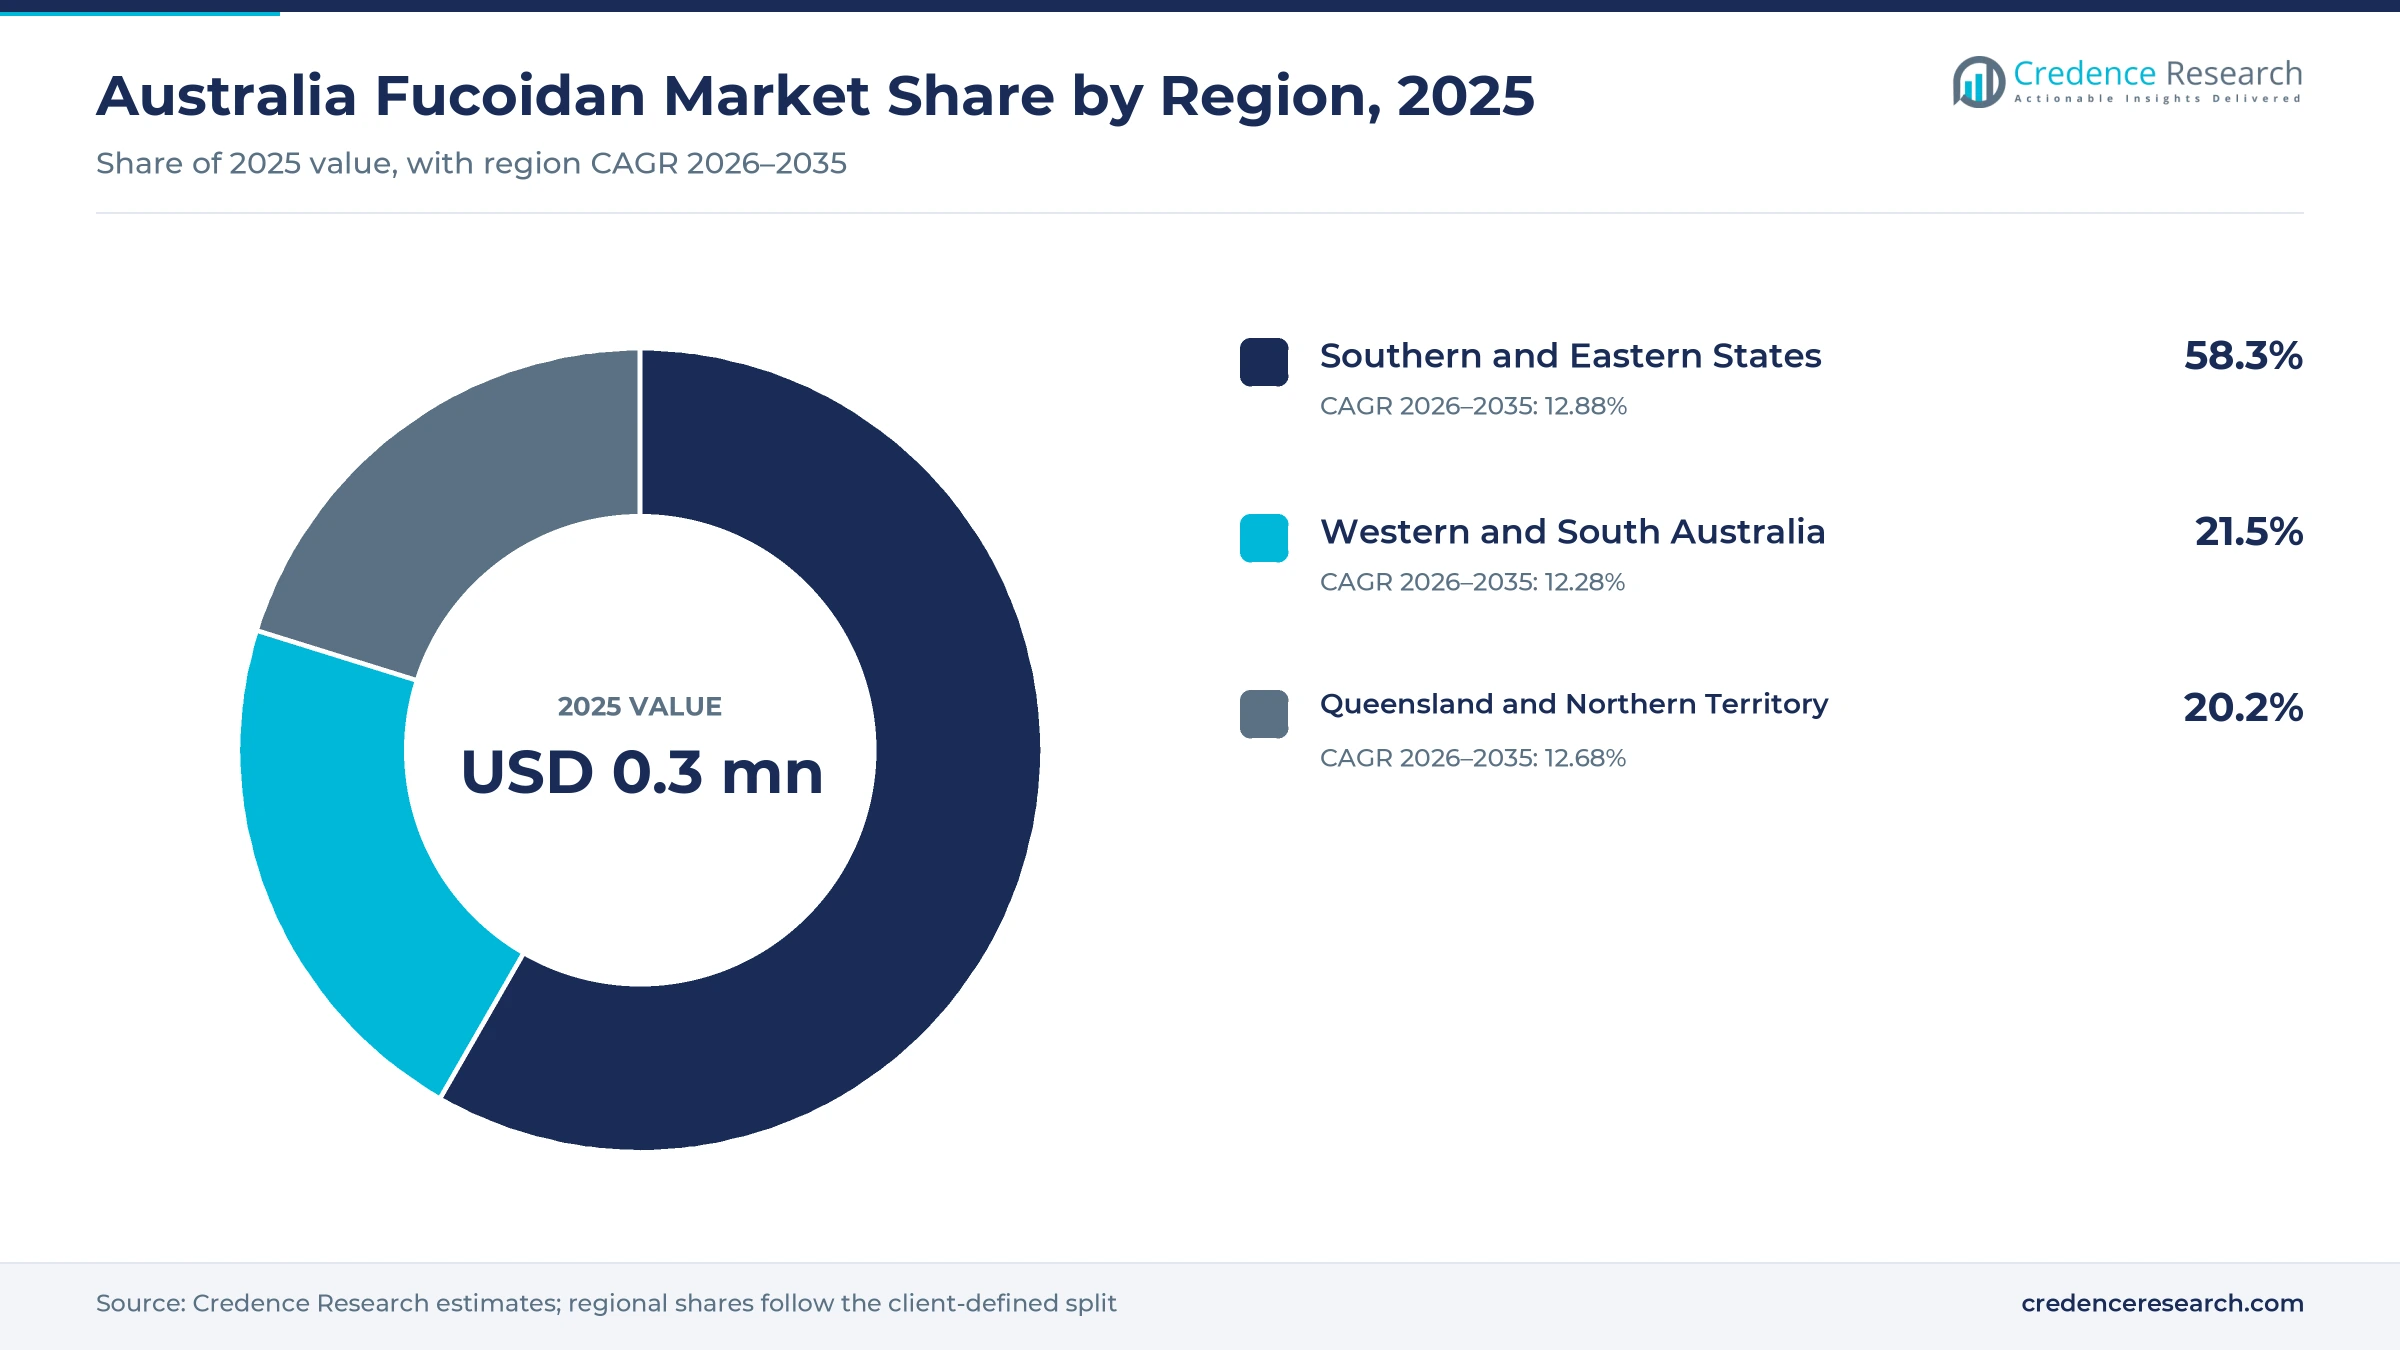
- The southern and eastern states held a 58.3% share of 2025 value, because harvesting, extraction and most consumer demand sit there.
- Bulk ingredient powder led with a 52.0% share of 2025 value, because brands buy standardized material and formulate finished goods themselves.
- A placebo-controlled trial in 88 men reported a 3.40 point fall in urinary symptom score after 90 days on 1,000 mg a day.
- Specialist digital sales grow fastest at 13.65% a year during 2026–2035, as brands sell directly to repeat wellness buyers.
Bulk ingredients lead while topical products gain
Why does bulk ingredient powder lead?
Based on product type, the market is categorized into bulk fucoidan ingredients, finished oral formulations and finished topical formulations. Bulk Fucoidan Ingredients led with a 52.0% share of 2025 value, because brand owners prefer to buy characterized powder and control their own formulas. Finished Topical Formulations grow fastest at 13.47% a year, as cosmetic makers add the extract to serums and creams.
Which uses absorb the most extract?
Based on application, the market is categorized into nutritional wellness, skin care and research and animal health. Nutritional Wellness led with a 61.0% share of 2025 value, because immune, gut and healthy ageing products carry the largest consumer volumes. Skin Care grows fastest at 13.57% a year, as topical and beauty-from-within launches increase across pharmacy and online ranges.
Which seaweed species supply the extract?
Based on source species, the market is categorized into Undaria pinnatifida, Fucus vesiculosus, Cladosiphon okamuranus and Saccharina species. Undaria pinnatifida led with a 56.0% share of 2025 value, because it is harvested in Tasmanian waters and carries the deepest research record. Saccharina Species grow fastest at 13.19% a year, as farmed kelp supply develops in southern waters and formulators test blends of more than one species.
How does the extract reach buyers?
Based on distribution channel, the market is categorized into direct contract supply, specialist digital sales and pharmacy and practitioner sales. Direct Contract Supply led with a 58.0% share of 2025 value, because ingredient buyers order against technical specifications. Specialist Digital Sales grow fastest at 13.65% a year, as brands build subscription ranges and reach repeat buyers without a retail intermediary in each state.
| Segment Group | Leading Sub-segment | Share, 2025 | Fastest-growing Sub-segment | CAGR, 2026–2035 |
|---|---|---|---|---|
| By Product Type | Bulk Fucoidan Ingredients | 52.0% | Finished Topical Formulations | 13.47% |
| By Application | Nutritional Wellness | 61.0% | Skin Care | 13.57% |
| By Source Species | Undaria pinnatifida | 56.0% | Saccharina Species | 13.19% |
| By Distribution Channel | Direct Contract Supply | 58.0% | Specialist Digital Sales | 13.65% |
Request a Free Sample
Fill in your details and we'll send you a free sample report.
- Sample data tables & charts
- Research methodology
Extraction capacity, wellness buying and trial results
How does extraction capacity support supply?
Completed extraction capacity supports supply, because buyers only sign contracts when volumes are certain. Marinova finished a 5 million dollar expansion of its Tasmanian extraction plant in June 2024, which tripled production capacity. The project drew support from the federal Modern Manufacturing Initiative and 2 Tasmanian industry programs, and the site runs on 100% renewable energy. The company supplies brands in more than 35 countries, which spreads fixed costs across export and domestic orders. As a result, bulk fucoidan ingredients hold 52.0% of 2025 value, and domestic formulators can plan launches around secured ingredient supply rather than spot purchases.
Why does supplement buying sustain demand?
Established supplement buying sustains demand, because wellness purchases repeat month after month. A national survey of 2,019 Australian adults found that 50.3% had used a complementary medicine product in the previous 12 months, with vitamin and mineral supplements at 47.8%, as the published national survey results show. Listed products already carry the extract, including an oral capsule with 500 mg of fucoidan per dose entered on the national register under number 328307. Because buyers of ingestible beauty products already pay premium prices, nutritional wellness holds 61.0% of 2025 value and repeat orders stay steady through pharmacy, online and practitioner channels across the mainland states.
How do trial results widen product claims?
Trial results widen product claims, because brands need documented outcomes to describe specific uses. A randomized, double-blind, placebo-controlled study of 88 men aged 45 to 80 gave 1,000 mg of high-purity extract a day for 90 days, and reported a 3.40 point drop in total symptom score against 0.93 on placebo, or 28.12% against 7.97%, as the reported findings set out. Voiding and storage subscores and urinary quality of life also improved by day 90. In turn, research and animal health buyers watch these outcomes closely, while brands cite the day 90 figures, and oral products gain shelf space in pharmacy ranges and practitioner dispensaries across the larger states.
What do safety clearances open for formulators?
Safety clearances open food and cosmetic uses, because manufacturers must show a lawful basis for each application. A notice filed with United States regulators on Aug. 1, 2016, covered fucoidan concentrate from Fucus vesiculosus at up to 30 mg per serving in baked goods, soups, snack foods, imitation dairy products and seasonings, with infant and toddler foods excluded, as the filed submission states. The producer also reports European novel food approval for its organic extracts. As a result, finished topical formulations grow fastest at 13.47% a year, and food and beverage developers can trial the ingredient at low inclusion rates.
Clinical evidence, beauty uses and species supply
How is published evidence shaping purchasing?
Published evidence is shaping purchasing, because formulators ask for data before they commit to an ingredient. A laboratory study in 2021 tested extracts from 5 brown seaweed species and found that all of them cut lipopolysaccharide-induced tumor necrosis factor alpha, interleukin 1 beta and interleukin 6 in human cells, with no cytotoxic effect after 48 hours, as the peer-reviewed paper records. Lower molecular weight fractions worked at lower concentrations than the whole extracts tested beside them. The producer reports more than 5,000 published papers on the compound, including more than 550 during 2025. Because buyers read this record, nutritional wellness and research demand both hold firm across contract and retail channels.
Why are topical and beauty uses increasing?
Topical and beauty uses are rising, because the extract suits claims around inflammation and skin barrier support. Oral products already list skin health among their stated uses, and 1 widely sold capsule carries 500 mg per serving for that purpose. Cosmetic formulators work with water-soluble dry powder, which dissolves into serums and lotions without solvents. Because seaweed derived actives now appear across pharmacy skin ranges, skin care grows fastest at 13.57% a year and finished topical formulations take a larger slice of value each year through 2026–2035. Formulators also pair it with hyaluronic acid and niacinamide in serum ranges sold through pharmacy chains.
Can wider species supply lift local volumes?
Wider species supply can lift local volumes, because harvest limits cap any single feedstock. Undaria pinnatifida is established in Tasmania, Victoria and South Australia, and was first reported from eastern Tasmania in 1988, with Port Phillip Bay records from 1996, according to the national pest information system. The species is classed as a significant marine pest and spreads 5 to 10 kilometers a year, so divers harvest it in restricted east coast areas under a managed plant fishery. In turn, Saccharina species grow fastest at 13.19% a year as farmed kelp projects scale in Tasmania and South Australia under new aquaculture leases.
Is research funding opening new applications?
Research funding is opening new applications, because shared programs spread the cost of early work. Marinova expanded its research investment on March 10, 2026, with projects running at 5 Australian universities, and it holds core industry partner status in the Marine Bioproducts Cooperative Research Centre, as the company update describes. That center drew 59 million dollars of federal funding over 10 years within a program valued near 270 million dollars across about 70 partners. Because marine bioscience capacity is growing, research and animal health work widens, and new feedstock species enter trial production each year under shared funding arrangements.
Narrow supply base, claim limits and price pressure
How does a narrow supply base raise risk?
A narrow supply base raises risk, because very few plants in the country can purify the extract to ingredient grade. As a result, buyers face single-source exposure if harvest conditions, plant maintenance or shipping schedules slip. Formulators respond by holding safety stock, qualifying second suppliers offshore and writing specifications that allow more than 1 source species for the same finished product sold through pharmacy and online channels.
Why do claim rules limit marketing freedom?
Claim rules limit marketing freedom, because listed products may only use permitted wording and must hold evidence for each statement. Oral products therefore carry general wellness language while clinical work continues, and sellers must add cautions for people with thyroid, bleeding or cardiovascular conditions. In turn, brands invest in trials and dossiers, which raises launch cost and slows the pace of new product introductions.
How does the small domestic base constrain growth?
The small domestic base constrains growth, because most output has historically gone to export markets rather than local brands. As a result, national value starts from a very low level and depends on a handful of launches each year. Suppliers respond by courting contract manufacturers, pharmacy chains and practitioner groups, which builds a domestic order book alongside the established overseas accounts that already fund extraction capacity in Tasmania.
Why does price pressure slow category shift?
Price pressure slows the category shift, because high-purity extract costs more per dose than common vitamin ingredients. Retail buyers compare price per capsule, so premium formulas face resistance in discount channels. In turn, brands focus on targeted uses with documented outcomes, bundle the extract with other actives and sell through subscription models, which lift lifetime value rather than unit price alone in a crowded supplement aisle that rewards repeat purchase.
Southern and eastern states hold most of the value
| Region | Value, 2025 (USD million) | Share, 2025 | CAGR, 2026–2035 |
|---|---|---|---|
| Southern and Eastern States | 0.2 | 58.3% | 12.88% |
| Western and South Australia | 0.1 | 21.5% | 12.28% |
| Queensland and Northern Territory | 0.1 | 20.2% | 12.68% |
Why do the southern and eastern states lead?
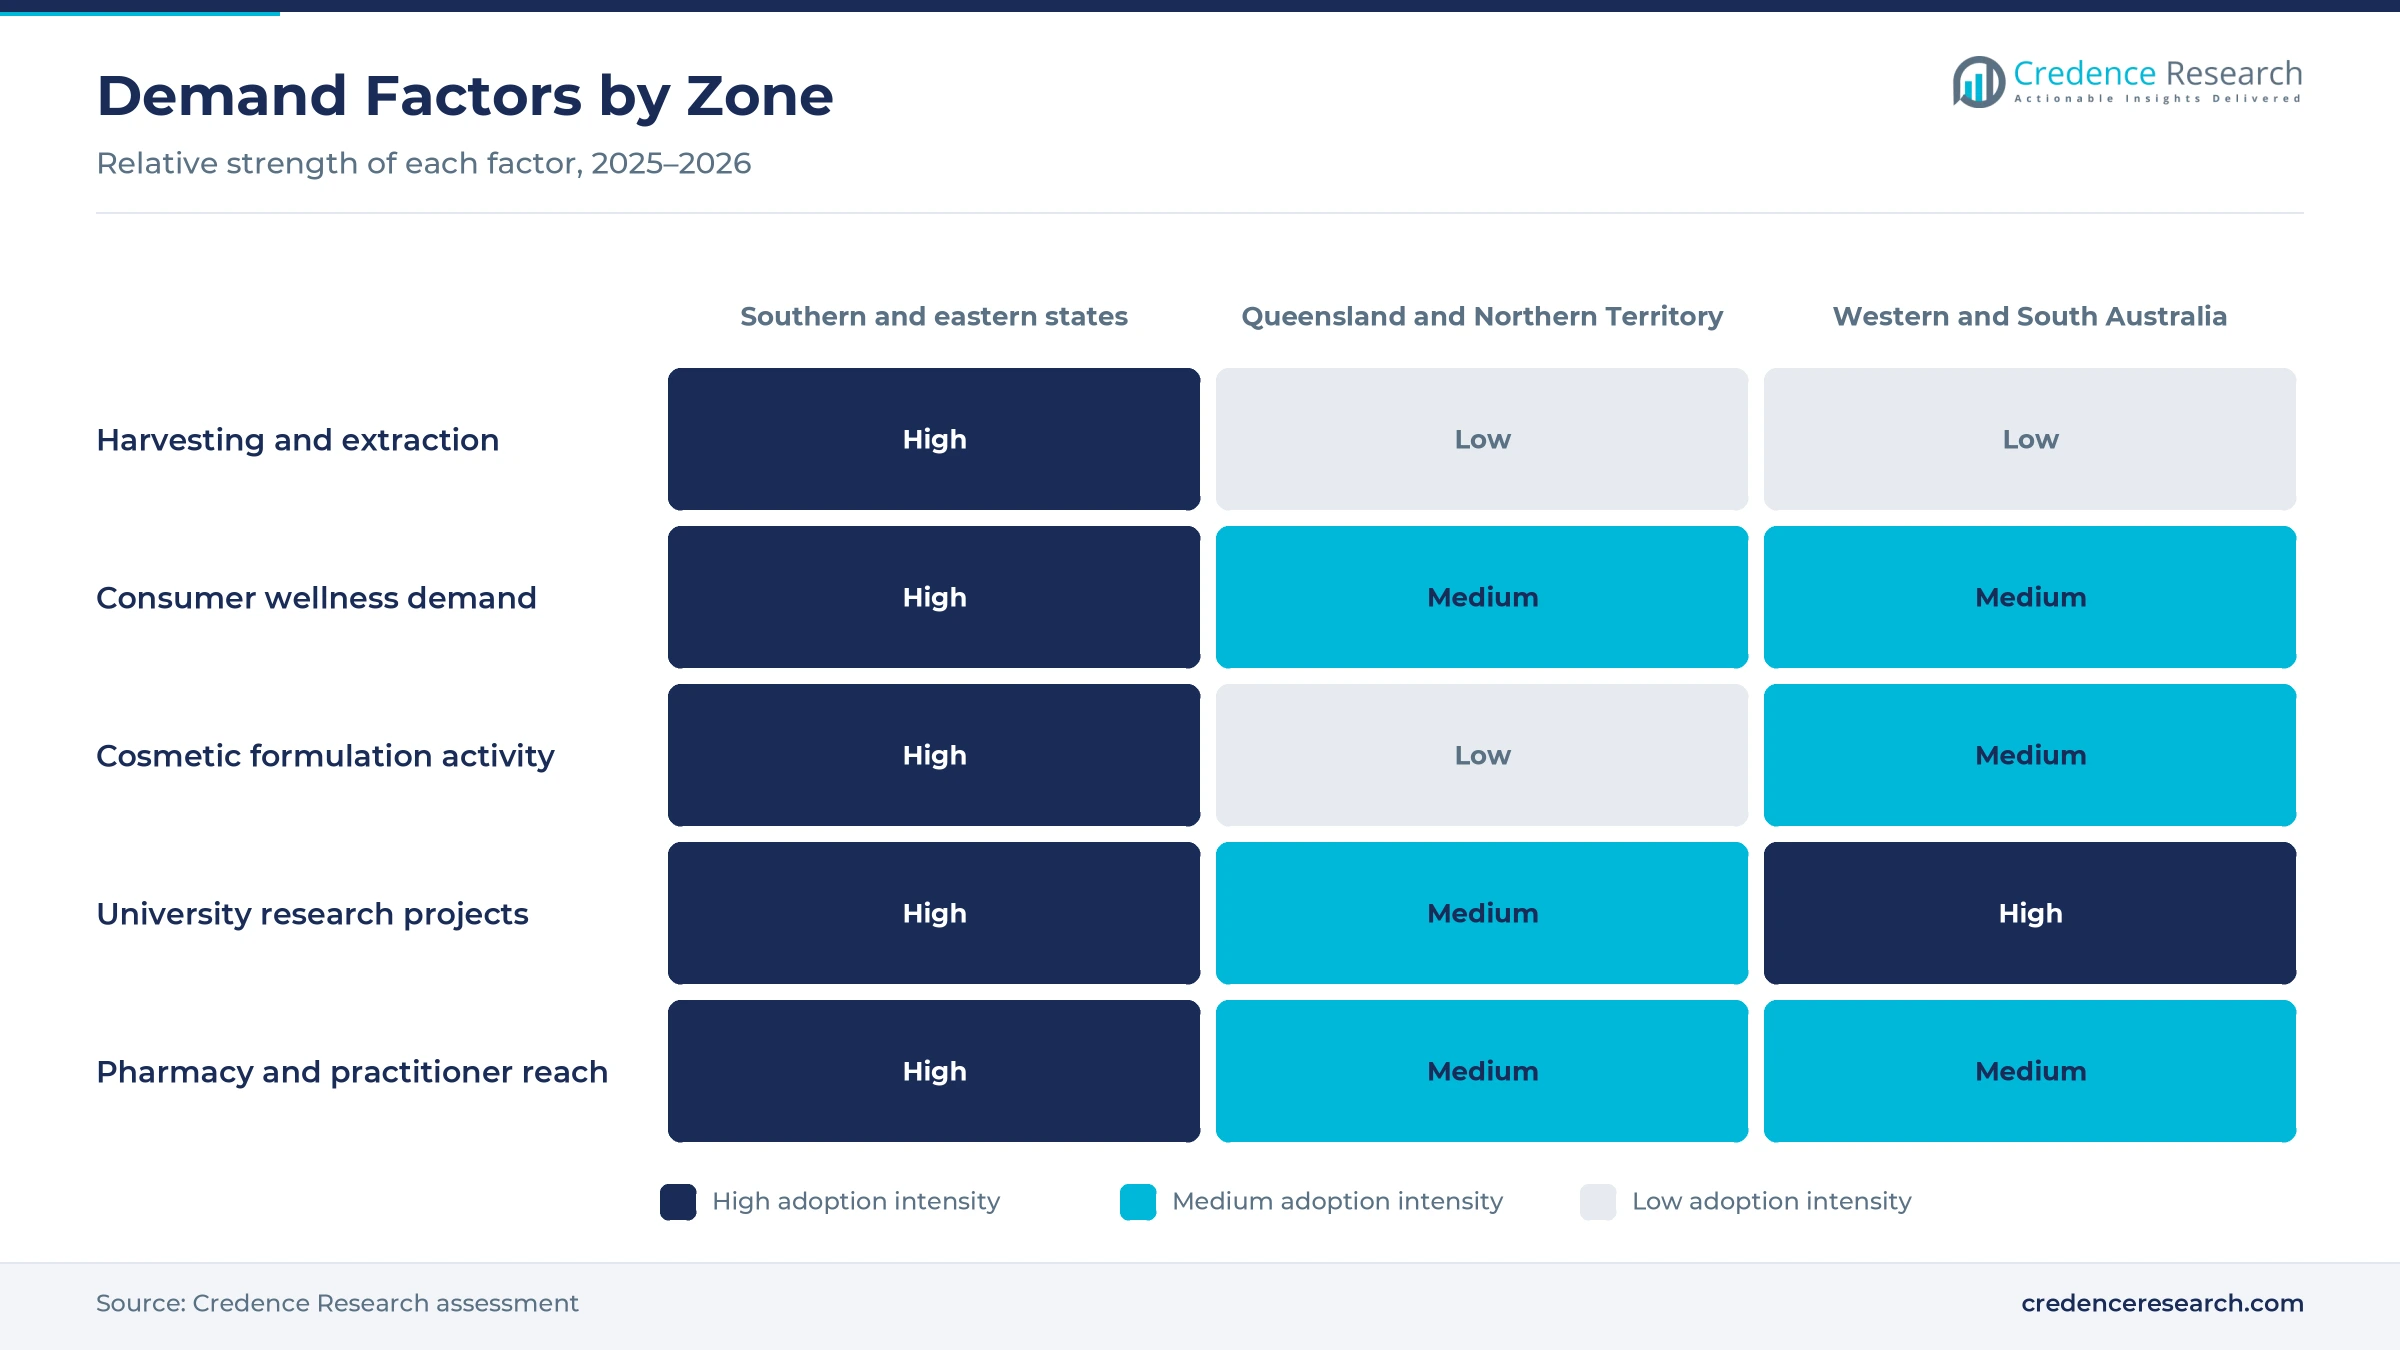
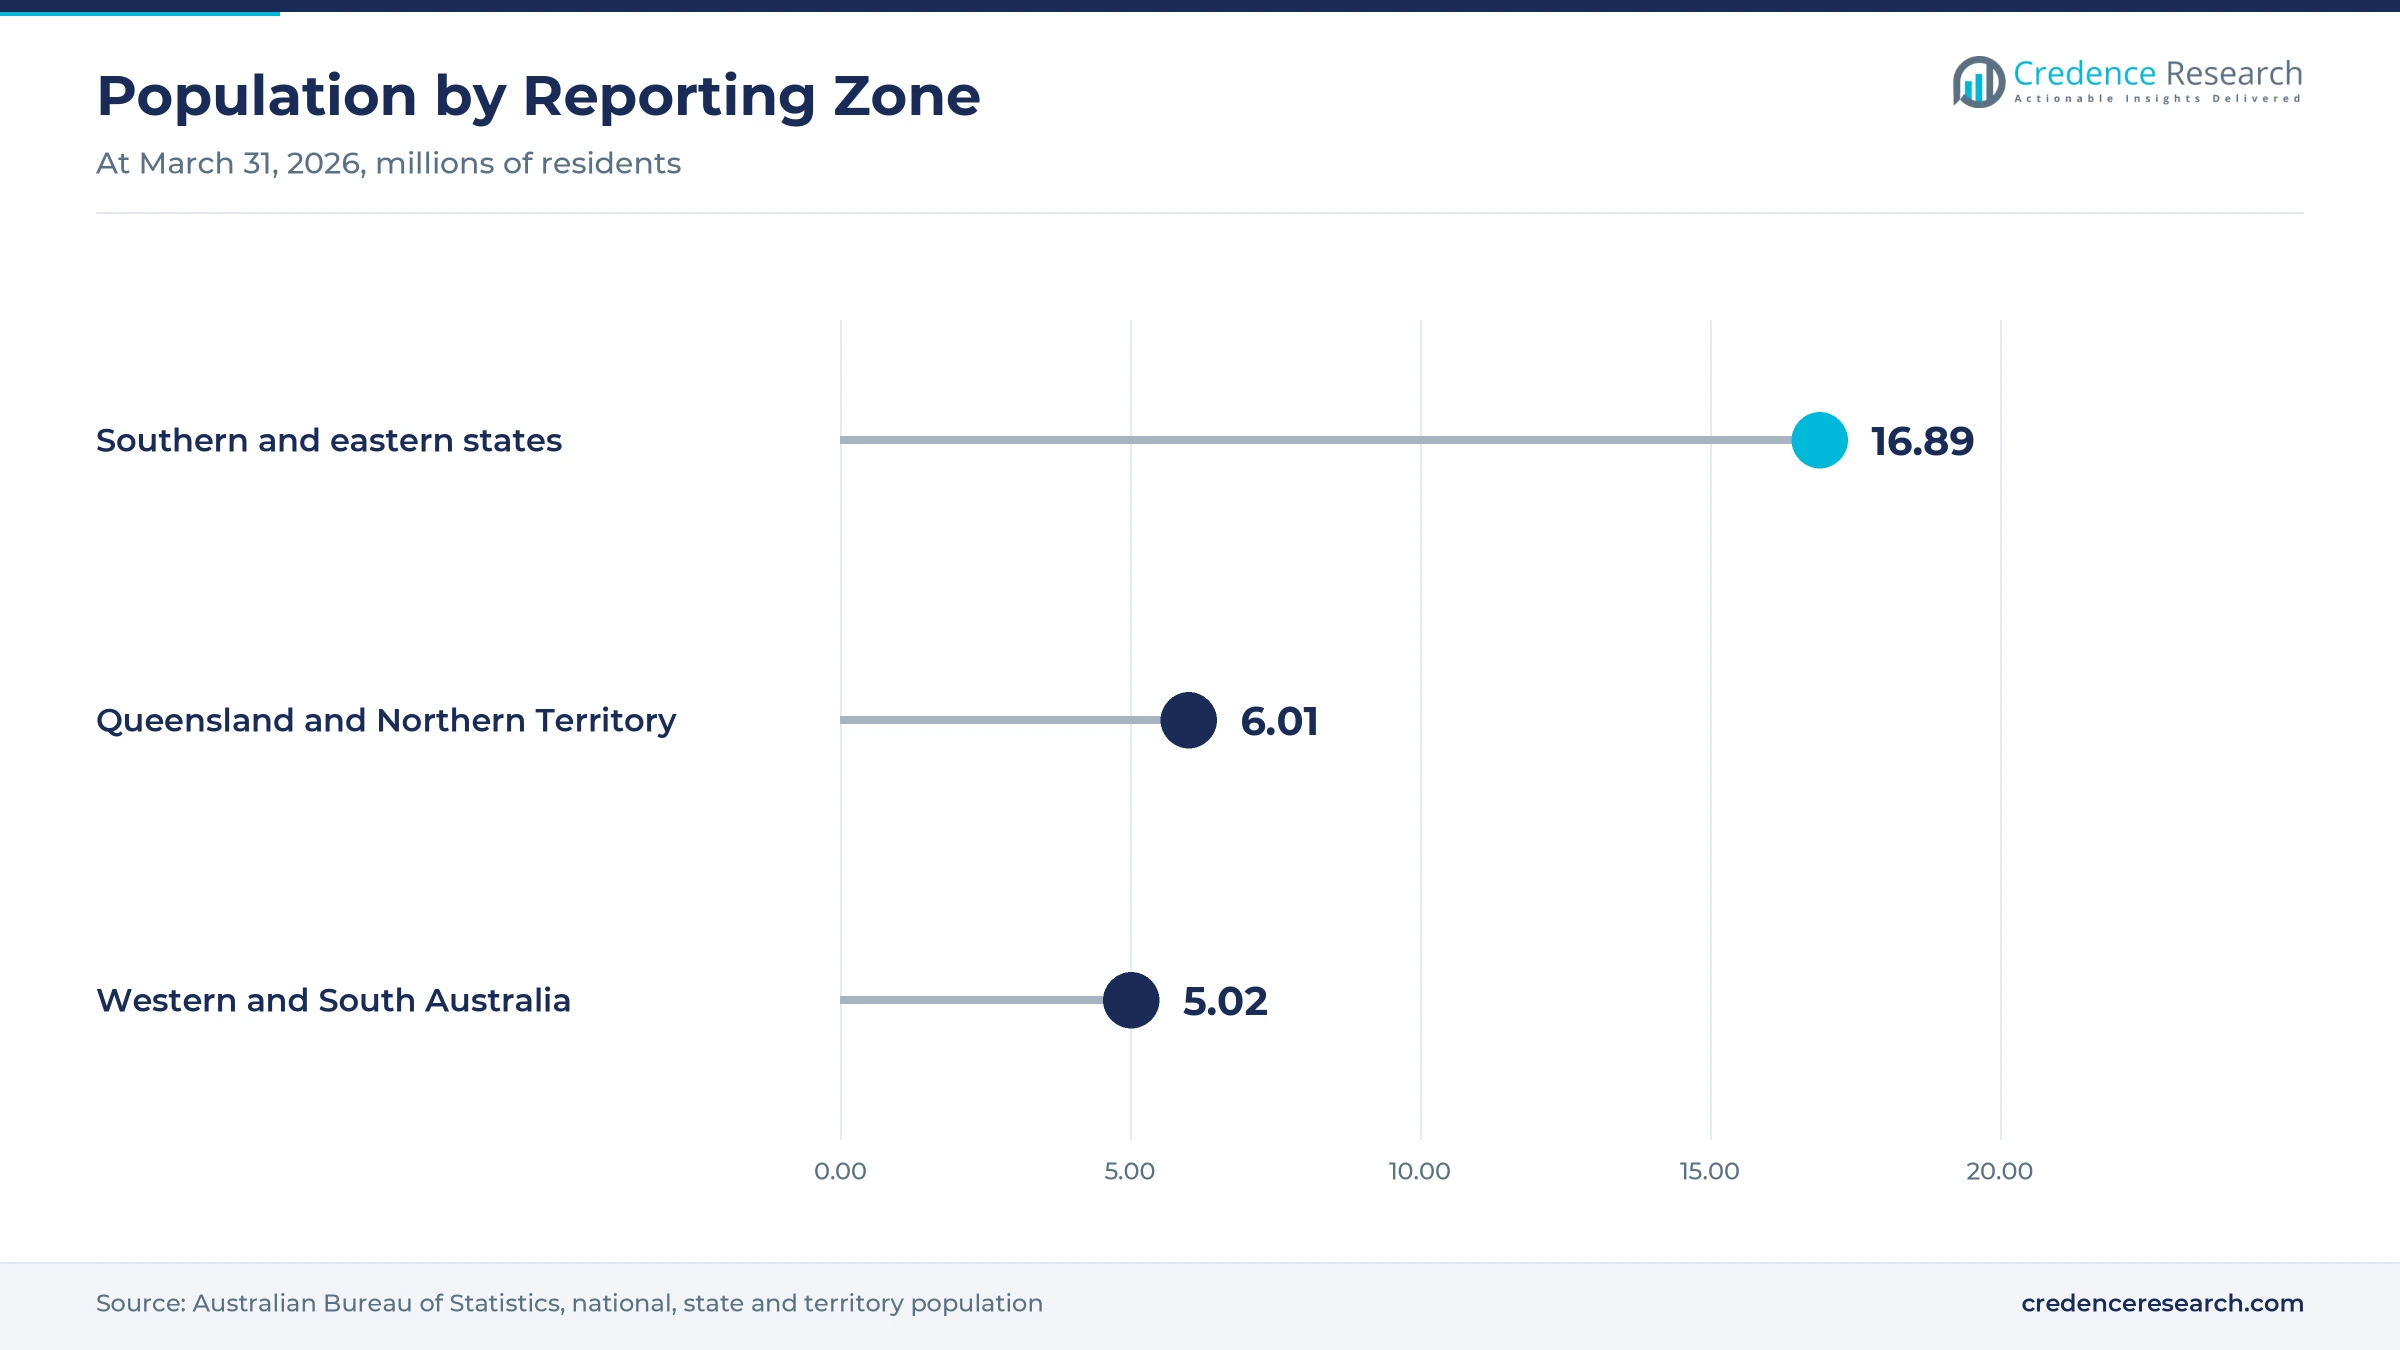
The southern and eastern states held a 58.3% share of 2025 value and grow at 12.88% a year, because Tasmanian harvesting and extraction sit inside the zone alongside the largest consumer markets. New South Wales, Victoria, Tasmania and the Australian Capital Territory together held about 16.9 million residents at the end of March 2026. Hobart hosts the extraction plant expanded in 2024, and the University of Tasmania runs related projects. As a result, contract supply and pharmacy ranges concentrate here.
What shapes Queensland and the Northern Territory?
Queensland and the Northern Territory held a 20.2% share of 2025 value and grow at 12.68% a year, because population gains and tropical aquaculture interest support wellness and animal health demand. The two jurisdictions held about 6.0 million residents at the end of March 2026, after Queensland grew 1.6% over the year. Griffith University and the University of Queensland host projects on the compound. In turn, demand leans toward finished oral products sold online.
How do Western and South Australia contribute?
Western and South Australia held a 21.5% share of 2025 value and grow at 12.28% a year, because research groups and seaweed ventures sit there while consumer volumes stay smaller. The two states held about 5.0 million residents at the end of March 2026, with Western Australia growing 2.1%, the fastest of any state. Adelaide University and Flinders University run projects on the compound. As a result, research buyers matter more here than retail ranges.
Capacity, research and trial milestones, 2024–2026
| Development | Status and market relevance |
|---|---|
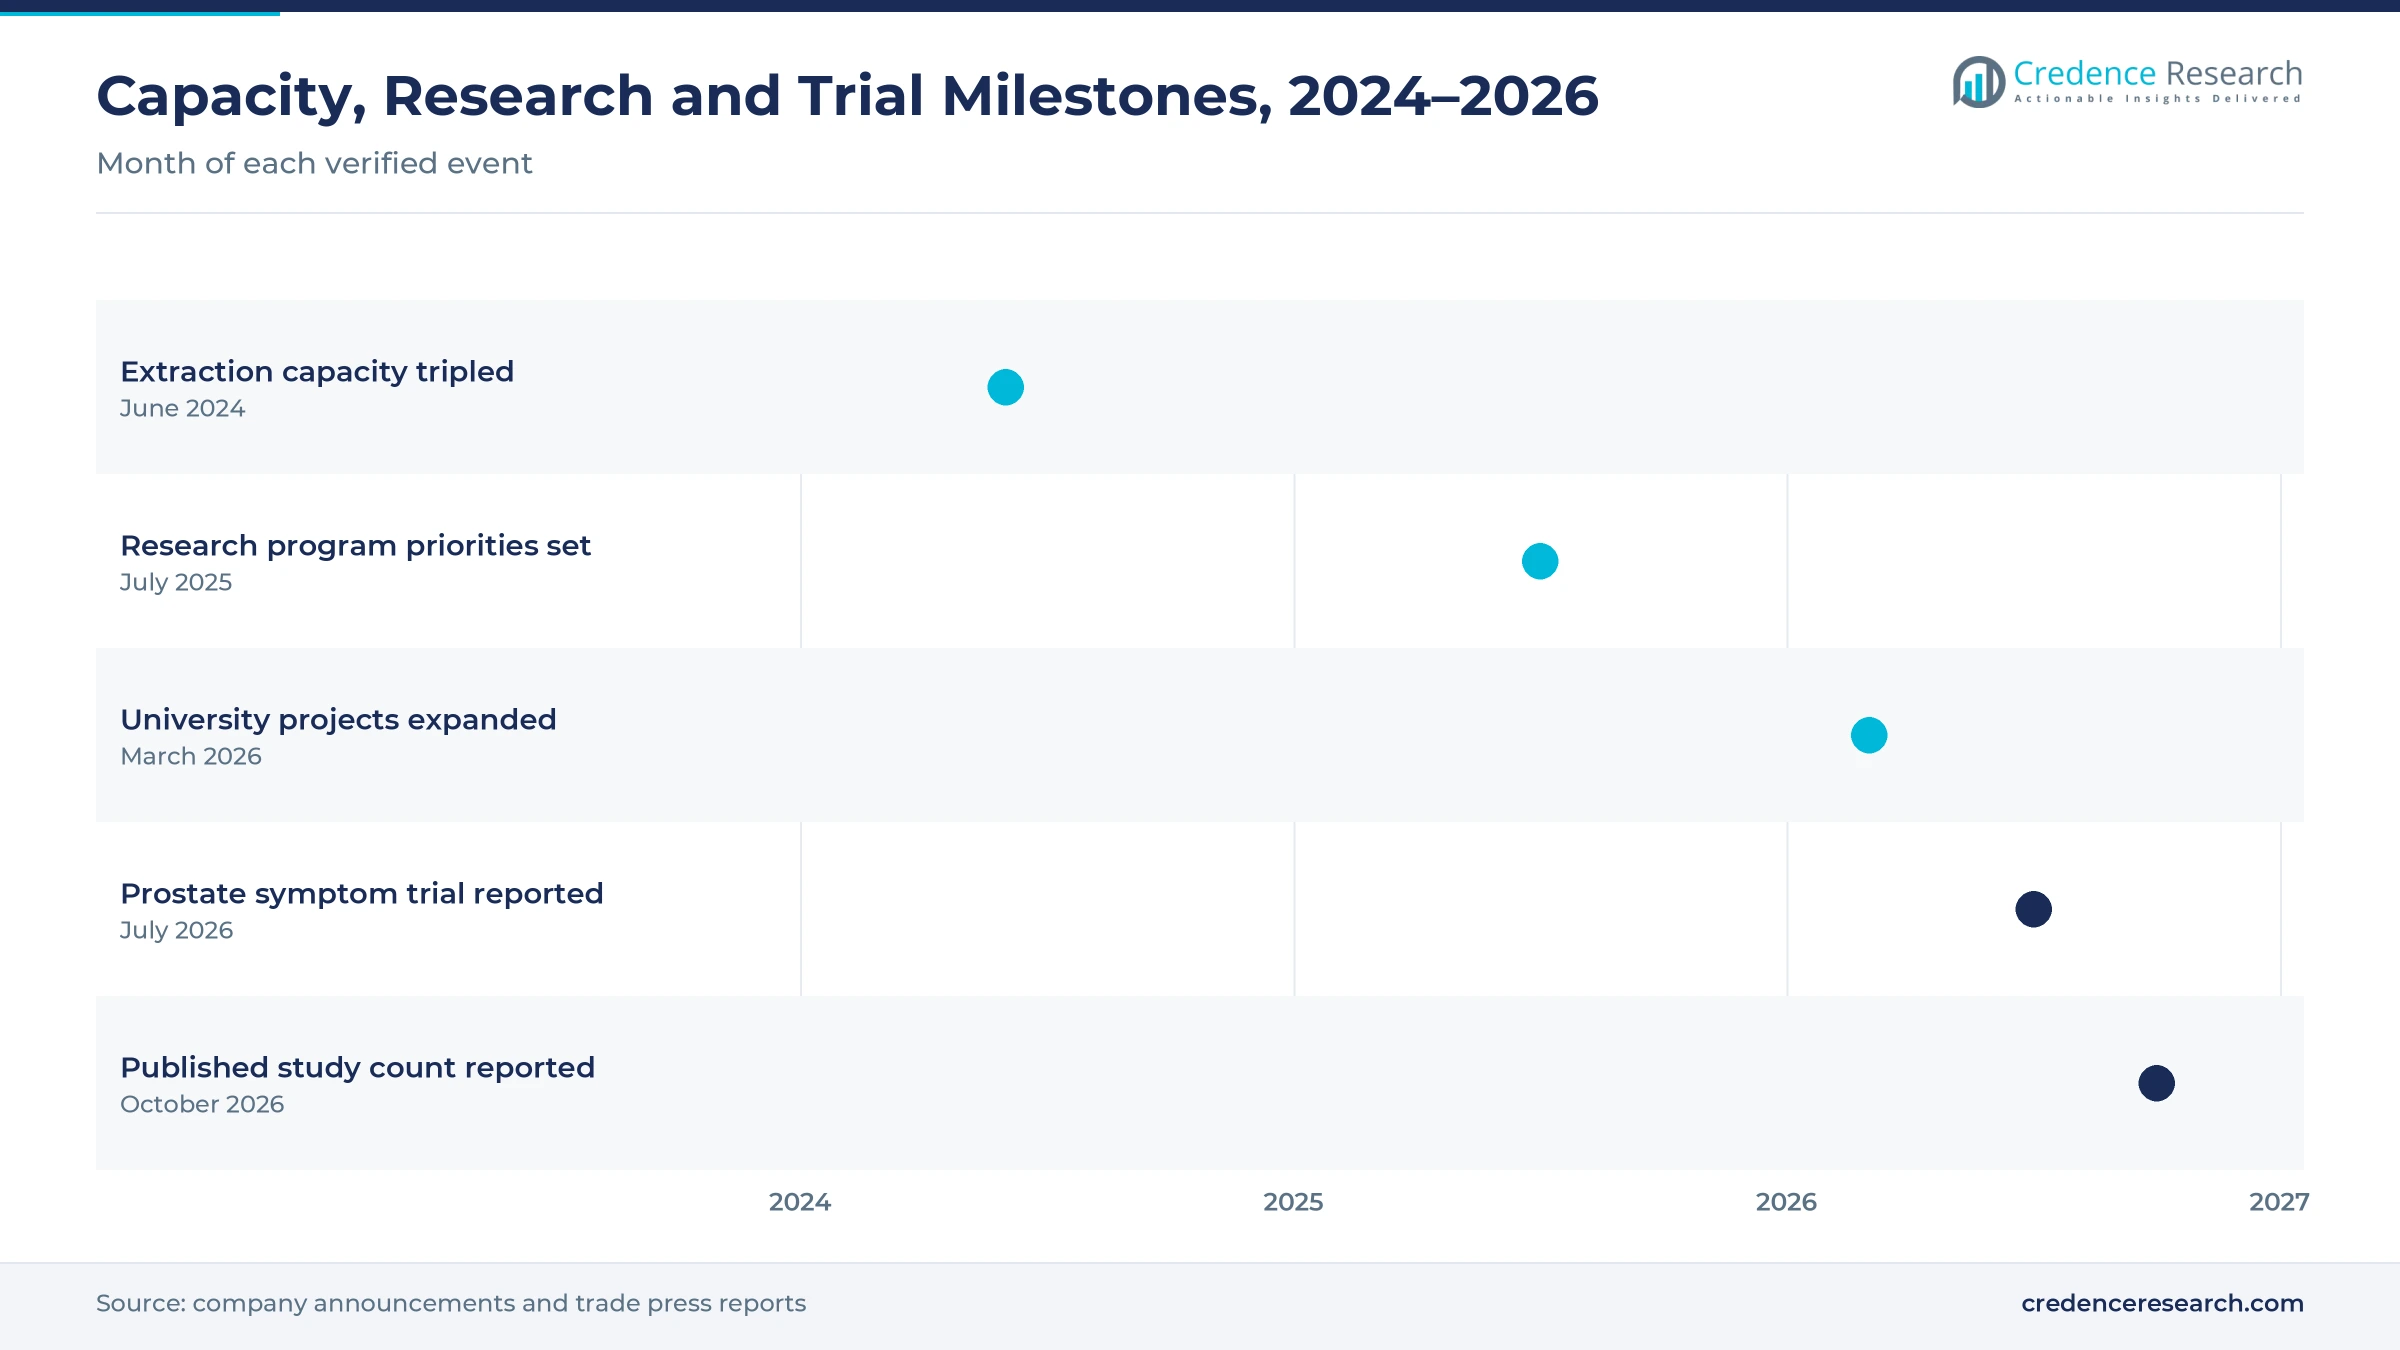
| In June 2024, Marinova completed a 5 million dollar expansion of its Tasmanian extraction plant that tripled fucoidan production capacity. | Secures ingredient volumes for brand owners |
| In July 2025, Marinova announced gut health, immune support and anti-inflammation as the core of its research program. | Directs evidence building toward mass-market uses |
| In March 2026, Marinova expanded its research investment to projects at 5 Australian universities. | Widens the national evidence base |
| In July 2026, Marinova announced results of a placebo-controlled trial in 88 men that measured urinary symptom scores over 90 days. | Opens a defined men's health positioning |
Extraction and fractionation set extract quality
- Aqueous extraction uses water rather than solvents to release the polysaccharide, which keeps the structure intact and suits organic certification.
- Molecular weight fractionation separates smaller chains that act at lower concentrations, which lets formulators target specific effects.
- Purity and identity testing measures sulfate content, sugar profile and contaminants, which gives contract manufacturers a defensible specification.
- Drying and powder handling produces a water-soluble dry powder that disperses in capsules, drinks and topical bases without heat damage.
Need a Custom Version of This Report?
Tailor the scope, geography, or segments to your exact requirements.
- Custom geography or segment scope
- Direct access to our analyst team
One large producer faces brand and import rivals
Competition pairs one established Australian producer with brand owners that buy ingredient powder and sell finished products. Marinova researches, develops and manufactures high-purity extracts under the Maritech name from Hobart, supplies brands in more than 35 countries and expanded capacity in 2024. Max Biocare sells a listed oral capsule containing 500 mg of the ingredient per dose, positioned for immune, antioxidant and skin support. SeaQuo and Marine Nature Pharmaceuticals Australia are also named in this market, although their current activity could not be confirmed for this edition. Suppliers compete on purity, documented safety clearances, species provenance and research support rather than price alone, because contract manufacturers need consistent specifications and brand owners need claim-ready evidence for each launch.
Which companies were verified for this edition?
| Company | Type | Role in the market |
|---|---|---|
| Marinova | Ingredient producer | Makes high-purity extracts in Hobart and supplies brands in more than 35 countries |
| Max Biocare | Finished product brand | Sells a listed oral capsule with 500 mg of the ingredient per dose |
Credence Research view on seaweed extract demand
Credence Research's view is that this market grows quickly from a very small base, because domestic value depends on a handful of ingredient contracts and finished product launches. Completed extraction capacity removes the main supply barrier, while trial results give brands something specific to say. Bulk ingredient supply should stay the largest pool, with skin care and specialist online sales adding the fastest growth. Suppliers that pair purity documentation with published research should capture most of the gain, because formulators treat evidence as a purchasing requirement.
How the national seaweed extract estimate was built
The report uses 2025 as the base year on a calendar basis, and Australia fucoidan market values come from the Credence Research model. That model combines national statistics, regulator records, government and marine pest databases, peer-reviewed studies and company disclosures. Segment splits and zone growth rates are Credence Research estimates, while zone shares follow the client-defined split. Sources used are official statistics, regulatory filings, published research and company announcements, and no interviews or surveys were used in preparing the estimates.
Research results and skin care carry demand to 2035
The Australia fucoidan market is expected to reach USD 19.3 million by 2035, a 12.71% CAGR during 2026–2035, as ingredient supply, research output and finished product launches build on each other. Growth should be strongest in topical formulations, skin care and specialist digital sales, because documented outcomes travel well through direct channels. Farmed kelp supply may widen the species mix after 2030. Claim rules and price resistance remain the main limits, while export orders continue to underwrite the extraction capacity that domestic brands rely on.
Frequently Asked Questions
How big is the Australia fucoidan market?
Which product type leads the market?
Which zone leads the national market?
What does clinical research show so far?
Which seaweed species supplies most extract?
Where is the ingredient cleared for food use?
Which companies supply the market?
What are the main challenges for suppliers?
Table of Content
Chapter 1 Market Segmentation
- 1.1 Segmentation Framework
- 1.1.1 Product and Service Classification
- 1.1.2 Application and End-Use Classification
- 1.1.3 Technology and Solution Classification
- 1.1.4 Customer and Distribution Channel Classification
- 1.1.5 Geographic Segmentation
- 1.1.6 Market Segment Definitions and Boundaries
- 1.2 By Product Type
- 1.2.1 Bulk Fucoidan Ingredients
- 1.2.2 Finished Oral Formulations
- 1.2.3 Finished Topical Formulations
- 1.3 By Application
- 1.3.1 Nutritional Wellness
- 1.3.2 Skin Care
- 1.3.3 Research and Animal Health
- 1.4 By Source Species
- 1.4.1 Undaria pinnatifida
- 1.4.2 Fucus vesiculosus
- 1.4.3 Cladosiphon okamuranus
- 1.4.4 Saccharina Species
Chapter 2 Introduction
- 2.1 Report Objectives and Scope
- 2.2 Product Definition and Industry Terminology
- 2.3 Market Inclusions and Exclusions
- 2.4 Research Process
- 2.4.1 Primary Research and Expert Interviews
- 2.4.2 Secondary Research and Source Review
- 2.4.3 Top-Down and Bottom-Up Estimation
- 2.4.4 Data Triangulation and Verification
- 2.5 Market Size Measurement Basis
- 2.5.1 2025: USD 0.3 million → 2035: USD 19.3 million
- 2.6 Historical and Forecast Reference Periods
- 2.6.1 Historical Period: 2018-2025
- 2.6.2 Base Year: 2025
- 2.6.3 Forecast Period: 2025-2035
- 2.7 Research Assumptions and Limitations
Chapter 3 Executive Summary
- 3.1 Market Snapshot and Key Findings
- 3.2 Base-Year Market Size, 2025
- 3.3 Forecast Market Size, 2035
- 3.4 Revenue and Volume Growth Outlook
- 3.5 Key Demand and Supply Indicators
- 3.6 Leading Market Segments
- 3.7 Fastest-Growing Market Opportunities
- 3.8 Regional Performance Highlights
- 3.9 Technology and Industry Transformation
- 3.10 Competitive Landscape Summary
- 3.11 Analyst View and Strategic Implications
Chapter 4 Australia Fucoidan Market Trends and Developments
- 4.1 Historical Industry Development, 2018-2025
- 4.2 Recent Market Trends and Developments
- 4.3 Demand and Customer Behavior Trends
- 4.4 Technology and Product Innovation
- 4.5 Artificial Intelligence, Automation and Digitalization
- 4.6 Local Manufacturing and Supply Chain Realignment
- 4.7 Industry Partnerships, Mergers and Acquisitions
- 4.8 Sustainability and Circular Economy Developments
- 4.9 Government and Private Sector Investment Trends
- 4.10 Emerging Business Models and Commercialization
- 4.11 Industry Developments and Announcements
Chapter 5 Australia Fucoidan Market Production, Supply and Demand Analysis
- 5.1 Demand Trend and Consumption Analysis, 2018-2025
- 5.2 Demand Forecast, 2025-2035
- 5.3 Production and Output Trend, 2018-2025
- 5.4 Production and Output Forecast, 2025-2035
- 5.5 Installed Capacity and Capacity Utilization
- 5.6 Company-Wise Production Plants and Statistics
- 5.6.1 Installed Production Capacity
- 5.6.2 Actual Production
- 5.6.3 Planned Capacity and Expansion Targets
- 5.7 Supply Chain Structure and Procurement Trends
- 5.8 Supply-Demand Gap and Bottlenecks
- 5.9 Import Dependence and Sourcing Structure
- 5.10 Contract Manufacturing and Outsourcing
- 5.11 Regional Supply and Demand Concentration
Chapter 6 Australia Fucoidan Market Pricing Analysis
- 6.1 Pricing Structure and Measurement
- 6.2 Historical Pricing Trends, 2018-2025
- 6.3 Pricing Outlook, 2025-2035
- 6.4 Average Selling Price and Unit Economics
- 6.5 Pricing by Product and Market Segment
- 6.6 Geographic Pricing Differences
- 6.7 Key Input, Energy, Labor and Logistics Costs
- 6.8 Contract Pricing and Purchasing Models
- 6.9 Pricing Sensitivity and Competitive Positioning
- 6.10 Price, Margin and Profitability Implications
Chapter 7 Australia Fucoidan Market Dynamics
- 7.1 Market Growth Drivers
- 7.1.1 Demand-Side Drivers
- 7.1.2 Technology and Innovation Drivers
- 7.1.3 Infrastructure and Investment Drivers
- 7.1.4 Regulatory and Policy Drivers
- 7.2 Market Restraints
- 7.2.1 Cost and Affordability Constraints
- 7.2.2 Technology and Adoption Barriers
- 7.2.3 Supply Chain and Operational Constraints
- 7.3 Market Challenges
- 7.3.1 Competitive Pressure and Margin Erosion
- 7.3.2 Skills, Infrastructure and Implementation Gaps
- 7.4 Emerging Market Opportunities
- 7.5 Market Dynamics Impact and Time-Horizon Assessment
Chapter 8 Australia Fucoidan Value Chain Analysis
- 8.1 Industry Value Chain Overview
- 8.2 Upstream Suppliers and Critical Inputs
- 8.3 Technology and Component Providers
- 8.4 Manufacturing or Service Delivery
- 8.5 Distribution, Channel Partners and Integrators
- 8.6 Downstream Applications and End Users
- 8.7 Value Addition and Profit Pools
- 8.8 Vertical Integration and Outsourcing
- 8.9 Supplier Concentration and Risk
- 8.10 Supply Chain Localization and Resilience
Chapter 9 Australia Fucoidan Market Regulations and Policies
- 9.1 Relevant Laws, Standards and Compliance Frameworks
- 9.2 Product, Service, Safety and Quality Requirements
- 9.3 Government Policies, Incentives and Subsidies
- 9.4 Imports, Exports and Trade Barriers
- 9.5 Public Procurement and Local Content Requirements
- 9.6 Environmental and Sustainability Compliance
- 9.7 Upcoming Policy Changes and Market Implications
Chapter 10 Australia Fucoidan Market Hotspots and Opportunities
- 10.1 Market Opportunity Mapping and Growth Hotspots
- 10.2 High-Growth Applications and Customer Groups
- 10.3 Underserved Markets and White-Space Opportunities
- 10.4 Emerging Technology and Product Opportunities
- 10.5 New Capacity and Investment Hotspots
- 10.6 Market Entry and Expansion Opportunities
- 10.7 Distribution and Partnership Opportunities
- 10.8 Near-Term and Long-Term Commercial Potential
- 10.9 Opportunity Attractiveness and Execution Risks
Chapter 11 Australia Fucoidan Market Outlook, 2025-2035
- 11.1 Market Size and Analysis
- 11.1.1 Revenue (Market Measurement: 2025: USD 0.3 million → 2035: USD 19.3 million)
- 11.1.2 Market Volume and Quantity Sold
- 11.1.3 Historical Market Size, 2018-2025
- 11.1.4 Base-Year Market Size, 2025
- 11.2 Market Forecast, 2025-2035
- 11.2.1 Revenue Forecast to 2035
- 11.2.2 Volume Forecast to 2035
- 11.2.3 CAGR and Year-on-Year Growth
- 11.2.4 Incremental Revenue Opportunity
- 11.3 Forecast Assumptions and Scenario Analysis
- 11.3.1 Base-Case Forecast
- 11.3.2 Optimistic and Conservative Scenarios
- 11.3.3 Technology, Pricing and Policy Sensitivities
- 11.4 Market Attractiveness and Growth Outlook
Chapter 12 Australia Fucoidan Market Segmentation and Outlook
- 12.1 Segmentation Summary and Market Shares, 2025
- 12.2 Largest and Fastest-Growing Segments
- 12.3 By Product Type - Market Size and Forecast, 2025-2035
- 12.3.1 Segment Definition and Scope
- 12.3.2 Historical Market Size, 2018-2025
- 12.3.3 Revenue Forecast, 2025-2035
- 12.3.4 Volume Forecast, 2025-2035
- 12.3.5 Base-Year Market Share, 2025
- 12.3.6 Segment CAGR and Growth Drivers
- 12.3.7 Subsegment Market Size and Forecast
- 12.3.7.1 Bulk Fucoidan Ingredients
- 12.3.7.2 Finished Oral Formulations
- 12.3.7.3 Finished Topical Formulations
- 12.3.8 Subsegment Pricing and Adoption Trends
- 12.3.9 Leading Suppliers and Competition
- 12.3.10 Regional Demand and Opportunities
- 12.4 By Application - Market Size and Forecast, 2025-2035
- 12.4.1 Segment Definition and Scope
- 12.4.2 Historical Market Size, 2018-2025
- 12.4.3 Revenue Forecast, 2025-2035
- 12.4.4 Volume Forecast, 2025-2035
- 12.4.5 Base-Year Market Share, 2025
- 12.4.6 Segment CAGR and Growth Drivers
- 12.4.7 Subsegment Market Size and Forecast
- 12.4.7.1 Nutritional Wellness
- 12.4.7.2 Skin Care
- 12.4.7.3 Research and Animal Health
- 12.4.8 Subsegment Pricing and Adoption Trends
- 12.4.9 Leading Suppliers and Competition
- 12.4.10 Regional Demand and Opportunities
- 12.5 By Source Species - Market Size and Forecast, 2025-2035
- 12.5.1 Segment Definition and Scope
- 12.5.2 Historical Market Size, 2018-2025
- 12.5.3 Revenue Forecast, 2025-2035
- 12.5.4 Volume Forecast, 2025-2035
- 12.5.5 Base-Year Market Share, 2025
- 12.5.6 Segment CAGR and Growth Drivers
- 12.5.7 Subsegment Market Size and Forecast
- 12.5.7.1 Undaria pinnatifida
- 12.5.7.2 Fucus vesiculosus
- 12.5.7.3 Cladosiphon okamuranus
- 12.5.7.4 Saccharina Species
- 12.5.8 Subsegment Pricing and Adoption Trends
- 12.5.9 Leading Suppliers and Competition
- 12.5.10 Regional Demand and Opportunities
- 12.6 Segment Growth Comparison
- 12.7 Segment Attractiveness and Priority Matrix
Chapter 13 Australia Fucoidan End-Use and Application Market Outlook
- 13.1 End-Use Industry and Customer Demand Structure
- 13.2 Leading Applications and Customer Groups
- 13.3 End-Use Market Size, Share and Forecast
- 13.4 Major End-Use Industry Deep Dives
- 13.4.1 Customer Requirements and Use Cases
- 13.4.2 Demand and Replacement Cycles
- 13.4.3 Technical and Regulatory Considerations
- 13.4.4 Purchasing and Procurement Models
- 13.4.5 Leading Vendors and Distribution Channels
- 13.4.6 Forecast and Commercial Opportunities
- 13.5 Emerging Applications and Cross-Segment Demand
- 13.6 End-Use Industry Investment Priorities
Chapter 14 Australia Fucoidan Geographic Market Outlook, 2025-2035
- 14.1 Domestic Market Distribution and Demand Clusters
- 14.2 State- or Province-Wise Market Size and Forecast, 2025-2035
- 14.3 City and Metropolitan Market Outlook
- 14.4 Industrial, Manufacturing and Commercial Clusters
- 14.5 Geographic Concentration of Key End Users
- 14.6 Local Pricing and Purchasing Differences
- 14.7 Domestic Production Facilities and Capacity Map
- 14.8 Local Infrastructure and Project Pipeline
- 14.9 State-Level Policy and Incentive Differences
- 14.10 Subnational Investment Hotspots and Opportunities
- 14.11 Distribution and Logistics Networks
- 14.12 Domestic Competitive Footprint
Chapter 15 Australia Fucoidan Technology, Innovation and Sustainability Outlook
- 15.1 Technology Landscape and Maturity
- 15.2 Product, Process and Service Innovation
- 15.3 AI, Automation and Digital Tools in the Industry
- 15.4 Technology Adoption and Performance Benchmarking
- 15.5 Innovation Pipeline and R&D Investment
- 15.6 Patent and Intellectual Property Trends
- 15.7 Energy Efficiency and Resource Management
- 15.8 Sustainability, Recycling and Circularity
- 15.9 Technology Roadmap, 2025-2035
- 15.10 Risks of Obsolescence and Technology Substitution
Chapter 16 Australia Fucoidan Market Key Strategic Imperatives
- 16.1 Growth and Market Entry Priorities
- 16.2 High-Return Products and Segments
- 16.3 Pricing, Profitability and Cost Optimization
- 16.4 Technology Investment and Product Differentiation
- 16.5 Supply Chain Localization and Resilience
- 16.6 Distribution and Customer Acquisition
- 16.7 Partnership, Acquisition and Capacity Strategy
- 16.8 Regional Expansion Priorities
- 16.9 Short-, Medium- and Long-Term Actions
Chapter 17 Competition Outlook
- 17.1 Industry Competition Characteristics
- 17.2 Market Structure and Concentration
- 17.3 Market Share and Competitive Positioning, 2025
- 17.4 Company-Wise Revenue and Product Benchmarking
- 17.5 Production and Service Capacity Benchmarking
- 17.6 Technology, Pricing and Differentiation
- 17.7 Regional Footprint and Distribution Strength
- 17.8 Mergers, Acquisitions and Strategic Alliances
- 17.9 New Entrants and Competitive Threats
- 17.10 Porter's Five Forces and Industry Attractiveness
- 17.11 Competitive Outlook, 2025-2035
Chapter 18 Company Profiles
- 18.1 Company Coverage and Selection Criteria
- 18.2 Marinova
- 18.2.1 Business Description
- 18.2.2 Company Ownership and Geographic Presence
- 18.2.3 Product and Service Portfolio
- 18.2.4 Manufacturing and Operating Footprint
- 18.2.5 Production Capacity and Expansion Plans
- 18.2.6 Financial Performance and Investment
- 18.2.7 Market Share and Competitive Position
- 18.2.8 Technology and Innovation Capabilities
- 18.2.9 Strategic Alliances or Partnerships
- 18.2.10 Recent Developments
- 18.2.11 Growth Strategy and Outlook
- 18.3 Max Biocare
- 18.4 SeaQuo
- 18.5 Marine Nature Pharmaceuticals Australia
- 18.6 Other Relevant Market Participants
Note: Every listed company is profiled on the structure shown under the first company. The company list is preliminary and may change based on research findings, market developments, data availability and client requirements.
Chapter 19 Disclaimer
- 19.1 Research and Forecast Disclaimer
- 19.2 Data Source and Estimation Limitations
Note: The depth of individual sections depends on data availability for this market. Volume, capacity, trade and other unit-based metrics are included where applicable.

