
Tourists, licensed bars and new brands shape demand
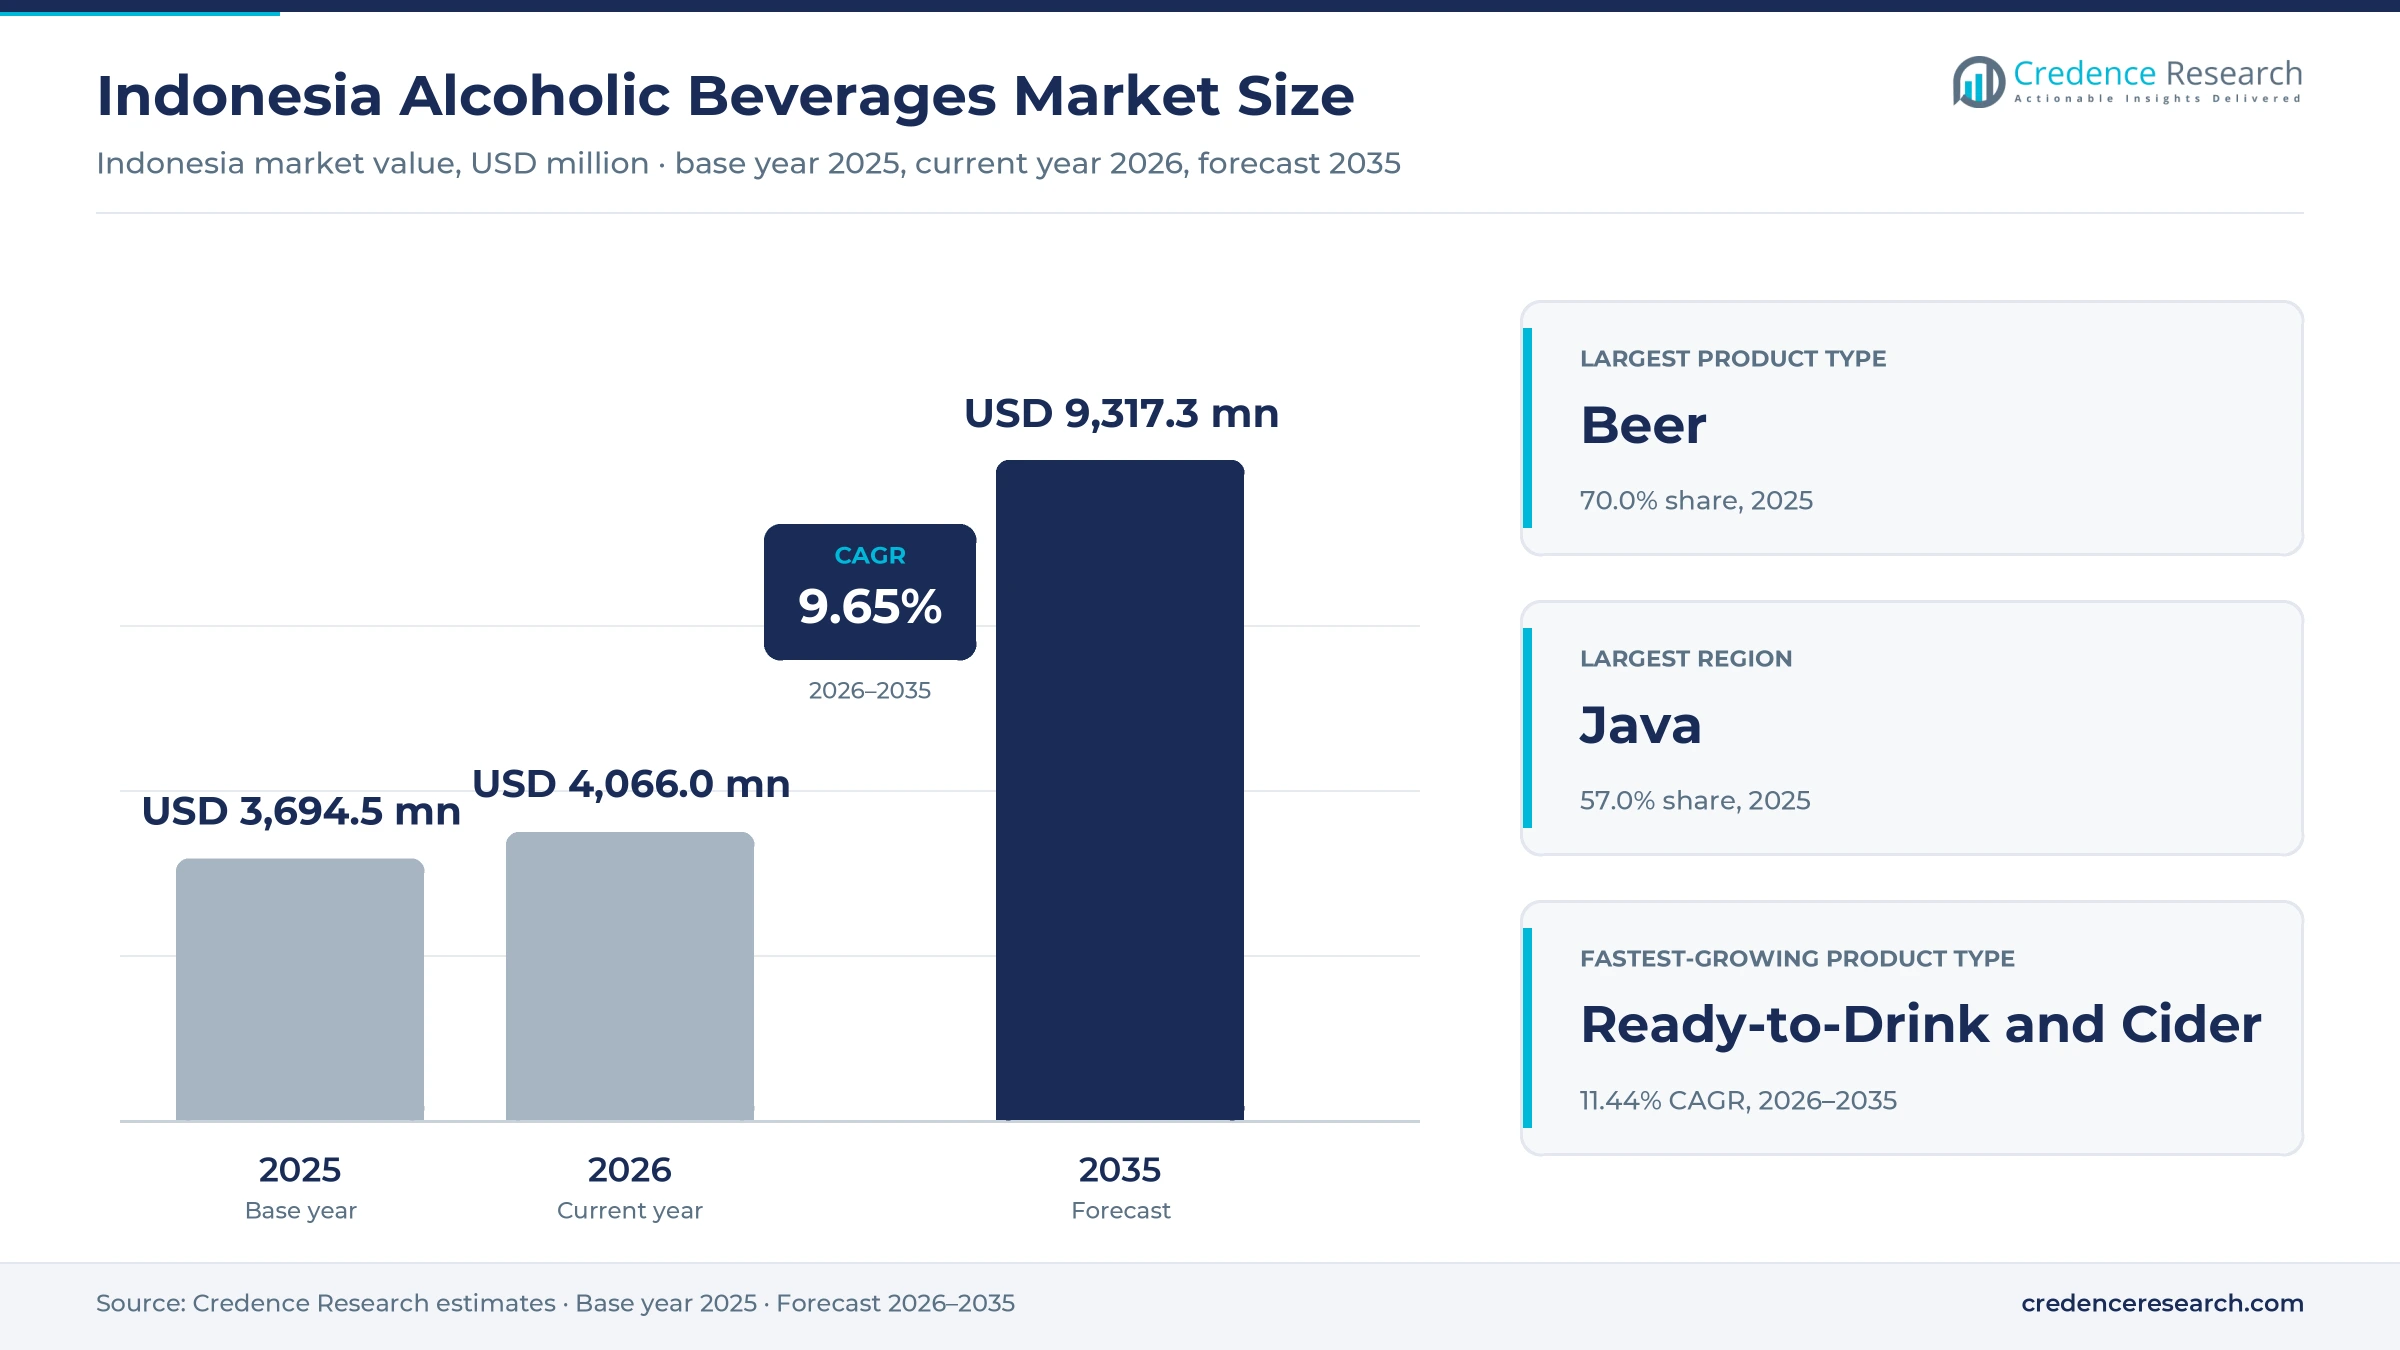
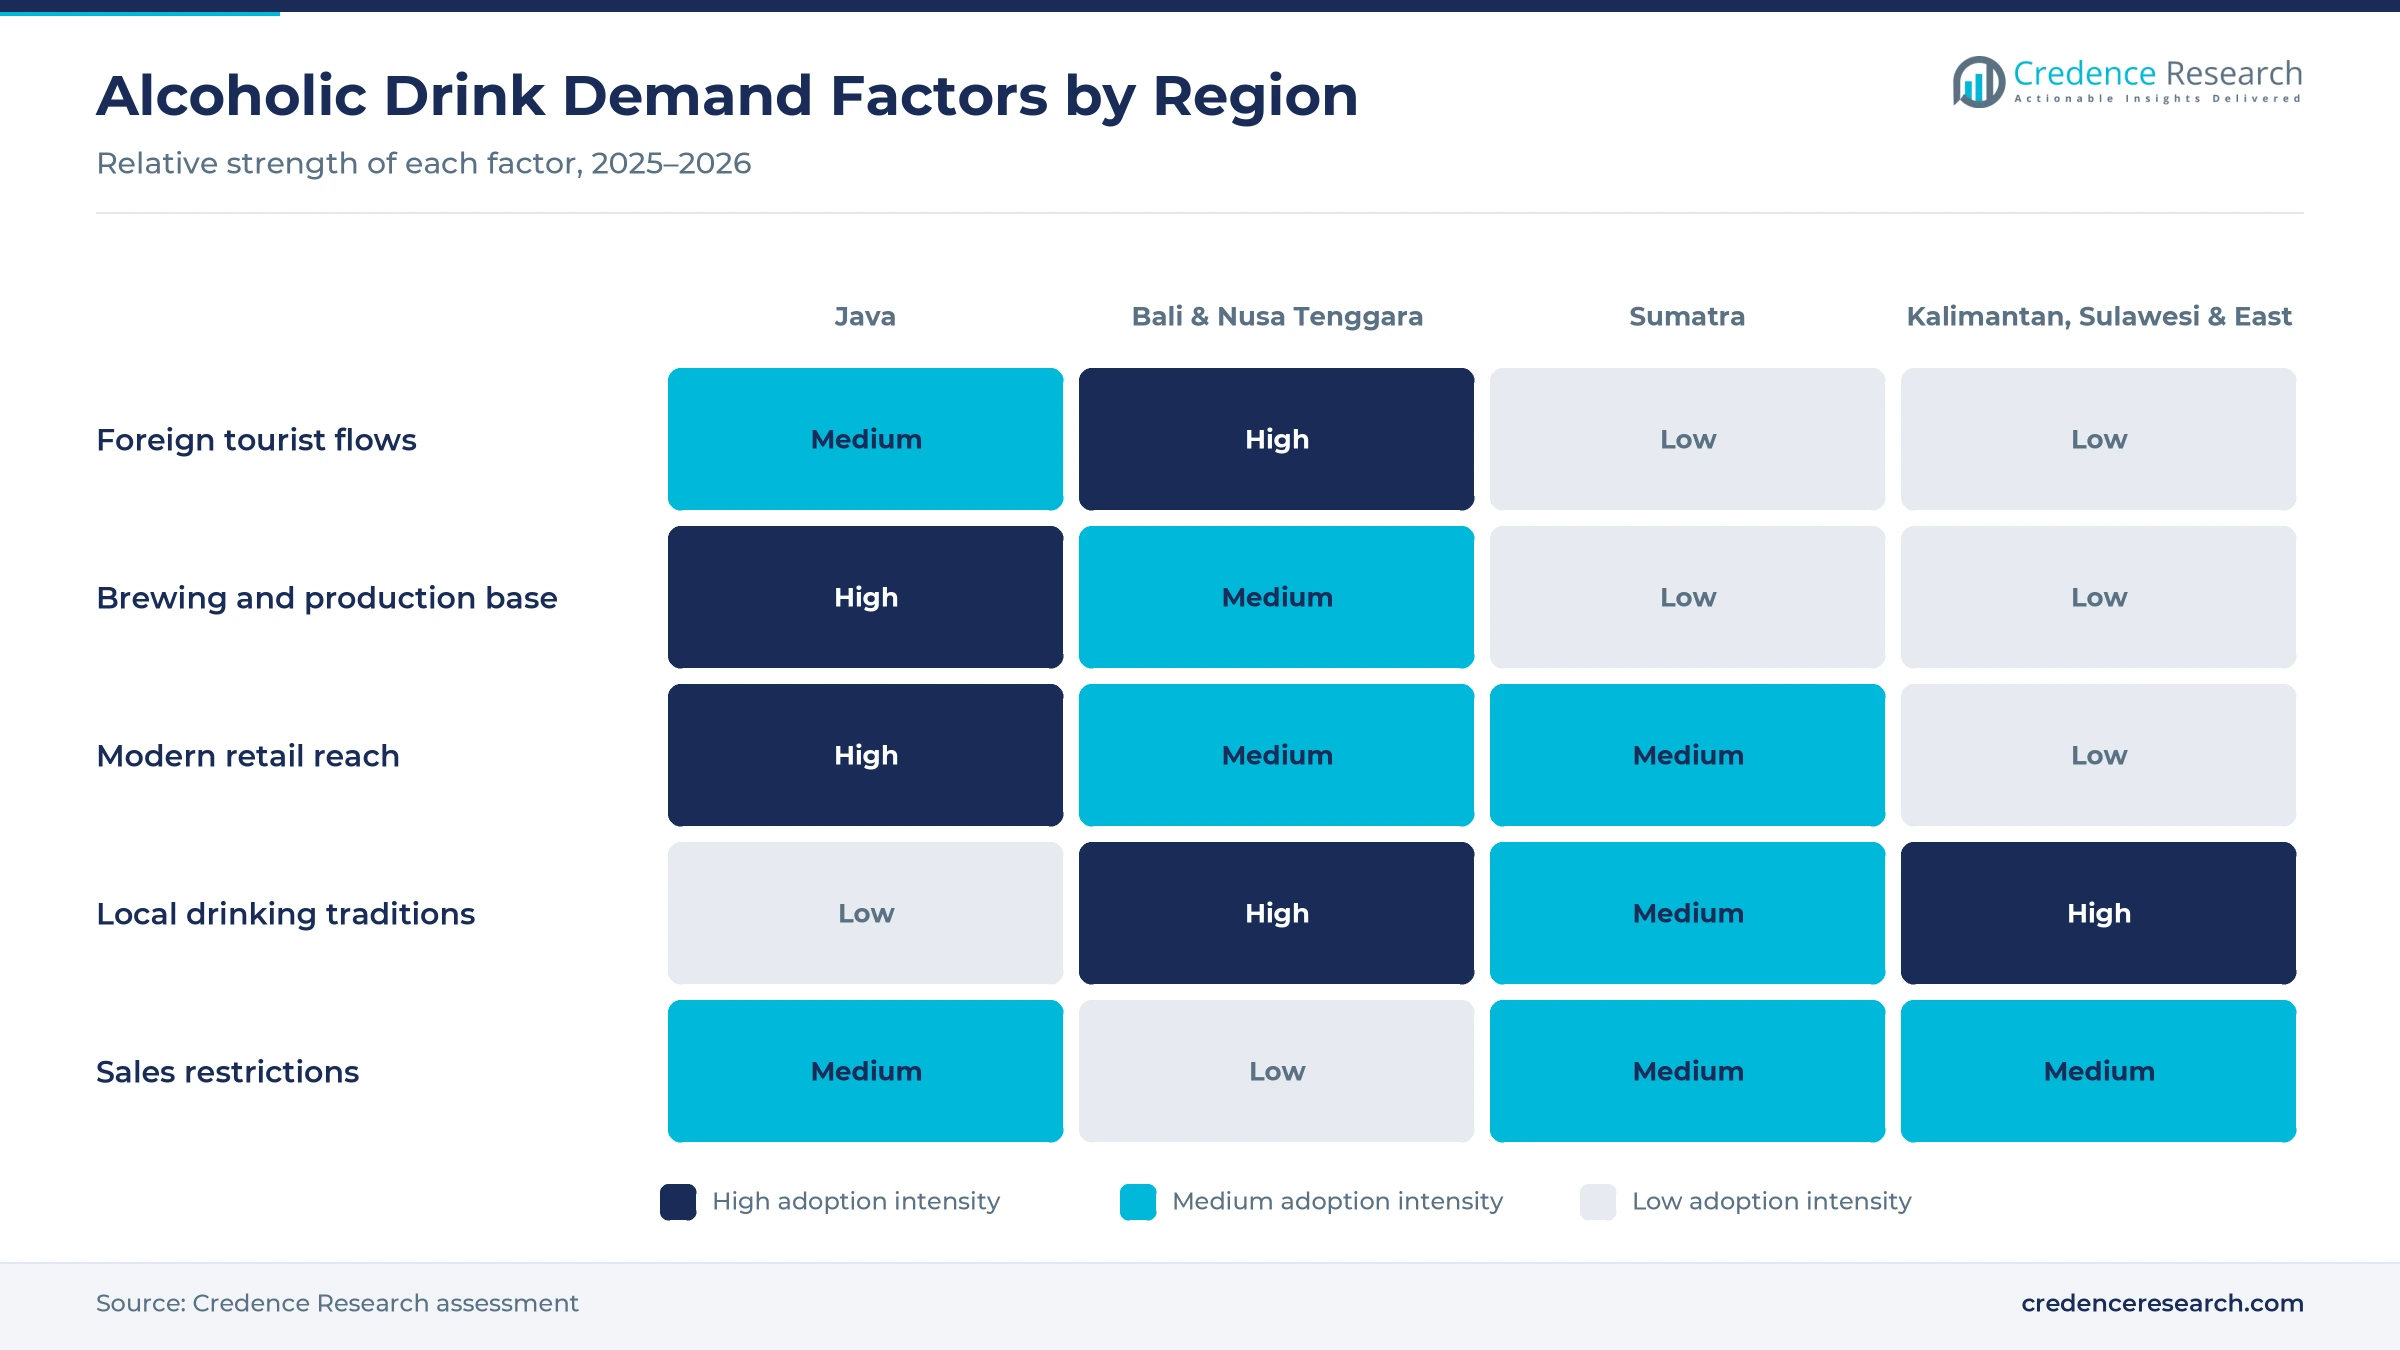
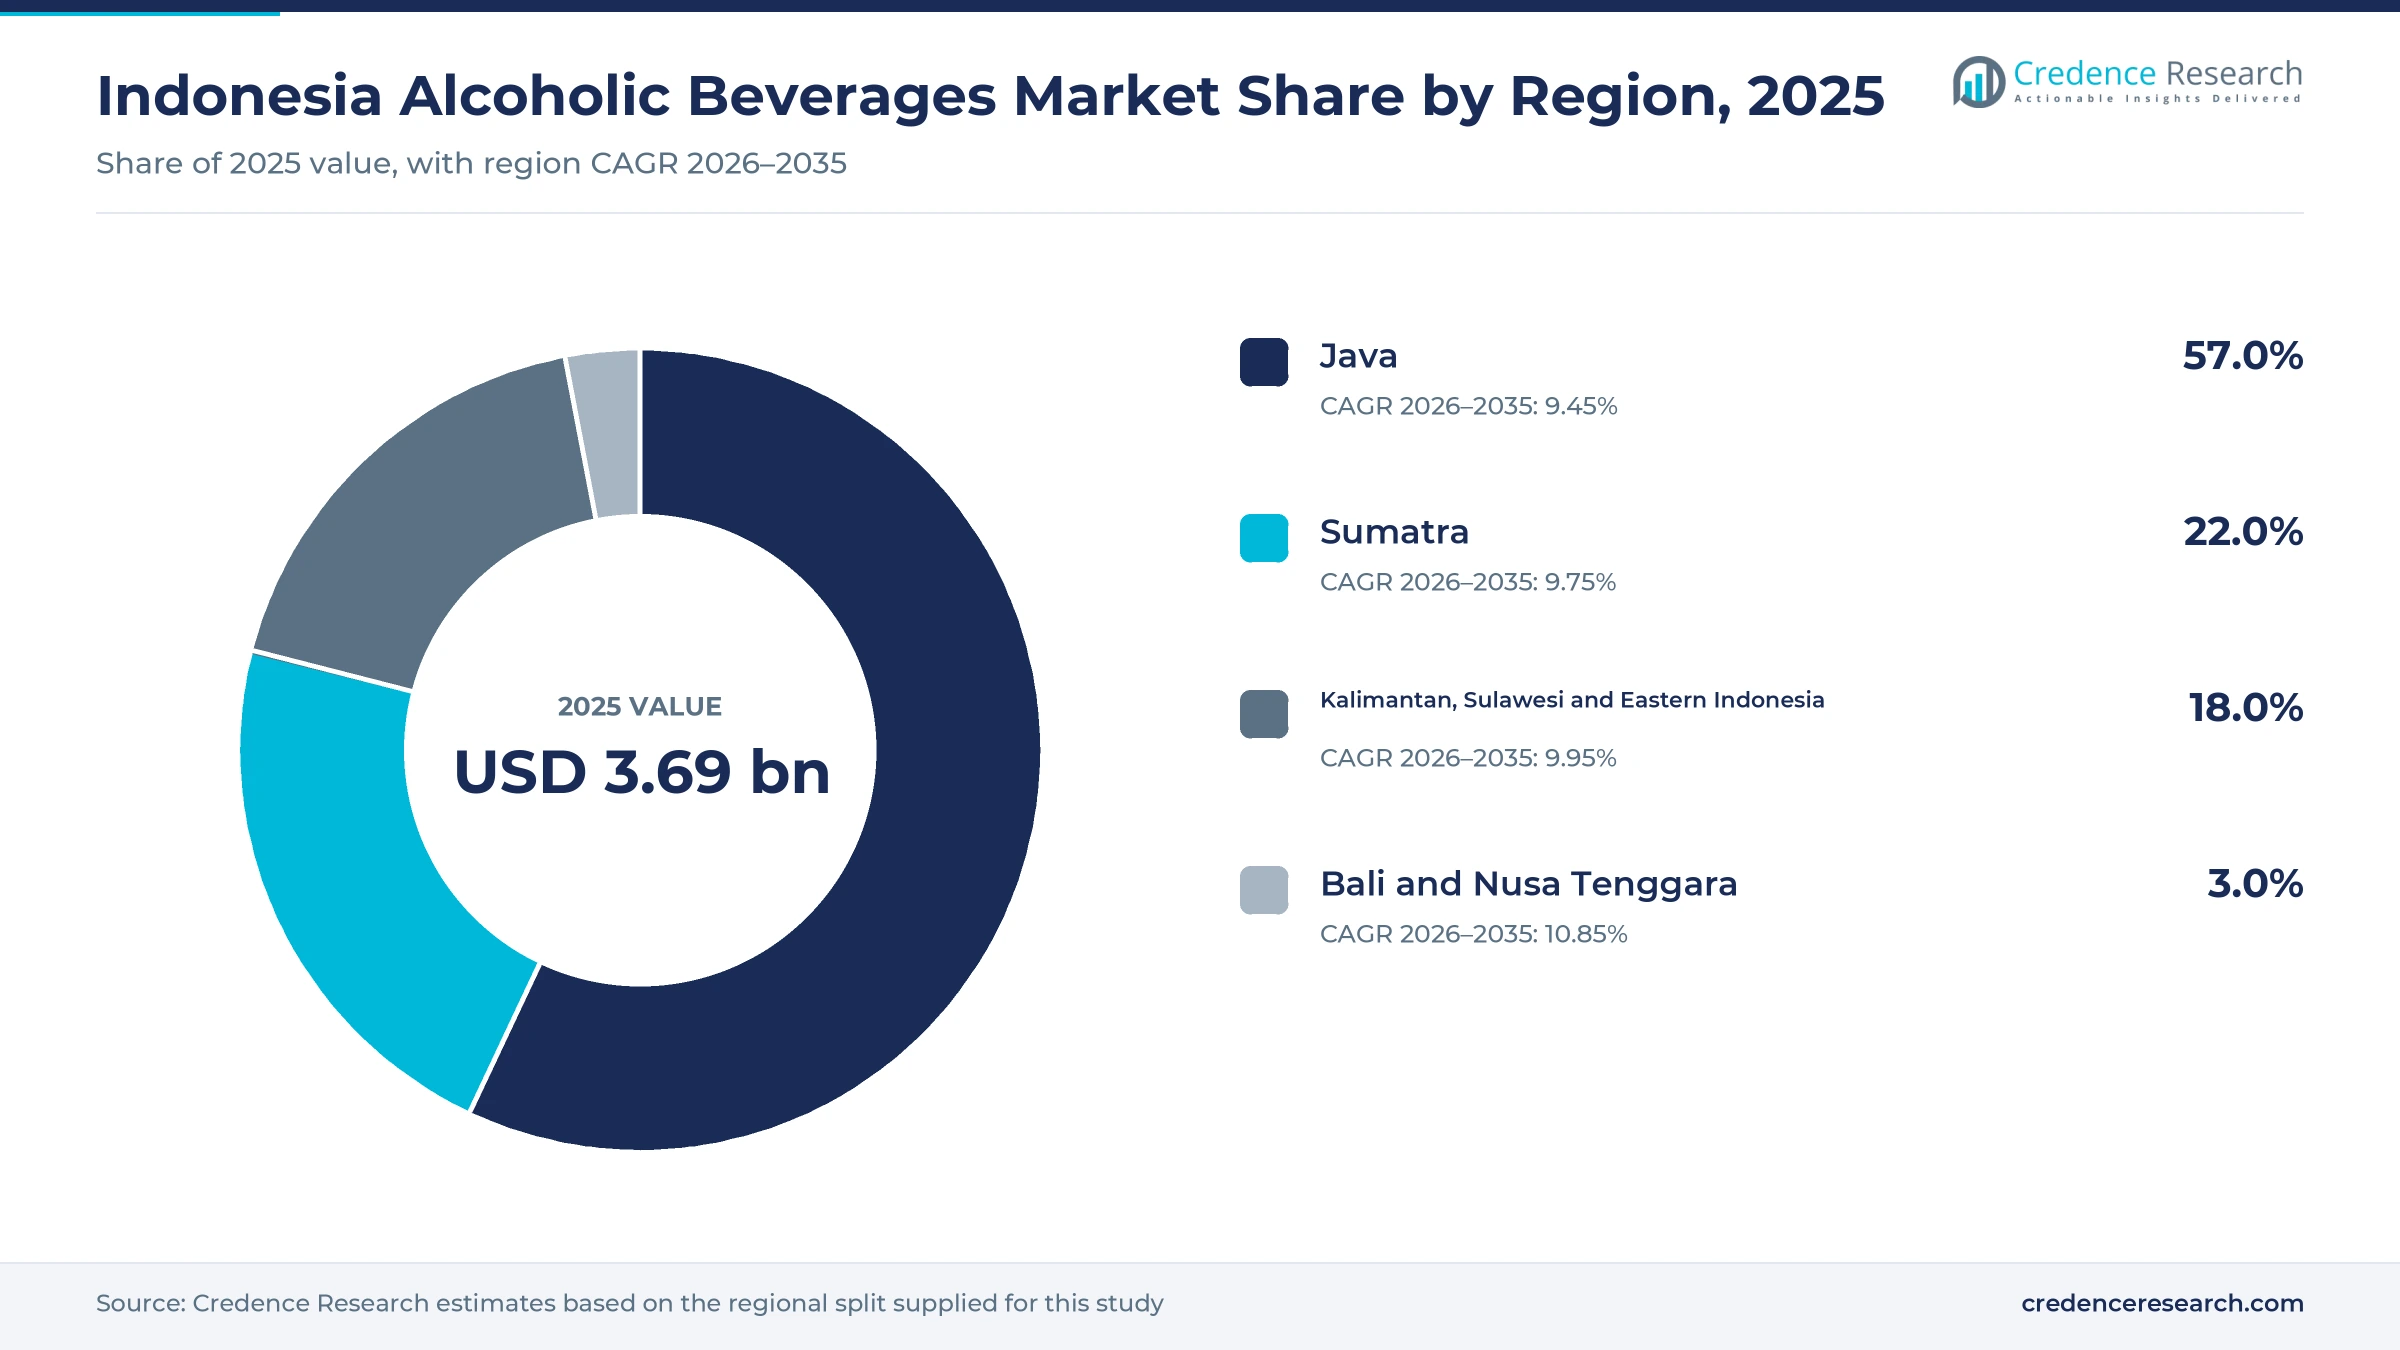
The Indonesia alcoholic beverages market was valued at USD 3.69 billion in 2025 and is projected to increase from USD 4.07 billion in 2026 to USD 9.32 billion by 2035, registering a CAGR of 9.65% during 2026–2035. Demand comes from foreign tourists, hotels, bars and restaurants, and a smaller base of legal-age consumers in large cities and regions with local drinking traditions. Java held the largest regional share, 57.0% in 2025, because the main breweries, large cities and modern retail chains sit on the island. Bali and Nusa Tenggara grow fastest at 10.85% a year, as foreign arrivals return to resort areas and local arak gains legal status. The most important commercial change is a move toward licensed, taxed products, as excise rules tighten and local producers enter the formal market under new industrial permits.
Which drinks and sales channels does the estimate count?
The estimate measures retail sales value of legal alcoholic drinks in Indonesia, including beer, spirits, wine and ready-to-drink products and cider. It covers sales through hotels, bars and restaurants, specialty liquor stores, supermarkets and hypermarkets, and licensed online and delivery services, across economy to super-premium price tiers. Values are stated in USD million at current prices, converted from rupiah at average annual exchange rates.
The estimate excludes untaxed and illegal liquor, alcohol-free beer and other drinks without alcohol, ethyl alcohol sold for industrial or medical use, and duty-free sales to travelers leaving the country. The value chain runs from brewers, distillers, winemakers and importers through licensed distributors to hotels, bars, shops and consumers.
Indonesia Alcoholic Beverages Market Insights
- The Indonesia alcoholic beverages market was valued at USD 3.69 billion in 2025 and is projected to reach USD 9.32 billion by 2035, registering a CAGR of 9.65% during 2026–2035.
- Java held 57.0% of 2025 sales value, because the main breweries, large cities and modern retail chains are concentrated on the island.
- Beer led with 70.0% of 2025 value, as lagers from local breweries remain the most common drink in bars, restaurants and shops.
- The industry ministry granted an industrial permit for Bali arak to the provincial government on Jan. 29, 2026, benefiting more than 1,472 farmers and craftsmen.
- Ready-to-drink products and cider grow fastest at 11.44% a year during 2026–2035, as brewers add low-alcohol and flavored drinks.
Beer and hospitality sales carry the most value
Why does beer carry most of the sales value?
Based on product type, the market is categorized into beer, spirits, wine and ready-to-drink products and cider. Beer led with 70.0% of 2025 value, because local lagers are widely sold in bars, restaurants and shops at affordable prices. Ready-to-Drink and Cider grows fastest at 11.44% a year, as brewers and spirits makers launch lighter, flavored drinks for younger adults and tourists.
How do premium brands change spending patterns?
Based on price tier, the market is categorized into economy, mainstream, premium and super-premium products. Mainstream products led with 47.0% of 2025 value, because everyday lagers and local spirits sell at moderate prices. Super-Premium products grow fastest at 11.02% a year, as resorts, beach clubs and fine dining venues stock imported spirits, wines and branded local craft drinks.
Who buys most alcoholic drinks in Indonesia?
Based on customer type, the market is categorized into domestic legal-age consumers, international tourists, hospitality buyers and corporate and event buyers. Domestic Legal-Age Consumers led with 60.0% of 2025 value, because legal-age residents of large cities buy beer and spirits all year. International Tourists grow fastest at 10.48% a year, as foreign arrivals return to Bali and other resorts.
Where are alcoholic drinks sold?
Based on distribution channel, the market is categorized into hotels, bars and restaurants, specialty liquor stores, supermarkets and hypermarkets, and licensed e-commerce and delivery. Hotels, Bars and Restaurants led with 44.0% of 2025 value, because on-premise venues charge higher prices and serve tourists. Licensed E-Commerce and Delivery grows fastest at 11.19% a year, as licensed sellers add delivery in large cities.
| Segment Group | Leading Sub-segment | Share, 2025 | Fastest-growing Sub-segment | CAGR, 2026–2035 |
|---|---|---|---|---|
| By Product Type | Beer | 70.0% | Ready-to-Drink and Cider | 11.44% |
| By Price Tier | Mainstream | 47.0% | Super-Premium | 11.02% |
| By Customer Type | Domestic Legal-Age Consumers | 60.0% | International Tourists | 10.48% |
| By Distribution Channel | Hotels, Bars and Restaurants | 44.0% | Licensed E-Commerce and Delivery | 11.19% |
Request a Free Sample
Fill in your details and we'll send you a free sample report.
- Sample data tables & charts
- Research methodology
Tourism, new brands, local craft and tax reform lift sales
How does the tourism and hospitality recovery lift sales?
Tourism and hospitality recovery lifts sales, because hotels, bars and beach clubs sell a large part of the country's beer, wine and spirits to visitors. Indonesia received 15.39 million foreign visits in 2025, up 10.80% from 2024, according to Statistics Indonesia. That total is close to the 16.1 million arrivals recorded in 2019, according to World Bank data. Bali alone recorded 7.05 million foreign arrivals by air in 2025, up from 6.33 million in 2024, according to Bisnis.com. Each foreign visit brought about US$1,267 in foreign exchange in 2025, and part of that spending goes to food and drink. As a result, hotels, bars and restaurants held 44.0% of 2025 value in the Indonesia alcoholic beverages market.
Why do premium launches and wider portfolios raise value?
Premiumization and portfolio expansion raise value, because producers now offer more brands, flavors and price points. Delta Djakarta markets 10 beer products, including Anker, San Miguel and Carlsberg, through 52 distributors across the country, its managers said in December 2025. Diageo expanded its Bali plant by 8,800 square meters in October 2024, where it makes Captain Morgan rum, Gilbey's gin, Bell's whisky and Smirnoff vodka. Hatten Bali won gold medals for seven wines at the China Wine & Spirits Awards 2025 and plans a cellar in Jakarta. Multi Bintang Indonesia tested Bintang Radler in December 2025 to reduce reliance on its main lager. Consequently, super-premium products grow fastest among price tiers at 11.02% a year.
How does formal local production open new sales?
Formalization of local production and exports opens new sales, because legal status lets traditional producers sell through hotels, shops and export buyers. The industry ministry granted an industrial permit for Bali arak to the provincial government on Jan. 29, 2026, to be run by a regional company, according to Jawa Pos. More than 1,472 arak farmers and craftsmen are expected to benefit, and 58 legal arak brands already carry excise stamps. Multi Bintang Indonesia shipped six containers of Bintang Radler from its Tangerang brewery to Australia on May 19, 2026. Diageo also exports Smirnoff and Captain Morgan made in Bali to five nearby countries. In turn, local craft spirits and export volumes add value beyond domestic beer sales.
Why does a larger licensed, taxed market support growth?
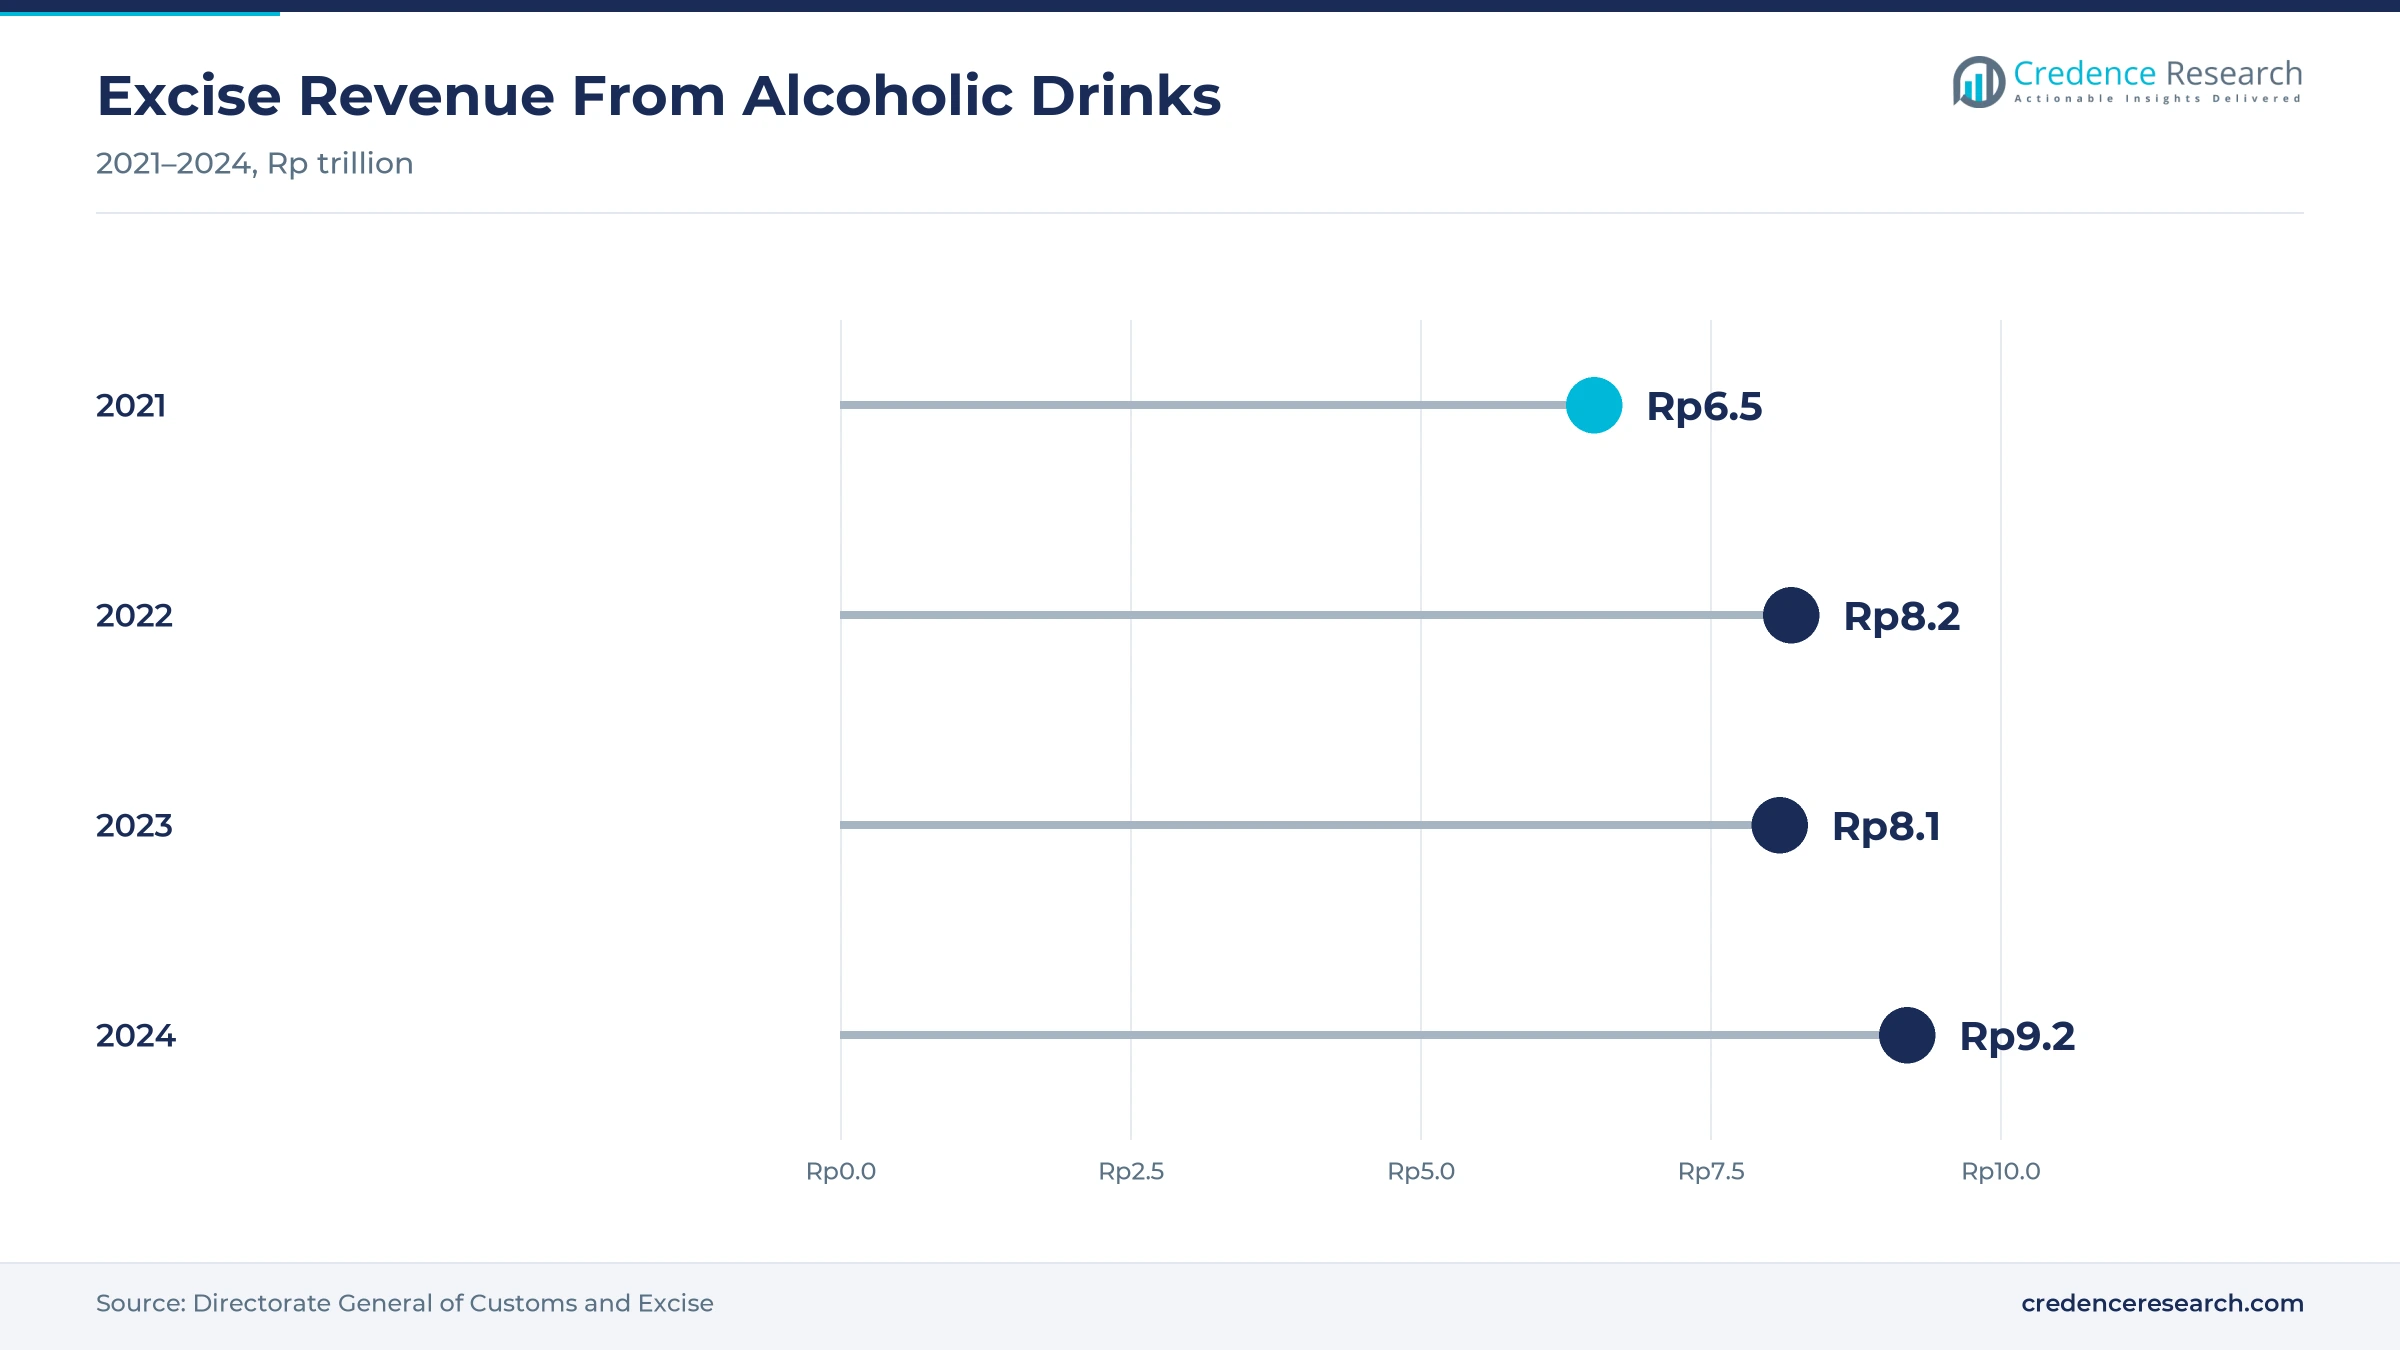
A larger licensed and taxed market supports value growth, because higher excise rates and tighter rules move sales toward branded, legal products. Excise revenue from alcoholic drinks rose from Rp6.5 trillion in 2021 to Rp9.2 trillion in 2024, according to Kontan. New rates took effect on Jan. 1, 2024, lifting the domestic tax on drinks above 20% alcohol from Rp80,000 to Rp101,000 a liter, according to DDTCNews. The government set a 2026 excise target of Rp10.06 trillion for these drinks. Imported production rose 12.4% in the first quarter of 2025, while domestic output fell 8.6%. Therefore, spirits gain value faster than beer in the Indonesia alcoholic beverages market through 2035.
Low-alcohol launches and tighter excise tracking emerge
How is the rise of low-alcohol and flavored drinks playing out?
Low-alcohol and flavored drinks are rising, because brewers want to reach younger adults and buyers who drink less. Multi Bintang Indonesia ran a limited trial of Bintang Radler, a low-alcohol citrus beer, in December 2025, then tripled export volume to Australia in May 2026. Excise rates for drinks up to 5% alcohol rose only 10% in January 2024, to Rp16,500 a liter, while the domestic rate for drinks above 20% rose more than 26%. Under rules effective Jan. 1, 2026, retail sales of drinks up to 5% alcohol also need no transport excise document. Consequently, ready-to-drink products and cider become the fastest-growing product type through 2035.
Why is tighter excise tracking emerging across the supply chain?
Tighter excise tracking is emerging, because the government wants to cut losses from untaxed liquor and track goods from factory to shop. Finance Minister Regulation 89 of 2025, issued on Dec. 18, 2025, and effective Jan. 1, 2026, requires an excise document whenever taxable drinks move into or out of a factory. Customs officers took 515 actions against alcohol excise violations in the first quarter of 2025 and seized goods worth Rp17.8 billion. The rule also lets producers store untaxed stock in bonded zones, which eases cash flow for importers. As a result, licensed brands gain shelf space from illegal products over time.
Is there an opening for local wine and arak in hospitality?
Local wine and arak offer a clear opening, because hotels and restaurants want drinks with a local story at prices below imports. Hatten Bali owns at least 40 hectares of grape-growing land in Buleleng and works with local farmers, while it focuses on the domestic market where its prices compete with imported wines. The company won gold medals for seven wines in 2025. The industry ministry has also urged hotels, restaurants and cafes to promote arak and brem after the permit of January 2026, which covers more than 1,472 farmers and craftsmen and 58 legal arak brands. In turn, wine grows faster than beer, and local craft brands can win premium menu space.
Can wider distribution beyond Java and Bali unlock demand?
Wider distribution beyond Java and Bali offers a second opening, because many legal-age consumers live in areas that national brands have not fully served. Delta Djakarta said in December 2025 that its 52 distributors cover Sumatra, Kalimantan, Sulawesi, Maluku, Papua, Java and Bali-Nusa Tenggara, and that it plans to expand into areas not yet fully developed. Sumatra held 22.0% of 2025 value, while Kalimantan, Sulawesi and eastern Indonesia held 18.0%. PT Jobubu Jarum Minahasa, a producer of Cap Tikus spirit, went public in early 2023. Consequently, brands that build distributor networks outside Java can add steady volume.
Tax rises, sales limits and illegal liquor weigh
How do excise increases weigh on domestic volumes?
Excise increases weigh on domestic volumes, because higher per-liter taxes raise shelf prices for local brands. Domestic production fell 8.6% to 57.6 million liters in the first quarter of 2025, and excise revenue fell 6.6%. As a result, brewers face slower volume growth and pressure on mainstream lagers. Producers respond with smaller packs, premium lines and lower-alcohol drinks that fall into the cheapest excise group, where the rate is Rp16,500 a liter.
Why do sales limits and local rules restrict access?
Sales limits and local rules restrict access, because sales rules limit where and when alcohol can be sold. Delta Djakarta said trade restrictions during Ramadan in March 2023 were tighter than a year earlier. Consequently, sales swing sharply around religious holidays, and brands cannot reach many consumers in modern retail. Producers manage this by focusing on licensed venues, tourist areas and regions with fewer limits, and by planning stock around the holiday calendar.
How does illegal liquor undercut licensed brands?
Illegal liquor undercuts licensed brands, because untaxed drinks sell far below the price of legal products. Customs officers took 515 enforcement actions against alcohol excise violations in the first quarter of 2025 alone. As a result, legal producers lose sales, and the state loses excise revenue. Tighter excise tracking, legal permits for traditional producers and public warnings help shift buyers toward licensed products sold through registered outlets.
Why does heavy reliance on tourism add risk?
Heavy reliance on tourism adds risk, because a large share of premium sales depends on foreign visitors in a few resort areas. Sales of major alcoholic drink companies fell by more than 30% in 2020 when travel stopped. Total tourist visits to Bali, including domestic travelers, slipped 0.72% to 16.33 million in 2025. Consequently, producers that build demand among local buyers and in other regions face smaller swings in sales when visitor numbers fall.
Java leads while Bali and Nusa Tenggara grow fastest
| Region | Value, 2025 (USD billion) | Share, 2025 | CAGR, 2026–2035 |
|---|---|---|---|
| Java | 2.11 | 57.0% | 9.45% |
| Sumatra | 0.81 | 22.0% | 9.75% |
| Kalimantan, Sulawesi and Eastern Indonesia | 0.67 | 18.0% | 9.95% |
| Bali and Nusa Tenggara | 0.11 | 3.0% | 10.85% |
Why does Java lead alcoholic drink sales?
Java held 57.0% of 2025 value and grows at 9.45% a year, because the island hosts the main breweries, the largest cities and most modern retail chains. Multi Bintang Indonesia brews Bintang beer at its plant in Tangerang, near Jakarta and ships to the rest of the country and abroad. Delta Djakarta also serves Java through its national distributor network, and Hatten Bali plans a cellar in Jakarta to reach more buyers.
How does Sumatra add steady demand?
Sumatra held 22.0% of 2025 value and grows at 9.75% a year, because the island has several large cities and is reached by national brewers through regional distributors. Delta Djakarta counts Sumatra among the regions served by its 52 distributors, and it plans to expand into areas it has not yet fully developed. Multi Bintang and Delta Djakarta both ship beer from Java, so freight costs shape shelf prices on the island.
What shapes sales in Kalimantan, Sulawesi and eastern Indonesia?
Kalimantan, Sulawesi and eastern Indonesia held 18.0% of 2025 value and grow at 9.95% a year, because local spirits and national beer brands both sell across the islands. PT Jobubu Jarum Minahasa, a producer of Cap Tikus spirit, went public in early 2023. National brands reach these islands through regional distributors, which raises costs but leaves room for growth. Delta Djakarta lists Kalimantan, Sulawesi, Maluku and Papua among the areas covered by its 52 distributors.
Why do Bali and Nusa Tenggara grow fastest?
Bali and Nusa Tenggara held 3.0% of 2025 value and grow fastest at 10.85% a year, because foreign arrivals and legal arak lift local sales. Bali recorded 7.05 million foreign arrivals by air in 2025. Diageo makes spirits in Tabanan, and Hatten Bali runs vineyards in Buleleng and a winery in Sanur.
Tariff changes, plant growth and new exports
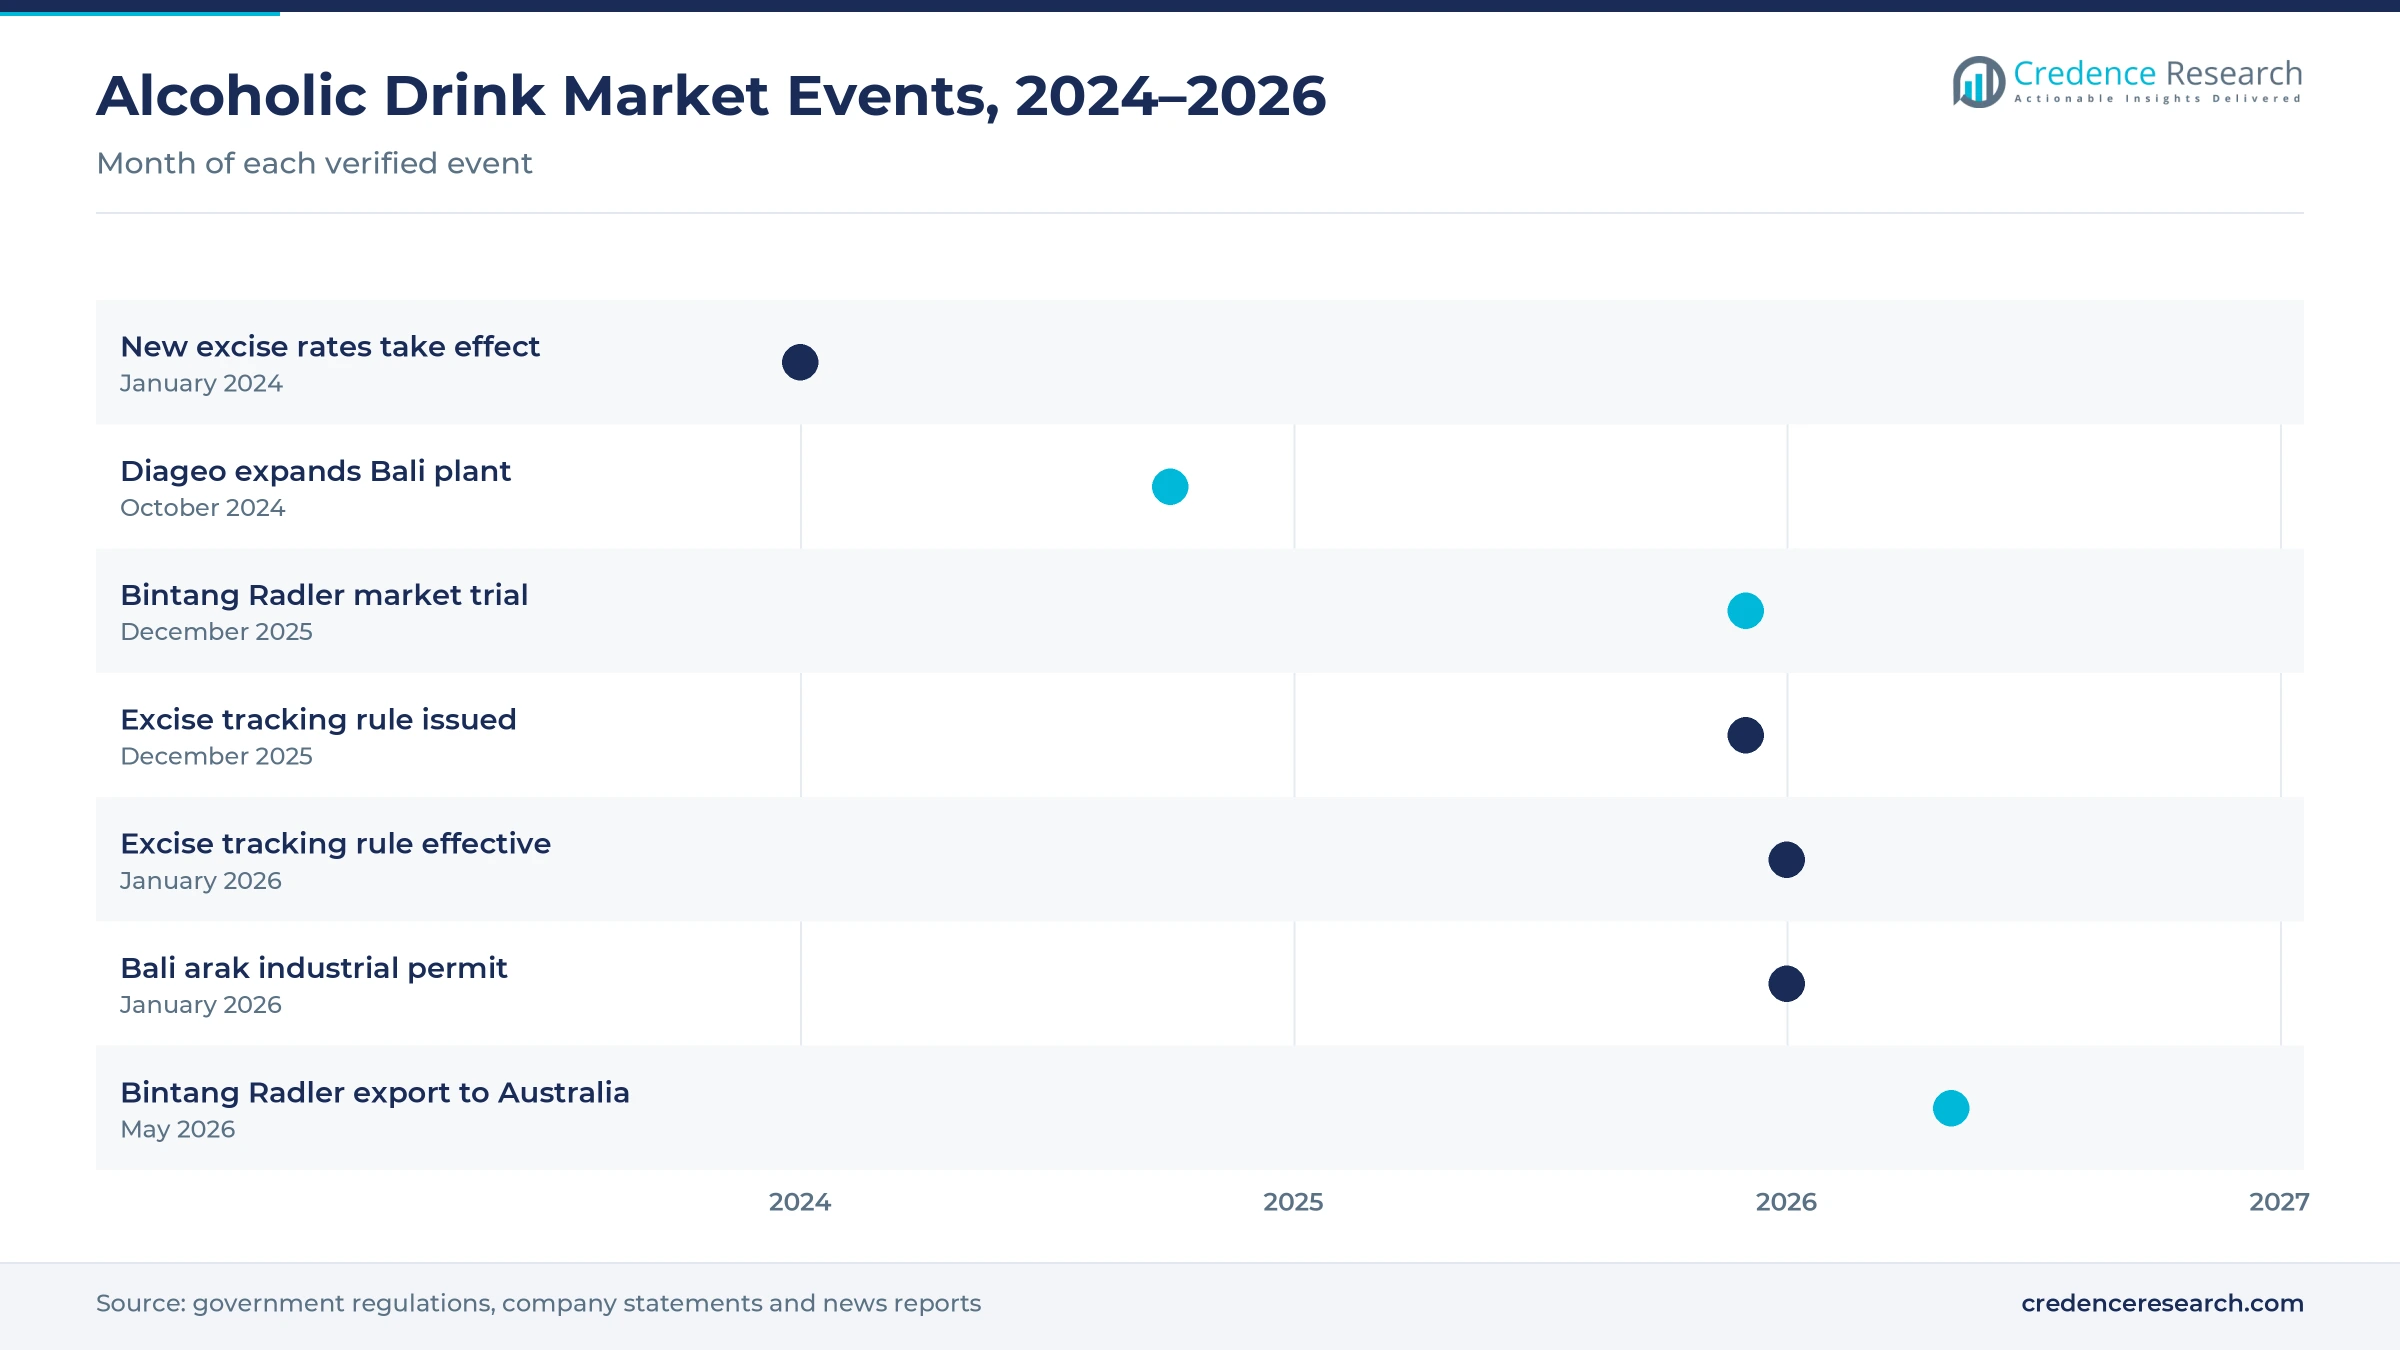
| Development | Status and market relevance |
|---|---|
| In January 2024, new excise rates for alcoholic drinks took effect under Finance Minister Regulation 160 of 2023. | Raises per-liter taxes across all three groups |
| In October 2024, Diageo announced an 8,800-square-meter expansion of its spirits plant in Tabanan, Bali. | Adds local spirits capacity |
| In December 2025, the finance ministry issued Regulation 89 of 2025 on the storage and movement of excisable goods. | Tightens tracking from January 2026 |
| In January 2026, the industry ministry granted an industrial permit for Bali arak to the provincial government. | Brings local producers into the formal market |
| In May 2026, Multi Bintang Indonesia shipped six containers of Bintang Radler to Australia from its Tangerang brewery. | Expands low-alcohol exports |
Excise tracking, packaging and brewing tools change supply
- Excise documents and stamps track taxable drinks from factory to shop, which helps licensed brands compete with untaxed liquor and lets officers check goods in transit.
- Bottle design for glass liquor bottles carries excise stamps and branding that help buyers tell legal products from fakes.
- Small-batch brewing lets brewers test craft beer styles, radlers and flavored lagers without long production runs.
- Bonded storage allowed from January 2026 lets producers and importers hold untaxed stock until sale, which eases cash flow.
Need a Custom Version of This Report?
Tailor the scope, geography, or segments to your exact requirements.
- Custom geography or segment scope
- Direct access to our analyst team
Listed brewers, winemakers and global spirits firms compete
Competition is led by two listed brewers, with local winemakers and global spirits firms growing in premium segments. Multi Bintang Indonesia, a Heineken subsidiary, sells Bintang beer and is widening its range with Bintang Radler for home and export markets. Delta Djakarta markets 10 beer products, including Anker, San Miguel and Carlsberg, through 52 distributors. Hatten Bali leads local wine with vineyards in Buleleng and award-winning labels. Diageo makes rum, gin, whisky and vodka in Bali for local and nearby markets, while Pernod Ricard distributes spirits through its own Indonesian affiliate. Companies compete on brand strength, price after excise, access to hotels and bars, distributor reach and licensing. New legal arak producers add local competition in Bali venues.
Companies profiled and their roles in this market
| Company | Type | Role in the market |
|---|---|---|
| Multi Bintang Indonesia | Brewer | Shipped Bintang Radler to Australia in May 2026 |
| Delta Djakarta | Brewer | Markets 10 beer brands through 52 distributors |
| Hatten Bali | Winemaker | Won gold medals for seven wines in 2025 |
| Diageo | Spirits producer | Expanded its Tabanan plant in October 2024 |
| Pernod Ricard | Spirits distributor | Holds an Indonesian distribution license since 2018 |
Credence Research view on tourism-led growth
Credence Research's view is that Indonesian alcoholic drink sales will grow quickly through 2035, because tourism has nearly returned to 2019 levels and producers are adding premium and low-alcohol drinks. Beer already holds 70.0% of 2025 value, while ready-to-drink products and cider grow fastest at 11.44% a year. Legal arak and local wine add new premium options in Bali. However, excise rises, sales limits and illegal liquor could slow volumes. Java keeps the largest share, while Bali and Nusa Tenggara grow faster as visitors return.
How the sales value estimate was built
The report uses 2025 as the base year, with values in USD million at current prices. Market values come from the Credence Research model, which combines excise data, tourism flows and retail prices by product. Regional shares follow the regional split supplied for this study, and segment splits by product, price tier, customer and channel are Credence Research estimates. Sources used are government statistics, excise data, regulations, World Bank data, company announcements and news reports, and no interviews or surveys were used.
Tourism, premium brands and legal craft set the path to 2035
The market is expected to reach USD 9.32 billion by 2035, a 9.65% CAGR during 2026–2035, as tourism, premium launches and legal local craft lift sales. Growth should be strongest in ready-to-drink products, super-premium brands and in Bali and Nusa Tenggara, while Java keeps the largest share. Producers that build low-alcohol ranges and wide distributor networks should gain share. In contrast, sharp excise rises, new sales limits or a fall in foreign arrivals would cut growth for many brands.
Frequently Asked Questions
How big is the Indonesia alcoholic beverages market?
Which region leads alcoholic drink sales in Indonesia?
Which region grows fastest?
Which product type holds the largest share?
How many foreign tourists visited Indonesia in 2025?
How much excise do alcoholic drinks generate?
Who are the leading companies in Indonesian alcoholic drinks?
What are the main risks to growth?
Table of Content
Chapter 1 Market Segmentation
- 1.1 Segmentation Framework
- 1.1.1 Product and Service Classification
- 1.1.2 Application and End-Use Classification
- 1.1.3 Technology and Solution Classification
- 1.1.4 Customer and Distribution Channel Classification
- 1.1.5 Geographic Segmentation
- 1.1.6 Market Segment Definitions and Boundaries
- 1.2 By Product Type
- 1.2.1 Beer
- 1.2.2 Spirits
- 1.2.3 Wine
- 1.2.4 Ready-to-Drink and Cider
- 1.3 By Price Tier
- 1.3.1 Economy
- 1.3.2 Mainstream
- 1.3.3 Premium
- 1.3.4 Super-Premium
- 1.4 By Customer Type
- 1.4.1 Domestic Legal-Age Consumers
- 1.4.2 International Tourists
- 1.4.3 Hospitality Buyers
- 1.4.4 Corporate and Event Buyers
Chapter 2 Introduction
- 2.1 Report Objectives and Scope
- 2.2 Product Definition and Industry Terminology
- 2.3 Market Inclusions and Exclusions
- 2.4 Research Process
- 2.4.1 Primary Research and Expert Interviews
- 2.4.2 Secondary Research and Source Review
- 2.4.3 Top-Down and Bottom-Up Estimation
- 2.4.4 Data Triangulation and Verification
- 2.5 Market Size Measurement Basis
- 2.5.1 2025: USD 3.69 billion → 2035: USD 9.32 billion
- 2.6 Historical and Forecast Reference Periods
- 2.6.1 Historical Period: 2018-2025
- 2.6.2 Base Year: 2025
- 2.6.3 Forecast Period: 2025-2035
- 2.7 Research Assumptions and Limitations
Chapter 3 Executive Summary
- 3.1 Market Snapshot and Key Findings
- 3.2 Base-Year Market Size, 2025
- 3.3 Forecast Market Size, 2035
- 3.4 Revenue and Volume Growth Outlook
- 3.5 Key Demand and Supply Indicators
- 3.6 Leading Market Segments
- 3.7 Fastest-Growing Market Opportunities
- 3.8 Regional Performance Highlights
- 3.9 Technology and Industry Transformation
- 3.10 Competitive Landscape Summary
- 3.11 Analyst View and Strategic Implications
Chapter 4 Indonesia Alcoholic Beverages Market Trends and Developments
- 4.1 Historical Industry Development, 2018-2025
- 4.2 Recent Market Trends and Developments
- 4.3 Demand and Customer Behavior Trends
- 4.4 Technology and Product Innovation
- 4.5 Artificial Intelligence, Automation and Digitalization
- 4.6 Local Manufacturing and Supply Chain Realignment
- 4.7 Industry Partnerships, Mergers and Acquisitions
- 4.8 Sustainability and Circular Economy Developments
- 4.9 Government and Private Sector Investment Trends
- 4.10 Emerging Business Models and Commercialization
- 4.11 Industry Developments and Announcements
Chapter 5 Indonesia Alcoholic Beverages Market Production, Supply and Demand Analysis
- 5.1 Demand Trend and Consumption Analysis, 2018-2025
- 5.2 Demand Forecast, 2025-2035
- 5.3 Production and Output Trend, 2018-2025
- 5.4 Production and Output Forecast, 2025-2035
- 5.5 Installed Capacity and Capacity Utilization
- 5.6 Company-Wise Production Plants and Statistics
- 5.6.1 Installed Production Capacity
- 5.6.2 Actual Production
- 5.6.3 Planned Capacity and Expansion Targets
- 5.7 Supply Chain Structure and Procurement Trends
- 5.8 Supply-Demand Gap and Bottlenecks
- 5.9 Import Dependence and Sourcing Structure
- 5.10 Contract Manufacturing and Outsourcing
- 5.11 Regional Supply and Demand Concentration
Chapter 6 Indonesia Alcoholic Beverages Market Pricing Analysis
- 6.1 Pricing Structure and Measurement
- 6.2 Historical Pricing Trends, 2018-2025
- 6.3 Pricing Outlook, 2025-2035
- 6.4 Average Selling Price and Unit Economics
- 6.5 Pricing by Product and Market Segment
- 6.6 Geographic Pricing Differences
- 6.7 Key Input, Energy, Labor and Logistics Costs
- 6.8 Contract Pricing and Purchasing Models
- 6.9 Pricing Sensitivity and Competitive Positioning
- 6.10 Price, Margin and Profitability Implications
Chapter 7 Indonesia Alcoholic Beverages Market Dynamics
- 7.1 Market Growth Drivers
- 7.1.1 Demand-Side Drivers
- 7.1.2 Technology and Innovation Drivers
- 7.1.3 Infrastructure and Investment Drivers
- 7.1.4 Regulatory and Policy Drivers
- 7.2 Market Restraints
- 7.2.1 Cost and Affordability Constraints
- 7.2.2 Technology and Adoption Barriers
- 7.2.3 Supply Chain and Operational Constraints
- 7.3 Market Challenges
- 7.3.1 Competitive Pressure and Margin Erosion
- 7.3.2 Skills, Infrastructure and Implementation Gaps
- 7.4 Emerging Market Opportunities
- 7.5 Market Dynamics Impact and Time-Horizon Assessment
Chapter 8 Indonesia Alcoholic Beverages Value Chain Analysis
- 8.1 Industry Value Chain Overview
- 8.2 Upstream Suppliers and Critical Inputs
- 8.3 Technology and Component Providers
- 8.4 Manufacturing or Service Delivery
- 8.5 Distribution, Channel Partners and Integrators
- 8.6 Downstream Applications and End Users
- 8.7 Value Addition and Profit Pools
- 8.8 Vertical Integration and Outsourcing
- 8.9 Supplier Concentration and Risk
- 8.10 Supply Chain Localization and Resilience
Chapter 9 Indonesia Alcoholic Beverages Market Regulations and Policies
- 9.1 Relevant Laws, Standards and Compliance Frameworks
- 9.2 Product, Service, Safety and Quality Requirements
- 9.3 Government Policies, Incentives and Subsidies
- 9.4 Imports, Exports and Trade Barriers
- 9.5 Public Procurement and Local Content Requirements
- 9.6 Environmental and Sustainability Compliance
- 9.7 Upcoming Policy Changes and Market Implications
Chapter 10 Indonesia Alcoholic Beverages Market Hotspots and Opportunities
- 10.1 Market Opportunity Mapping and Growth Hotspots
- 10.2 High-Growth Applications and Customer Groups
- 10.3 Underserved Markets and White-Space Opportunities
- 10.4 Emerging Technology and Product Opportunities
- 10.5 New Capacity and Investment Hotspots
- 10.6 Market Entry and Expansion Opportunities
- 10.7 Distribution and Partnership Opportunities
- 10.8 Near-Term and Long-Term Commercial Potential
- 10.9 Opportunity Attractiveness and Execution Risks
Chapter 11 Indonesia Alcoholic Beverages Market Outlook, 2025-2035
- 11.1 Market Size and Analysis
- 11.1.1 Revenue (Market Measurement: 2025: USD 3.69 billion → 2035: USD 9.32 billion)
- 11.1.2 Market Volume and Quantity Sold
- 11.1.3 Historical Market Size, 2018-2025
- 11.1.4 Base-Year Market Size, 2025
- 11.2 Market Forecast, 2025-2035
- 11.2.1 Revenue Forecast to 2035
- 11.2.2 Volume Forecast to 2035
- 11.2.3 CAGR and Year-on-Year Growth
- 11.2.4 Incremental Revenue Opportunity
- 11.3 Forecast Assumptions and Scenario Analysis
- 11.3.1 Base-Case Forecast
- 11.3.2 Optimistic and Conservative Scenarios
- 11.3.3 Technology, Pricing and Policy Sensitivities
- 11.4 Market Attractiveness and Growth Outlook
Chapter 12 Indonesia Alcoholic Beverages Market Segmentation and Outlook
- 12.1 Segmentation Summary and Market Shares, 2025
- 12.2 Largest and Fastest-Growing Segments
- 12.3 By Product Type - Market Size and Forecast, 2025-2035
- 12.3.1 Segment Definition and Scope
- 12.3.2 Historical Market Size, 2018-2025
- 12.3.3 Revenue Forecast, 2025-2035
- 12.3.4 Volume Forecast, 2025-2035
- 12.3.5 Base-Year Market Share, 2025
- 12.3.6 Segment CAGR and Growth Drivers
- 12.3.7 Subsegment Market Size and Forecast
- 12.3.7.1 Beer
- 12.3.7.2 Spirits
- 12.3.7.3 Wine
- 12.3.7.4 Ready-to-Drink and Cider
- 12.3.8 Subsegment Pricing and Adoption Trends
- 12.3.9 Leading Suppliers and Competition
- 12.3.10 Regional Demand and Opportunities
- 12.4 By Price Tier - Market Size and Forecast, 2025-2035
- 12.4.1 Segment Definition and Scope
- 12.4.2 Historical Market Size, 2018-2025
- 12.4.3 Revenue Forecast, 2025-2035
- 12.4.4 Volume Forecast, 2025-2035
- 12.4.5 Base-Year Market Share, 2025
- 12.4.6 Segment CAGR and Growth Drivers
- 12.4.7 Subsegment Market Size and Forecast
- 12.4.7.1 Economy
- 12.4.7.2 Mainstream
- 12.4.7.3 Premium
- 12.4.7.4 Super-Premium
- 12.4.8 Subsegment Pricing and Adoption Trends
- 12.4.9 Leading Suppliers and Competition
- 12.4.10 Regional Demand and Opportunities
- 12.5 By Customer Type - Market Size and Forecast, 2025-2035
- 12.5.1 Segment Definition and Scope
- 12.5.2 Historical Market Size, 2018-2025
- 12.5.3 Revenue Forecast, 2025-2035
- 12.5.4 Volume Forecast, 2025-2035
- 12.5.5 Base-Year Market Share, 2025
- 12.5.6 Segment CAGR and Growth Drivers
- 12.5.7 Subsegment Market Size and Forecast
- 12.5.7.1 Domestic Legal-Age Consumers
- 12.5.7.2 International Tourists
- 12.5.7.3 Hospitality Buyers
- 12.5.7.4 Corporate and Event Buyers
- 12.5.8 Subsegment Pricing and Adoption Trends
- 12.5.9 Leading Suppliers and Competition
- 12.5.10 Regional Demand and Opportunities
- 12.6 Segment Growth Comparison
- 12.7 Segment Attractiveness and Priority Matrix
Chapter 13 Indonesia Alcoholic Beverages End-Use and Application Market Outlook
- 13.1 End-Use Industry and Customer Demand Structure
- 13.2 Leading Applications and Customer Groups
- 13.3 End-Use Market Size, Share and Forecast
- 13.4 Major End-Use Industry Deep Dives
- 13.4.1 Customer Requirements and Use Cases
- 13.4.2 Demand and Replacement Cycles
- 13.4.3 Technical and Regulatory Considerations
- 13.4.4 Purchasing and Procurement Models
- 13.4.5 Leading Vendors and Distribution Channels
- 13.4.6 Forecast and Commercial Opportunities
- 13.5 Emerging Applications and Cross-Segment Demand
- 13.6 End-Use Industry Investment Priorities
Chapter 14 Indonesia Alcoholic Beverages Geographic Market Outlook, 2025-2035
- 14.1 Domestic Market Distribution and Demand Clusters
- 14.2 State- or Province-Wise Market Size and Forecast, 2025-2035
- 14.3 City and Metropolitan Market Outlook
- 14.4 Industrial, Manufacturing and Commercial Clusters
- 14.5 Geographic Concentration of Key End Users
- 14.6 Local Pricing and Purchasing Differences
- 14.7 Domestic Production Facilities and Capacity Map
- 14.8 Local Infrastructure and Project Pipeline
- 14.9 State-Level Policy and Incentive Differences
- 14.10 Subnational Investment Hotspots and Opportunities
- 14.11 Distribution and Logistics Networks
- 14.12 Domestic Competitive Footprint
Chapter 15 Indonesia Alcoholic Beverages Technology, Innovation and Sustainability Outlook
- 15.1 Technology Landscape and Maturity
- 15.2 Product, Process and Service Innovation
- 15.3 AI, Automation and Digital Tools in the Industry
- 15.4 Technology Adoption and Performance Benchmarking
- 15.5 Innovation Pipeline and R&D Investment
- 15.6 Patent and Intellectual Property Trends
- 15.7 Energy Efficiency and Resource Management
- 15.8 Sustainability, Recycling and Circularity
- 15.9 Technology Roadmap, 2025-2035
- 15.10 Risks of Obsolescence and Technology Substitution
Chapter 16 Indonesia Alcoholic Beverages Market Key Strategic Imperatives
- 16.1 Growth and Market Entry Priorities
- 16.2 High-Return Products and Segments
- 16.3 Pricing, Profitability and Cost Optimization
- 16.4 Technology Investment and Product Differentiation
- 16.5 Supply Chain Localization and Resilience
- 16.6 Distribution and Customer Acquisition
- 16.7 Partnership, Acquisition and Capacity Strategy
- 16.8 Regional Expansion Priorities
- 16.9 Short-, Medium- and Long-Term Actions
Chapter 17 Competition Outlook
- 17.1 Industry Competition Characteristics
- 17.2 Market Structure and Concentration
- 17.3 Market Share and Competitive Positioning, 2025
- 17.4 Company-Wise Revenue and Product Benchmarking
- 17.5 Production and Service Capacity Benchmarking
- 17.6 Technology, Pricing and Differentiation
- 17.7 Regional Footprint and Distribution Strength
- 17.8 Mergers, Acquisitions and Strategic Alliances
- 17.9 New Entrants and Competitive Threats
- 17.10 Porter's Five Forces and Industry Attractiveness
- 17.11 Competitive Outlook, 2025-2035
Chapter 18 Company Profiles
- 18.1 Company Coverage and Selection Criteria
- 18.2 Multi Bintang Indonesia (PT Multi Bintang Indonesia Tbk)
- 18.2.1 Business Description
- 18.2.2 Company Ownership and Geographic Presence
- 18.2.3 Product and Service Portfolio
- 18.2.4 Manufacturing and Operating Footprint
- 18.2.5 Production Capacity and Expansion Plans
- 18.2.6 Financial Performance and Investment
- 18.2.7 Market Share and Competitive Position
- 18.2.8 Technology and Innovation Capabilities
- 18.2.9 Strategic Alliances or Partnerships
- 18.2.10 Recent Developments
- 18.2.11 Growth Strategy and Outlook
- 18.3 Delta Djakarta (PT Delta Djakarta Tbk)
- 18.4 PT Bali Hai Brewery Indonesia
- 18.5 Hatten Bali (PT Hatten Bali Tbk)
- 18.6 PT Sababay Industry
- 18.7 PT Lovina Beach Brewery Tbk
- 18.8 Diageo (Diageo plc)
- 18.9 Pernod Ricard (Pernod Ricard SA)
- 18.10 Bacardi Limited
- 18.11 Moet Hennessy
- 18.12 Other Relevant Market Participants
Note: Every listed company is profiled on the structure shown under the first company. The company list is preliminary and may change based on research findings, market developments, data availability and client requirements.
Chapter 19 Disclaimer
- 19.1 Research and Forecast Disclaimer
- 19.2 Data Source and Estimation Limitations
Note: The depth of individual sections depends on data availability for this market. Volume, capacity, trade and other unit-based metrics are included where applicable.

