
Food output and longer shelf lives sustain demand
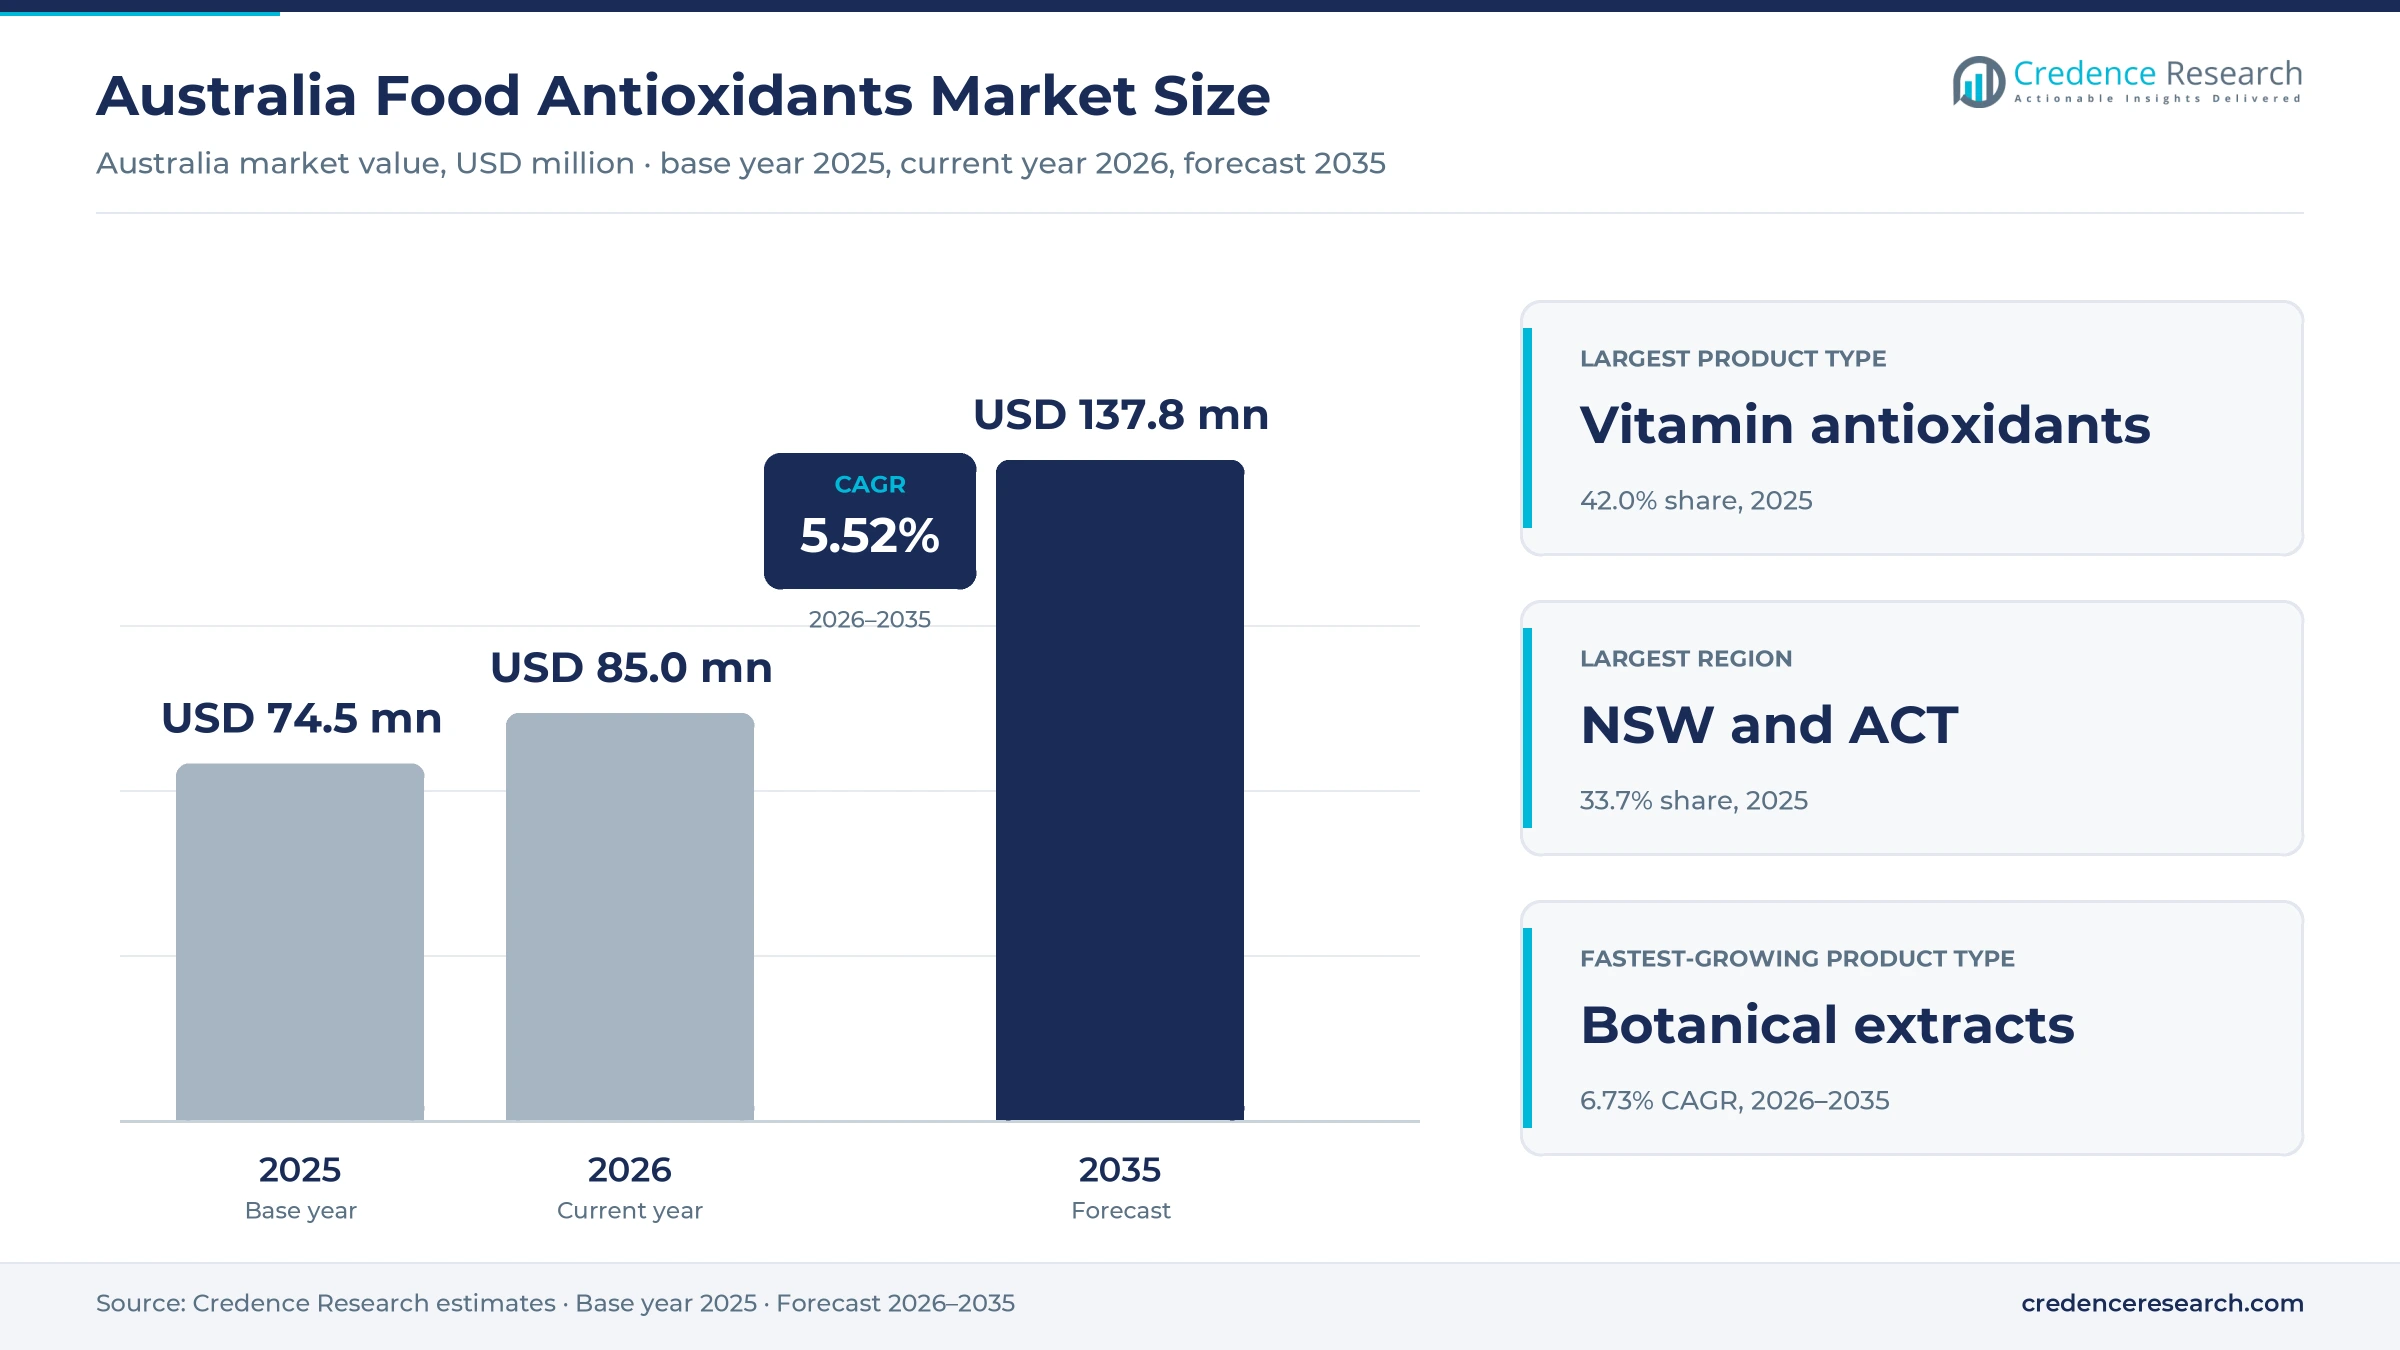
The Australia food antioxidants market was valued at USD 74.5 million in 2025 and is projected to increase from USD 85.0 million in 2026 to USD 137.8 million by 2035, registering a CAGR of 5.52% during 2026–2035. Demand comes from oil refiners, margarine and spread makers, meat processors, bakeries, snack makers and dairy plants that need to slow rancidity, color loss and flavor fade. New South Wales and the Australian Capital Territory held the largest regional share, 33.7% in 2025, because the zone hosts the largest base of packaged food plants and ingredient offices. Queensland is the fastest-growing region at 5.96% a year, as meat export plants and population growth lift ingredient use. In turn, food manufacturers are replacing synthetic phenolic grades with rosemary extracts and tocopherol blends, which changes how suppliers price and position their products.
Which shelf-life ingredients and buyers does the estimate cover?
The estimate measures the value of vitamin antioxidants such as tocopherols and ascorbates, botanical extracts such as rosemary and green tea, and synthetic phenolic grades sold to Australian food and beverage makers. It counts sales to oil, meat, bakery, beverage, dairy and snack plants, whether supplied directly or through distributors and formulation partners.
The estimate excludes antimicrobial preservatives sold on their own, dietary supplements and animal feed grades. The value chain runs from global extract and vitamin makers through technical agents and distributors to brand owners and contract manufacturers in every state.
Australia Food Antioxidants Market Insights
- The Australia food antioxidants market was valued at USD 74.5 million in 2025 and is projected to reach USD 137.8 million by 2035, registering a CAGR of 5.52% during 2026–2035.
- New South Wales and the Australian Capital Territory held a 33.7% share of 2025 value, because the zone hosts the most packaged food plants.
- Vitamin antioxidants led with a 42.0% share of 2025 value, because tocopherols and ascorbates suit oils, spreads, meat and beverages.
- Australian beef exports reached a record 1,545,759 metric tons in calendar 2025, up from 1,343,568 metric tons in 2024.
- Botanical extracts grow fastest at 6.73% a year during 2026–2035, as manufacturers move to rosemary and green tea grades.
Vitamin grades lead while botanical extracts grow fastest
Why do vitamin antioxidants hold the largest share?
Based on product type, the market is categorized into vitamin antioxidants, botanical extracts and synthetic phenolic antioxidants. Vitamin Antioxidants led with a 42.0% share of 2025 value, because tocopherols and ascorbates protect oils, spreads, cured meats and beverages at low dose. Botanical Extracts grow fastest at 6.73% a year, as brand owners replace synthetic grades with rosemary and green tea extracts that read well on labels.
How do oil, meat and bakery plants split demand?
Based on end-use industry, the market is categorized into fats, oils and spreads, meat and poultry, bakery and confectionery, beverages and dairy and snacks. Fats, Oils and Spreads led with a 31.0% share of 2025 value, because refined oils and spreads oxidize quickly without protection. Meat and Poultry grows fastest at 6.27% a year, as export plants need color and flavor stability for long sea freight.
Why does lipid stabilization dominate use?
Based on application, the market is categorized into lipid stabilization, colour protection and flavour preservation. Lipid Stabilization led with a 58.0% share of 2025 value, because rancidity in fats and oils is the main cause of shelf-life failure. Flavour Preservation grows fastest at 6.11% a year, as snack, beverage and dairy makers protect delicate flavors in longer supply chains.
How do direct sales and specialist agents reach buyers?
Based on sales channel, the market is categorized into direct manufacturer sales, specialty distributor sales and formulation partner sales. Direct Manufacturer Sales led with 40.0% of 2025 value, because large oil refiners and meat processors buy on annual contracts. Formulation Partner Sales grow fastest at 6.18% a year, as smaller brands rely on partners that design complete shelf-life systems.
| Segment Group | Leading Sub-segment | Share, 2025 | Fastest-growing Sub-segment | CAGR, 2026–2035 |
|---|---|---|---|---|
| By Product Type | Vitamin Antioxidants | 42.0% | Botanical Extracts | 6.73% |
| By End-Use Industry | Fats, Oils and Spreads | 31.0% | Meat and Poultry | 6.27% |
| By Application | Lipid Stabilization | 58.0% | Flavour Preservation | 6.11% |
| By Sales Channel | Direct Manufacturer Sales | 40.0% | Formulation Partner Sales | 6.18% |
Request a Free Sample
Fill in your details and we'll send you a free sample report.
- Sample data tables & charts
- Research methodology
Food output, reformulation and exports lift demand
How does expanding food manufacturing lift antioxidant use?
Expanding food manufacturing lifts antioxidant use, because every extra batch of oil, meat, bakery and snack product needs protection against oxidation. Food and grocery manufacturing turnover reached AUD 182.6 billion in 2024-25, up 5.5% from AUD 173 billion a year earlier, according to the Australian Food and Grocery Council. Industry value added rose a record 8.2% to AUD 43.4 billion, while employment passed 301,000 workers. Manufacturing added about 5.3% of gross domestic product in 2025, according to the World Bank. As a result, fats, oils and spreads hold 31.0% of 2025 value, while makers of frozen bakery products buy oxidation control for every production run across the year.
Why does natural antioxidant reformulation raise spending?
Natural antioxidant reformulation raises spending, because botanical extracts cost more per kilogram than the synthetic phenolic grades they replace. Kalsec applied to the national food regulator to permit rosemary extract, INS 392, as an antioxidant, with the call for submissions issued on July 20, 2018, according to Food Standards Australia New Zealand. The request covered edible oils, processed meats, sausages, sauces, biscuits, cereal bars, nuts and potato chips. Kalsec markets its Herbalox rosemary extracts and Duralox systems in Australia through Connell Brothers, a partnership that began on May 1, 2014. In turn, botanical extracts grow at 6.73% a year, the fastest product rate, and support wider use of natural preservatives.
How do export shelf-life requirements support demand?
Export shelf-life requirements support demand, because meat, dairy and packaged foods shipped to Asia and the United States spend weeks in transit and storage. Australian beef exports reached a record 1,545,759 metric tons in calendar 2025, up from 1,343,568 metric tons in 2024, according to Argus Media citing the federal agriculture department. Shipments to the United States rose to 452,795 metric tons and shipments to China reached 272,939 metric tons. Food and grocery exports reached AUD 52.6 billion in 2024-25, up 17.4% on the year before. As a result, meat and poultry grows at 6.27% a year, the fastest end-use rate, as processors protect color and fat quality.
Why does a large domestic oilseed crop anchor oil protection?
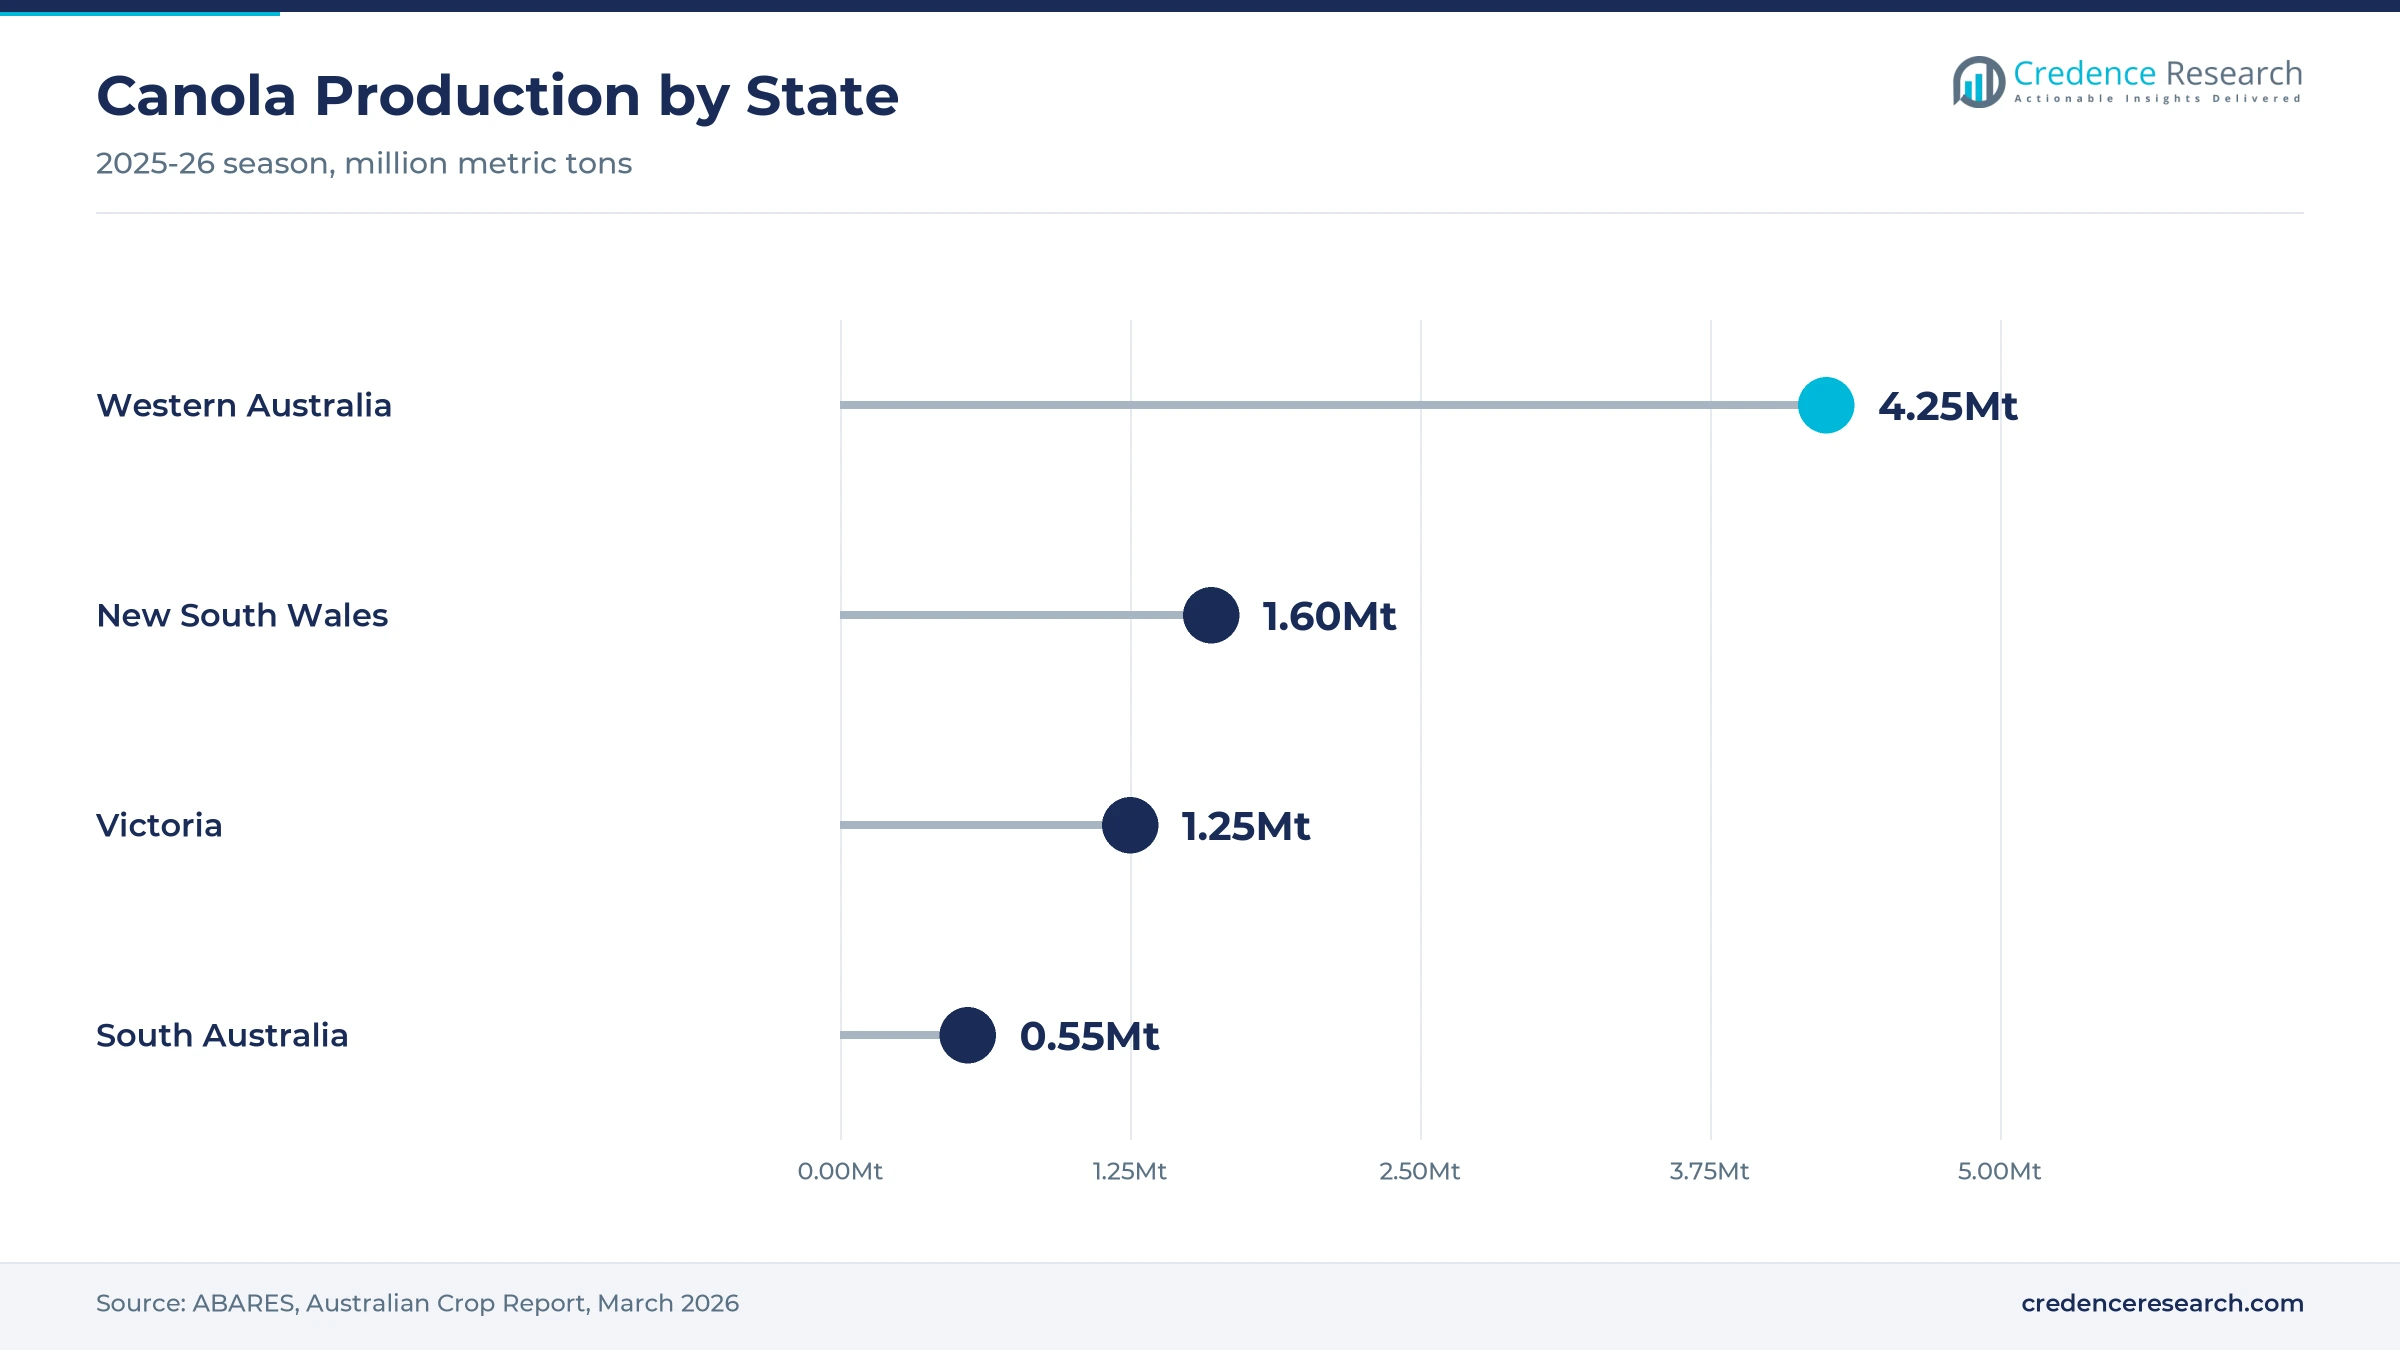
A large domestic oilseed crop anchors oil protection, because crushed canola oil must be stabilized before it reaches fryers, spreads and snack lines. Canola production reached about 7.7 million metric tons in 2025-26, up 20% and the second-largest crop on record, according to the national agricultural forecaster. Western Australia grew about 4.25 million metric tons, while New South Wales produced 1.6 million and Victoria 1.25 million. Australian dairy exports also rose 10% to AUD 3.4 billion in 2024-25, which adds milk fat products that need oxidation control. In turn, lipid stabilization keeps 58.0% of 2025 value, the largest application and supports demand for tocopherols in refined oils.
Plant extracts, oilseed supply and partners shape buying
How is the rise of plant-based shelf-life systems changing buying?
The rise of plant-based shelf-life systems is changing buying, because brand owners want antioxidants that read as herb or vitamin names on packs. Kalsec listed 11 food groups in its 2018 rosemary extract request, from edible oils to potato chips. Kemin appointed Hawkins Watts as its Australian and New Zealand agent from Jan. 1, 2009, offering the Fortium natural range alongside the En-Hance synthetic range. Food and grocery exports also rose 17.4% in 2024-25, adding overseas buyers with strict label rules. As a result, botanical extracts gain share each year, while synthetic phenolic grades lose share as reformulated recipes reach supermarket shelves over the next decade.
Why is the shift to formulation partners notable?
The shift to formulation partners is notable, because smaller brands lack the laboratories needed to match antioxidants with each recipe and pack format. Connell Brothers covers all Australian states as the channel partner for Kalsec, and its parent operates 37 offices across 17 countries in the Asia Pacific. Kemin supports its agent with recommendations based on chemical analysis and technical trials on customer products. Food and grocery capital investment rose 16% to AUD 4.5 billion in 2024-25, which adds new lines that need tested systems. In turn, formulation partner sales grow at 6.18% a year, the fastest channel rate, while direct sales still hold 40.0% of 2025 value.
Can bakery and dairy reformulation open new antioxidant demand?
Bakery and dairy reformulation can open new demand, because new recipes with added sterols, fibers or reduced sugar change how fats and flavors behave. George Weston Foods lodged an application to add phytosterols to bread, with assessment restarting on May 12, 2026, according to the national food regulator work plan. The same company sought steviol glycosides in crumpets and pikelets, with submissions open from Sept. 29, 2026, to Nov. 10, 2026. Bega Cheese applied to add plant sterols to yoghurt and cheese, with assessment starting on June 4, 2026. As a result, bakery and confectionery and dairy and snacks buyers need antioxidants alongside other new ingredients in reformulated products.
Is there room to serve meat processors with color protection?
Meat processors offer room to grow, because fresh and processed meats lose their red color and develop off-flavors when fats oxidize. Beef and veal exports reached 1.4 million metric tons in fiscal 2024-25, the highest annual volume on record, according to the national red meat marketing body. Mutton exports also set a record at 256,104 metric tons over the same period. Monthly beef exports hit 134,593 metric tons in June 2025, the largest month on record. In turn, colour protection grows faster than lipid stabilization, and suppliers that serve meat processing plants with rosemary and ascorbate blends gain contracts.
Label pressure, import costs and approvals test suppliers
How does clean-label pressure squeeze synthetic grades?
Clean-label pressure squeezes synthetic grades, because many shoppers avoid additive numbers and chemical names on ingredient lists. Brand owners therefore reduce the use of synthetic phenolic antioxidants in new recipes. As a result, suppliers of these grades face slower sales and lower prices. Suppliers respond by offering mixed systems that combine smaller synthetic doses with tocopherols or rosemary, which keeps costs down while meeting buyer label goals.
Why do import costs raise prices for botanical extracts?
Import costs raise prices for botanical extracts, because most rosemary, green tea and tocopherol grades are made overseas and shipped to Australia. Freight delays and currency swings therefore change landed costs quickly. In turn, food makers hold safety stock and qualify second suppliers. Distributors respond with local warehousing and forward contracts that smooth deliveries and prices for smaller buyers across the year.
How do raw material swings affect extract supply?
Raw material swings affect extract supply, because rosemary harvests and vegetable oil distillates vary with weather and crop prices. Poor seasons lower the active content of extracts and raise costs for makers. As a result, suppliers adjust prices often and buyers resist increases. Extract makers respond by standardizing active levels and widening their sourcing regions, which gives food plants more predictable dosing and costs.
Why do regulatory approvals slow new ingredient launches?
Regulatory approvals slow new ingredient launches, because a new antioxidant or a new food use needs an application to the national food regulator. Assessment, consultation and Board approval can take more than a year. In turn, global makers launch some products later in Australia than in larger markets. Suppliers respond by preparing complete safety files earlier and working with local applicants to shorten the process.
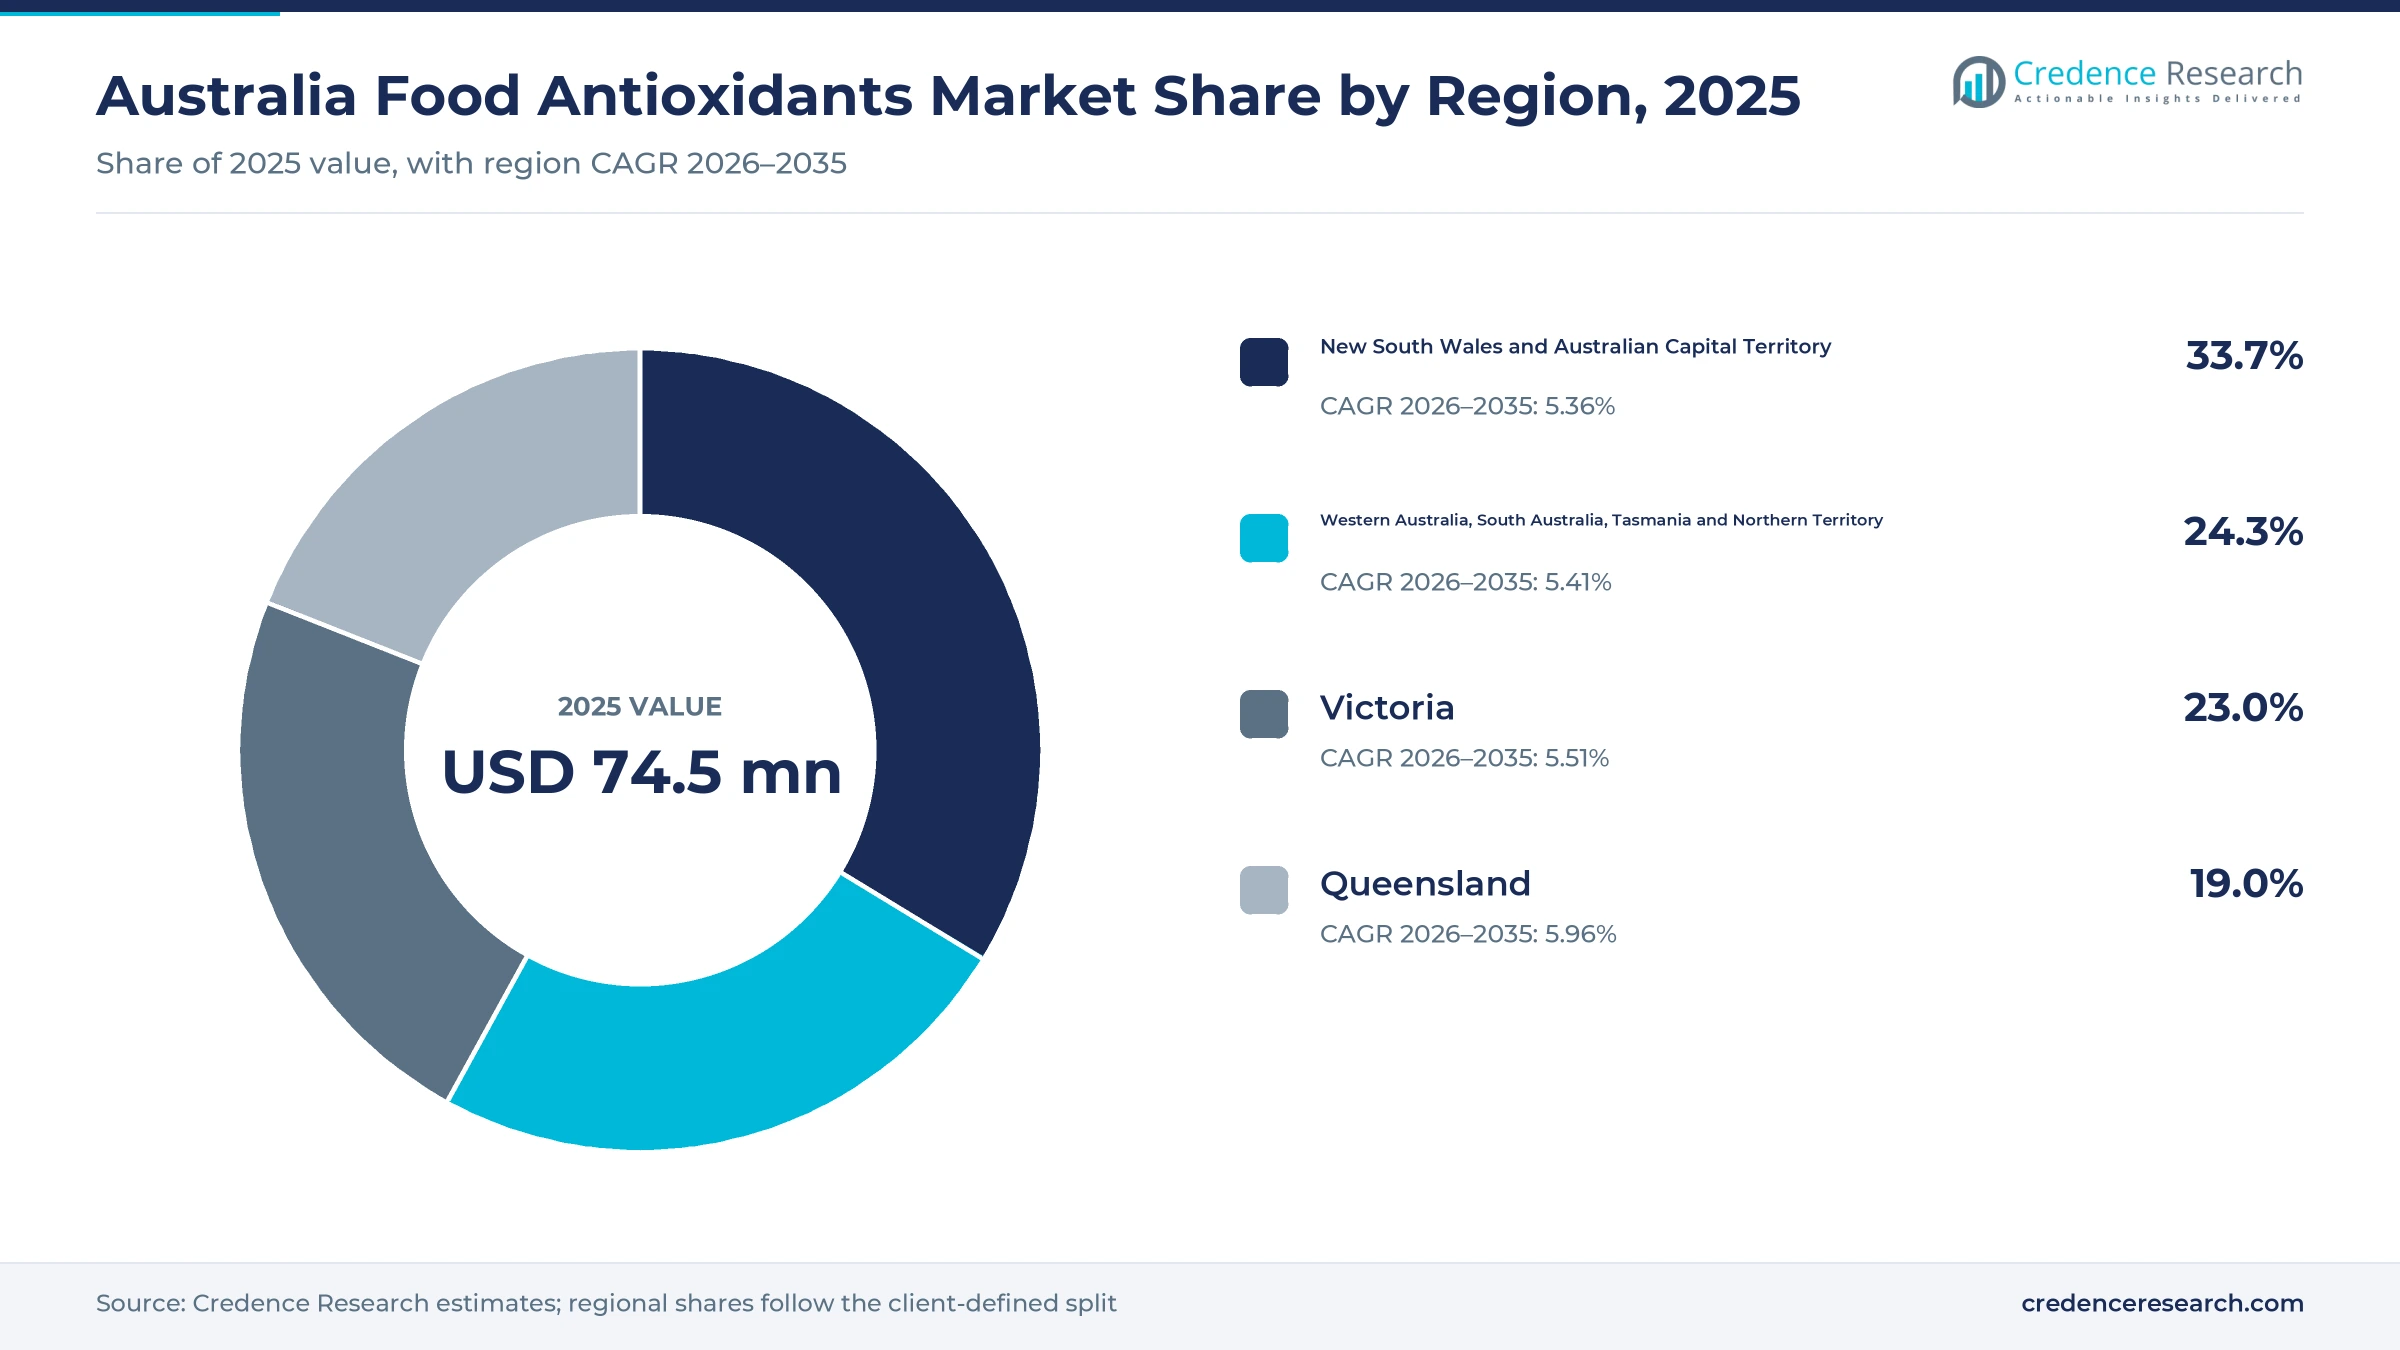
New South Wales leads as Queensland grows fastest
| Region | Value, 2025 (USD million) | Share, 2025 | CAGR, 2026–2035 |
|---|---|---|---|
| New South Wales and Australian Capital Territory | 25.1 | 33.7% | 5.36% |
| Western Australia, South Australia, Tasmania and Northern Territory | 18.1 | 24.3% | 5.41% |
| Victoria | 17.1 | 23.0% | 5.51% |
| Queensland | 14.2 | 19.0% | 5.96% |
Why does New South Wales and the ACT hold the top share?
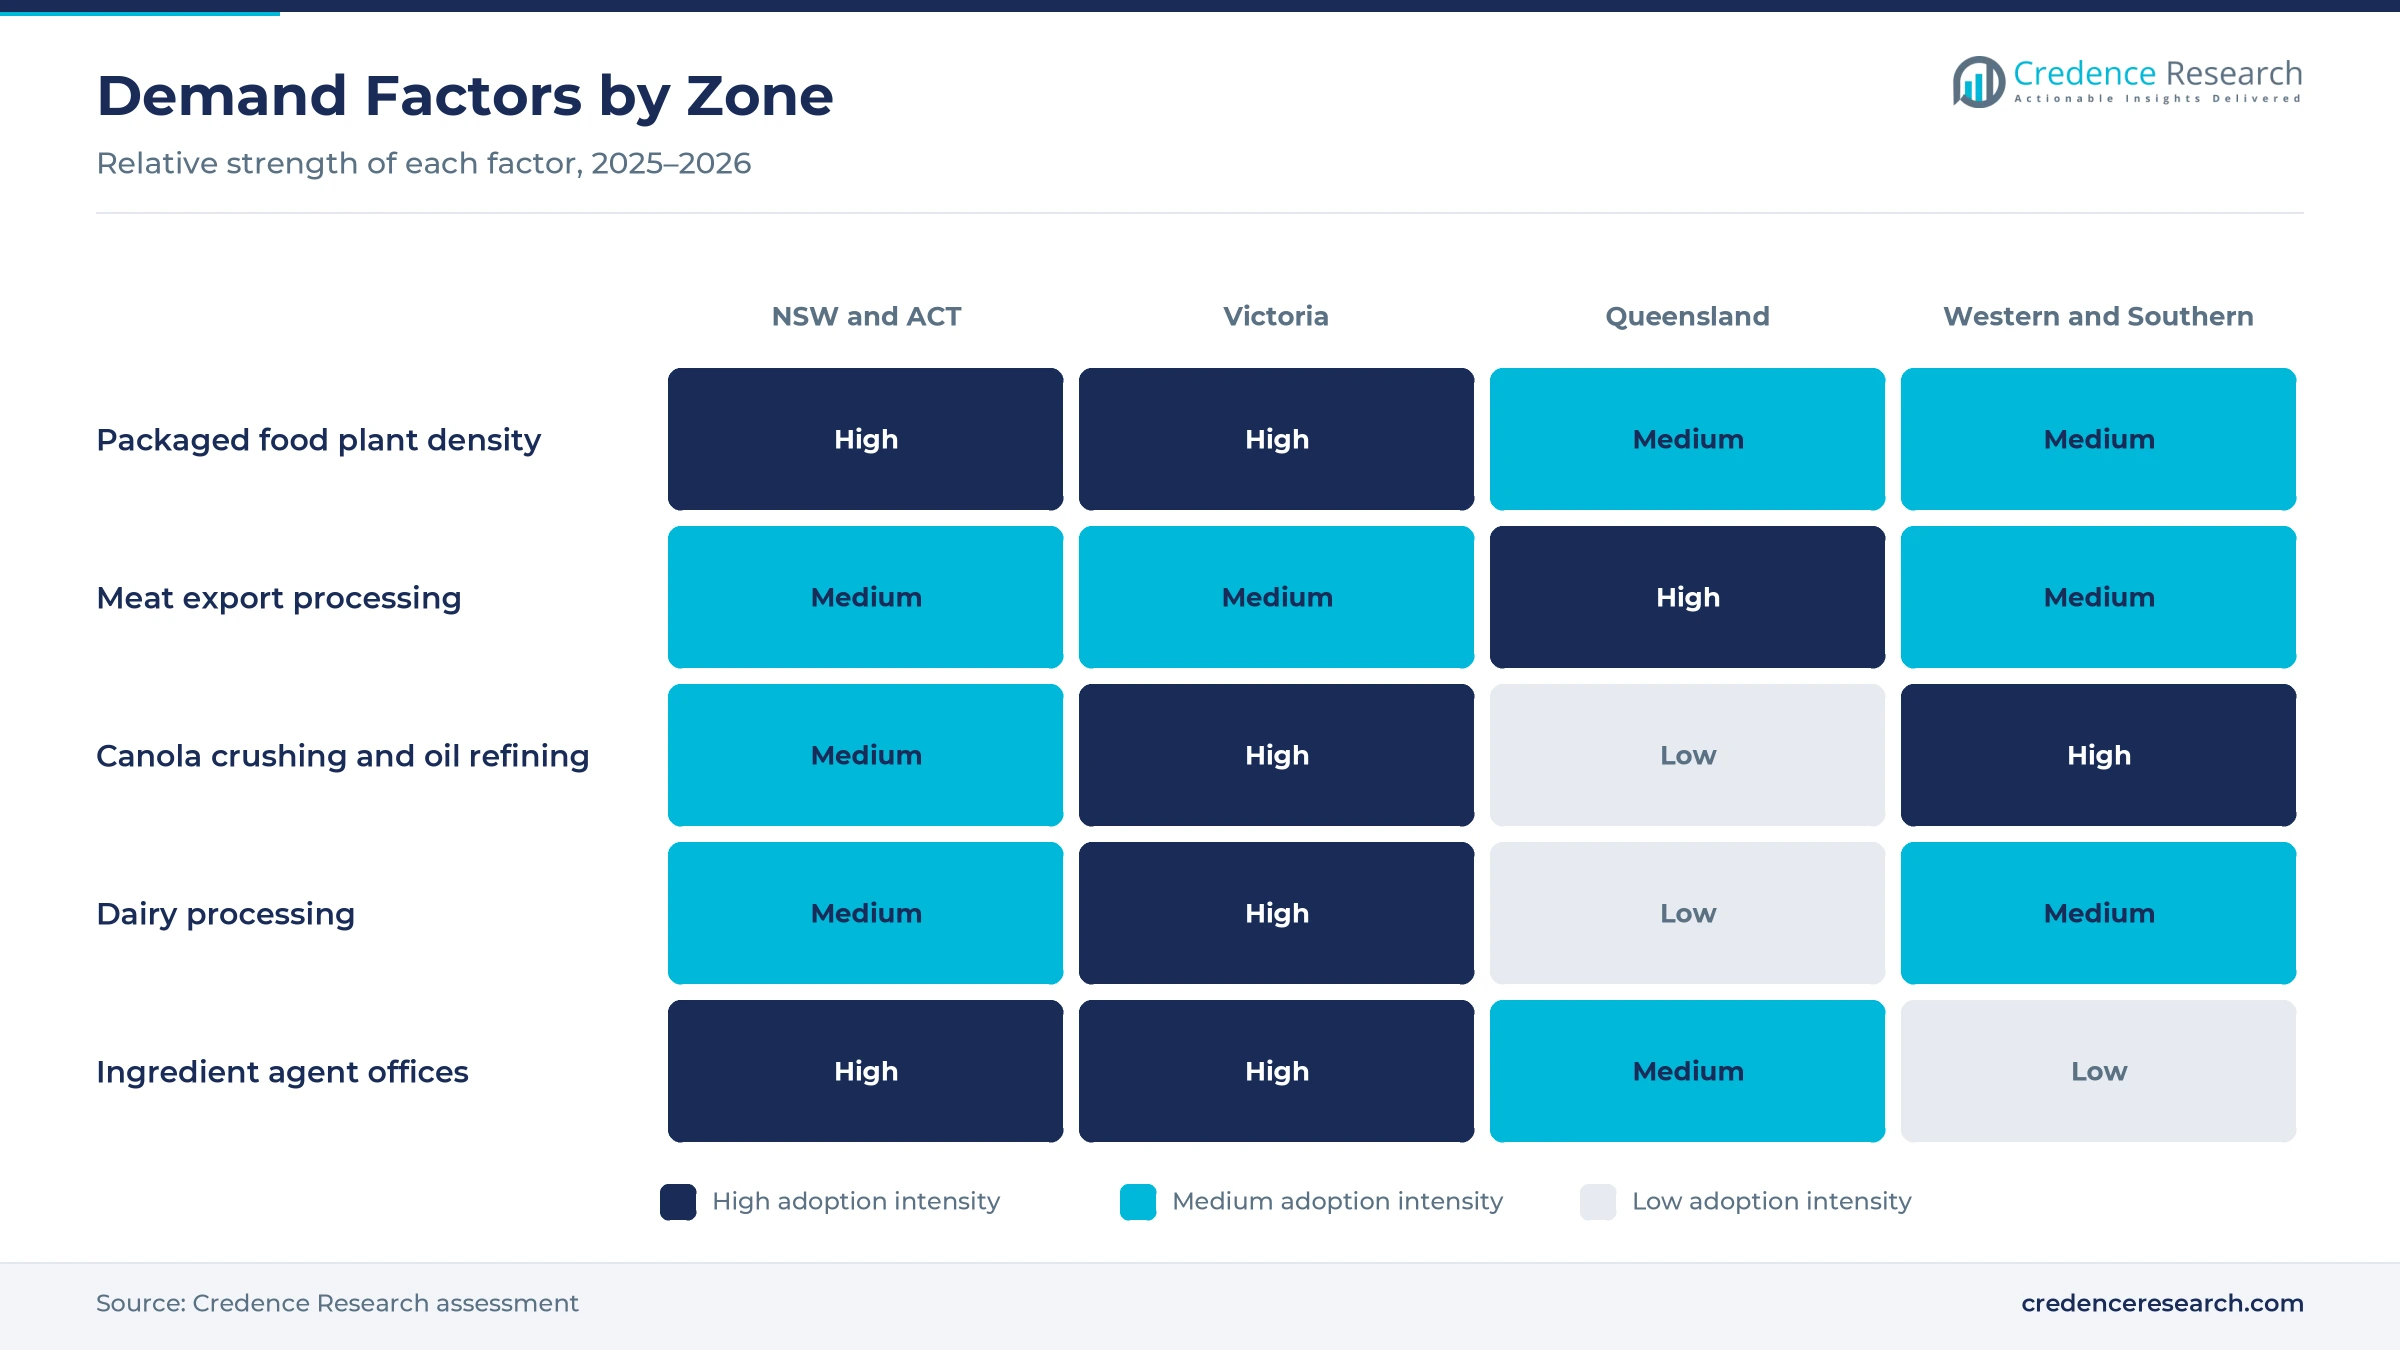
New South Wales and the Australian Capital Territory held a 33.7% share of 2025 value and grow at 5.36% a year, because the zone had about 9.16 million residents in March 2026. The state also grew about 1.6 million metric tons of canola in 2025-26, which supplies local oil refiners. Sydney also hosts many national food brands and the offices of ingredient distributors that serve them. As a result, the zone leads demand from oil, bakery and snack plants.
How does Victoria support antioxidant demand?
Victoria held a 23.0% share of 2025 value and grows at 5.51% a year, because Melbourne hosts a large base of dairy, bakery and confectionery plants. The state had about 7.15 million residents in March 2026, growing 1.6% over the year. Hawkins Watts runs its Australian office from Mulgrave, close to many dairy and bakery customers. The state also grew about 1.25 million metric tons of canola in 2025-26, which feeds local crushers. In turn, Victoria remains the second-largest single state for oil and dairy protection.
Why is Queensland growing fastest?
Queensland held a 19.0% share of 2025 value and grows fastest at 5.96% a year, because national beef shipments reached a record in 2025 and export demand for Australian meat keeps rising. The state had about 5.74 million residents in March 2026, growing 1.6% over the year. National beef shipments to the United States rose to 452,795 metric tons in 2025, up from 394,543 metric tons in 2024. As a result, meat processors in the state buy more rosemary and ascorbate blends for color protection.
What shapes demand in the western and southern zone?
Western Australia, South Australia, Tasmania and the Northern Territory held a 24.3% share of 2025 value and grow at 5.41% a year. Western Australia grew about 4.25 million metric tons of canola in 2025-26, the largest state crop. As a result, oil crushers and meat plants drive most purchases in the zone.
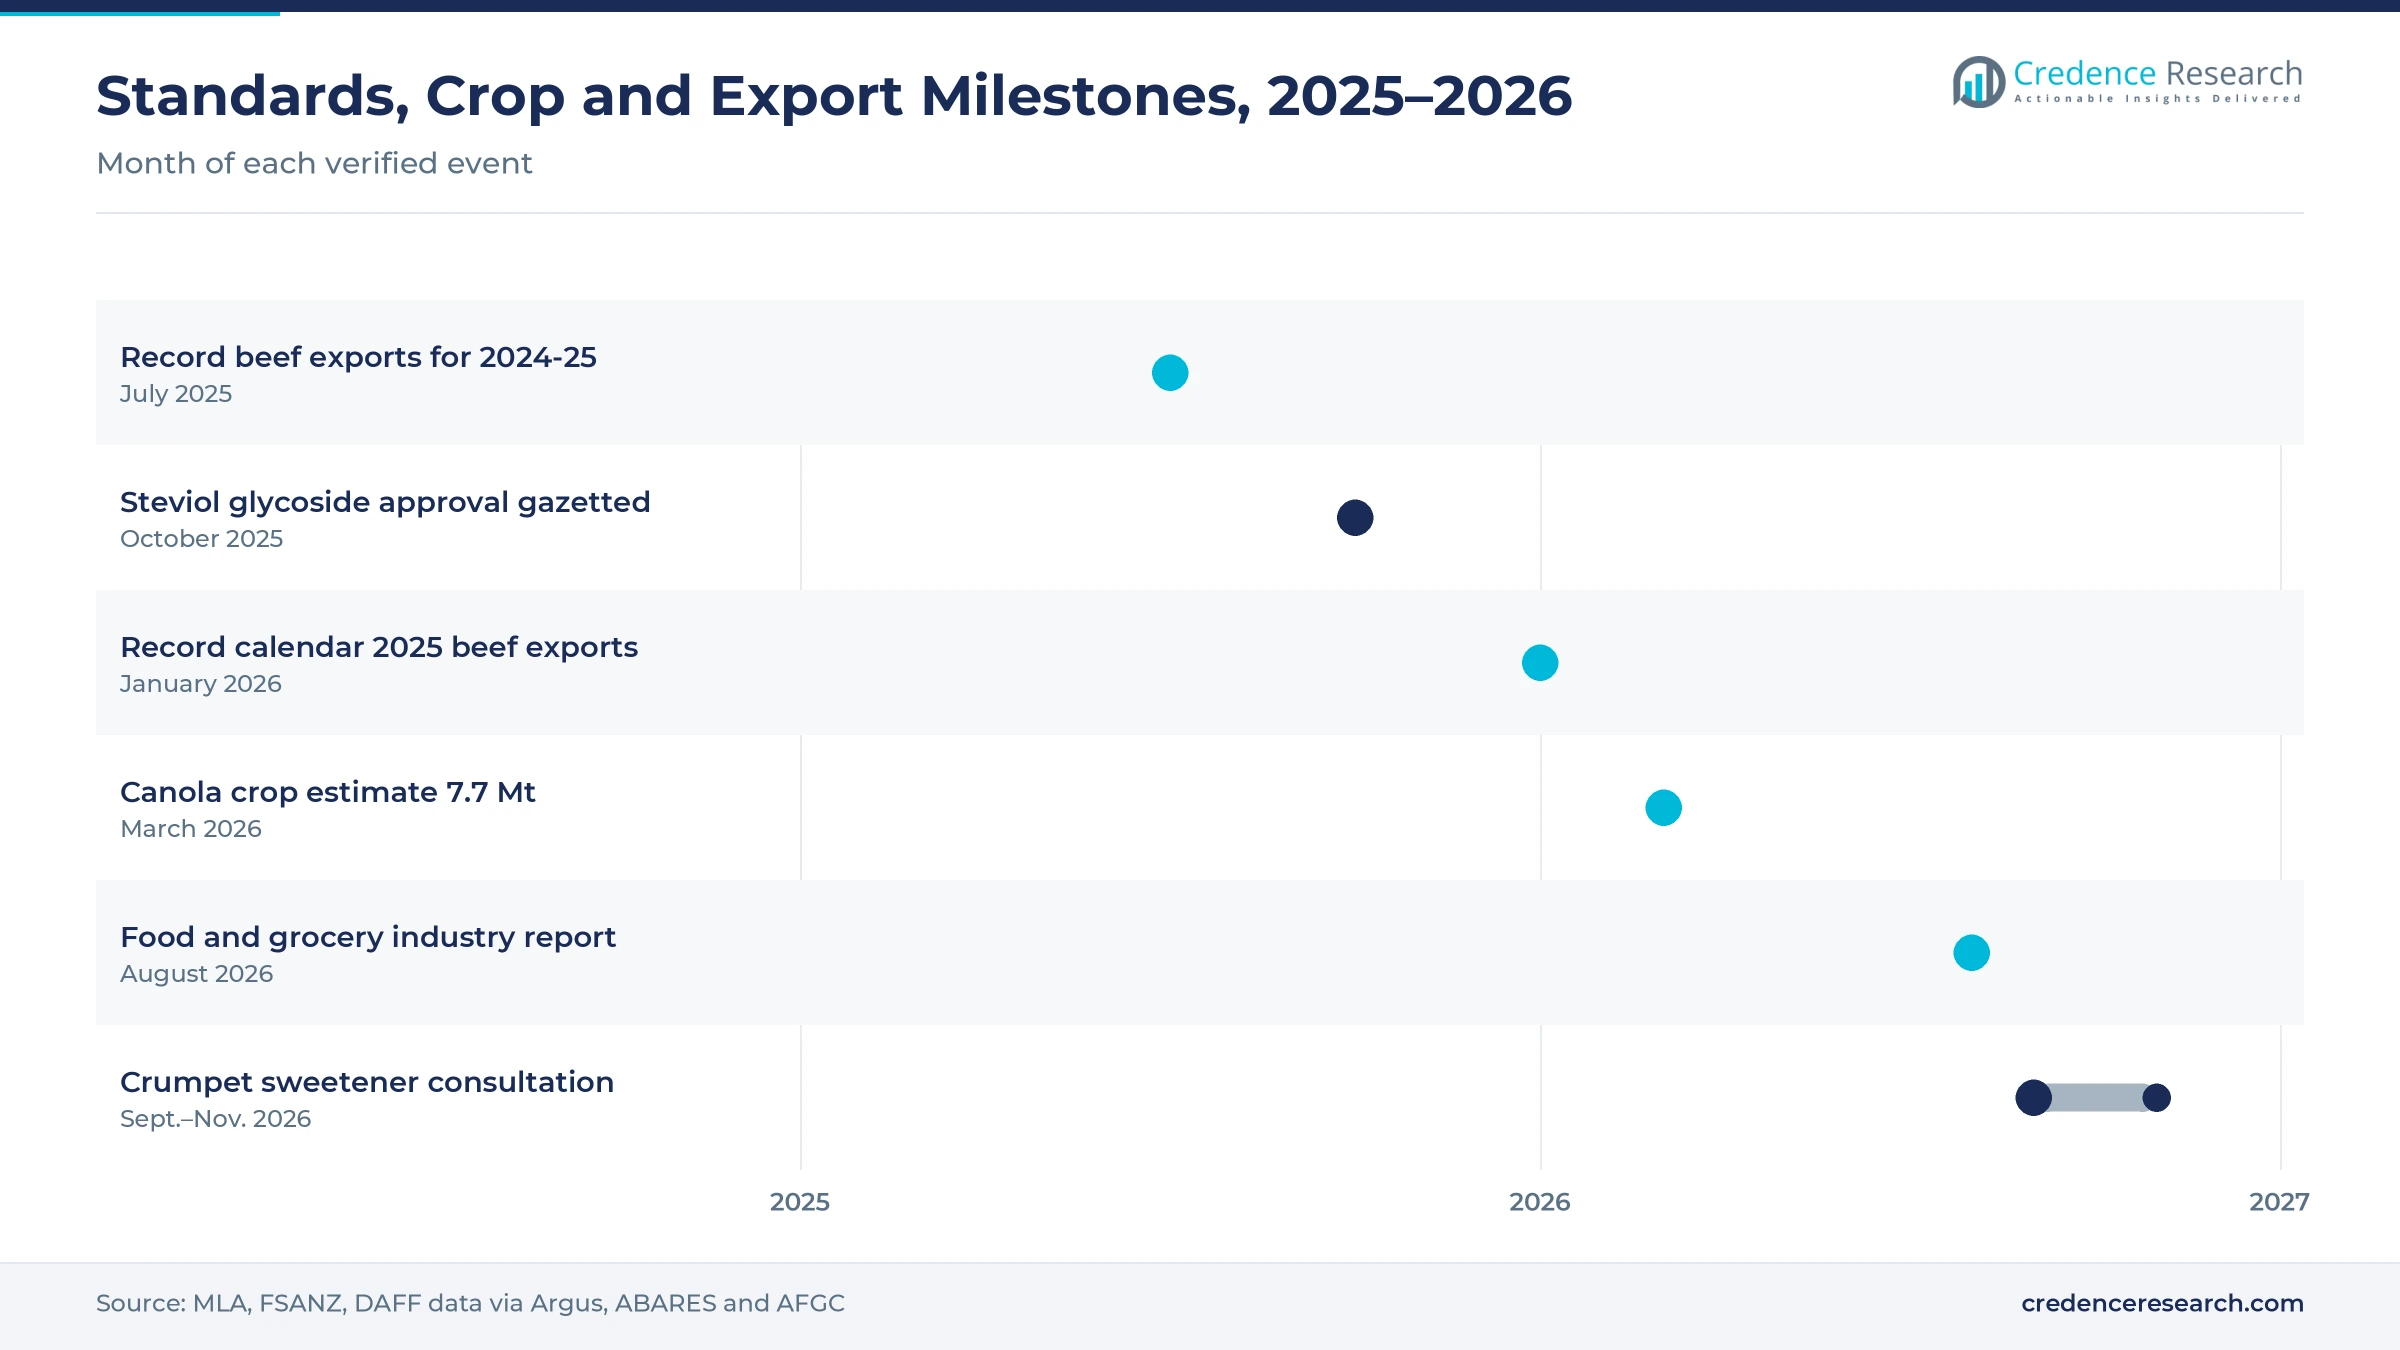
Standards, crop and export milestones, 2025–2026
| Development | Status and market relevance |
|---|---|
| In July 2025, the national red meat marketing body reported record beef and veal exports of 1.4 million metric tons for 2024-25. | Confirms export demand for longer meat shelf life |
| In October 2025, the national food regulator gazetted approval of steviol glycosides made by enzymatic conversion. | Shows continued reformulation activity in the food code |
| In January 2026, federal data showed Australian beef exports reached a record 1,545,759 metric tons in calendar 2025. | Raises demand for color and fat protection in meat |
| In March 2026, the national agricultural forecaster estimated the 2025-26 canola crop at about 7.7 million metric tons. | Supports domestic oil refining and oil stabilization demand |
| In August 2026, the Australian Food and Grocery Council reported AUD 182.6 billion in sector turnover for 2024-25. | Confirms steady growth in the main customer industry |
Extraction, blending and encapsulation change supply
- Botanical extraction concentrates carnosic acid and carnosol from rosemary or catechins from green tea, which gives food makers a label-friendly way to slow oxidation in oils and meats.
- Vitamin synthesis and distillation produce tocopherols from vegetable oil distillates and ascorbates from fermentation, which supply the largest volume grades for oils, spreads and beverages.
- Emulsified and encapsulated delivery disperses antioxidants in water or protects them in coatings, which helps beverage, dairy and bakery makers dose them evenly alongside emulsifiers and other functional ingredients.
Need a Custom Version of This Report?
Tailor the scope, geography, or segments to your exact requirements.
- Custom geography or segment scope
- Direct access to our analyst team
Global extract makers and local agents compete
Competition is split between global extract and vitamin makers and the local agents that give them technical reach. Kalsec sells its Herbalox rosemary extracts and Duralox systems through Connell Brothers, which covers all Australian states. Kemin supplies its Fortium natural and En-Hance synthetic ranges through Hawkins Watts, its agent since Jan. 1, 2009. Rivals compete on oxidation performance, label appeal, technical service, supply security and price. Because many buyers reformulate often, suppliers with laboratory support and trial programs win more long-term contracts. Large buyers such as George Weston Foods and Bega Cheese are reformulating bakery and dairy products, which opens new specification work for suppliers. Brand owners also prefer partners that can document every ingredient for food standards approval and export customers.
Which companies supply and buy shelf-life ingredients in Australia?
| Company | Type | Role in the market |
|---|---|---|
| Kalsec | Global herb and spice extract maker | Applied for rosemary extract permission as an antioxidant in 2018 |
| Connell Brothers | Specialty ingredient distributor | Channel partner for Kalsec covering all Australian states since 2014 |
| Kemin Food Ingredients | Global antioxidant maker | Offers Fortium natural and En-Hance synthetic antioxidant ranges |
| Hawkins Watts | Ingredient agent and formulator | Australian and New Zealand agent for Kemin, office in Mulgrave |
| George Weston Foods | Bakery manufacturer and buyer | Lodged bread and crumpet reformulation applications in 2026 |
| Bega Cheese | Dairy manufacturer and buyer | Applied to add plant sterols to yoghurt and cheese in 2026 |
Credence Research view on oxidation control demand
Credence Research's view is that Australian demand for shelf-life ingredients will grow steadily because food and grocery manufacturing keeps expanding and exporters need longer product life. Vitamin antioxidants remain the largest value pool, while botanical extracts add the fastest growth. Formulation partners and specialist agents are gaining influence over ingredient choice. Suppliers that combine local trial support with secure supply and label-friendly options should gain share fastest across the Australia food antioxidants base over the next decade.
How the national shelf-life additive estimate was built
The report uses 2025 as the base year on a calendar basis, and market values come from the Credence Research model. That model combines food and grocery industry statistics, World Bank manufacturing data, crop and export data, population estimates, food regulator documents and company announcements. Segment splits and zone growth rates are Credence Research estimates, while zone shares follow the client-defined split. Sources used are official statistics, regulator publications, industry reports and company releases, and no interviews or surveys were used.
Plant-based grades and partners carry growth to 2035
Ingredient value is expected to reach USD 137.8 million by 2035, a 5.52% CAGR during 2026–2035, as food makers expand output and reformulate recipes. Growth should come from botanical extracts, meat export plants and formulation partners. Strong canola harvests would support local oil refining, while higher freight and extract prices would squeeze margins on imported grades. Suppliers with local technical service and label-friendly options are expected to gain the most as Australia food antioxidants demand shifts toward plant-based systems.
Frequently Asked Questions
How big is the Australia food antioxidants market?
Which product type leads Australian antioxidant value?
Which region leads the Australian market?
How large is the food and grocery manufacturing sector?
Why do meat exports matter for antioxidant demand?
Which end-use industry is growing fastest?
Who are the leading companies in the Australian market?
What are the main challenges for suppliers?
Table of Content
Chapter 1 Market Segmentation
- 1.1 Segmentation Framework
- 1.1.1 Product and Service Classification
- 1.1.2 Application and End-Use Classification
- 1.1.3 Technology and Solution Classification
- 1.1.4 Customer and Distribution Channel Classification
- 1.1.5 Geographic Segmentation
- 1.1.6 Market Segment Definitions and Boundaries
- 1.2 By Product Type
- 1.2.1 Vitamin Antioxidants
- 1.2.2 Botanical Extracts
- 1.2.3 Synthetic Phenolic Antioxidants
- 1.3 By End-Use Industry
- 1.3.1 Fats, Oils and Spreads
- 1.3.2 Meat and Poultry
- 1.3.3 Bakery and Confectionery
- 1.3.4 Beverages
- 1.3.5 Dairy and Snacks
- 1.4 By Application
- 1.4.1 Lipid Stabilization
- 1.4.2 Colour Protection
- 1.4.3 Flavour Preservation
- 1.5 By Sales Channel
- 1.5.1 Direct Manufacturer Sales
- 1.5.2 Specialty Distributor Sales
- 1.5.3 Formulation Partner Sales
Chapter 2 Introduction
- 2.1 Report Objectives and Scope
- 2.2 Product Definition and Industry Terminology
- 2.3 Market Inclusions and Exclusions
- 2.4 Research Process
- 2.4.1 Primary Research and Expert Interviews
- 2.4.2 Secondary Research and Source Review
- 2.4.3 Top-Down and Bottom-Up Estimation
- 2.4.4 Data Triangulation and Verification
- 2.5 Market Size Measurement Basis
- 2.5.1 2025: USD 74.5 million → 2035: USD 137.8 million
- 2.6 Historical and Forecast Reference Periods
- 2.6.1 Historical Period: 2018-2025
- 2.6.2 Base Year: 2025
- 2.6.3 Forecast Period: 2025-2035
- 2.7 Research Assumptions and Limitations
Chapter 3 Executive Summary
- 3.1 Market Snapshot and Key Findings
- 3.2 Base-Year Market Size, 2025
- 3.3 Forecast Market Size, 2035
- 3.4 Revenue and Volume Growth Outlook
- 3.5 Key Demand and Supply Indicators
- 3.6 Leading Market Segments
- 3.7 Fastest-Growing Market Opportunities
- 3.8 Regional Performance Highlights
- 3.9 Technology and Industry Transformation
- 3.10 Competitive Landscape Summary
- 3.11 Analyst View and Strategic Implications
Chapter 4 Australia Food Antioxidants Market Trends and Developments
- 4.1 Historical Industry Development, 2018-2025
- 4.2 Recent Market Trends and Developments
- 4.3 Demand and Customer Behavior Trends
- 4.4 Technology and Product Innovation
- 4.5 Artificial Intelligence, Automation and Digitalization
- 4.6 Local Manufacturing and Supply Chain Realignment
- 4.7 Industry Partnerships, Mergers and Acquisitions
- 4.8 Sustainability and Circular Economy Developments
- 4.9 Government and Private Sector Investment Trends
- 4.10 Emerging Business Models and Commercialization
- 4.11 Industry Developments and Announcements
Chapter 5 Australia Food Antioxidants Market Production, Supply and Demand Analysis
- 5.1 Demand Trend and Consumption Analysis, 2018-2025
- 5.2 Demand Forecast, 2025-2035
- 5.3 Production and Output Trend, 2018-2025
- 5.4 Production and Output Forecast, 2025-2035
- 5.5 Installed Capacity and Capacity Utilization
- 5.6 Company-Wise Production Plants and Statistics
- 5.6.1 Installed Production Capacity
- 5.6.2 Actual Production
- 5.6.3 Planned Capacity and Expansion Targets
- 5.7 Supply Chain Structure and Procurement Trends
- 5.8 Supply-Demand Gap and Bottlenecks
- 5.9 Import Dependence and Sourcing Structure
- 5.10 Contract Manufacturing and Outsourcing
- 5.11 Regional Supply and Demand Concentration
Chapter 6 Australia Food Antioxidants Market Pricing Analysis
- 6.1 Pricing Structure and Measurement
- 6.2 Historical Pricing Trends, 2018-2025
- 6.3 Pricing Outlook, 2025-2035
- 6.4 Average Selling Price and Unit Economics
- 6.5 Pricing by Product and Market Segment
- 6.6 Geographic Pricing Differences
- 6.7 Key Input, Energy, Labor and Logistics Costs
- 6.8 Contract Pricing and Purchasing Models
- 6.9 Pricing Sensitivity and Competitive Positioning
- 6.10 Price, Margin and Profitability Implications
Chapter 7 Australia Food Antioxidants Market Dynamics
- 7.1 Market Growth Drivers
- 7.1.1 Demand-Side Drivers
- 7.1.2 Technology and Innovation Drivers
- 7.1.3 Infrastructure and Investment Drivers
- 7.1.4 Regulatory and Policy Drivers
- 7.2 Market Restraints
- 7.2.1 Cost and Affordability Constraints
- 7.2.2 Technology and Adoption Barriers
- 7.2.3 Supply Chain and Operational Constraints
- 7.3 Market Challenges
- 7.3.1 Competitive Pressure and Margin Erosion
- 7.3.2 Skills, Infrastructure and Implementation Gaps
- 7.4 Emerging Market Opportunities
- 7.5 Market Dynamics Impact and Time-Horizon Assessment
Chapter 8 Australia Food Antioxidants Value Chain Analysis
- 8.1 Industry Value Chain Overview
- 8.2 Upstream Suppliers and Critical Inputs
- 8.3 Technology and Component Providers
- 8.4 Manufacturing or Service Delivery
- 8.5 Distribution, Channel Partners and Integrators
- 8.6 Downstream Applications and End Users
- 8.7 Value Addition and Profit Pools
- 8.8 Vertical Integration and Outsourcing
- 8.9 Supplier Concentration and Risk
- 8.10 Supply Chain Localization and Resilience
Chapter 9 Australia Food Antioxidants Market Regulations and Policies
- 9.1 Relevant Laws, Standards and Compliance Frameworks
- 9.2 Product, Service, Safety and Quality Requirements
- 9.3 Government Policies, Incentives and Subsidies
- 9.4 Imports, Exports and Trade Barriers
- 9.5 Public Procurement and Local Content Requirements
- 9.6 Environmental and Sustainability Compliance
- 9.7 Upcoming Policy Changes and Market Implications
Chapter 10 Australia Food Antioxidants Market Hotspots and Opportunities
- 10.1 Market Opportunity Mapping and Growth Hotspots
- 10.2 High-Growth Applications and Customer Groups
- 10.3 Underserved Markets and White-Space Opportunities
- 10.4 Emerging Technology and Product Opportunities
- 10.5 New Capacity and Investment Hotspots
- 10.6 Market Entry and Expansion Opportunities
- 10.7 Distribution and Partnership Opportunities
- 10.8 Near-Term and Long-Term Commercial Potential
- 10.9 Opportunity Attractiveness and Execution Risks
Chapter 11 Australia Food Antioxidants Market Outlook, 2025-2035
- 11.1 Market Size and Analysis
- 11.1.1 Revenue (Market Measurement: 2025: USD 74.5 million → 2035: USD 137.8 million)
- 11.1.2 Market Volume and Quantity Sold
- 11.1.3 Historical Market Size, 2018-2025
- 11.1.4 Base-Year Market Size, 2025
- 11.2 Market Forecast, 2025-2035
- 11.2.1 Revenue Forecast to 2035
- 11.2.2 Volume Forecast to 2035
- 11.2.3 CAGR and Year-on-Year Growth
- 11.2.4 Incremental Revenue Opportunity
- 11.3 Forecast Assumptions and Scenario Analysis
- 11.3.1 Base-Case Forecast
- 11.3.2 Optimistic and Conservative Scenarios
- 11.3.3 Technology, Pricing and Policy Sensitivities
- 11.4 Market Attractiveness and Growth Outlook
Chapter 12 Australia Food Antioxidants Market Segmentation and Outlook
- 12.1 Segmentation Summary and Market Shares, 2025
- 12.2 Largest and Fastest-Growing Segments
- 12.3 By Product Type - Market Size and Forecast, 2025-2035
- 12.3.1 Segment Definition and Scope
- 12.3.2 Historical Market Size, 2018-2025
- 12.3.3 Revenue Forecast, 2025-2035
- 12.3.4 Volume Forecast, 2025-2035
- 12.3.5 Base-Year Market Share, 2025
- 12.3.6 Segment CAGR and Growth Drivers
- 12.3.7 Subsegment Market Size and Forecast
- 12.3.7.1 Vitamin Antioxidants
- 12.3.7.2 Botanical Extracts
- 12.3.7.3 Synthetic Phenolic Antioxidants
- 12.3.8 Subsegment Pricing and Adoption Trends
- 12.3.9 Leading Suppliers and Competition
- 12.3.10 Regional Demand and Opportunities
- 12.4 By End-Use Industry - Market Size and Forecast, 2025-2035
- 12.4.1 Segment Definition and Scope
- 12.4.2 Historical Market Size, 2018-2025
- 12.4.3 Revenue Forecast, 2025-2035
- 12.4.4 Volume Forecast, 2025-2035
- 12.4.5 Base-Year Market Share, 2025
- 12.4.6 Segment CAGR and Growth Drivers
- 12.4.7 Subsegment Market Size and Forecast
- 12.4.7.1 Fats, Oils and Spreads
- 12.4.7.2 Meat and Poultry
- 12.4.7.3 Bakery and Confectionery
- 12.4.7.4 Beverages
- 12.4.7.5 Dairy and Snacks
- 12.4.8 Subsegment Pricing and Adoption Trends
- 12.4.9 Leading Suppliers and Competition
- 12.4.10 Regional Demand and Opportunities
- 12.5 By Application - Market Size and Forecast, 2025-2035
- 12.5.1 Segment Definition and Scope
- 12.5.2 Historical Market Size, 2018-2025
- 12.5.3 Revenue Forecast, 2025-2035
- 12.5.4 Volume Forecast, 2025-2035
- 12.5.5 Base-Year Market Share, 2025
- 12.5.6 Segment CAGR and Growth Drivers
- 12.5.7 Subsegment Market Size and Forecast
- 12.5.7.1 Lipid Stabilization
- 12.5.7.2 Colour Protection
- 12.5.7.3 Flavour Preservation
- 12.5.8 Subsegment Pricing and Adoption Trends
- 12.5.9 Leading Suppliers and Competition
- 12.5.10 Regional Demand and Opportunities
- 12.6 By Sales Channel - Market Size and Forecast, 2025-2035
- 12.6.1 Segment Definition and Scope
- 12.6.2 Historical Market Size, 2018-2025
- 12.6.3 Revenue Forecast, 2025-2035
- 12.6.4 Volume Forecast, 2025-2035
- 12.6.5 Base-Year Market Share, 2025
- 12.6.6 Segment CAGR and Growth Drivers
- 12.6.7 Subsegment Market Size and Forecast
- 12.6.7.1 Direct Manufacturer Sales
- 12.6.7.2 Specialty Distributor Sales
- 12.6.7.3 Formulation Partner Sales
- 12.6.8 Subsegment Pricing and Adoption Trends
- 12.6.9 Leading Suppliers and Competition
- 12.6.10 Regional Demand and Opportunities
- 12.7 Segment Growth Comparison
- 12.8 Segment Attractiveness and Priority Matrix
Chapter 13 Australia Food Antioxidants End-Use and Application Market Outlook
- 13.1 End-Use Industry and Customer Demand Structure
- 13.2 Leading Applications and Customer Groups
- 13.3 End-Use Market Size, Share and Forecast
- 13.4 Major End-Use Industry Deep Dives
- 13.4.1 Customer Requirements and Use Cases
- 13.4.2 Demand and Replacement Cycles
- 13.4.3 Technical and Regulatory Considerations
- 13.4.4 Purchasing and Procurement Models
- 13.4.5 Leading Vendors and Distribution Channels
- 13.4.6 Forecast and Commercial Opportunities
- 13.5 Emerging Applications and Cross-Segment Demand
- 13.6 End-Use Industry Investment Priorities
Chapter 14 Australia Food Antioxidants Geographic Market Outlook, 2025-2035
- 14.1 Domestic Market Distribution and Demand Clusters
- 14.2 State- or Province-Wise Market Size and Forecast, 2025-2035
- 14.3 City and Metropolitan Market Outlook
- 14.4 Industrial, Manufacturing and Commercial Clusters
- 14.5 Geographic Concentration of Key End Users
- 14.6 Local Pricing and Purchasing Differences
- 14.7 Domestic Production Facilities and Capacity Map
- 14.8 Local Infrastructure and Project Pipeline
- 14.9 State-Level Policy and Incentive Differences
- 14.10 Subnational Investment Hotspots and Opportunities
- 14.11 Distribution and Logistics Networks
- 14.12 Domestic Competitive Footprint
Chapter 15 Australia Food Antioxidants Technology, Innovation and Sustainability Outlook
- 15.1 Technology Landscape and Maturity
- 15.2 Product, Process and Service Innovation
- 15.3 AI, Automation and Digital Tools in the Industry
- 15.4 Technology Adoption and Performance Benchmarking
- 15.5 Innovation Pipeline and R&D Investment
- 15.6 Patent and Intellectual Property Trends
- 15.7 Energy Efficiency and Resource Management
- 15.8 Sustainability, Recycling and Circularity
- 15.9 Technology Roadmap, 2025-2035
- 15.10 Risks of Obsolescence and Technology Substitution
Chapter 16 Australia Food Antioxidants Market Key Strategic Imperatives
- 16.1 Growth and Market Entry Priorities
- 16.2 High-Return Products and Segments
- 16.3 Pricing, Profitability and Cost Optimization
- 16.4 Technology Investment and Product Differentiation
- 16.5 Supply Chain Localization and Resilience
- 16.6 Distribution and Customer Acquisition
- 16.7 Partnership, Acquisition and Capacity Strategy
- 16.8 Regional Expansion Priorities
- 16.9 Short-, Medium- and Long-Term Actions
Chapter 17 Competition Outlook
- 17.1 Industry Competition Characteristics
- 17.2 Market Structure and Concentration
- 17.3 Market Share and Competitive Positioning, 2025
- 17.4 Company-Wise Revenue and Product Benchmarking
- 17.5 Production and Service Capacity Benchmarking
- 17.6 Technology, Pricing and Differentiation
- 17.7 Regional Footprint and Distribution Strength
- 17.8 Mergers, Acquisitions and Strategic Alliances
- 17.9 New Entrants and Competitive Threats
- 17.10 Porter's Five Forces and Industry Attractiveness
- 17.11 Competitive Outlook, 2025-2035
Chapter 18 Company Profiles
- 18.1 Company Coverage and Selection Criteria
- 18.2 Kalsec
- 18.2.1 Business Description
- 18.2.2 Company Ownership and Geographic Presence
- 18.2.3 Product and Service Portfolio
- 18.2.4 Manufacturing and Operating Footprint
- 18.2.5 Production Capacity and Expansion Plans
- 18.2.6 Financial Performance and Investment
- 18.2.7 Market Share and Competitive Position
- 18.2.8 Technology and Innovation Capabilities
- 18.2.9 Strategic Alliances or Partnerships
- 18.2.10 Recent Developments
- 18.2.11 Growth Strategy and Outlook
- 18.3 Connell Brothers
- 18.4 Kemin Food Ingredients
- 18.5 Hawkins Watts
- 18.6 George Weston Foods
- 18.7 Bega Cheese
- 18.8 Other Relevant Market Participants
Note: Every listed company is profiled on the structure shown under the first company. The company list is preliminary and may change based on research findings, market developments, data availability and client requirements.
Chapter 19 Disclaimer
- 19.1 Research and Forecast Disclaimer
- 19.2 Data Source and Estimation Limitations
Note: The depth of individual sections depends on data availability for this market. Volume, capacity, trade and other unit-based metrics are included where applicable.

