
Everyday snacking keeps Indonesian confectionery growing
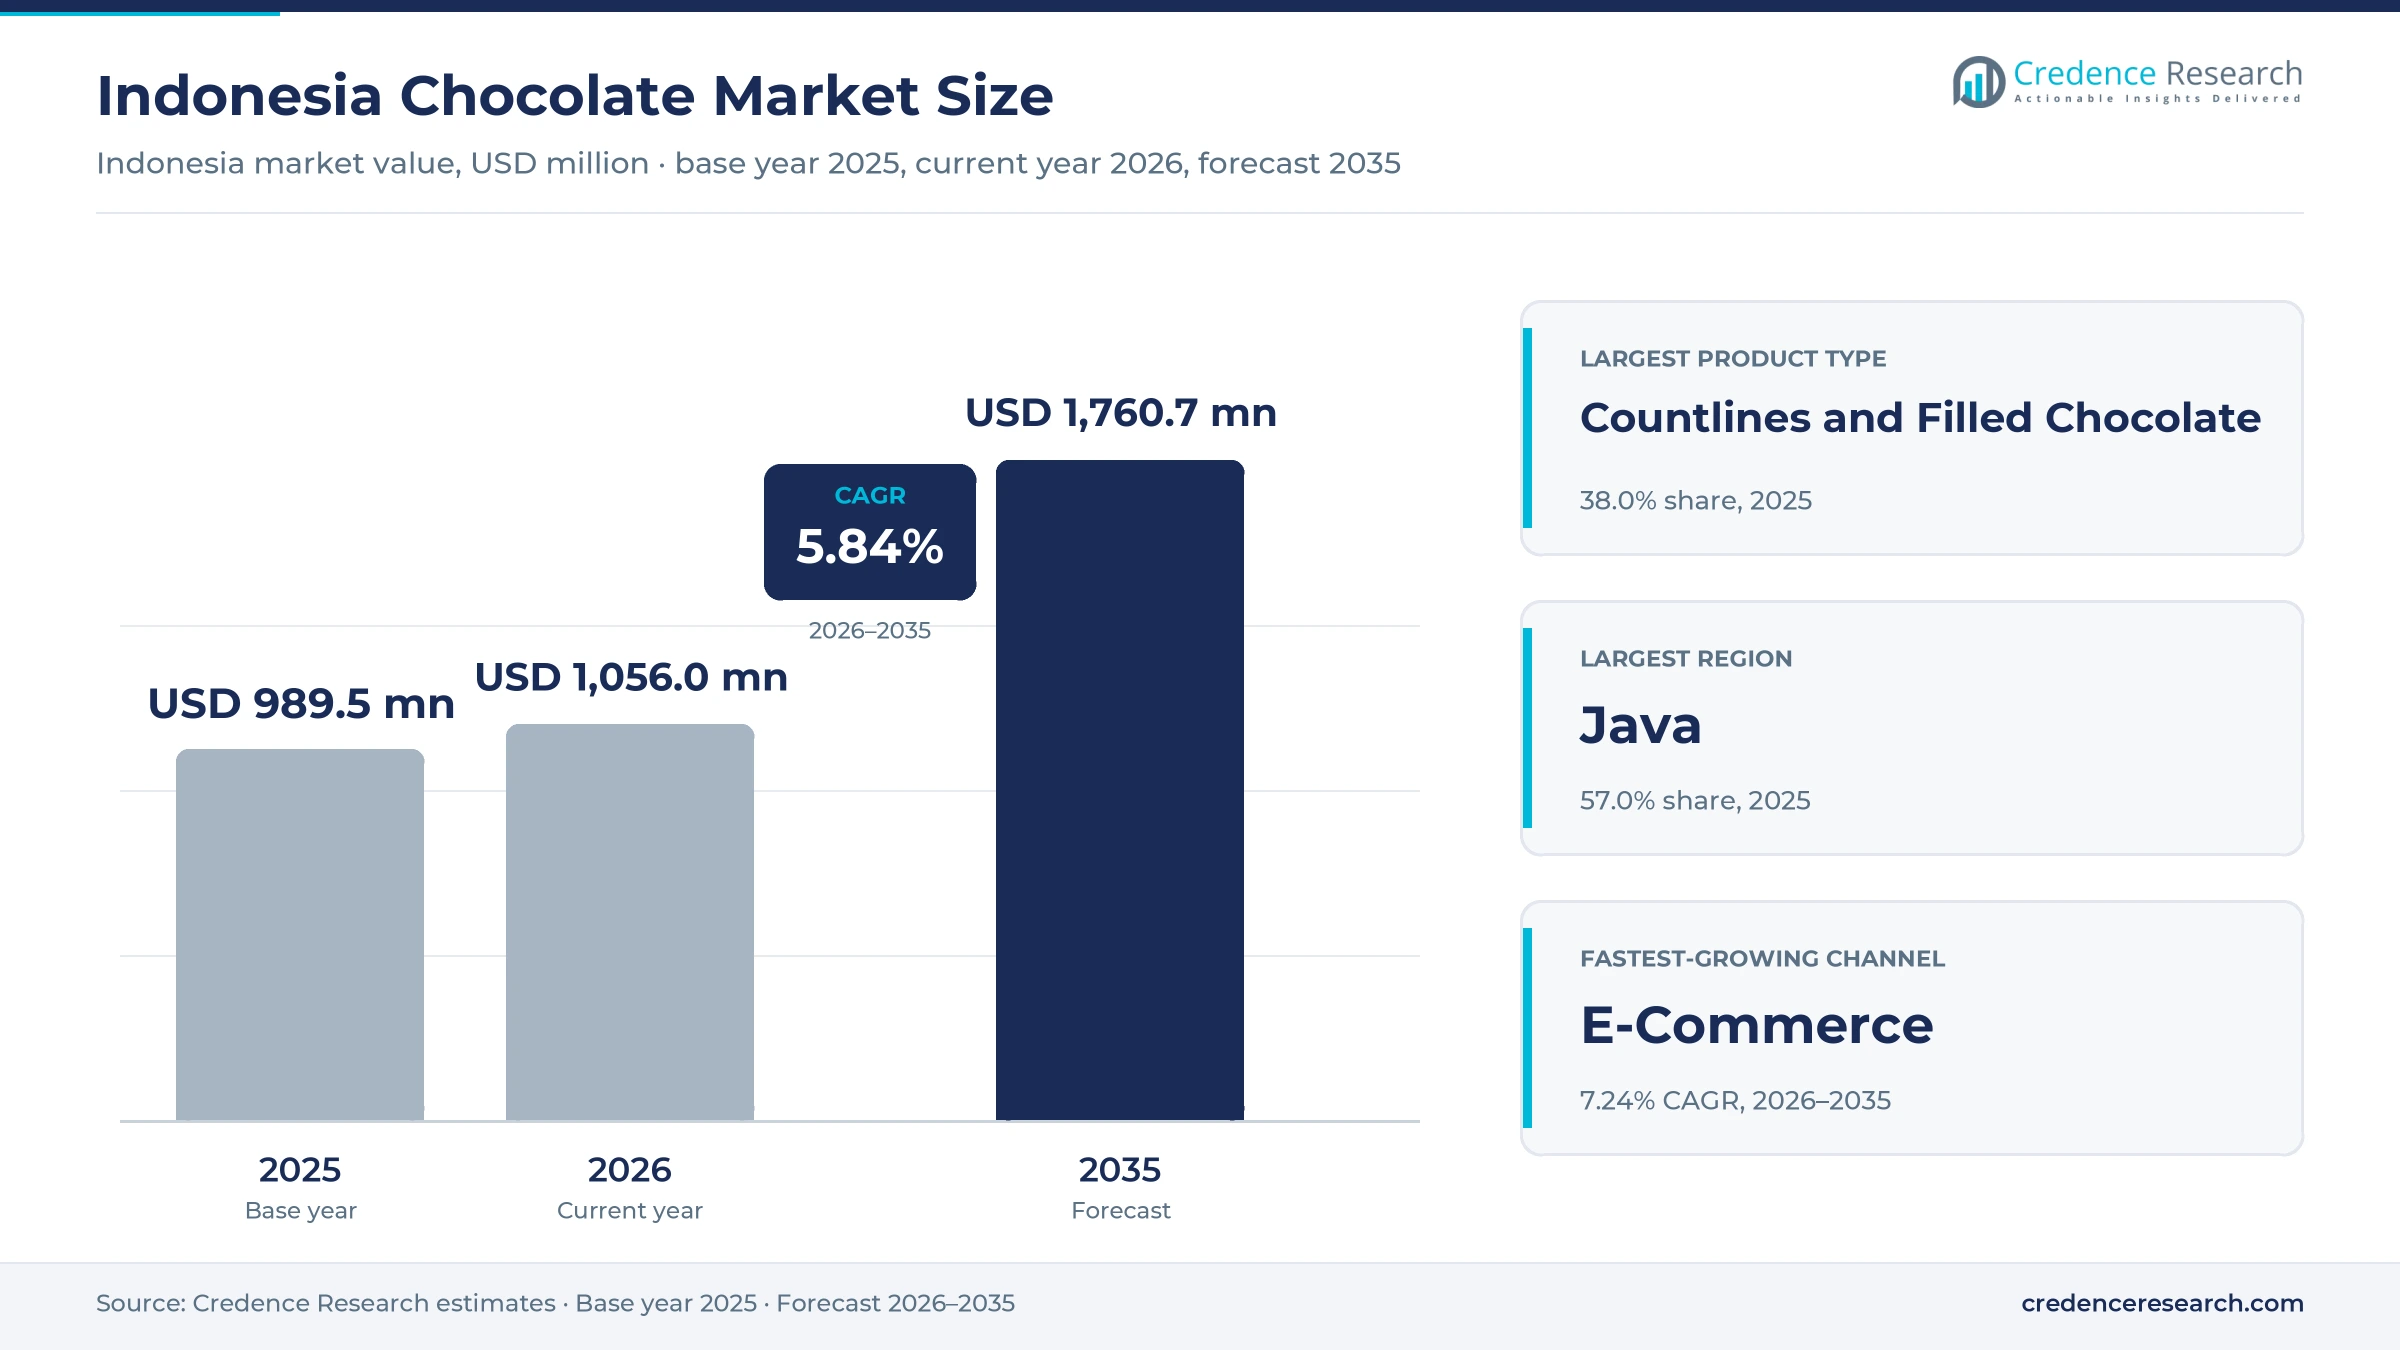
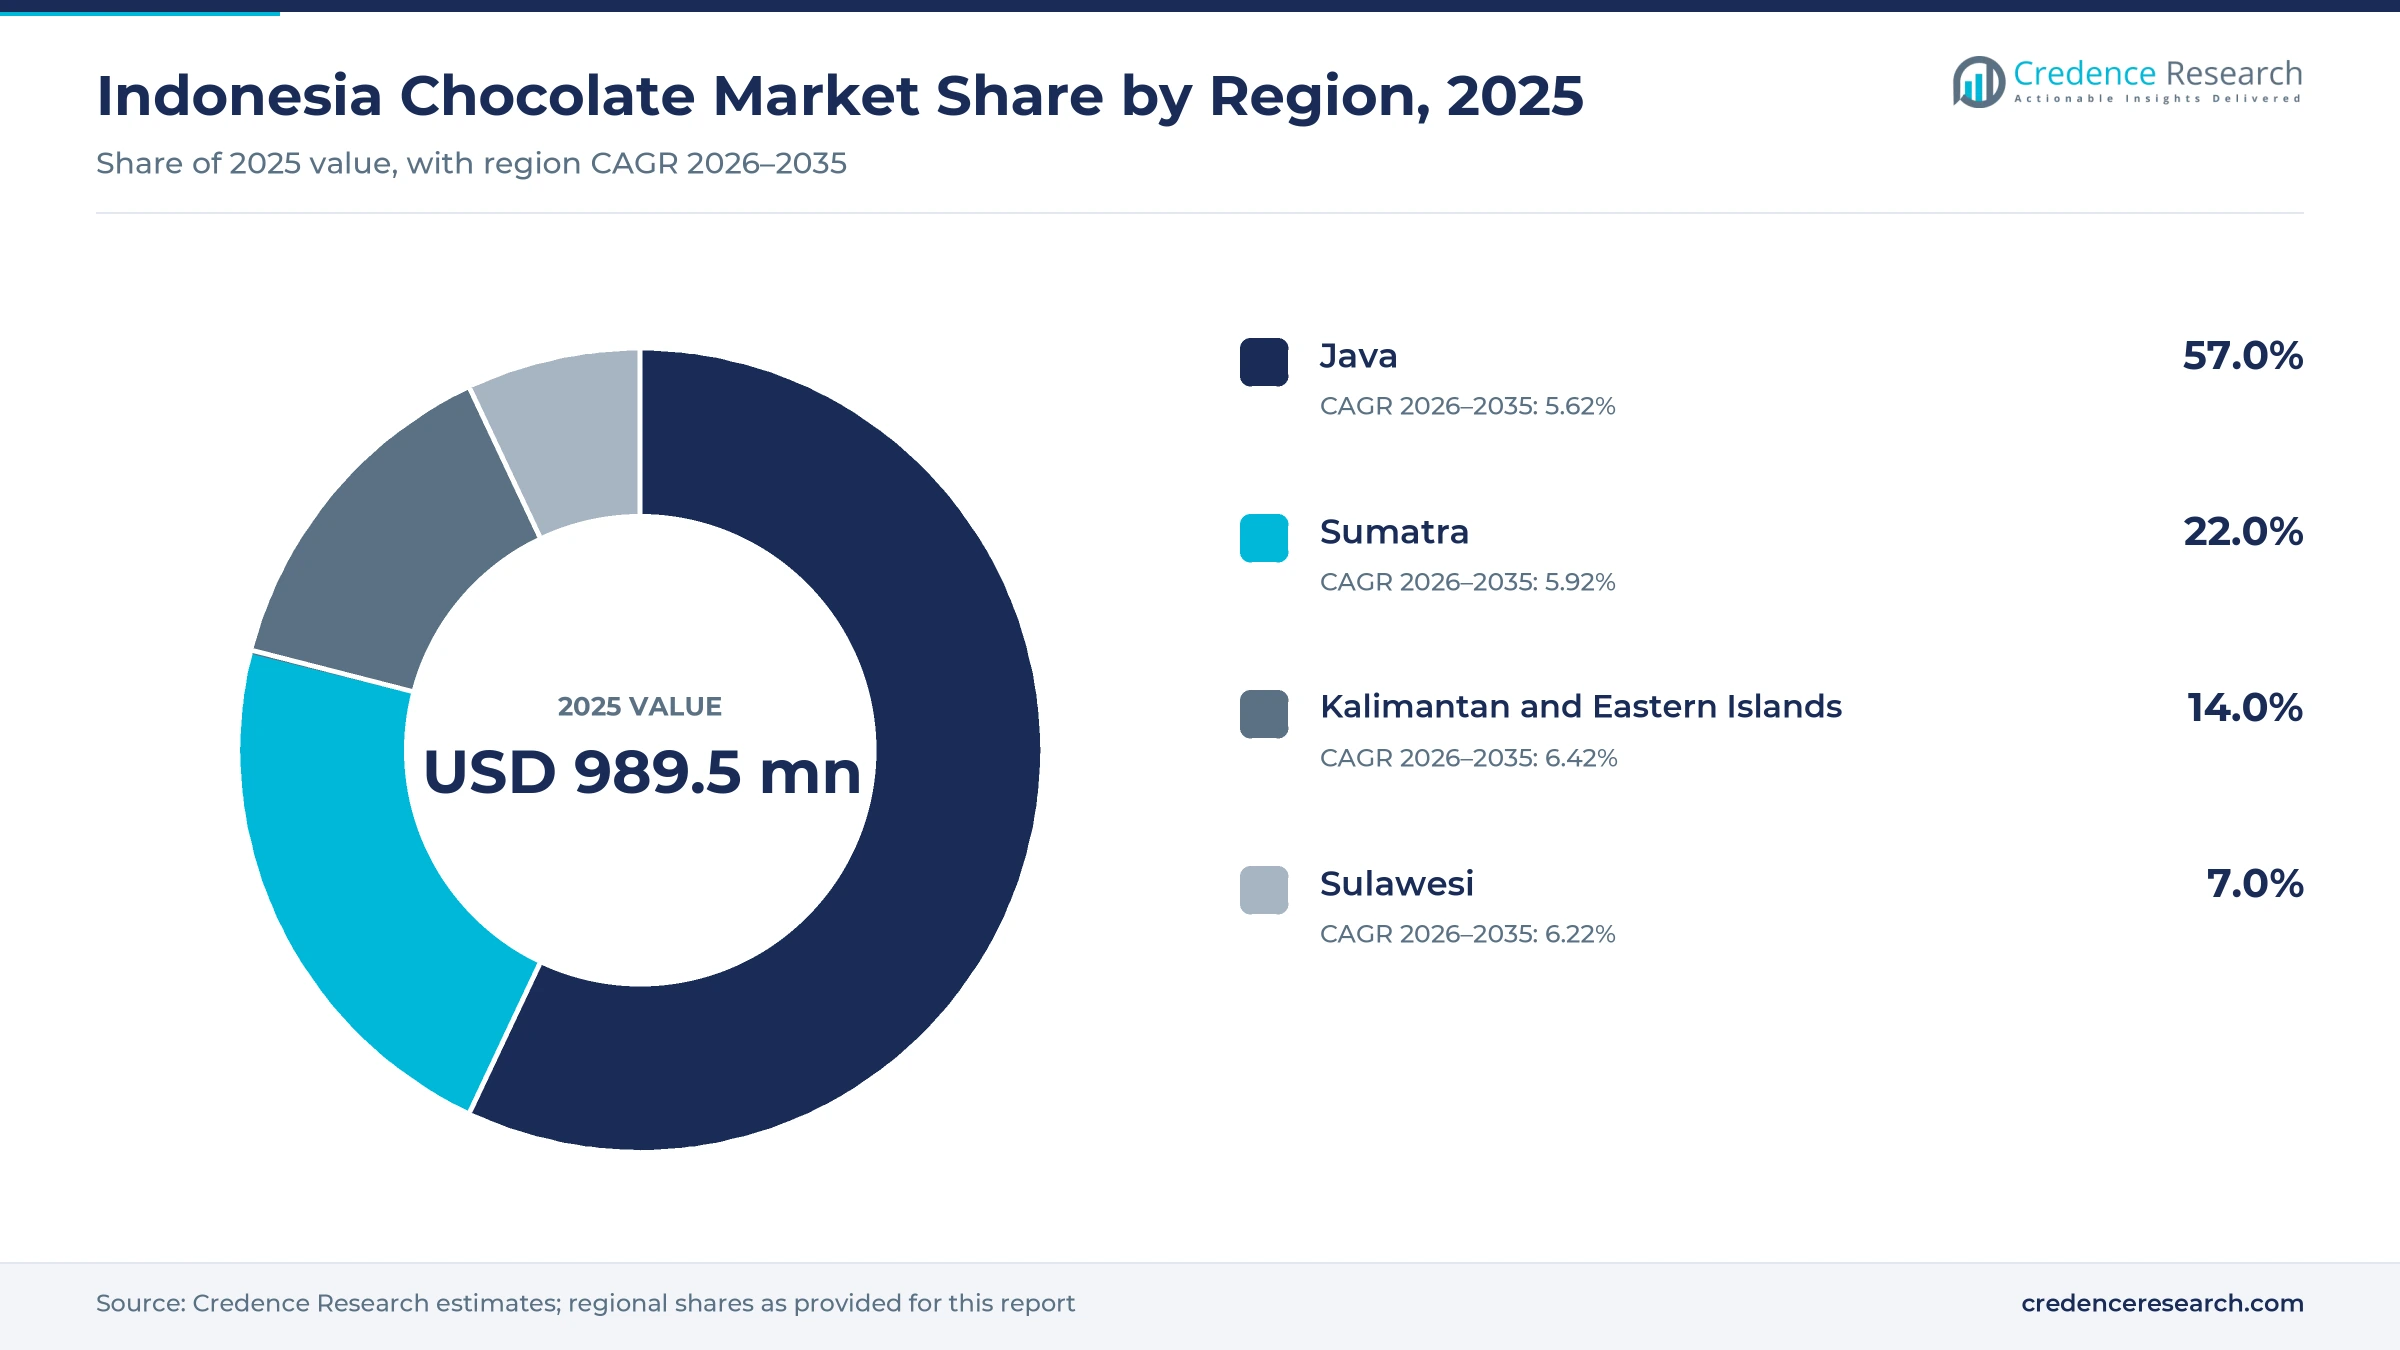
The Indonesia chocolate market was valued at USD 989.5 million in 2025 and is projected to increase from USD 1.06 billion in 2026 to USD 1.76 billion by 2035, registering a CAGR of 5.84% during 2026–2035. Demand comes from one of the largest consumer bases in Asia, where families buy wafers, countlines and bars as everyday snacks and as gifts for holidays and visits. Java held the largest regional share, 57.0% in 2025, because Jakarta, Bandung, Surabaya and Yogyakarta form the densest network of shoppers and modern stores. Kalimantan and the eastern islands grow fastest at 6.42% a year, as minimarket chains open more outlets outside Java. The most important commercial change is the jump in cocoa costs since 2024, which pushed brands to raise prices and rethink pack sizes, while a new cocoa export levy aims to fund replanting.
Which products and sales channels does the estimate count?
The estimate measures retail sales value of chocolate tablets and bars, countlines and filled products, boxed assortments and pralines, and seasonal and novelty items bought by consumers in Indonesia. It covers sales through minimarkets, convenience stores, supermarkets, hypermarkets, online stores and specialty food shops. Values are stated in USD million at current prices, converted from rupiah at average annual exchange rates.
The estimate excludes cocoa beans, cocoa butter, powder and couverture sold to industrial buyers, as well as chocolate drinks and spreads. It also excludes products made in Indonesia for export buyers. The value chain runs from cocoa farms and grinders through brand owners and distributors to retailers, online sellers and households.
Indonesia Chocolate Market Insights
- The Indonesia chocolate market was valued at USD 989.5 million in 2025 and is projected to reach USD 1.76 billion by 2035, registering a CAGR of 5.84% during 2026–2035.
- Java held 57.0% of 2025 value, because its large cities hold the densest network of shoppers, minimarkets and modern grocery stores in the country.
- Countlines and filled chocolate led with 38.0% of 2025 value, as wafers and filled snacks sell at low prices in single-serve wrappers.
- A cocoa export levy took effect on Oct. 22, 2025, to fund replanting, seedlings and research for the domestic cocoa supply chain.
- E-commerce grows fastest among channels at 7.24% a year during 2026–2035, as online shoppers discover craft bars and gift boxes.
Countlines, minimarkets and daily snacks carry most value
Why do countlines and filled products lead sales?
Based on product type, the market is categorized into chocolate tablets and bars, countlines and filled chocolate, boxed assortments and pralines, and seasonal and novelty chocolate. Countlines and Filled Chocolate led with 38.0% of 2025 value, because wafer and filled snacks sell at low prices in single-serve wrappers. Chocolate Tablets and Bars grow fastest at 6.18% a year, as craft makers and premium brands add dark and single-origin bars.
Which channels sell the most confectionery?
Based on distribution channel, the market is categorized into minimarkets and convenience stores, supermarkets and hypermarkets, e-commerce and specialty chocolate and food stores. Minimarkets and Convenience Stores led with 46.0% of 2025 value, because shoppers buy small snacks near home every day. E-Commerce grows fastest at 7.24% a year, as online stores carry wider ranges of gift boxes and craft bars.
How do snacking and gifting shape demand?
Based on purchase occasion, the market is categorized into everyday snacking, gifting and celebrations, travel and impulse, and home sharing. Everyday Snacking led with 52.0% of 2025 value, because families buy low-priced wafers and bars for children and adults every week. Gifting and Celebrations grows fastest at 6.31% a year, as buyers choose boxed and craft products for holidays and visits.
How do price tiers divide the shelf?
Based on price tier, the market is categorized into value, mainstream, premium and artisanal and luxury products. Mainstream led with 46.0% of 2025 value, because national brands sell familiar snacks at prices that most households accept. Artisanal and Luxury grows fastest at 6.97% a year, as local craft makers sell single-origin bars in cities and through online stores across the country.
| Segment Group | Leading Sub-segment | Share, 2025 | Fastest-growing Sub-segment | CAGR, 2026–2035 |
|---|---|---|---|---|
| By Product Type | Countlines and Filled Chocolate | 38.0% | Chocolate Tablets and Bars | 6.18% |
| By Distribution Channel | Minimarkets and Convenience Stores | 46.0% | E-Commerce | 7.24% |
| By Purchase Occasion | Everyday Snacking | 52.0% | Gifting and Celebrations | 6.31% |
| By Price Tier | Mainstream | 46.0% | Artisanal and Luxury | 6.97% |
Request a Free Sample
Fill in your details and we'll send you a free sample report.
- Sample data tables & charts
- Research methodology
Big households, local cocoa and online stores lift sales
How do a large consumer base and steady household demand lift sales?
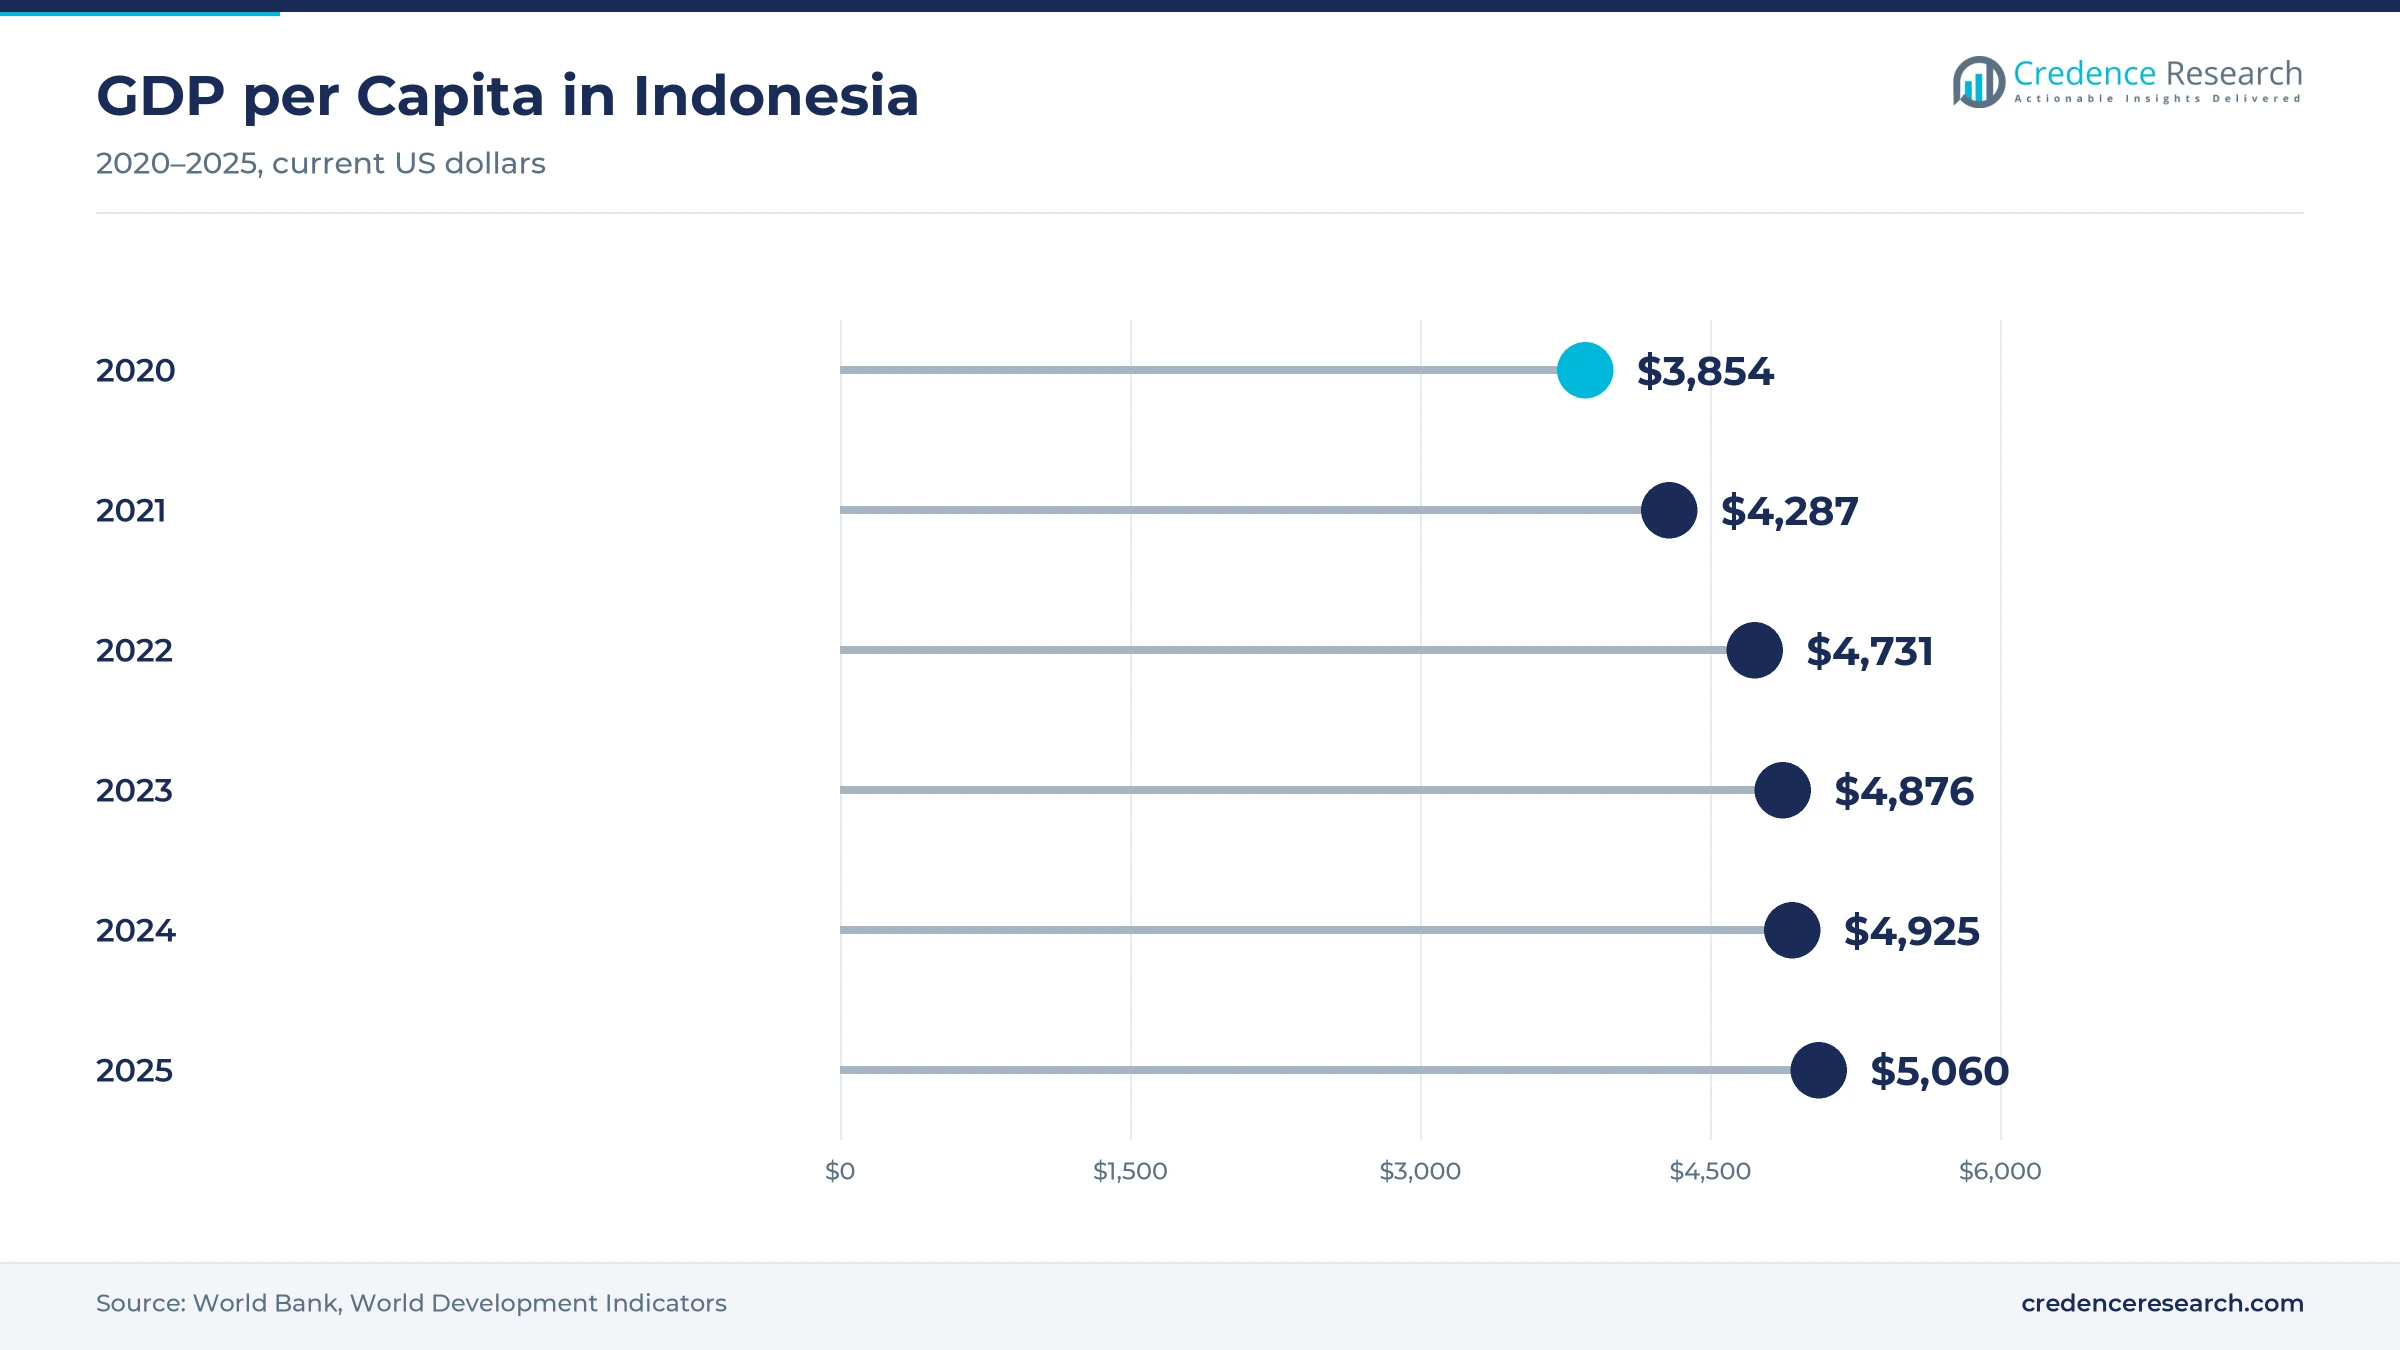
A large consumer base and steady household demand keep sales rising, because most families buy small sweet snacks as part of their regular shopping. The population reached about 285.7 million in 2025, while GDP per capita rose to about $5,060 from $3,854 in 2020, according to World Bank data. Domestic cocoa consumption reached 70.9 grams per person in 2022, 38% higher than in 2002, according to the Coordinating Ministry for Food. Delfi Limited also reported higher own-brand sales in Indonesia in 2025, helped by promotions and a government stimulus package. As a result, everyday snacking holds 52.0% of 2025 value, and mainstream products remain the core of household baskets across the country.
Why does the domestic cocoa base support local value addition?
The domestic cocoa base supports local value addition, because grinders and brand owners can buy beans, butter and powder close to their plants. The country has 11 cocoa processing facilities with combined capacity above 750,000 metric tons of beans a year, according to Food Business MEA. However, those plants run at about 60% of capacity, and the country imported 157,000 tons of beans in 2024. Bean output recovered to about 200,000 metric tons in the 2024/25 season from about 160,000 metric tons two years earlier. A cocoa export levy also took effect on Oct. 22, 2025, to fund replanting and research, according to RRI. In turn, local cocoa butter and powder supply supports domestic brands.
How do digital commerce and premium discovery widen demand?
Digital commerce and premium discovery widen demand, because online stores let shoppers find craft bars and gift boxes that few local shops stock. Bank Indonesia reported e-commerce transactions of IDR 44.4 trillion in July 2025, with volume up 16.89% from a year earlier to 466.93 million orders. The average online order was about IDR 95,000, a size that suits multipacks and small gift boxes. Craft makers such as Krakakoa, which runs a factory in Lampung, and Pipiltin Cocoa, which buys beans from Tabanan in Bali and Pidie Jaya in Aceh, sell single-origin bars to curious buyers. Consequently, e-commerce grows fastest among channels at 7.24% a year during 2026–2035.
Why does minimarket expansion beyond Java reach new buyers?
Minimarket expansion beyond Java reaches new buyers, because most wafers, countlines and bars are bought on impulse near home. Alfamart stores outside Java made up 35% of its network in the first quarter of 2025, according to IDN Financials. Its sales outside Java rose 15.7% in the first half of 2025, faster than growth in Greater Jakarta and the rest of Java. The chain also planned to open 1,000 new outlets in 2025, with most of the expansion beyond Java. Mayora announced IDR 1 trillion of 2025 capital spending to expand packaged food and beverage capacity. As a result, minimarkets remain the leading channel for confectionery demand, and the islands outside Java gain the most new outlets.
Cocoa costs, halal rules and craft bars reshape the shelf
How is the shift toward price changes and smaller packs playing out?
Brands are shifting toward price changes and careful pack sizes, because cocoa is the defining ingredient of every bar and wafer. Cocoa futures ended 2024 at US$11,441 per metric ton in London, according to the International Cocoa Organization. Mayora announced in June 2024 that it would raise prices on some chocolate products, such as Beng-Beng and Choki-Choki, after cocoa bean prices nearly tripled that year. Delfi also cited cocoa prices at historic peaks during 2025, although they have since softened. Consequently, value products face margin pressure, while mainstream lines hold share through promotions, and makers of biscuits and wafers use single-serve wrappers to keep entry prices low.
Why is halal certification rising as a shelf requirement?
Halal certification is rising as a firm shelf requirement, because the country now requires certificates for food and beverage products in circulation. The obligation took effect on Oct. 18, 2024, for medium and large businesses, according to BPJPH. Micro and small producers had until Oct. 17, 2026, to obtain certificates, which covers many small confectionery makers. Uncertified products already in circulation may receive a written warning or be withdrawn from the market. The religious affairs minister also sets the deadline for foreign food products after mutual recognition deals. In turn, brands invest in certified ingredients and halal packaging to protect shelf space.
Can single-origin and craft bars open premium growth?
Single-origin and craft bars offer a clear opening, because local cocoa regions give domestic makers a story that imported brands cannot match. Chocolate Monggo marked its 20th anniversary with a talk on local cocoa in Yogyakarta on May 29, 2025. Krakakoa has supported cacao farmers since 2013 and makes its products in Lampung. Pipiltin Cocoa sells bars in three Jakarta locations, including Grand Indonesia, using beans from Bali and Aceh. However, local buyers still prefer sweetened cocoa, while much domestic production is dark cocoa, according to the cocoa fund agency. As a result, artisanal and luxury products grow fastest by price tier at 6.97% a year, supported by gifting demand.
Is there room to grow through higher farm yields?
Higher farm yields open room for local sourcing, because better harvests would let more makers use domestic cocoa beans at stable cost. Average productivity is about 230 kilograms per hectare, and good farm practices could lift it to 500 kilograms and national output to 438,000 tons, according to the Coordinating Ministry for Food. About 290,383 hectares of cocoa land are unproductive or damaged and need new trees. The cocoa fund agency aims to replant 5,000 hectares by 2026 using levy revenue. In turn, brands with farm programs, such as Mondelēz with growers in Sulawesi, Sumatra and East Java, can secure origin supply and support claims on packs.
Bean shortages, heat and price-sensitive buyers add pressure
How do volatile cocoa costs squeeze margins?
Volatile cocoa costs squeeze margins, because brands buy beans and cocoa products at world prices that swung sharply after 2024. Large makers can raise prices or adjust recipes, while small craft makers have less buying power. As a result, value lines face the most pressure, and families may trade down to wafers with less cocoa. Hedging, longer supply contracts and domestic sourcing programs help reduce the impact on shelf prices over time.
Why do bean shortages hurt domestic makers?
Bean shortages hurt domestic makers, because farm output fell for years as farmers moved to rice and oil palm. About 31 chocolate factories have closed, leaving 19 to 21 in operation, according to the cocoa fund agency in November 2025. Consequently, grinders rely on imported beans, and smaller brands face uneven supply and quality. Replanting, better seedlings and farmer training funded by the export levy aim to restore output over the coming decade.
How do heat and long supply routes raise costs?
Heat and long supply routes raise costs, because chocolate softens in tropical temperatures during transport across thousands of islands. Small shops often lack cooled shelves, so bars can bloom or melt before sale. As a result, brands favor wafers and coated snacks that tolerate heat better than solid bars. Better packaging, cooled depots and faster deliveries help, although they add costs that are hard to pass on in value tiers.
Why do price-sensitive buyers limit premium growth?
Price-sensitive buyers limit premium growth, because many households compare prices closely for small snacks. A weaker rupiah and higher promotional spending also narrowed margins for Delfi in 2025, according to the company. Consequently, premium and imported products remain a small part of household baskets outside the largest cities. Smaller packs, local sourcing and seasonal promotions help brands reach these buyers without cutting prices across the whole range of products.
Java leads while the eastern islands grow fastest
| Region | Value, 2025 (USD million) | Share, 2025 | CAGR, 2026–2035 |
|---|---|---|---|
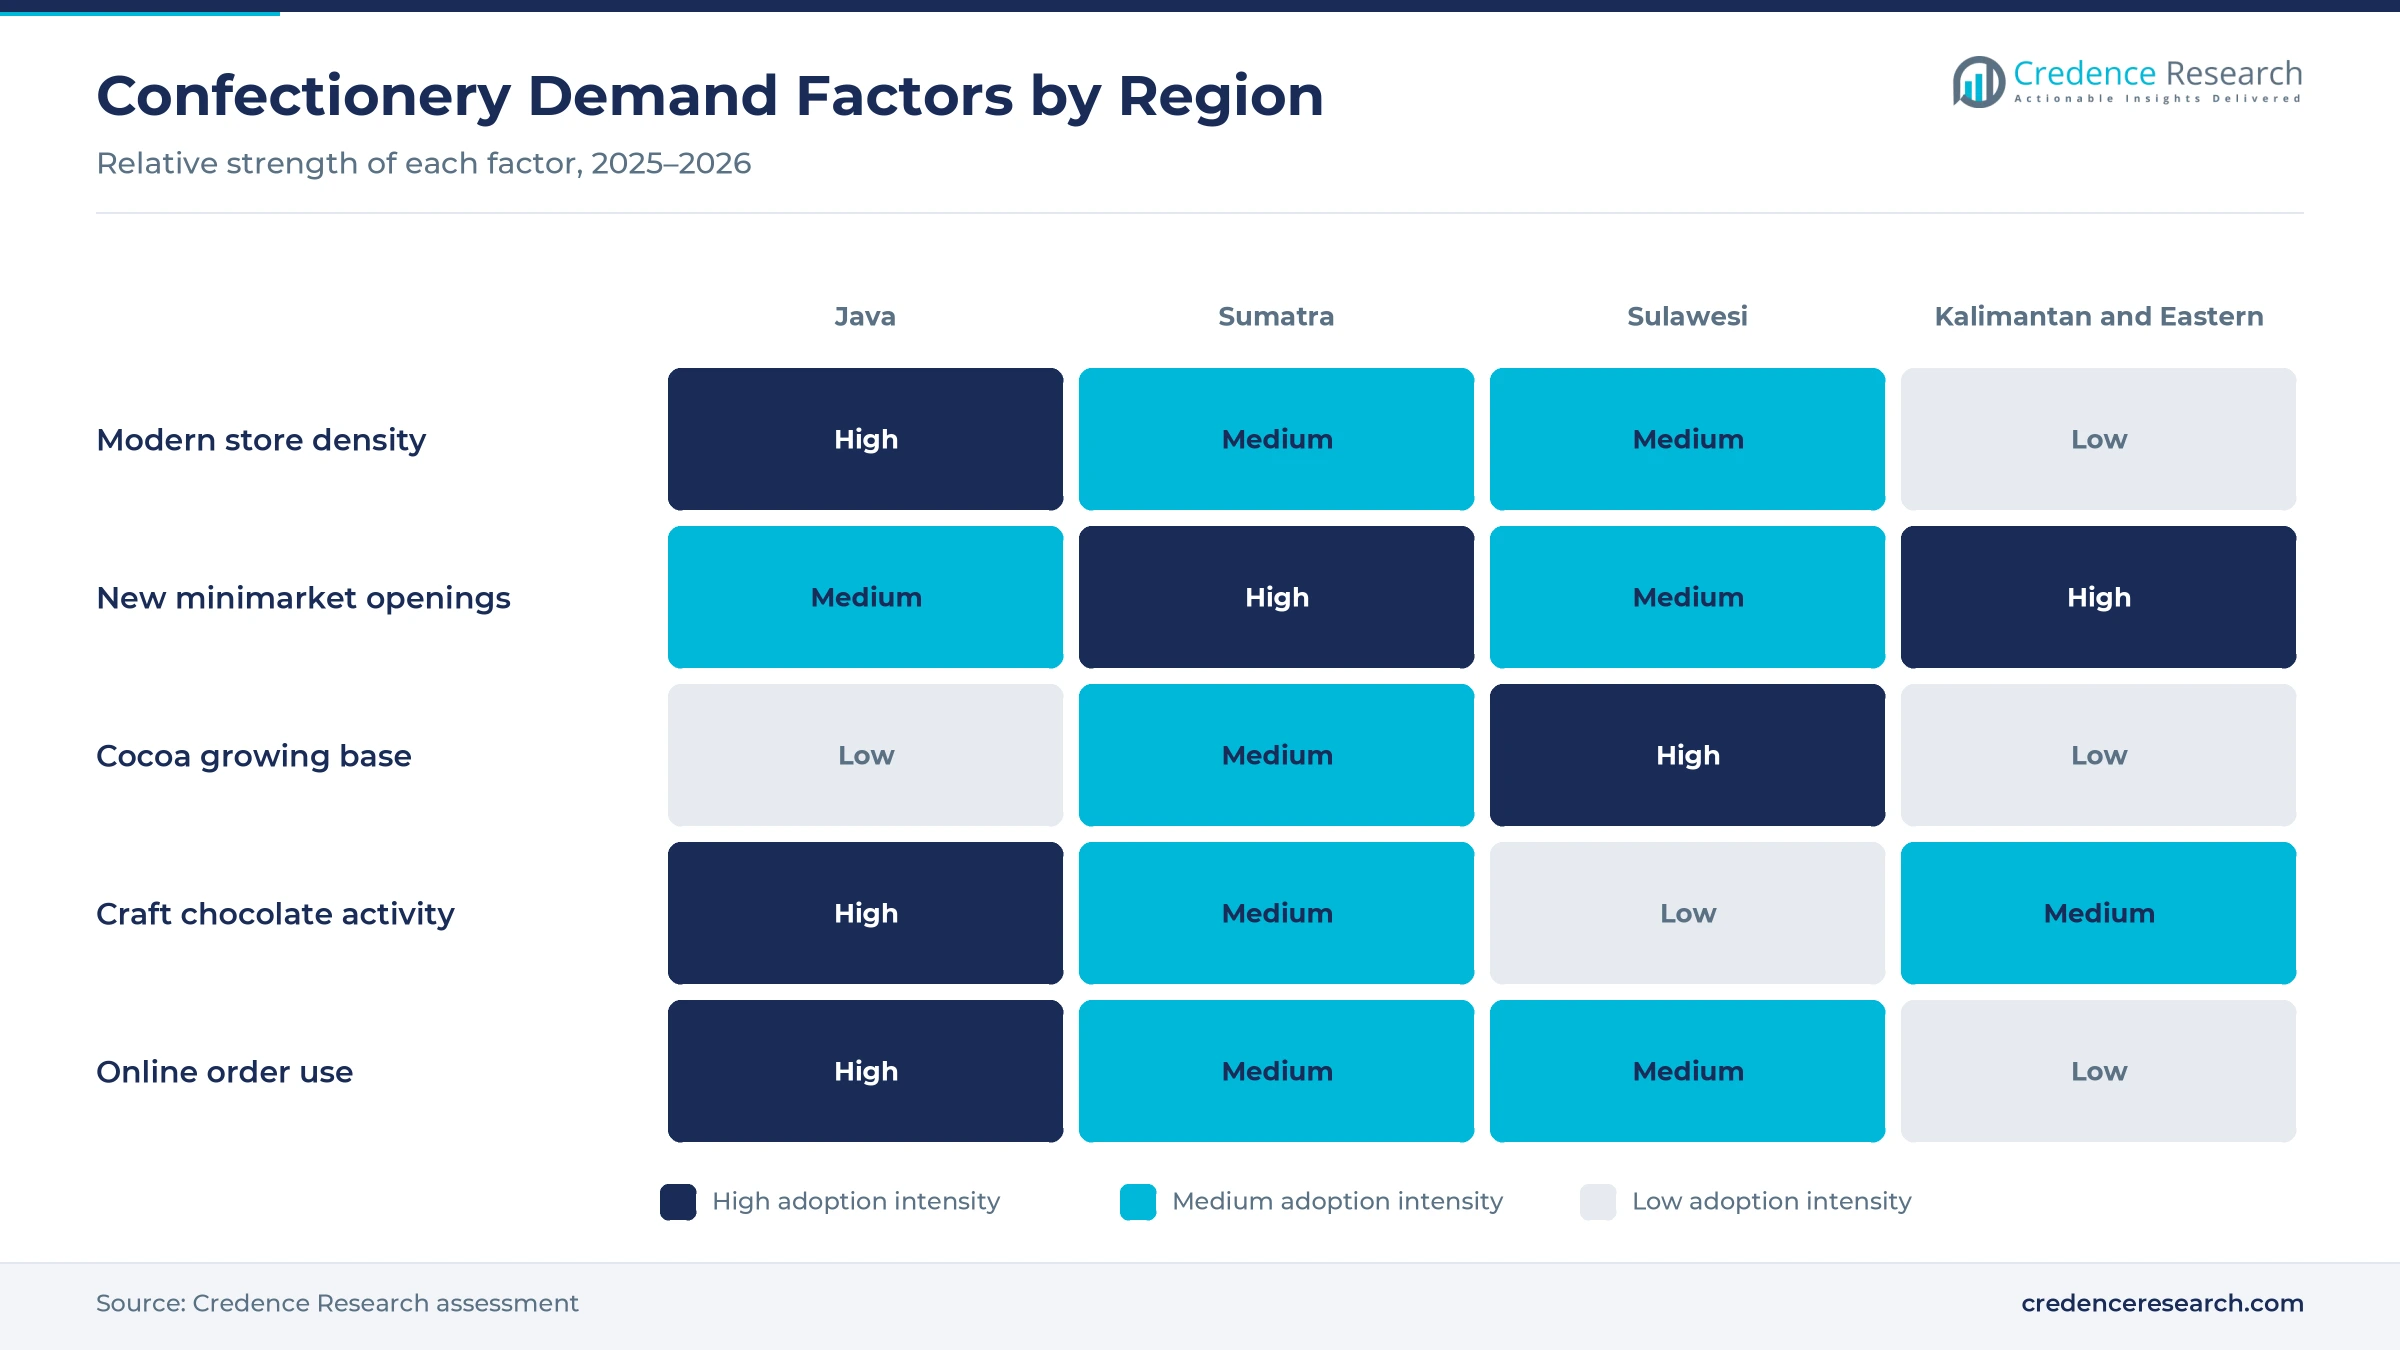
| Java | 564.0 | 57.0% | 5.62% |
| Sumatra | 217.7 | 22.0% | 5.92% |
| Kalimantan and Eastern Islands | 138.5 | 14.0% | 6.42% |
| Sulawesi | 69.3 | 7.0% | 6.22% |
Why does Java lead confectionery sales?
Java held 57.0% of 2025 value and grows at 5.62% a year in the Indonesia chocolate market, because Jakarta, Bandung, Surabaya and Yogyakarta hold the densest network of shoppers and modern stores. Alfamart stores in Java still made up about 65% of its network in 2025. Mondelēz runs a cocoa technical center in Pasuruan, East Java and Chocolate Monggo is based in Yogyakarta. As a result, Java hosts most product launches, craft stores and gift purchases in the country.
How does Sumatra combine cocoa farms and city demand?
Sumatra held 22.0% of 2025 value and grows at 5.92% a year, because demand from cities such as Medan and Palembang add steady snack demand. The island also grows cocoa that supports local craft production. Krakakoa makes its products in Lampung, and Pipiltin Cocoa buys beans from Pidie Jaya in Aceh. Mondelēz also works with growers in Sumatra through its sourcing program, which links farms with brand supply chains.
Why does Sulawesi matter for cocoa supply?
Sulawesi held 7.0% of 2025 value and grows at 6.22% a year, because urban households in Makassar and Manado buy packaged snacks in modern stores. The island is also an important cocoa-growing area, and Mondelēz works with growers there. In turn, farm incomes from cocoa support local spending on snacks. Replanting funded by the export levy could lift both bean supply and household incomes over time.
Why do Kalimantan and the eastern islands grow fastest?
Kalimantan and the eastern islands held 14.0% of 2025 value and grow fastest at 6.42% a year, because minimarket chains are opening stores outside Java. Alfamart sales outside Java rose 15.7% in the first half of 2025. Pipiltin Cocoa also sources beans from Tabanan in Bali for its craft bars. Alfamart stores outside Java made up 35% of its network in early 2025, which widens chocolate demand in these islands. However, long shipping routes and heat raise costs for brands that serve remote islands.
Price moves, halal deadlines and a cocoa export levy
| Development | Status and market relevance |
|---|---|
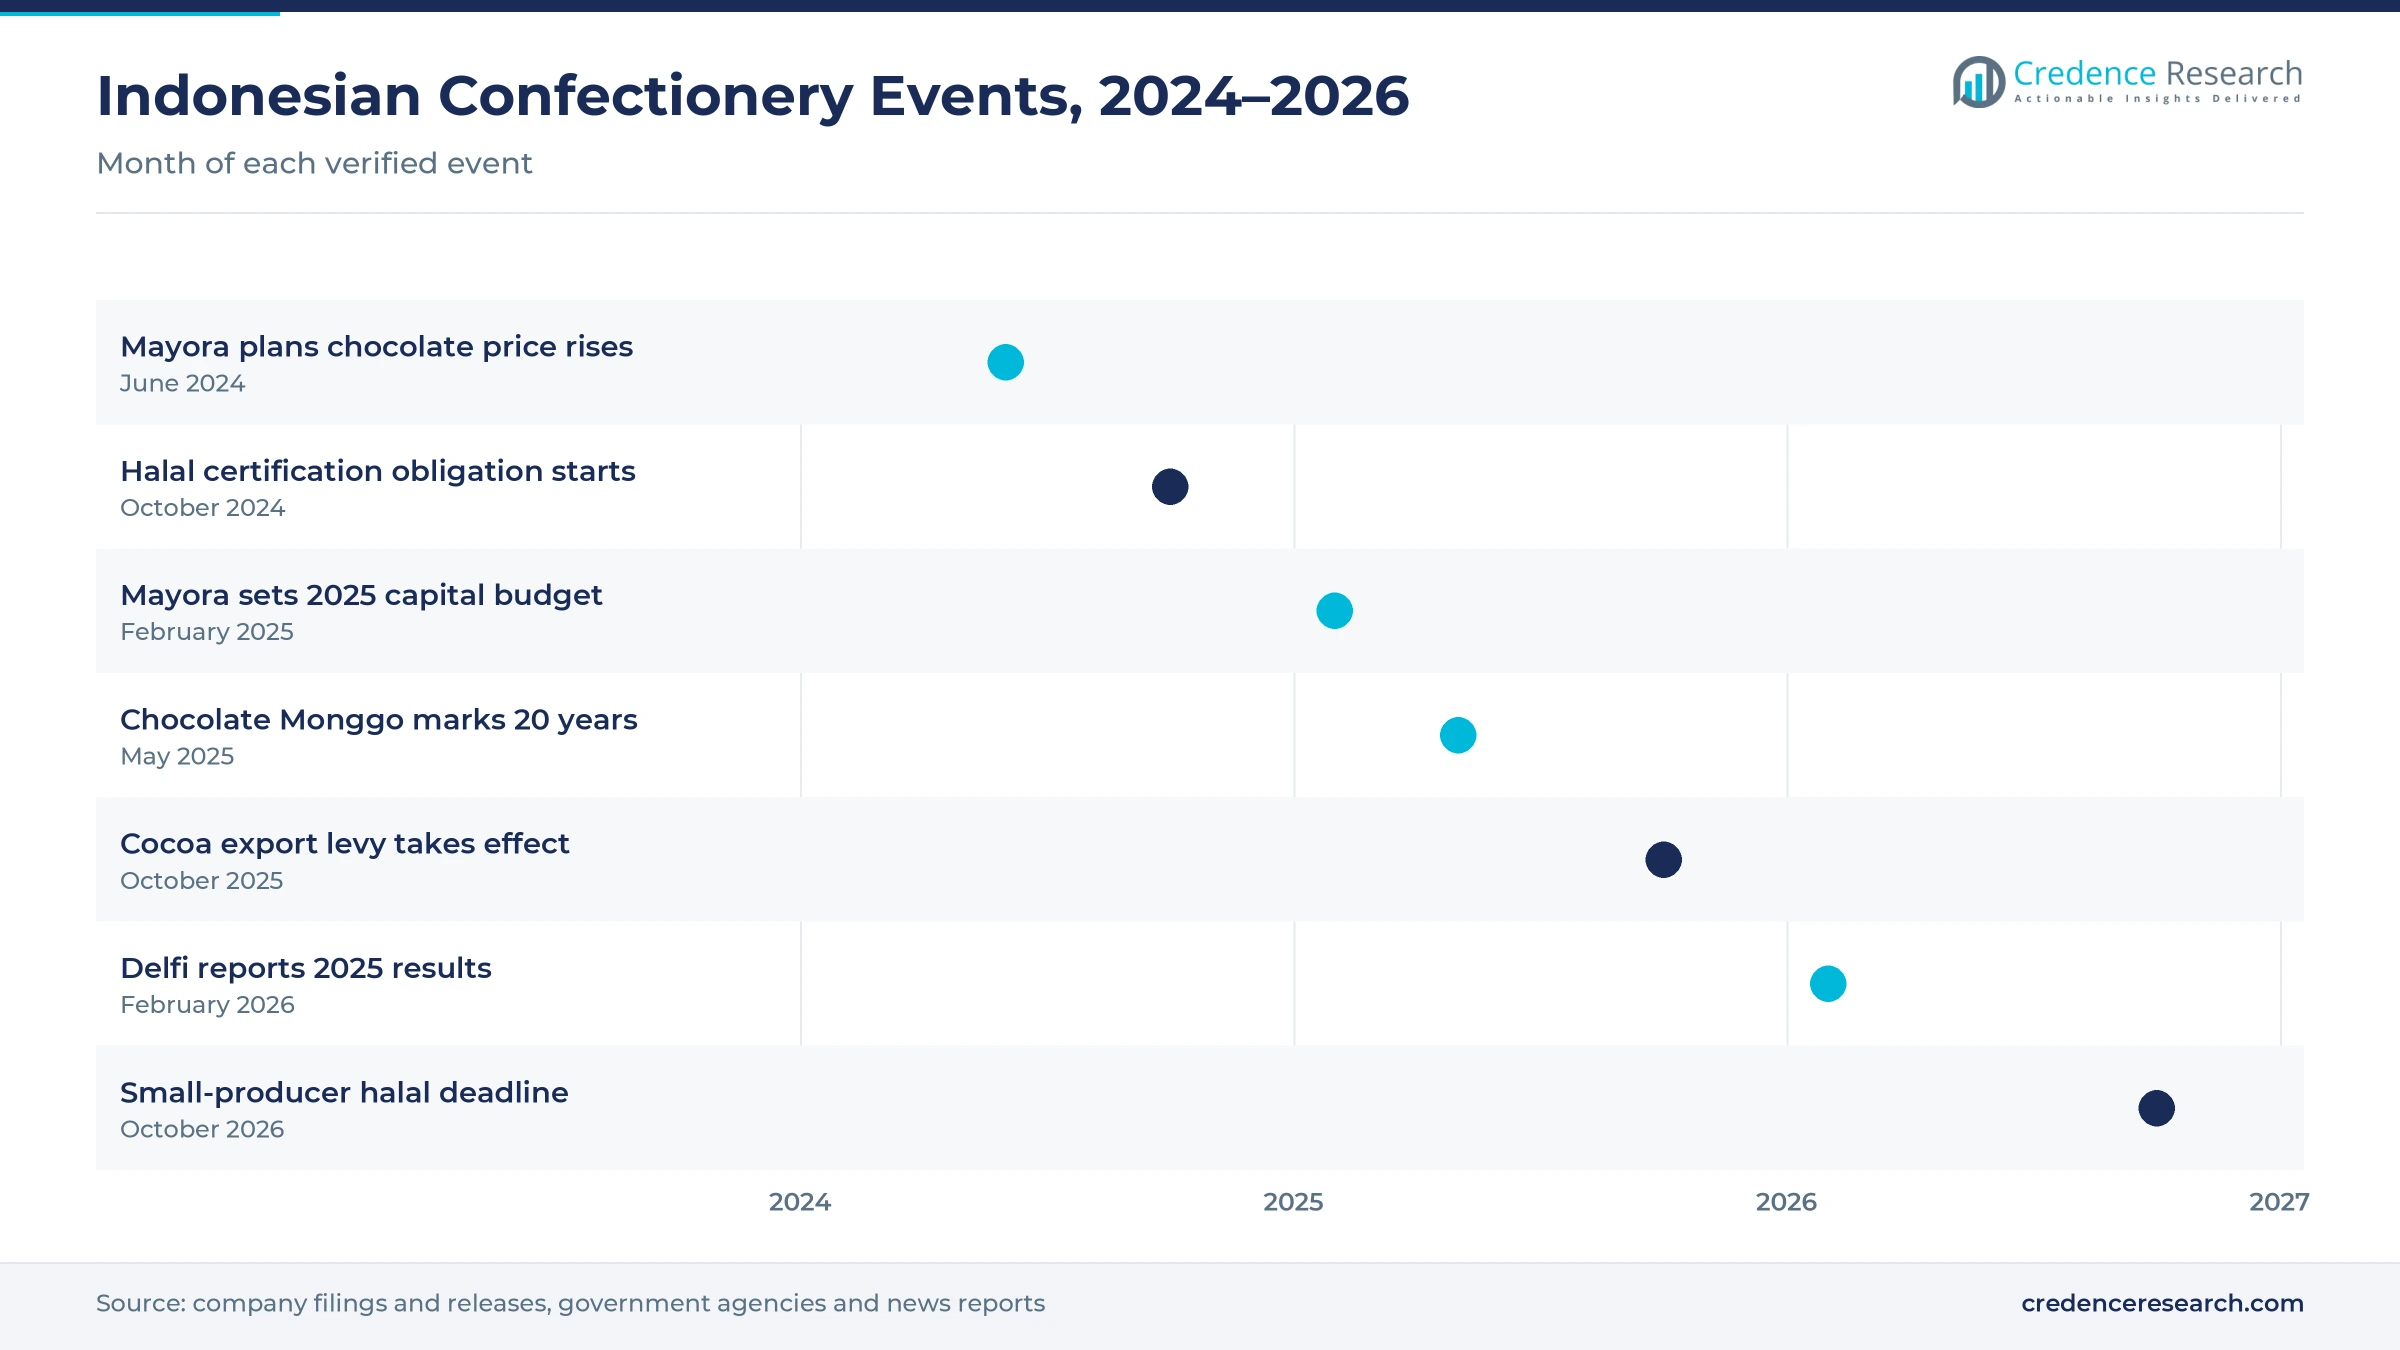
| In June 2024, Mayora said it would raise prices on some chocolate products, such as Beng-Beng and Choki-Choki, after cocoa costs jumped. | Shows cost pass-through to shoppers |
| In October 2024, mandatory halal certification for food and beverage products took effect for medium and large businesses. | Makes certification a shelf requirement |
| In May 2025, Chocolate Monggo marked its 20th anniversary with a talk on local cocoa in Yogyakarta. | Highlights the craft chocolate segment |
| In October 2025, a cocoa export levy took effect to fund replanting, seedlings and research. | Supports future domestic bean supply |
| In February 2026, Delfi announced plans to invest in core brands and wider distribution after higher own-brand sales in Indonesia. | Signals continued brand investment |
Heat-stable recipes, farm science and online retail
- Heat-tolerant recipes such as wafer and coated formats help products survive tropical temperatures in shops without cooled shelves.
- Cocoa crop science at the Mondelēz technical center in Pasuruan works with growers in Sulawesi, Sumatra and East Java on farm practices.
- Post-harvest equipment such as solar dryers and fermentation boxes, which Krakakoa provides to farmers, improves bean quality for craft bars.
- Online retail tools let brands sell gift boxes and craft bars across the islands, with average online orders near IDR 95,000.
Need a Custom Version of This Report?
Tailor the scope, geography, or segments to your exact requirements.
- Custom geography or segment scope
- Direct access to our analyst team
Regional groups, global brands and craft makers compete
Competition in the Indonesia chocolate market is spread across regional groups, global confectionery companies and local craft makers. Delfi Limited counts Indonesia as its largest market and plans to invest in core brands, product innovation and wider distribution. Mayora sells low-priced wafers and filled snacks such as Beng-Beng and Choki-Choki and raised prices after cocoa costs jumped. Mondelēz links its brands to farm programs with growers in Sulawesi, Sumatra and East Java. Chocolate Monggo, Krakakoa and Pipiltin Cocoa compete on local origin, dark recipes and gift packaging. Companies compete on price per pack, taste, heat stability, halal certification and reach in minimarkets. Retailers also run promotions that pressure prices for smaller brands, while online stores give craft makers a national audience.
Companies profiled and their roles in this market
| Company | Type | Role in the market |
|---|---|---|
| Delfi Limited | Regional confectionery group | Counts Indonesia as its largest market; plans wider distribution |
| PT Mayora Indah Tbk | Domestic food group | Sells Beng-Beng and Choki-Choki; raised prices in 2024 |
| Mondelēz International | Global confectionery company | Cocoa technical center in Pasuruan, East Java |
| Chocolate Monggo | Domestic craft maker | Yogyakarta brand that marked 20 years in 2025 |
| Krakakoa | Domestic bean-to-bar maker | Factory in Lampung; supports cacao farmers since 2013 |
| Pipiltin Cocoa | Domestic bean-to-bar maker | Jakarta stores using beans from Bali and Aceh |
Credence Research view on steady snacking demand
Credence Research's view is that the Indonesia chocolate market will grow steadily through 2035, because a very large population buys low-priced snacks every week and minimarkets keep spreading. Countlines and filled products already hold 38.0% of 2025 value, and online stores give craft bars a national audience. Domestic makers benefit from local cocoa and halal certification, while global brands win with scale and farm programs. However, cocoa cost swings, bean shortages and price-sensitive buyers could squeeze margins. Kalimantan and the eastern islands should grow fastest as minimarkets open there.
How the Indonesian confectionery estimate was built
The report uses 2025 as the base year, with values in USD million at current prices. Market values come from the Credence Research model, which combines population, cocoa consumption, retail store reach and average prices. Regional shares are those set for this report, and segment splits by product type, channel, occasion and price tier are Credence Research estimates. Sources used are government agencies, central bank statements, World Bank data, company filings and announcements and news reports, and no interviews or surveys were used.
Store reach and bean supply set the path to 2035
The Indonesia chocolate market is expected to reach USD 1.76 billion by 2035, a 5.84% CAGR during 2026–2035, as household demand, minimarket expansion and online discovery lift chocolate purchases. Growth should be strongest in Kalimantan and the eastern islands, in e-commerce and in artisanal products, while Java keeps the largest share. Brands that combine heat-tolerant formats, halal certification and secure bean supply should win share. In contrast, another spike in cocoa prices or a weaker rupiah would slow value growth for many makers.
Frequently Asked Questions
How big is the Indonesia chocolate market?
Which region leads sales in Indonesia?
Which region grows fastest?
Which product type holds the largest share?
Which sales channel grows fastest?
How do cocoa prices affect the market?
Who are the leading companies in Indonesian confectionery?
What are the main risks to growth?
Table of Content
Chapter 1 Market Segmentation
- 1.1 Segmentation Framework
- 1.1.1 Product and Service Classification
- 1.1.2 Application and End-Use Classification
- 1.1.3 Technology and Solution Classification
- 1.1.4 Customer and Distribution Channel Classification
- 1.1.5 Geographic Segmentation
- 1.1.6 Market Segment Definitions and Boundaries
- 1.2 By Product Type
- 1.2.1 Countlines and Filled Chocolate
- 1.2.2 Chocolate Tablets and Bars
- 1.2.3 Seasonal and Novelty Chocolate
- 1.2.4 Boxed Assortments and Pralines
- 1.3 By Purchase Occasion
- 1.3.1 Everyday Snacking
- 1.3.2 Gifting and Celebrations
- 1.3.3 Travel and Impulse
- 1.3.4 Home Sharing
- 1.4 By Price Tier
- 1.4.1 Mainstream
- 1.4.2 Value
- 1.4.3 Premium
- 1.4.4 Artisanal and Luxury
Chapter 2 Introduction
- 2.1 Report Objectives and Scope
- 2.2 Product Definition and Industry Terminology
- 2.3 Market Inclusions and Exclusions
- 2.4 Research Process
- 2.4.1 Primary Research and Expert Interviews
- 2.4.2 Secondary Research and Source Review
- 2.4.3 Top-Down and Bottom-Up Estimation
- 2.4.4 Data Triangulation and Verification
- 2.5 Market Size Measurement Basis
- 2.5.1 2025: USD 989.5 million → 2035: USD 1.76 billion
- 2.6 Historical and Forecast Reference Periods
- 2.6.1 Historical Period: 2018-2025
- 2.6.2 Base Year: 2025
- 2.6.3 Forecast Period: 2025-2035
- 2.7 Research Assumptions and Limitations
Chapter 3 Executive Summary
- 3.1 Market Snapshot and Key Findings
- 3.2 Base-Year Market Size, 2025
- 3.3 Forecast Market Size, 2035
- 3.4 Revenue and Volume Growth Outlook
- 3.5 Key Demand and Supply Indicators
- 3.6 Leading Market Segments
- 3.7 Fastest-Growing Market Opportunities
- 3.8 Regional Performance Highlights
- 3.9 Technology and Industry Transformation
- 3.10 Competitive Landscape Summary
- 3.11 Analyst View and Strategic Implications
Chapter 4 Indonesia Chocolate Market Trends and Developments
- 4.1 Historical Industry Development, 2018-2025
- 4.2 Recent Market Trends and Developments
- 4.3 Demand and Customer Behavior Trends
- 4.4 Technology and Product Innovation
- 4.5 Artificial Intelligence, Automation and Digitalization
- 4.6 Local Manufacturing and Supply Chain Realignment
- 4.7 Industry Partnerships, Mergers and Acquisitions
- 4.8 Sustainability and Circular Economy Developments
- 4.9 Government and Private Sector Investment Trends
- 4.10 Emerging Business Models and Commercialization
- 4.11 Industry Developments and Announcements
Chapter 5 Indonesia Chocolate Market Production, Supply and Demand Analysis
- 5.1 Demand Trend and Consumption Analysis, 2018-2025
- 5.2 Demand Forecast, 2025-2035
- 5.3 Production and Output Trend, 2018-2025
- 5.4 Production and Output Forecast, 2025-2035
- 5.5 Installed Capacity and Capacity Utilization
- 5.6 Company-Wise Production Plants and Statistics
- 5.6.1 Installed Production Capacity
- 5.6.2 Actual Production
- 5.6.3 Planned Capacity and Expansion Targets
- 5.7 Supply Chain Structure and Procurement Trends
- 5.8 Supply-Demand Gap and Bottlenecks
- 5.9 Import Dependence and Sourcing Structure
- 5.10 Contract Manufacturing and Outsourcing
- 5.11 Regional Supply and Demand Concentration
Chapter 6 Indonesia Chocolate Market Pricing Analysis
- 6.1 Pricing Structure and Measurement
- 6.2 Historical Pricing Trends, 2018-2025
- 6.3 Pricing Outlook, 2025-2035
- 6.4 Average Selling Price and Unit Economics
- 6.5 Pricing by Product and Market Segment
- 6.6 Geographic Pricing Differences
- 6.7 Key Input, Energy, Labor and Logistics Costs
- 6.8 Contract Pricing and Purchasing Models
- 6.9 Pricing Sensitivity and Competitive Positioning
- 6.10 Price, Margin and Profitability Implications
Chapter 7 Indonesia Chocolate Market Dynamics
- 7.1 Market Growth Drivers
- 7.1.1 Demand-Side Drivers
- 7.1.2 Technology and Innovation Drivers
- 7.1.3 Infrastructure and Investment Drivers
- 7.1.4 Regulatory and Policy Drivers
- 7.2 Market Restraints
- 7.2.1 Cost and Affordability Constraints
- 7.2.2 Technology and Adoption Barriers
- 7.2.3 Supply Chain and Operational Constraints
- 7.3 Market Challenges
- 7.3.1 Competitive Pressure and Margin Erosion
- 7.3.2 Skills, Infrastructure and Implementation Gaps
- 7.4 Emerging Market Opportunities
- 7.5 Market Dynamics Impact and Time-Horizon Assessment
Chapter 8 Indonesia Chocolate Value Chain Analysis
- 8.1 Industry Value Chain Overview
- 8.2 Upstream Suppliers and Critical Inputs
- 8.3 Technology and Component Providers
- 8.4 Manufacturing or Service Delivery
- 8.5 Distribution, Channel Partners and Integrators
- 8.6 Downstream Applications and End Users
- 8.7 Value Addition and Profit Pools
- 8.8 Vertical Integration and Outsourcing
- 8.9 Supplier Concentration and Risk
- 8.10 Supply Chain Localization and Resilience
Chapter 9 Indonesia Chocolate Market Regulations and Policies
- 9.1 Relevant Laws, Standards and Compliance Frameworks
- 9.2 Product, Service, Safety and Quality Requirements
- 9.3 Government Policies, Incentives and Subsidies
- 9.4 Imports, Exports and Trade Barriers
- 9.5 Public Procurement and Local Content Requirements
- 9.6 Environmental and Sustainability Compliance
- 9.7 Upcoming Policy Changes and Market Implications
Chapter 10 Indonesia Chocolate Market Hotspots and Opportunities
- 10.1 Market Opportunity Mapping and Growth Hotspots
- 10.2 High-Growth Applications and Customer Groups
- 10.3 Underserved Markets and White-Space Opportunities
- 10.4 Emerging Technology and Product Opportunities
- 10.5 New Capacity and Investment Hotspots
- 10.6 Market Entry and Expansion Opportunities
- 10.7 Distribution and Partnership Opportunities
- 10.8 Near-Term and Long-Term Commercial Potential
- 10.9 Opportunity Attractiveness and Execution Risks
Chapter 11 Indonesia Chocolate Market Outlook, 2025-2035
- 11.1 Market Size and Analysis
- 11.1.1 Revenue (Market Measurement: 2025: USD 989.5 million → 2035: USD 1.76 billion)
- 11.1.2 Market Volume and Quantity Sold
- 11.1.3 Historical Market Size, 2018-2025
- 11.1.4 Base-Year Market Size, 2025
- 11.2 Market Forecast, 2025-2035
- 11.2.1 Revenue Forecast to 2035
- 11.2.2 Volume Forecast to 2035
- 11.2.3 CAGR and Year-on-Year Growth
- 11.2.4 Incremental Revenue Opportunity
- 11.3 Forecast Assumptions and Scenario Analysis
- 11.3.1 Base-Case Forecast
- 11.3.2 Optimistic and Conservative Scenarios
- 11.3.3 Technology, Pricing and Policy Sensitivities
- 11.4 Market Attractiveness and Growth Outlook
Chapter 12 Indonesia Chocolate Market Segmentation and Outlook
- 12.1 Segmentation Summary and Market Shares, 2025
- 12.2 Largest and Fastest-Growing Segments
- 12.3 By Product Type - Market Size and Forecast, 2025-2035
- 12.3.1 Segment Definition and Scope
- 12.3.2 Historical Market Size, 2018-2025
- 12.3.3 Revenue Forecast, 2025-2035
- 12.3.4 Volume Forecast, 2025-2035
- 12.3.5 Base-Year Market Share, 2025
- 12.3.6 Segment CAGR and Growth Drivers
- 12.3.7 Subsegment Market Size and Forecast
- 12.3.7.1 Countlines and Filled Chocolate
- 12.3.7.2 Chocolate Tablets and Bars
- 12.3.7.3 Seasonal and Novelty Chocolate
- 12.3.7.4 Boxed Assortments and Pralines
- 12.3.8 Subsegment Pricing and Adoption Trends
- 12.3.9 Leading Suppliers and Competition
- 12.3.10 Regional Demand and Opportunities
- 12.4 By Purchase Occasion - Market Size and Forecast, 2025-2035
- 12.4.1 Segment Definition and Scope
- 12.4.2 Historical Market Size, 2018-2025
- 12.4.3 Revenue Forecast, 2025-2035
- 12.4.4 Volume Forecast, 2025-2035
- 12.4.5 Base-Year Market Share, 2025
- 12.4.6 Segment CAGR and Growth Drivers
- 12.4.7 Subsegment Market Size and Forecast
- 12.4.7.1 Everyday Snacking
- 12.4.7.2 Gifting and Celebrations
- 12.4.7.3 Travel and Impulse
- 12.4.7.4 Home Sharing
- 12.4.8 Subsegment Pricing and Adoption Trends
- 12.4.9 Leading Suppliers and Competition
- 12.4.10 Regional Demand and Opportunities
- 12.5 By Price Tier - Market Size and Forecast, 2025-2035
- 12.5.1 Segment Definition and Scope
- 12.5.2 Historical Market Size, 2018-2025
- 12.5.3 Revenue Forecast, 2025-2035
- 12.5.4 Volume Forecast, 2025-2035
- 12.5.5 Base-Year Market Share, 2025
- 12.5.6 Segment CAGR and Growth Drivers
- 12.5.7 Subsegment Market Size and Forecast
- 12.5.7.1 Mainstream
- 12.5.7.2 Value
- 12.5.7.3 Premium
- 12.5.7.4 Artisanal and Luxury
- 12.5.8 Subsegment Pricing and Adoption Trends
- 12.5.9 Leading Suppliers and Competition
- 12.5.10 Regional Demand and Opportunities
- 12.6 Segment Growth Comparison
- 12.7 Segment Attractiveness and Priority Matrix
Chapter 13 Indonesia Chocolate Geographic Market Outlook, 2025-2035
- 13.1 Domestic Market Distribution and Demand Clusters
- 13.2 State- or Province-Wise Market Size and Forecast, 2025-2035
- 13.3 City and Metropolitan Market Outlook
- 13.4 Industrial, Manufacturing and Commercial Clusters
- 13.5 Geographic Concentration of Key End Users
- 13.6 Local Pricing and Purchasing Differences
- 13.7 Domestic Production Facilities and Capacity Map
- 13.8 Local Infrastructure and Project Pipeline
- 13.9 State-Level Policy and Incentive Differences
- 13.10 Subnational Investment Hotspots and Opportunities
- 13.11 Distribution and Logistics Networks
- 13.12 Domestic Competitive Footprint
Chapter 14 Indonesia Chocolate Technology, Innovation and Sustainability Outlook
- 14.1 Technology Landscape and Maturity
- 14.2 Product, Process and Service Innovation
- 14.3 AI, Automation and Digital Tools in the Industry
- 14.4 Technology Adoption and Performance Benchmarking
- 14.5 Innovation Pipeline and R&D Investment
- 14.6 Patent and Intellectual Property Trends
- 14.7 Energy Efficiency and Resource Management
- 14.8 Sustainability, Recycling and Circularity
- 14.9 Technology Roadmap, 2025-2035
- 14.10 Risks of Obsolescence and Technology Substitution
Chapter 15 Indonesia Chocolate Market Key Strategic Imperatives
- 15.1 Growth and Market Entry Priorities
- 15.2 High-Return Products and Segments
- 15.3 Pricing, Profitability and Cost Optimization
- 15.4 Technology Investment and Product Differentiation
- 15.5 Supply Chain Localization and Resilience
- 15.6 Distribution and Customer Acquisition
- 15.7 Partnership, Acquisition and Capacity Strategy
- 15.8 Regional Expansion Priorities
- 15.9 Short-, Medium- and Long-Term Actions
Chapter 16 Competition Outlook
- 16.1 Industry Competition Characteristics
- 16.2 Market Structure and Concentration
- 16.3 Market Share and Competitive Positioning, 2025
- 16.4 Company-Wise Revenue and Product Benchmarking
- 16.5 Production and Service Capacity Benchmarking
- 16.6 Technology, Pricing and Differentiation
- 16.7 Regional Footprint and Distribution Strength
- 16.8 Mergers, Acquisitions and Strategic Alliances
- 16.9 New Entrants and Competitive Threats
- 16.10 Porter's Five Forces and Industry Attractiveness
- 16.11 Competitive Outlook, 2025-2035
Chapter 17 Company Profiles
- 17.1 Company Coverage and Selection Criteria
- 17.2 Delfi Limited
- 17.2.1 Business Description
- 17.2.2 Company Ownership and Geographic Presence
- 17.2.3 Product and Service Portfolio
- 17.2.4 Manufacturing and Operating Footprint
- 17.2.5 Production Capacity and Expansion Plans
- 17.2.6 Financial Performance and Investment
- 17.2.7 Market Share and Competitive Position
- 17.2.8 Technology and Innovation Capabilities
- 17.2.9 Strategic Alliances or Partnerships
- 17.2.10 Recent Developments
- 17.2.11 Growth Strategy and Outlook
- 17.3 PT Mayora Indah Tbk
- 17.4 Mondelēz International
- 17.5 Nestlé
- 17.6 Mars, Incorporated
- 17.7 Ferrero
- 17.8 PT Garudafood Putra Putri Jaya Tbk
- 17.9 Chocolate Monggo
- 17.10 Krakakoa
- 17.11 Pipiltin Cocoa
- 17.12 Other Relevant Market Participants
Note: Every listed company is profiled on the structure shown under the first company. The company list is preliminary and may change based on research findings, market developments, data availability and client requirements.
Chapter 18 Disclaimer
- 18.1 Research and Forecast Disclaimer
- 18.2 Data Source and Estimation Limitations
Note: The depth of individual sections depends on data availability for this market. Volume, capacity, trade and other unit-based metrics are included where applicable.

