
Ocean-derived ingredients move from research to supply
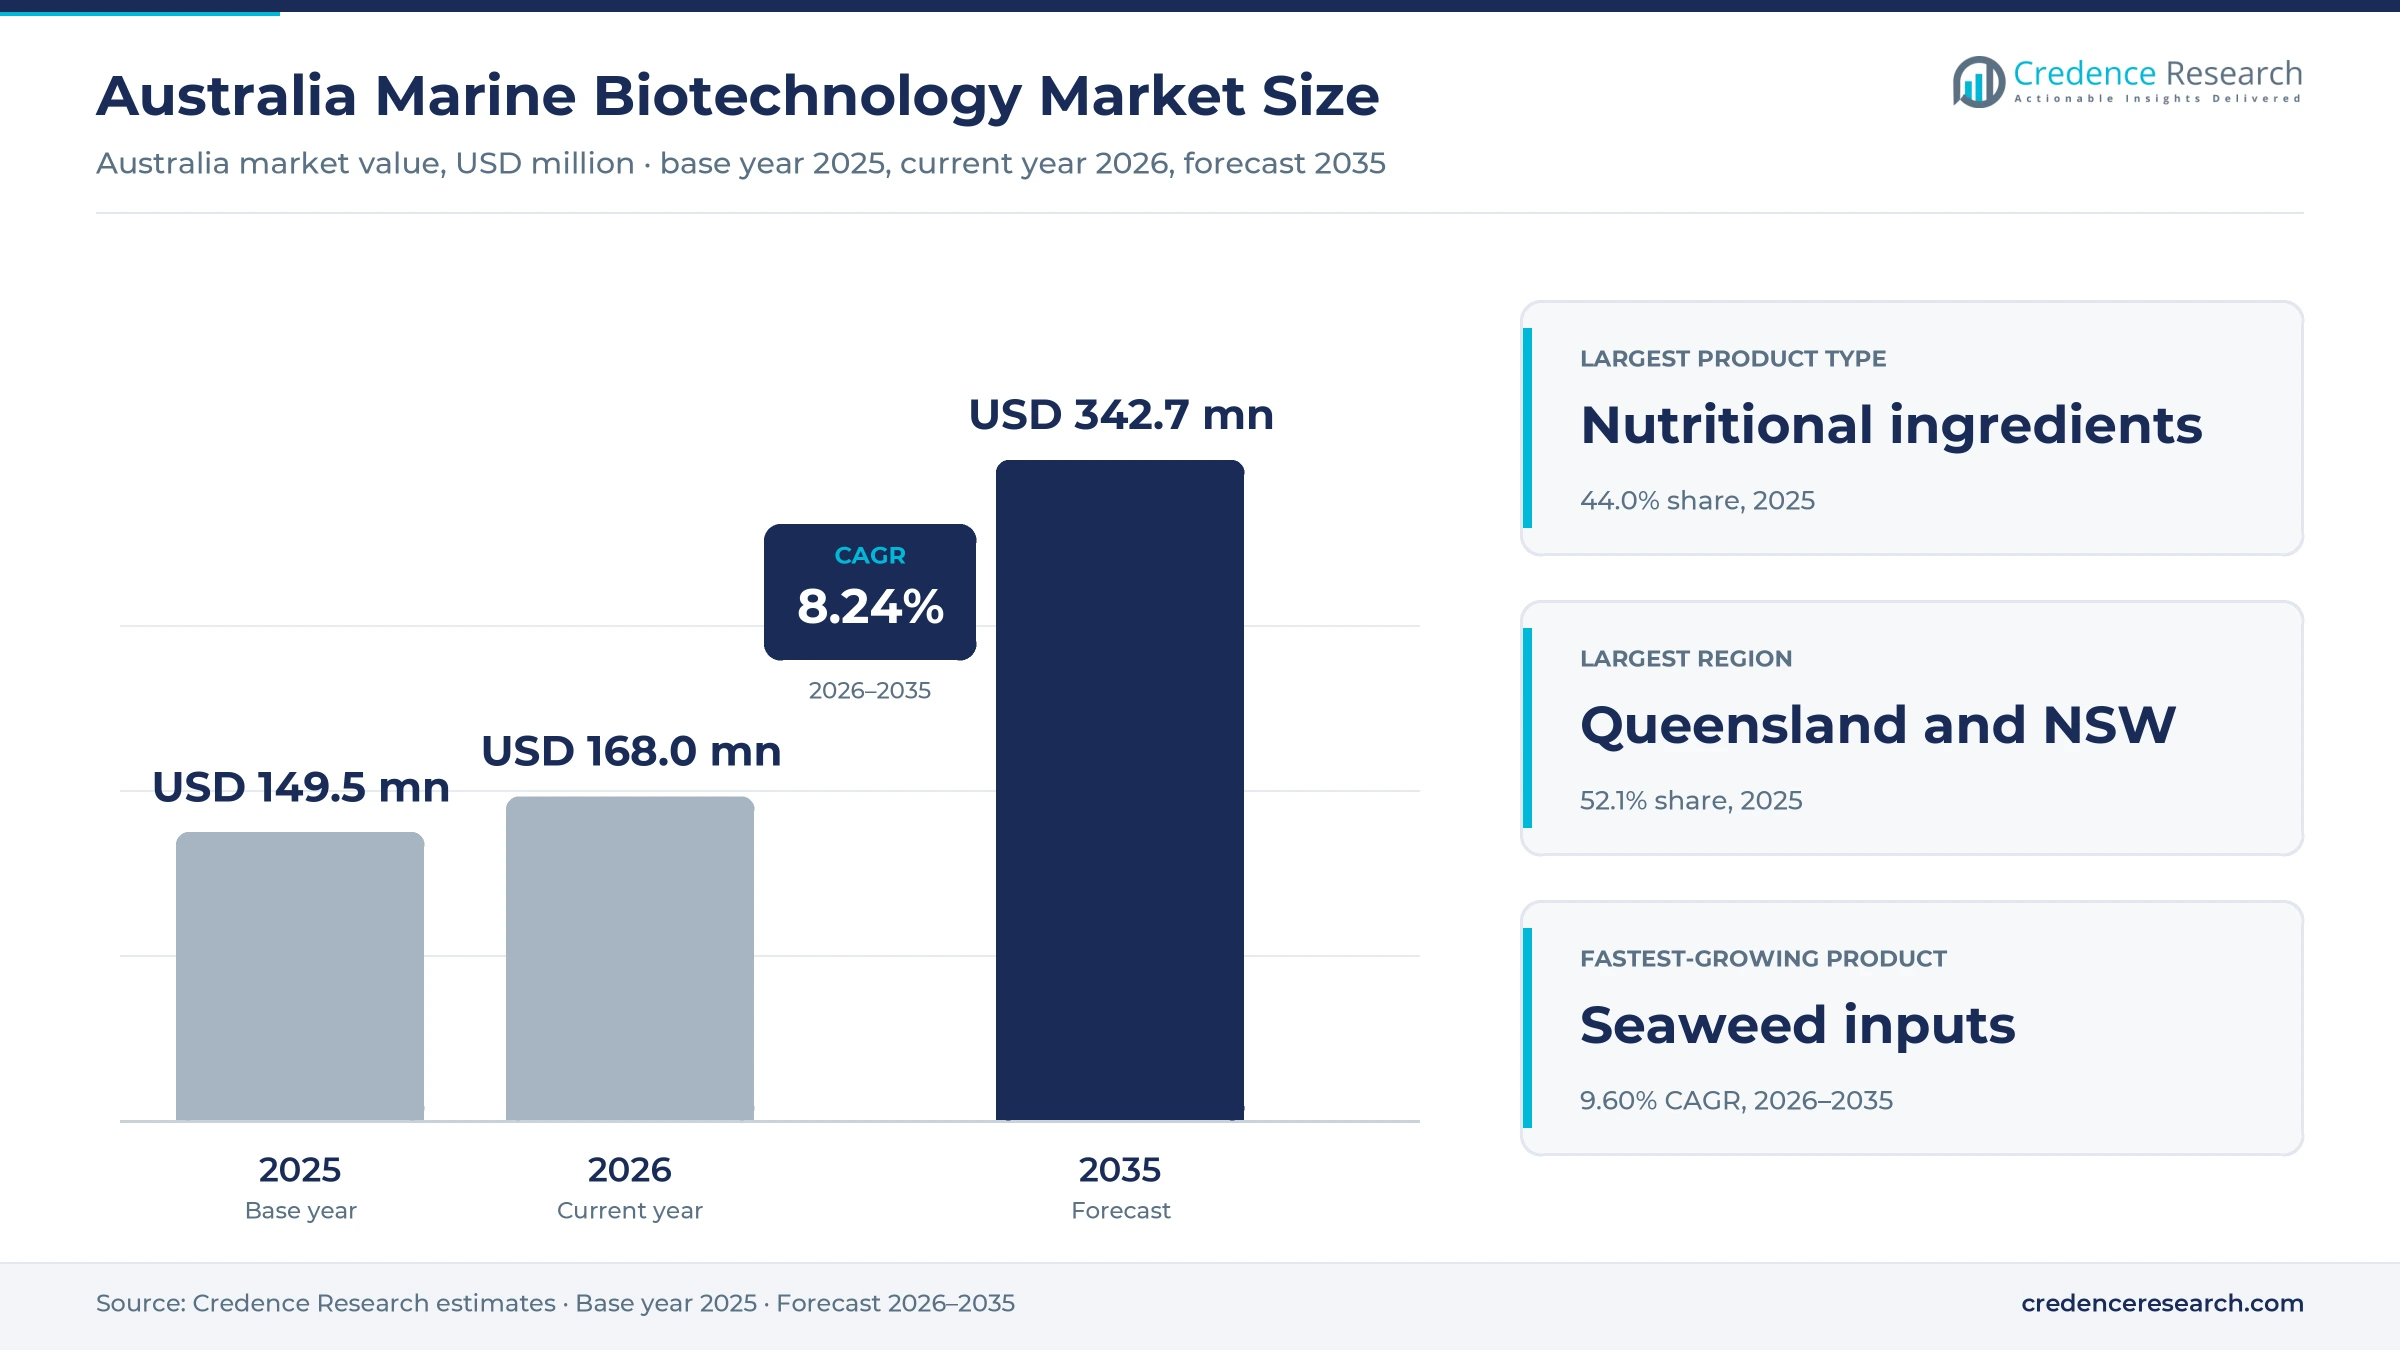
The Australia marine biotechnology market was valued at USD 149.5 million in 2025 and is projected to increase from USD 168.0 million in 2026 to USD 342.7 million by 2035, registering a CAGR of 8.24% during 2026–2035. Demand comes from infant formula and supplement makers that buy omega-3 powders, brands that use seaweed extracts such as fucoidan in supplements and skincare, and cattle producers that add seaweed to feed to cut methane. Queensland and New South Wales held the largest regional share, 52.1% in 2025, because feed buyers, coastal research groups and seaweed processors cluster along the eastern coast. Western Australia and the remaining jurisdictions form the fastest-growing region at 8.73% a year, as new seaweed feed facilities are planned for the west. In turn, Sea Forest listed on the Australian Securities Exchange in November 2025, which gave the seaweed feed sector new public capital.
Which ocean-derived products does the estimate cover?
The estimate measures the value of ingredients, inputs and services made from seaweed, microalgae, fish oil and other ocean biomass in Australia. It covers omega-3 and other nutritional powders, seaweed inputs for animal feed, specialty bioactives such as fucoidan and research and development services sold to brands and feed buyers.
The estimate excludes wild-catch seafood, farmed fish sold as food, fish meal sold without further processing and pharmaceutical drug sales. The value chain runs from seaweed farms, hatcheries and oil suppliers through extraction and purification plants to ingredient formulators, feed manufacturers and research buyers in Australia and abroad.
Australia Marine Biotechnology Market Insights
- The Australia marine biotechnology market was valued at USD 149.5 million in 2025 and is projected to reach USD 342.7 million by 2035, registering a CAGR of 8.24% during 2026–2035.
- Queensland and New South Wales held a 52.1% share of 2025 value, because feed buyers, research groups and seaweed processors cluster along the east coast.
- Nutritional ingredients led with a 44.0% share of 2025 value, because infant formula and supplement makers buy omega-3 powders in large volumes.
- Sea Forest raised A$20.5 million and listed on the Australian Securities Exchange on Nov. 26, 2025, to fund new seaweed feed facilities.
- Provectus Algae raised US$10.1 million in a Series A round in July 2025, plus US$2.5 million in federal grant funding, to scale its feed supplement.
Nutritional ingredients lead while seaweed feed rises
Why do nutritional ingredients lead product demand?
Based on product type, the market is categorized into nutritional ingredients, functional seaweed inputs, specialty bioactives and research services. Nutritional Ingredients led with a 44.0% share of 2025 value, because infant formula and supplement makers buy omega-3 powders under long supply contracts. Functional Seaweed Inputs grow fastest at 9.60% a year, as cattle producers add seaweed supplements to feed to cut methane.
Which applications account for most ingredient value?
Based on application, the market is categorized into human nutrition, animal performance and specialty product development. Human Nutrition led with a 55.0% share of 2025 value, because infant formula, supplements and functional foods use the largest volumes of omega-3 and seaweed extracts. Animal Performance grows fastest at 9.56% a year, as feedlots and dairy farms trial seaweed supplements across large herds.
Who buys most ocean-derived ingredients?
Based on customer type, the market is categorized into ingredient formulators, feed manufacturers and research buyers. Ingredient Formulators led with a 58.0% share of 2025 value, because supplement, food and skincare brands buy purified extracts for their own products. Feed Manufacturers grow fastest at 9.50% a year, as feed suppliers sign multi-year agreements to supply seaweed to cattle herds.
How do producers sell ocean-derived ingredients?
Based on sales channel, the market is categorized into direct supply agreements, specialist distributors and development partnerships. Direct Supply Agreements led with a 52.0% share of 2025 value and also grow fastest at 8.59% a year, because large formulators and feedlot operators prefer contracts that fix quality, volume and price for several years. Specialist distributors still serve smaller supplement and skincare brands in export markets that buy extracts in modest volumes.
| Segment Group | Leading Sub-segment | Share, 2025 | Fastest-growing Sub-segment | CAGR, 2026–2035 |
|---|---|---|---|---|
| By Product Type | Nutritional Ingredients | 44.0% | Functional Seaweed Inputs | 9.60% |
| By Application | Human Nutrition | 55.0% | Animal Performance | 9.56% |
| By Customer Type | Ingredient Formulators | 58.0% | Feed Manufacturers | 9.50% |
| By Sales Channel | Direct Supply Agreements | 52.0% | Direct Supply Agreements | 8.59% |
Request a Free Sample
Fill in your details and we'll send you a free sample report.
- Sample data tables & charts
- Research methodology
Qualified plants, research funds and feed trials lift sales
How does qualified ingredient manufacturing lift sales?
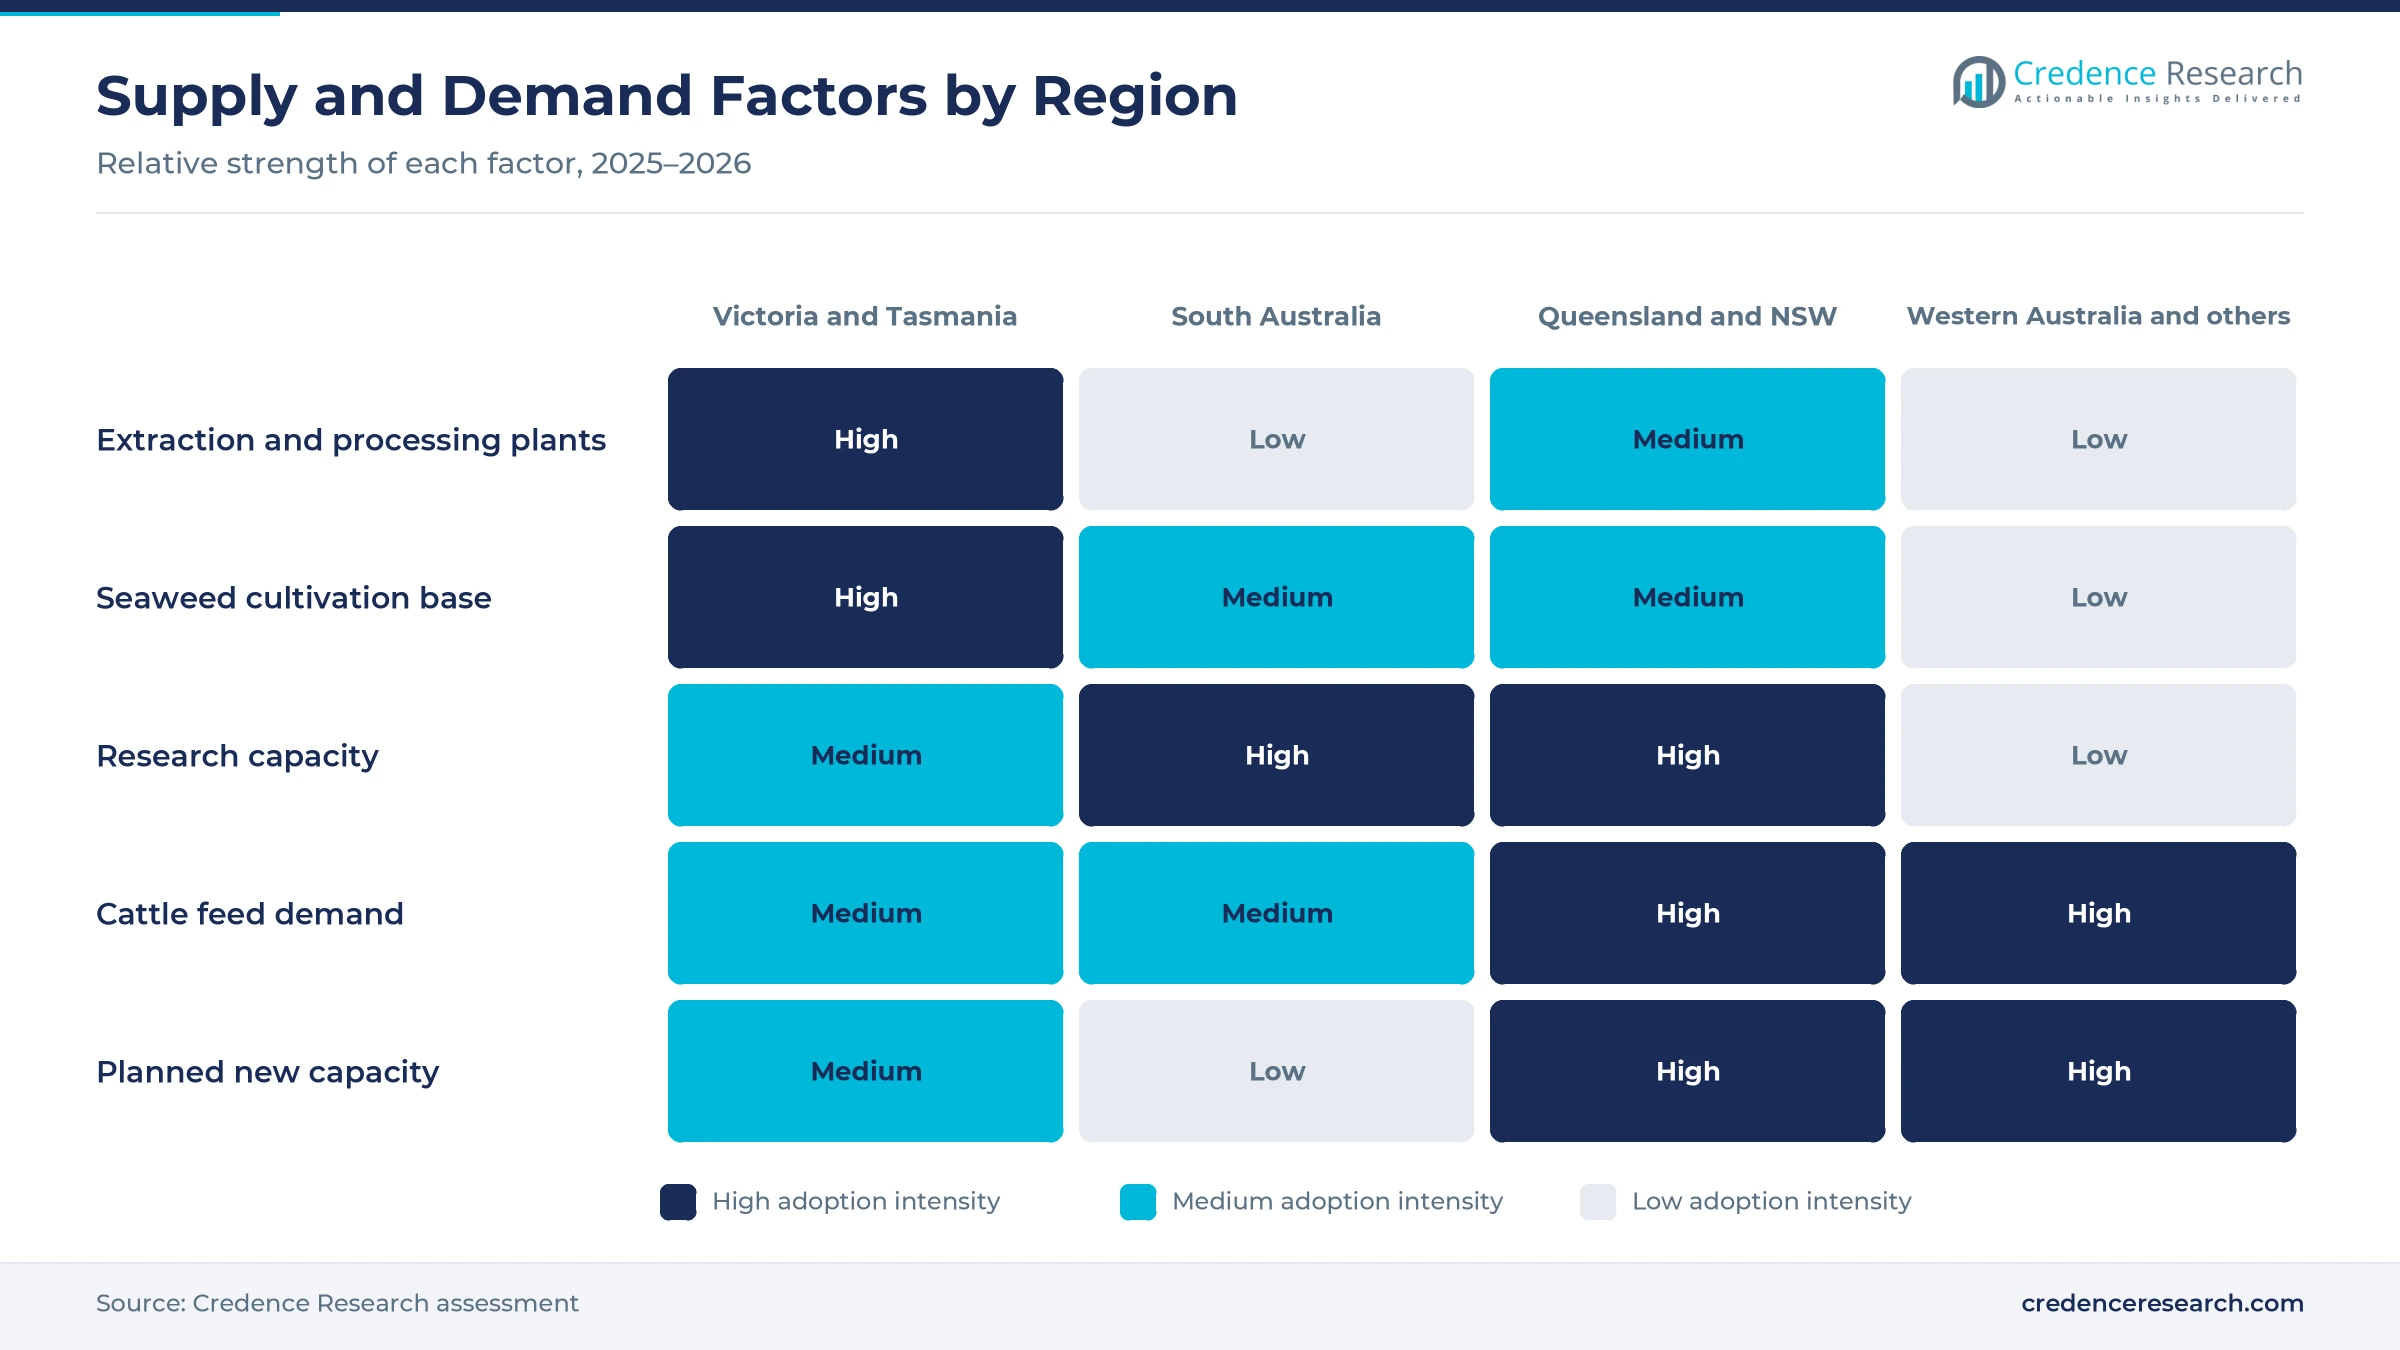
Qualified ingredient manufacturing lifts sales, because supplement, skincare and medical device brands buy only from plants that meet strict quality rules. Marinova completed a $5 million expansion of its Hobart fucoidan facility, which tripled production capacity, according to the Australian Export Awards. The company won the 2025 international health award after fucoidan sales rose about 31% over the past financial year. Venus Shell Systems also received $2 million on April 30, 2026, for a seaweed extract processing scale-up under good manufacturing practice rules. As a result, nutritional ingredients hold a 44.0% share of 2025 value, the largest product share, as makers of omega-3 ingredients supply formula brands.
Why does research-to-product conversion widen supply?
Research-to-product conversion widens supply, because shared research programs help small producers test new extracts before they invest in plants. The Marine Bioproducts Cooperative Research Centre began in July 2021 with $270 million in cash and in-kind support, including $59 million from the federal government over 10 years. The center links 68 Australian and international partners and works on nutrition, feed ingredients, cosmetics and medical biomaterials. The University of Tasmania also published a 12-month survey of Asparagopsis at 15 sites on Feb. 5, 2025, with funding from the center and Sea Forest. In turn, specialty product development grows as research buyers turn trial results into products.
How does functional feed commercialization raise demand?
Functional feed commercialization raises demand, because cattle producers want feed supplements that cut methane without hurting animal performance. Sea Forest listed on the Australian Securities Exchange on Nov. 26, 2025, after raising A$20.5 million, and it has arrangements covering about 118,000 head of livestock. Provectus Algae raised US$10.1 million in a Series A round on July 22, 2025, plus US$2.5 million in federal grant funding, to scale its Surf'N'Turf supplement. Mort & Co, a large lot feeding manager, is trialing that product with its cattle. As a result, functional seaweed inputs grow at 9.60% a year, the fastest product rate, as feed additives that cut methane gain buyers.
Why does public support for seaweed farming matter?
Public support for seaweed farming matters, because hatcheries, farms and processing plants need early funding before private investors commit. The Department of Agriculture ran an $8 million seaweed farming grant program from June 2023 for two years, with hatcheries at James Cook University and the South Australian Research and Development Institute. The NSW Government also aims to double the economic output of its aquaculture sector by 2030, and it announced $5.7 million for South Coast projects on April 30, 2026. Australian aquaculture output was 117,540 tons in 2024, according to World Bank data. In turn, coastal states with grant programs gain new hatchery and processing capacity.
Methane feed, organic status and new extracts reshape supply
How is the shift to methane-cutting feed changing supply?
The shift to methane-cutting feed is changing supply, because seaweed growers now plan plants close to large cattle regions. Sea Forest plans new facilities in Queensland, New South Wales, Western Australia and South Africa with its listing proceeds. The company signed a three-year agreement with Providore Global covering 12,000 head of cattle, with the full herd expected on its SeaFeed product by March 2026. Sea Forest is described as the first company to grow Asparagopsis at commercial scale in Australia. As a result, feed manufacturers grow at 9.50% a year, the fastest customer rate, as seaweed supply moves closer to feedlots. Sea Forest says SeaFeed can cut cattle methane emissions by up to 80%, which supports interest from large herds.
Why is the rise of certified organic extracts notable?
The rise of certified organic extracts is notable, because supplement and skincare brands in Europe and the United States ask for clean-label ingredients with clear origin. Marinova received EU organic certification for its Maritech organic fucoidans in September 2025, which added to its U.S. organic certification and prior EU Novel Foods authorization. The company supplies fucoidan extracts to brands in more than 35 countries and runs on 100% renewable energy. Its sales to Greece rose more than 860% in the past year, and the company targets South Korea within two years. In turn, commercial seaweeds gain value when processed into certified extracts.
Can microalgae nutrition open a new growth path?
Microalgae nutrition offers a growth path, because infant formula and supplement makers want omega-3 sources that do not depend only on fish oil. Clover Corporation makes omega-3 DHA and ARA powders for infant formula at a Melbourne refinery and launched CholineXcel and Premneo in its 2025 financial year. The company is also expanding sales in Europe, Asia and North America through dedicated distributors. The Marine Bioproducts Cooperative Research Centre lists omega-3 extraction from microalgae among its example projects, alongside feed and nutrition work. As a result, algae oil could add a second source of supply for local formulators.
Is there room to grow skincare and medical uses?
Skincare and medical uses have room to grow, because seaweed extracts can move into higher-value products than food or feed. Venus Shell Systems received $2 million on April 30, 2026, to expand its seaweed processing plant and make more ingredients for skincare, nutrition and medical products. The grant was the largest of four in a $5.7 million South Coast package. Marinova's fucoidan extracts are already used in supplements, animal health products, skincare, medical devices and clinical trials. The research center also works on turning fish skin into collagen for medical biomaterials, one of its example projects since July 2021. In turn, specialty bioactives gain value as brands pay more for purified extracts.
Biomass supply, regulation and scale-up costs slow growth
Why does biomass supply limit growth?
Biomass supply limits growth, because many seaweed species grow only in certain seasons and places. The University of Tasmania found that Asparagopsis grows year-round only at some southeastern Tasmanian sites, while most other regions see a spring and early summer crop. As a result, producers face uneven raw material supply during the year. This raises storage costs and makes long supply contracts harder to fill. Producers respond with hatcheries, land-based tanks and farms in several regions.
How do regulatory approvals slow new products?
Regulatory approvals slow new products, because feed supplements, food ingredients and skincare extracts each face separate rules in Australia and export markets. Sea Forest set aside part of its listing proceeds for regulatory approvals, which shows the cost of this work. In turn, smaller producers wait longer before they can sell abroad. This also delays revenue from new extracts and feed products by many months. Producers respond by building safety data early and working with export partners.
Why do scale-up costs weigh on producers?
Scale-up costs weigh on producers, because extraction plants, hatcheries and quality systems require large upfront spending before sales grow. Marinova needed federal and Tasmanian grants alongside its own funds for its $5 million plant expansion. As a result, many companies rely on grants and new equity to fund growth. This dilutes founders and often ties large projects to grant timetables. Producers respond with staged plant builds, shared facilities and supply contracts signed before expansion.
How does buyer caution limit feed adoption?
Buyer caution limits feed adoption, because cattle producers want proof that supplements cut methane without lowering weight gain or milk output. Feed trials take months and must cover different diets and climates. However, the federal seaweed program still funded research on carbon credit pathways, so payback for farmers remains unclear. Feed buyers also weigh supplement costs against tight feed budgets and cattle prices. Producers respond with large pilot trials, performance data and multi-year supply agreements.
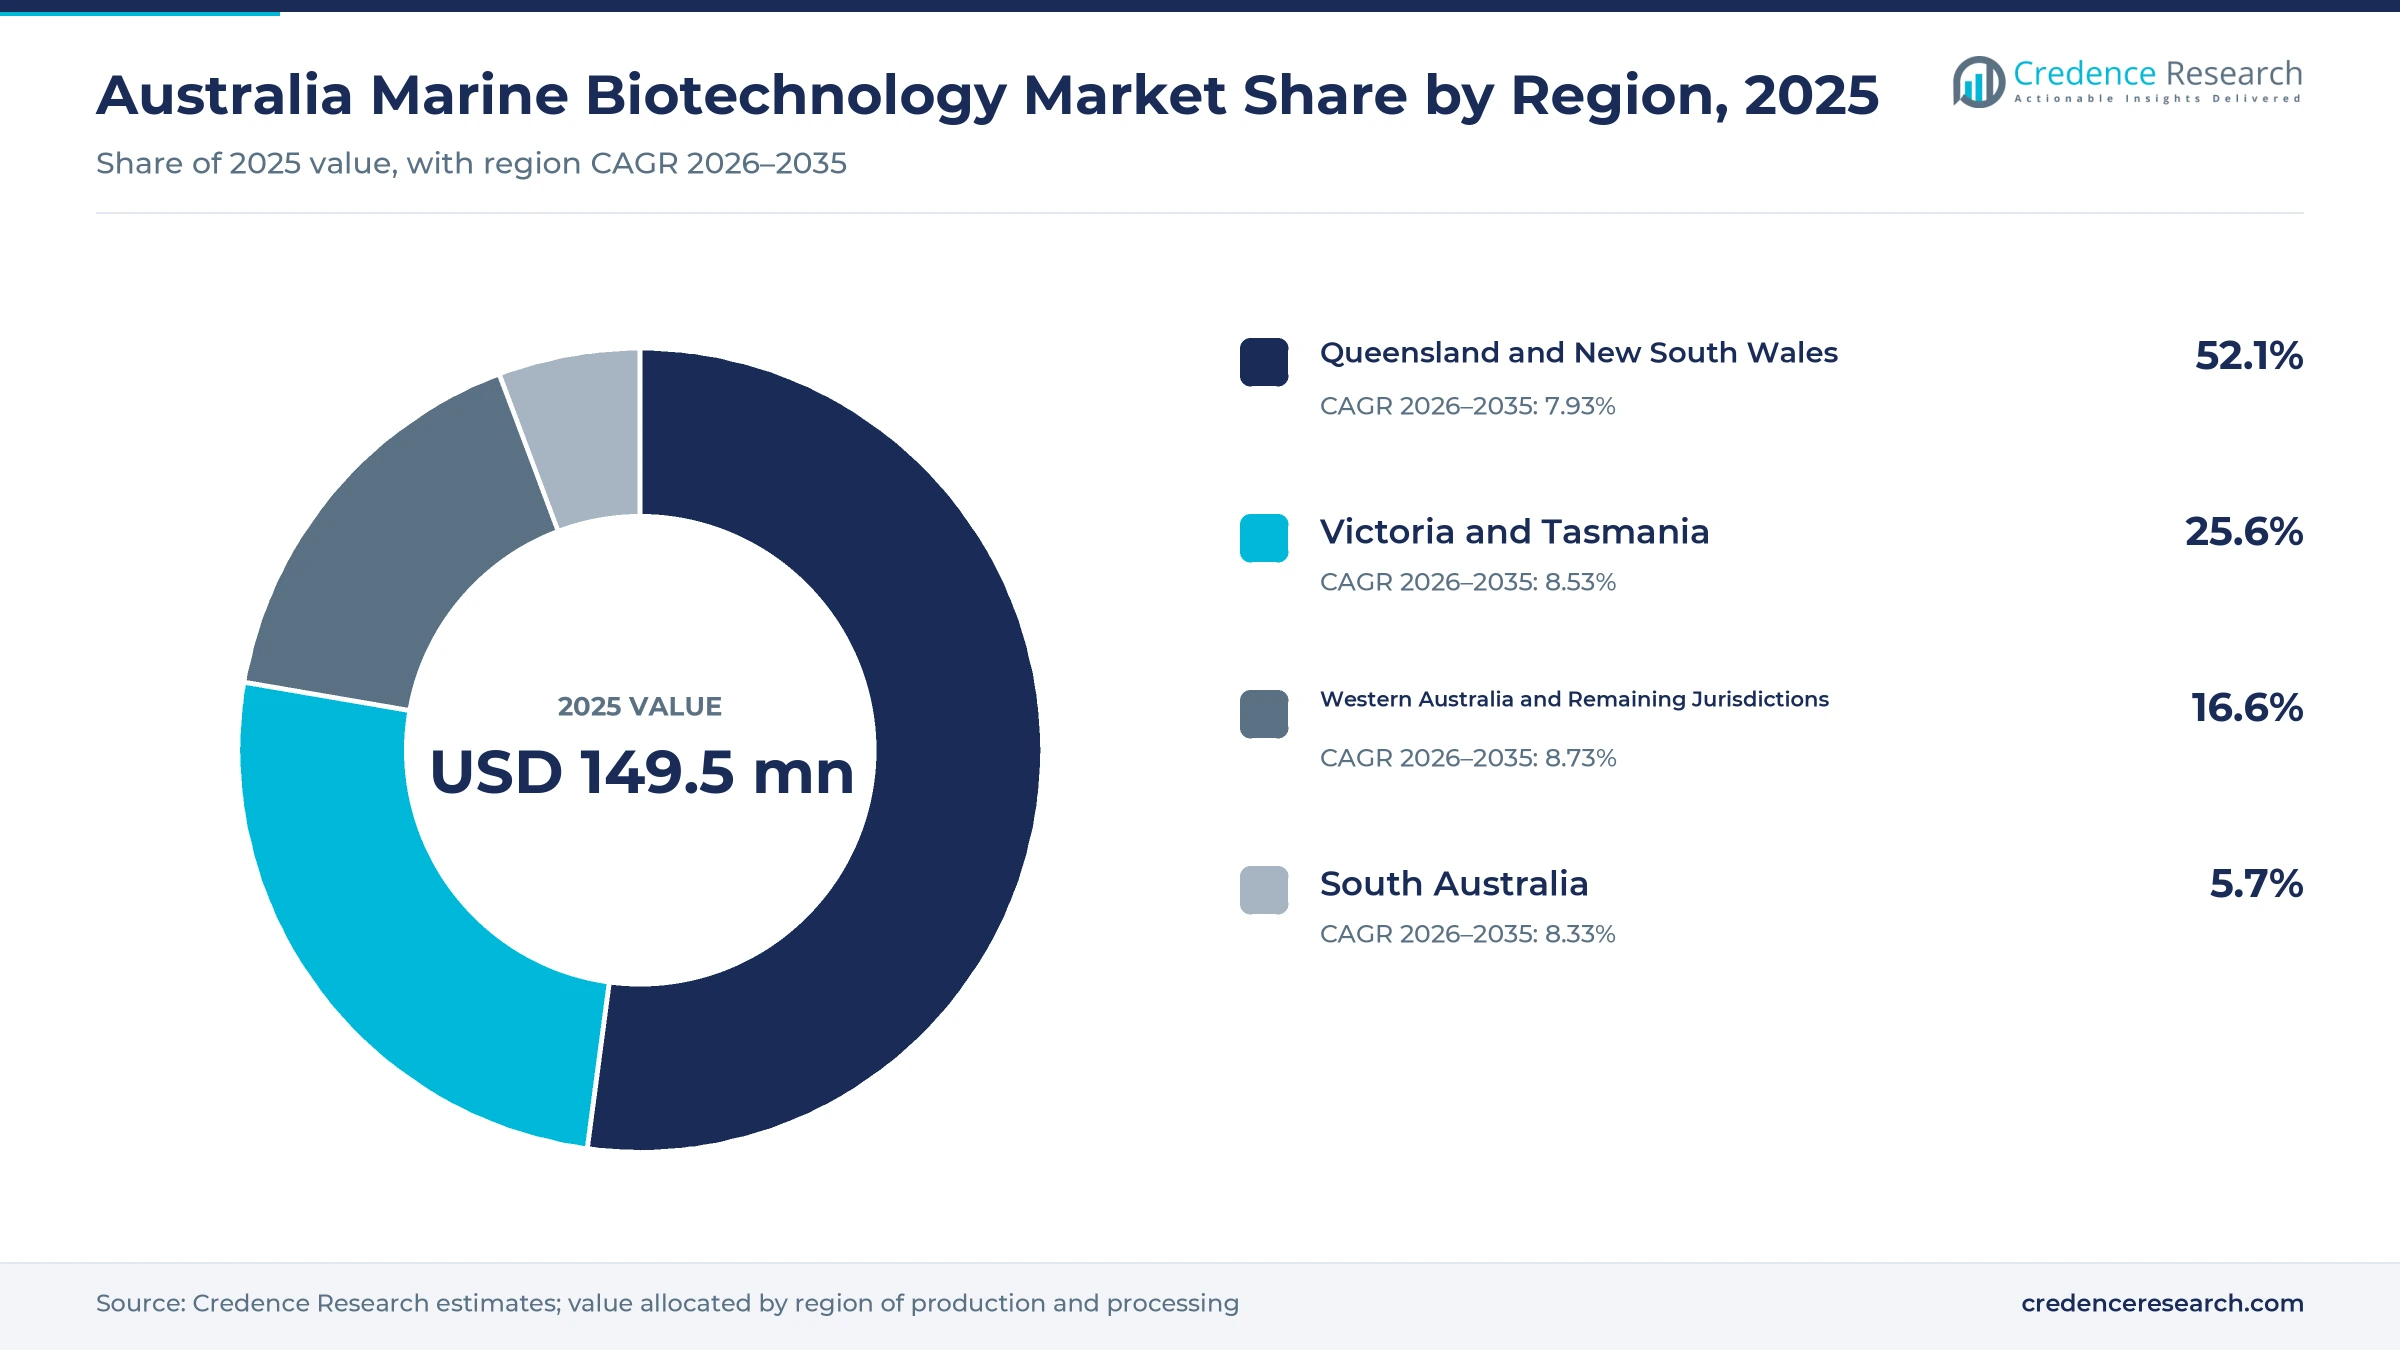
Queensland and New South Wales lead the regional split
| Region | Value, 2025 (USD million) | Share, 2025 | CAGR, 2026–2035 |
|---|---|---|---|
| Queensland and New South Wales | 77.9 | 52.1% | 7.93% |
| Victoria and Tasmania | 38.3 | 25.6% | 8.53% |
| Western Australia and Remaining Jurisdictions | 24.8 | 16.6% | 8.73% |
| South Australia | 8.5 | 5.7% | 8.33% |
Why do Queensland and New South Wales lead value?
Queensland and New South Wales held a 52.1% share of 2025 value and grow at 7.93% a year, because feed buyers, research groups and seaweed processors cluster along the east coast. Provectus Algae is based in Noosaville, Queensland and Venus Shell Systems processes seaweed on the New South Wales South Coast. James Cook University in Queensland also hosted a national seaweed hatchery. However, growth is slightly slower than the national rate because the zone already holds the largest base.
How do Victoria and Tasmania support ingredient supply?
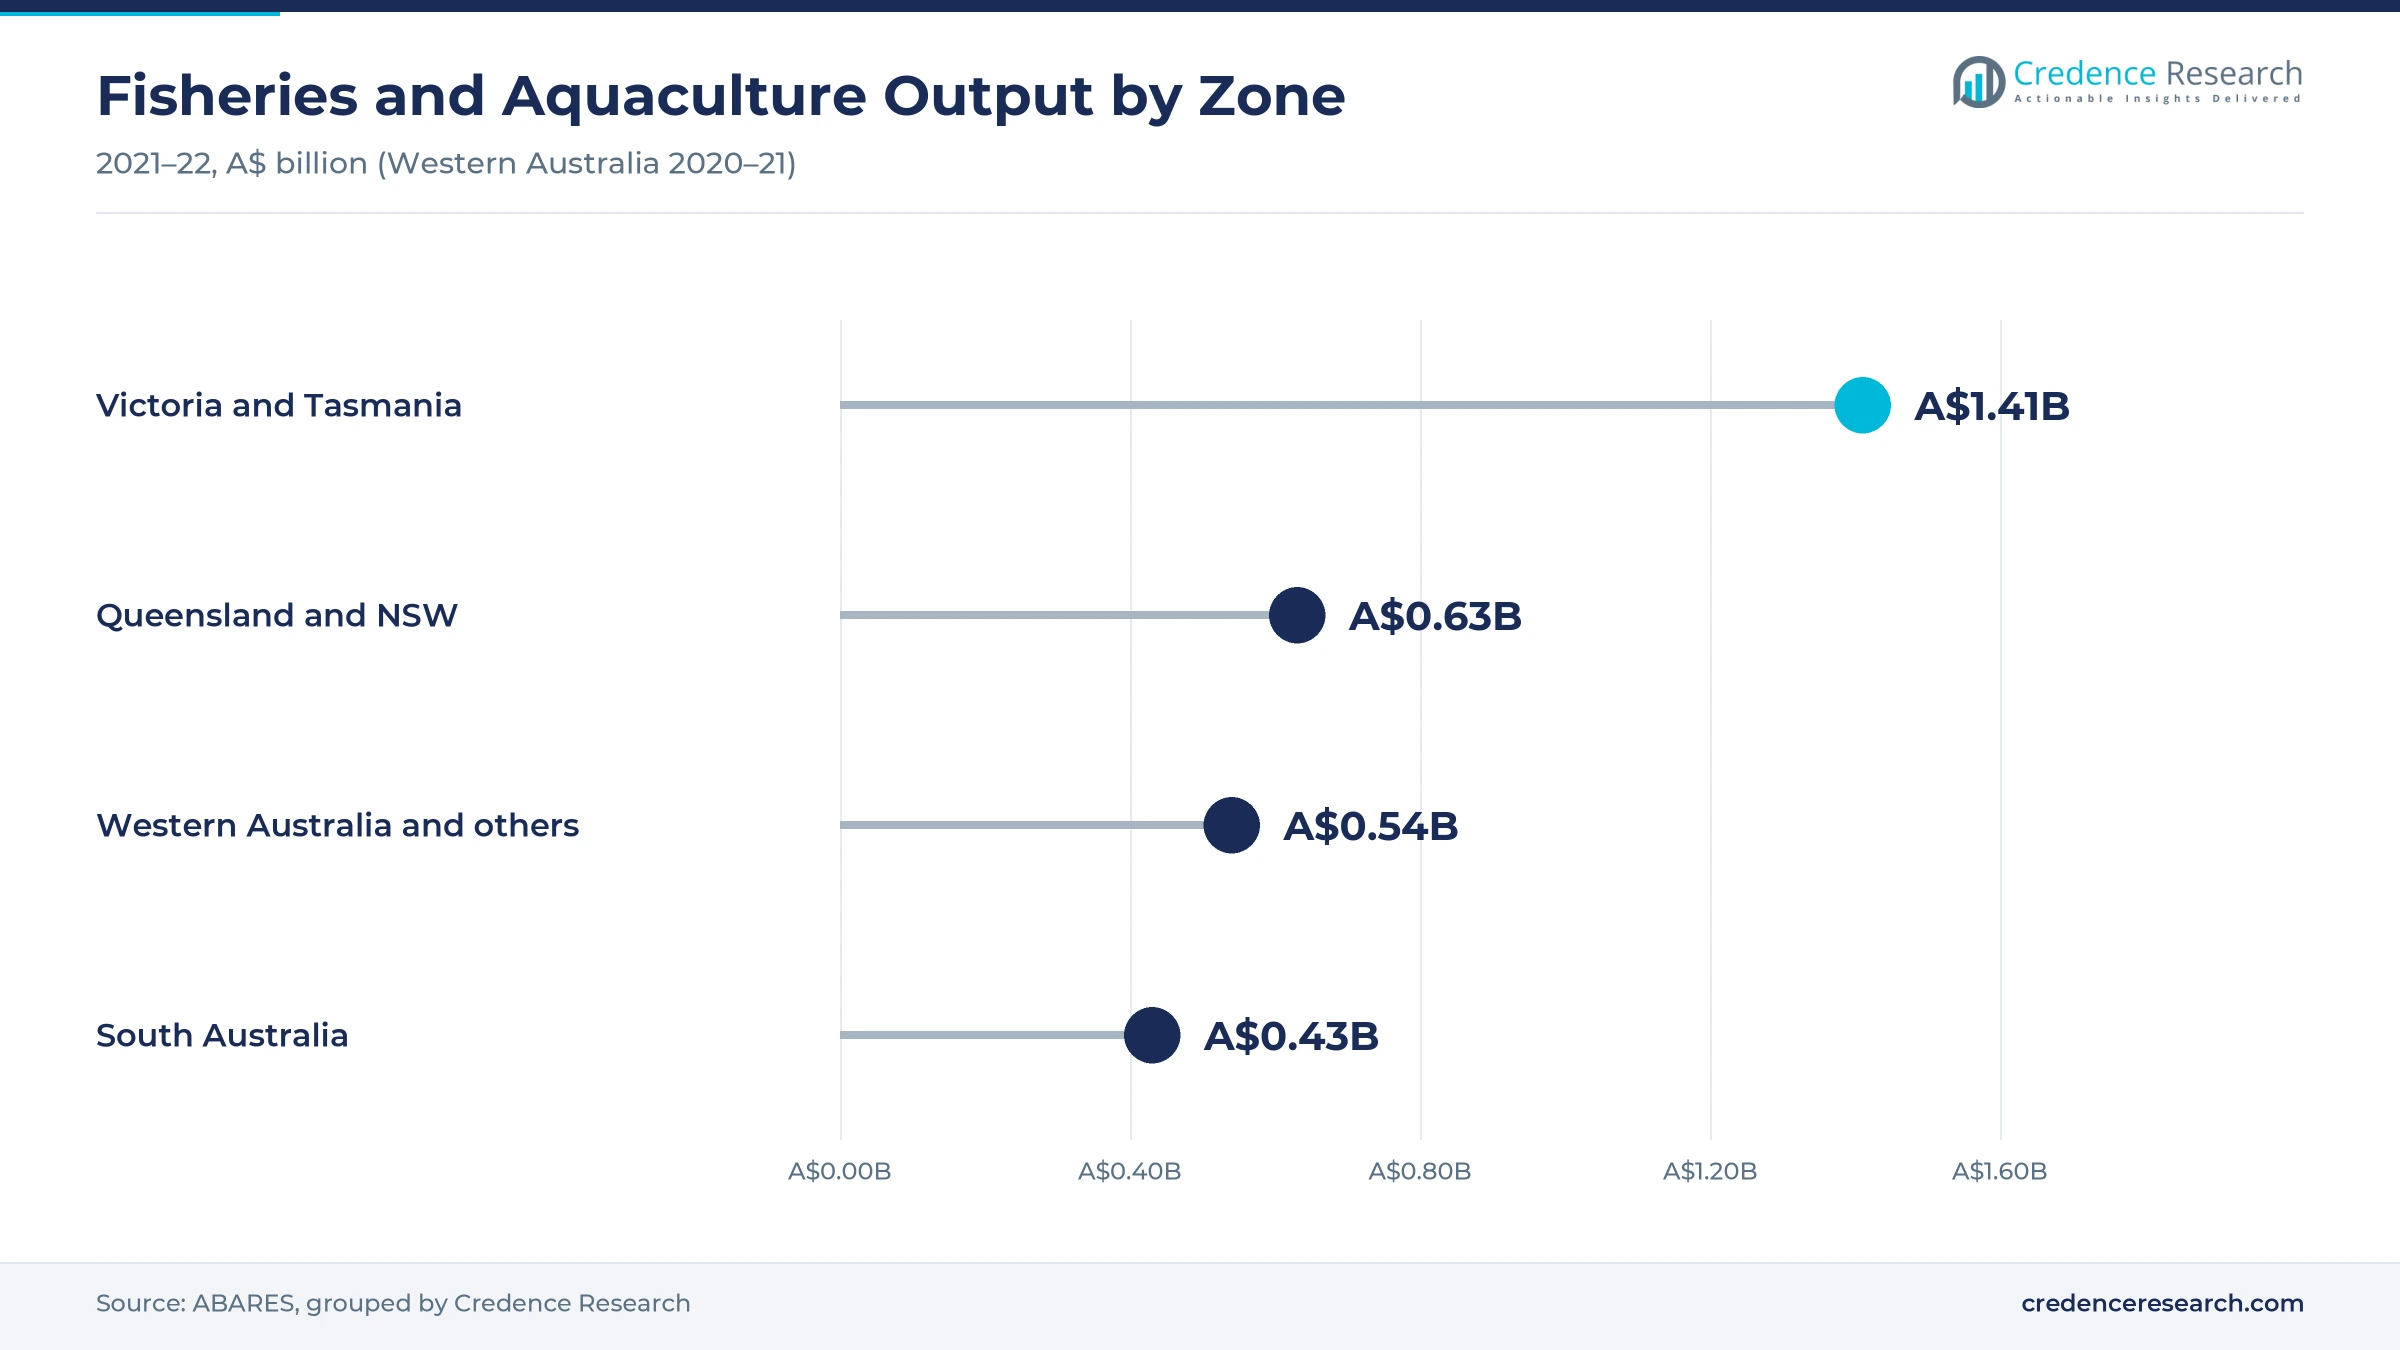
Victoria and Tasmania held a 25.6% share of 2025 value and grow at 8.53% a year, because the zone hosts fucoidan, seaweed feed and omega-3 plants. Marinova makes fucoidan in Hobart, Sea Forest grows Asparagopsis at Triabunna and Clover Corporation refines oil in Melbourne. Tasmania also produced fisheries and aquaculture output worth $1.31 billion in 2021-22, the largest of any state. In turn, the zone supplies many export ingredient buyers in Europe, Asia and North America.
Why do Western Australia and other jurisdictions grow fastest?
Western Australia and the remaining jurisdictions held a 16.6% share of 2025 value and grow fastest at 8.73% a year, because new seaweed feed capacity is planned for the west. Sea Forest plans a Western Australian facility with its listing proceeds, one of four new sites. As a result, large cattle regions in the west and north gain closer access to feed supplements. However, the zone starts from a small processing base, so most extracts still come from eastern plants.
What role does South Australia play in research?
South Australia held a 5.7% share of 2025 value and grows at 8.33% a year, because the state hosts research rather than large production. The Marine Bioproducts Cooperative Research Centre is headquartered at Flinders University, and the South Australian Research and Development Institute hosted a seaweed hatchery. In turn, the state supports research buyers across the country.
Plant expansions, listings and grants from 2024 to 2026
| Development | Status and market relevance |
|---|---|
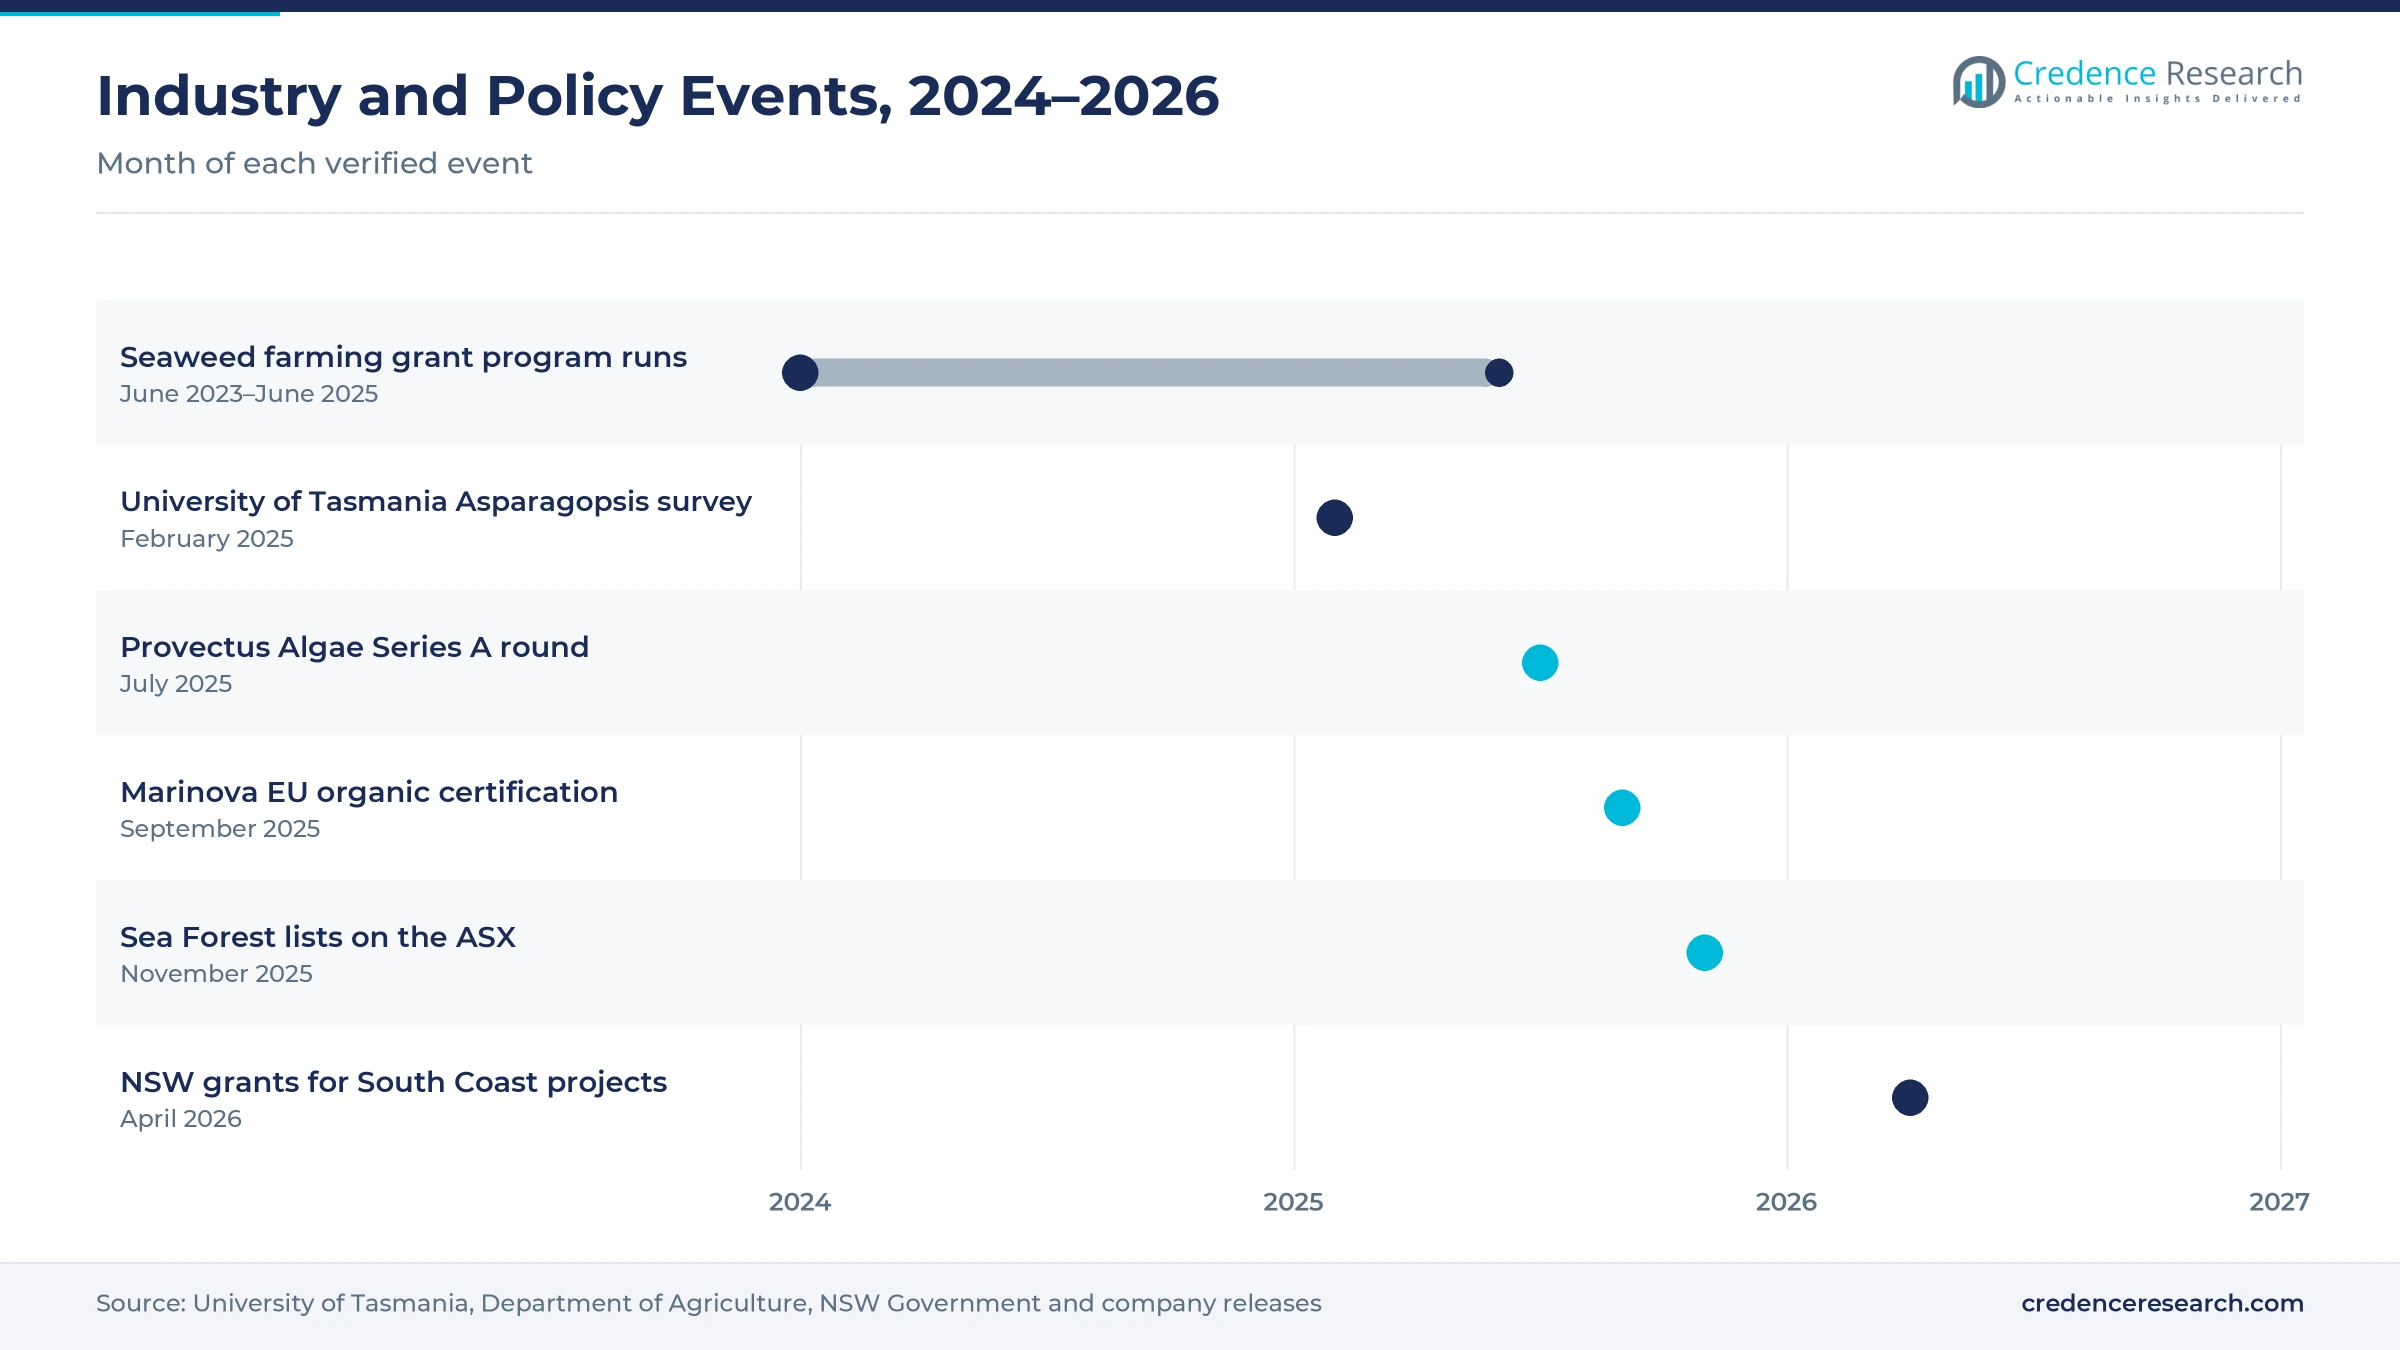
| In February 2025, the University of Tasmania published a 12-month Asparagopsis survey with Sea Forest. | Found year-round growth at some southeastern Tasmanian sites |
| In July 2025, Provectus Algae raised US$10.1 million in a Series A round plus US$2.5 million in grants. | Funds scale-up of its Surf'N'Turf feed supplement |
| In September 2025, Marinova received EU organic certification for Maritech organic fucoidans. | Supports sales to skincare and supplement brands |
| In November 2025, Sea Forest listed on the Australian Securities Exchange after raising A$20.5 million. | Proceeds fund new facilities in four regions |
| In April 2026, Venus Shell Systems received a $2 million NSW Government grant. | Supports a seaweed extract processing scale-up |
Extraction, cultivation and AI tools reshape production
- Extraction and purification turns seaweed and fish oil into consistent extracts, which lets producers meet supplement and skincare quality rules.
- Hatchery and tank cultivation grows seaweed year-round in controlled conditions, which reduces reliance on wild harvest and seasonal crops.
- Encapsulation and powder formulation protects omega-3 oils from oxidation, which lets infant formula makers add them to dry products.
- AI-enabled biomanufacturing tunes algae growth conditions with data, which helps producers raise yields and make new compounds.
Need a Custom Version of This Report?
Tailor the scope, geography, or segments to your exact requirements.
- Custom geography or segment scope
- Direct access to our analyst team
Producers compete on quality, scale and clinical evidence
Competition is led by specialist ingredient makers, seaweed feed producers and research-based startups, and rivals compete on quality, scale and evidence. Clover Corporation makes omega-3 DHA and ARA powders for infant formula and launched new products in its 2025 financial year. Marinova makes fucoidan extracts in Hobart and supplies brands in more than 35 countries. Sea Forest grows Asparagopsis in Tasmania and listed on the Australian Securities Exchange in November 2025. Provectus Algae uses AI-enabled biomanufacturing to make its feed supplement and raised new funding in July 2025. Venus Shell Systems processes seaweed into skincare, nutrition and medical ingredients on the New South Wales South Coast. Producers compete on certified quality, steady supply, trial data and long-term supply agreements with formulators and feedlot operators.
Companies profiled and their roles in this market
| Company | Type | Role in the market |
|---|---|---|
| Clover Corporation | Nutritional ingredient maker | Makes omega-3 DHA and ARA powders at a Melbourne refinery |
| Marinova | Specialty bioactive producer | Tripled Hobart fucoidan capacity with a $5 million expansion |
| Sea Forest | Seaweed feed producer | Listed on the Australian Securities Exchange in November 2025 |
| Provectus Algae | Algae biomanufacturer | Raised a US$10.1 million Series A round in July 2025 |
| Venus Shell Systems | Seaweed processor | Received a $2 million grant for processing scale-up in April 2026 |
Credence Research view on Australian ocean bioproducts
Credence Research's view is that Australian ocean-derived ingredients will grow steadily because feed buyers, formula makers and skincare brands all need reliable marine inputs. Nutritional ingredients remain the largest product group, while seaweed feed supplements gain share as cattle producers act on methane. Public research funding and state grants support new plants, although biomass supply, approvals and scale-up costs still slow growth. Producers with certified plants, trial data and long-term supply contracts should gain share fastest.
How the Australian ocean bioproducts estimate was built
The report uses 2025 as the base year on a calendar basis, and market values come from the Credence Research model. That model combines World Bank aquaculture statistics, federal fisheries production data, government grant announcements, university research releases and company announcements on plant expansions, listings and funding rounds. Segment splits and regional growth rates are Credence Research estimates, while regional shares follow the client-defined split. Sources used are public reports, official statistics, trade press, government releases and company releases, and no interviews or surveys were used.
Feed demand and export ingredients carry growth to 2035
Ocean-derived ingredient value is expected to reach USD 342.7 million by 2035, an 8.24% CAGR during 2026–2035, as feed demand, export ingredient sales and research funding keep supply rising. Growth should be fastest while new seaweed feed plants open in Queensland, New South Wales and Western Australia. After that, specialty bioactives and microalgae nutrition will carry more growth as brands pay for purified extracts. Clear carbon credit rules for feed would lift uptake sharply, while weak trial results would slow it.
Frequently Asked Questions
How big is the Australia marine biotechnology market?
Which product type leads Australian ocean-derived ingredient value?
Which region leads the Australia marine biotechnology market?
What is Asparagopsis and why does it matter?
How much public funding supports ocean bioproduct research?
Which customer type is growing fastest?
Who are the leading marine biotechnology companies in Australia?
What are the main challenges for ocean-derived ingredient producers?
Table of Content
Chapter 1 Market Segmentation
- 1.1 Segmentation Framework
- 1.1.1 Product and Service Classification
- 1.1.2 Application and End-Use Classification
- 1.1.3 Technology and Solution Classification
- 1.1.4 Customer and Distribution Channel Classification
- 1.1.5 Geographic Segmentation
- 1.1.6 Market Segment Definitions and Boundaries
- 1.2 By Product Type
- 1.2.1 Nutritional Ingredients
- 1.2.2 Functional Seaweed Inputs
- 1.2.3 Specialty Bioactives
- 1.2.4 Research Services
- 1.3 By Application
- 1.3.1 Human Nutrition
- 1.3.2 Animal Performance
- 1.3.3 Specialty Product Development
- 1.4 By Customer Type
- 1.4.1 Ingredient Formulators
- 1.4.2 Feed Manufacturers
- 1.4.3 Research Buyers
- 1.5 By Sales Channel
- 1.5.1 Direct Supply Agreements
- 1.5.2 Specialist Distributors
- 1.5.3 Development Partnerships
Chapter 2 Introduction
- 2.1 Report Objectives and Scope
- 2.2 Product Definition and Industry Terminology
- 2.3 Market Inclusions and Exclusions
- 2.4 Research Process
- 2.4.1 Primary Research and Expert Interviews
- 2.4.2 Secondary Research and Source Review
- 2.4.3 Top-Down and Bottom-Up Estimation
- 2.4.4 Data Triangulation and Verification
- 2.5 Market Size Measurement Basis
- 2.5.1 2025: USD 149.5 million → 2035: USD 342.7 million
- 2.6 Historical and Forecast Reference Periods
- 2.6.1 Historical Period: 2018-2025
- 2.6.2 Base Year: 2025
- 2.6.3 Forecast Period: 2025-2035
- 2.7 Research Assumptions and Limitations
Chapter 3 Executive Summary
- 3.1 Market Snapshot and Key Findings
- 3.2 Base-Year Market Size, 2025
- 3.3 Forecast Market Size, 2035
- 3.4 Revenue and Volume Growth Outlook
- 3.5 Key Demand and Supply Indicators
- 3.6 Leading Market Segments
- 3.7 Fastest-Growing Market Opportunities
- 3.8 Regional Performance Highlights
- 3.9 Technology and Industry Transformation
- 3.10 Competitive Landscape Summary
- 3.11 Analyst View and Strategic Implications
Chapter 4 Australia Marine Biotechnology Market Trends and Developments
- 4.1 Historical Industry Development, 2018-2025
- 4.2 Recent Market Trends and Developments
- 4.3 Demand and Customer Behavior Trends
- 4.4 Technology and Product Innovation
- 4.5 Artificial Intelligence, Automation and Digitalization
- 4.6 Local Manufacturing and Supply Chain Realignment
- 4.7 Industry Partnerships, Mergers and Acquisitions
- 4.8 Sustainability and Circular Economy Developments
- 4.9 Government and Private Sector Investment Trends
- 4.10 Emerging Business Models and Commercialization
- 4.11 Industry Developments and Announcements
Chapter 5 Australia Marine Biotechnology Market Production, Supply and Demand Analysis
- 5.1 Demand Trend and Consumption Analysis, 2018-2025
- 5.2 Demand Forecast, 2025-2035
- 5.3 Production and Output Trend, 2018-2025
- 5.4 Production and Output Forecast, 2025-2035
- 5.5 Installed Capacity and Capacity Utilization
- 5.6 Company-Wise Production Plants and Statistics
- 5.6.1 Installed Production Capacity
- 5.6.2 Actual Production
- 5.6.3 Planned Capacity and Expansion Targets
- 5.7 Supply Chain Structure and Procurement Trends
- 5.8 Supply-Demand Gap and Bottlenecks
- 5.9 Import Dependence and Sourcing Structure
- 5.10 Contract Manufacturing and Outsourcing
- 5.11 Regional Supply and Demand Concentration
Chapter 6 Australia Marine Biotechnology Market Pricing Analysis
- 6.1 Pricing Structure and Measurement
- 6.2 Historical Pricing Trends, 2018-2025
- 6.3 Pricing Outlook, 2025-2035
- 6.4 Average Selling Price and Unit Economics
- 6.5 Pricing by Product and Market Segment
- 6.6 Geographic Pricing Differences
- 6.7 Key Input, Energy, Labor and Logistics Costs
- 6.8 Contract Pricing and Purchasing Models
- 6.9 Pricing Sensitivity and Competitive Positioning
- 6.10 Price, Margin and Profitability Implications
Chapter 7 Australia Marine Biotechnology Market Dynamics
- 7.1 Market Growth Drivers
- 7.1.1 Demand-Side Drivers
- 7.1.2 Technology and Innovation Drivers
- 7.1.3 Infrastructure and Investment Drivers
- 7.1.4 Regulatory and Policy Drivers
- 7.2 Market Restraints
- 7.2.1 Cost and Affordability Constraints
- 7.2.2 Technology and Adoption Barriers
- 7.2.3 Supply Chain and Operational Constraints
- 7.3 Market Challenges
- 7.3.1 Competitive Pressure and Margin Erosion
- 7.3.2 Skills, Infrastructure and Implementation Gaps
- 7.4 Emerging Market Opportunities
- 7.5 Market Dynamics Impact and Time-Horizon Assessment
Chapter 8 Australia Marine Biotechnology Value Chain Analysis
- 8.1 Industry Value Chain Overview
- 8.2 Upstream Suppliers and Critical Inputs
- 8.3 Technology and Component Providers
- 8.4 Manufacturing or Service Delivery
- 8.5 Distribution, Channel Partners and Integrators
- 8.6 Downstream Applications and End Users
- 8.7 Value Addition and Profit Pools
- 8.8 Vertical Integration and Outsourcing
- 8.9 Supplier Concentration and Risk
- 8.10 Supply Chain Localization and Resilience
Chapter 9 Australia Marine Biotechnology Market Regulations and Policies
- 9.1 Relevant Laws, Standards and Compliance Frameworks
- 9.2 Product, Service, Safety and Quality Requirements
- 9.3 Government Policies, Incentives and Subsidies
- 9.4 Imports, Exports and Trade Barriers
- 9.5 Public Procurement and Local Content Requirements
- 9.6 Environmental and Sustainability Compliance
- 9.7 Upcoming Policy Changes and Market Implications
Chapter 10 Australia Marine Biotechnology Market Hotspots and Opportunities
- 10.1 Market Opportunity Mapping and Growth Hotspots
- 10.2 High-Growth Applications and Customer Groups
- 10.3 Underserved Markets and White-Space Opportunities
- 10.4 Emerging Technology and Product Opportunities
- 10.5 New Capacity and Investment Hotspots
- 10.6 Market Entry and Expansion Opportunities
- 10.7 Distribution and Partnership Opportunities
- 10.8 Near-Term and Long-Term Commercial Potential
- 10.9 Opportunity Attractiveness and Execution Risks
Chapter 11 Australia Marine Biotechnology Market Outlook, 2025-2035
- 11.1 Market Size and Analysis
- 11.1.1 Revenue (Market Measurement: 2025: USD 149.5 million → 2035: USD 342.7 million)
- 11.1.2 Market Volume and Quantity Sold
- 11.1.3 Historical Market Size, 2018-2025
- 11.1.4 Base-Year Market Size, 2025
- 11.2 Market Forecast, 2025-2035
- 11.2.1 Revenue Forecast to 2035
- 11.2.2 Volume Forecast to 2035
- 11.2.3 CAGR and Year-on-Year Growth
- 11.2.4 Incremental Revenue Opportunity
- 11.3 Forecast Assumptions and Scenario Analysis
- 11.3.1 Base-Case Forecast
- 11.3.2 Optimistic and Conservative Scenarios
- 11.3.3 Technology, Pricing and Policy Sensitivities
- 11.4 Market Attractiveness and Growth Outlook
Chapter 12 Australia Marine Biotechnology Market Segmentation and Outlook
- 12.1 Segmentation Summary and Market Shares, 2025
- 12.2 Largest and Fastest-Growing Segments
- 12.3 By Product Type - Market Size and Forecast, 2025-2035
- 12.3.1 Segment Definition and Scope
- 12.3.2 Historical Market Size, 2018-2025
- 12.3.3 Revenue Forecast, 2025-2035
- 12.3.4 Volume Forecast, 2025-2035
- 12.3.5 Base-Year Market Share, 2025
- 12.3.6 Segment CAGR and Growth Drivers
- 12.3.7 Subsegment Market Size and Forecast
- 12.3.7.1 Nutritional Ingredients
- 12.3.7.2 Functional Seaweed Inputs
- 12.3.7.3 Specialty Bioactives
- 12.3.7.4 Research Services
- 12.3.8 Subsegment Pricing and Adoption Trends
- 12.3.9 Leading Suppliers and Competition
- 12.3.10 Regional Demand and Opportunities
- 12.4 By Application - Market Size and Forecast, 2025-2035
- 12.4.1 Segment Definition and Scope
- 12.4.2 Historical Market Size, 2018-2025
- 12.4.3 Revenue Forecast, 2025-2035
- 12.4.4 Volume Forecast, 2025-2035
- 12.4.5 Base-Year Market Share, 2025
- 12.4.6 Segment CAGR and Growth Drivers
- 12.4.7 Subsegment Market Size and Forecast
- 12.4.7.1 Human Nutrition
- 12.4.7.2 Animal Performance
- 12.4.7.3 Specialty Product Development
- 12.4.8 Subsegment Pricing and Adoption Trends
- 12.4.9 Leading Suppliers and Competition
- 12.4.10 Regional Demand and Opportunities
- 12.5 By Customer Type - Market Size and Forecast, 2025-2035
- 12.5.1 Segment Definition and Scope
- 12.5.2 Historical Market Size, 2018-2025
- 12.5.3 Revenue Forecast, 2025-2035
- 12.5.4 Volume Forecast, 2025-2035
- 12.5.5 Base-Year Market Share, 2025
- 12.5.6 Segment CAGR and Growth Drivers
- 12.5.7 Subsegment Market Size and Forecast
- 12.5.7.1 Ingredient Formulators
- 12.5.7.2 Feed Manufacturers
- 12.5.7.3 Research Buyers
- 12.5.8 Subsegment Pricing and Adoption Trends
- 12.5.9 Leading Suppliers and Competition
- 12.5.10 Regional Demand and Opportunities
- 12.6 By Sales Channel - Market Size and Forecast, 2025-2035
- 12.6.1 Segment Definition and Scope
- 12.6.2 Historical Market Size, 2018-2025
- 12.6.3 Revenue Forecast, 2025-2035
- 12.6.4 Volume Forecast, 2025-2035
- 12.6.5 Base-Year Market Share, 2025
- 12.6.6 Segment CAGR and Growth Drivers
- 12.6.7 Subsegment Market Size and Forecast
- 12.6.7.1 Direct Supply Agreements
- 12.6.7.2 Specialist Distributors
- 12.6.7.3 Development Partnerships
- 12.6.8 Subsegment Pricing and Adoption Trends
- 12.6.9 Leading Suppliers and Competition
- 12.6.10 Regional Demand and Opportunities
- 12.7 Segment Growth Comparison
- 12.8 Segment Attractiveness and Priority Matrix
Chapter 13 Australia Marine Biotechnology End-Use and Application Market Outlook
- 13.1 End-Use Industry and Customer Demand Structure
- 13.2 Leading Applications and Customer Groups
- 13.3 End-Use Market Size, Share and Forecast
- 13.4 Major End-Use Industry Deep Dives
- 13.4.1 Customer Requirements and Use Cases
- 13.4.2 Demand and Replacement Cycles
- 13.4.3 Technical and Regulatory Considerations
- 13.4.4 Purchasing and Procurement Models
- 13.4.5 Leading Vendors and Distribution Channels
- 13.4.6 Forecast and Commercial Opportunities
- 13.5 Emerging Applications and Cross-Segment Demand
- 13.6 End-Use Industry Investment Priorities
Chapter 14 Australia Marine Biotechnology Geographic Market Outlook, 2025-2035
- 14.1 Domestic Market Distribution and Demand Clusters
- 14.2 State- or Province-Wise Market Size and Forecast, 2025-2035
- 14.3 City and Metropolitan Market Outlook
- 14.4 Industrial, Manufacturing and Commercial Clusters
- 14.5 Geographic Concentration of Key End Users
- 14.6 Local Pricing and Purchasing Differences
- 14.7 Domestic Production Facilities and Capacity Map
- 14.8 Local Infrastructure and Project Pipeline
- 14.9 State-Level Policy and Incentive Differences
- 14.10 Subnational Investment Hotspots and Opportunities
- 14.11 Distribution and Logistics Networks
- 14.12 Domestic Competitive Footprint
Chapter 15 Australia Marine Biotechnology Technology, Innovation and Sustainability Outlook
- 15.1 Technology Landscape and Maturity
- 15.2 Product, Process and Service Innovation
- 15.3 AI, Automation and Digital Tools in the Industry
- 15.4 Technology Adoption and Performance Benchmarking
- 15.5 Innovation Pipeline and R&D Investment
- 15.6 Patent and Intellectual Property Trends
- 15.7 Energy Efficiency and Resource Management
- 15.8 Sustainability, Recycling and Circularity
- 15.9 Technology Roadmap, 2025-2035
- 15.10 Risks of Obsolescence and Technology Substitution
Chapter 16 Australia Marine Biotechnology Market Key Strategic Imperatives
- 16.1 Growth and Market Entry Priorities
- 16.2 High-Return Products and Segments
- 16.3 Pricing, Profitability and Cost Optimization
- 16.4 Technology Investment and Product Differentiation
- 16.5 Supply Chain Localization and Resilience
- 16.6 Distribution and Customer Acquisition
- 16.7 Partnership, Acquisition and Capacity Strategy
- 16.8 Regional Expansion Priorities
- 16.9 Short-, Medium- and Long-Term Actions
Chapter 17 Competition Outlook
- 17.1 Industry Competition Characteristics
- 17.2 Market Structure and Concentration
- 17.3 Market Share and Competitive Positioning, 2025
- 17.4 Company-Wise Revenue and Product Benchmarking
- 17.5 Production and Service Capacity Benchmarking
- 17.6 Technology, Pricing and Differentiation
- 17.7 Regional Footprint and Distribution Strength
- 17.8 Mergers, Acquisitions and Strategic Alliances
- 17.9 New Entrants and Competitive Threats
- 17.10 Porter's Five Forces and Industry Attractiveness
- 17.11 Competitive Outlook, 2025-2035
Chapter 18 Company Profiles
- 18.1 Company Coverage and Selection Criteria
- 18.2 Clover Corporation
- 18.2.1 Business Description
- 18.2.2 Company Ownership and Geographic Presence
- 18.2.3 Product and Service Portfolio
- 18.2.4 Manufacturing and Operating Footprint
- 18.2.5 Production Capacity and Expansion Plans
- 18.2.6 Financial Performance and Investment
- 18.2.7 Market Share and Competitive Position
- 18.2.8 Technology and Innovation Capabilities
- 18.2.9 Strategic Alliances or Partnerships
- 18.2.10 Recent Developments
- 18.2.11 Growth Strategy and Outlook
- 18.3 Marinova
- 18.4 Sea Forest
- 18.5 Provectus Algae
- 18.6 Venus Shell Systems
- 18.7 Other Relevant Market Participants
Note: Every listed company is profiled on the structure shown under the first company. The company list is preliminary and may change based on research findings, market developments, data availability and client requirements.
Chapter 19 Disclaimer
- 19.1 Research and Forecast Disclaimer
- 19.2 Data Source and Estimation Limitations
Note: The depth of individual sections depends on data availability for this market. Volume, capacity, trade and other unit-based metrics are included where applicable.

