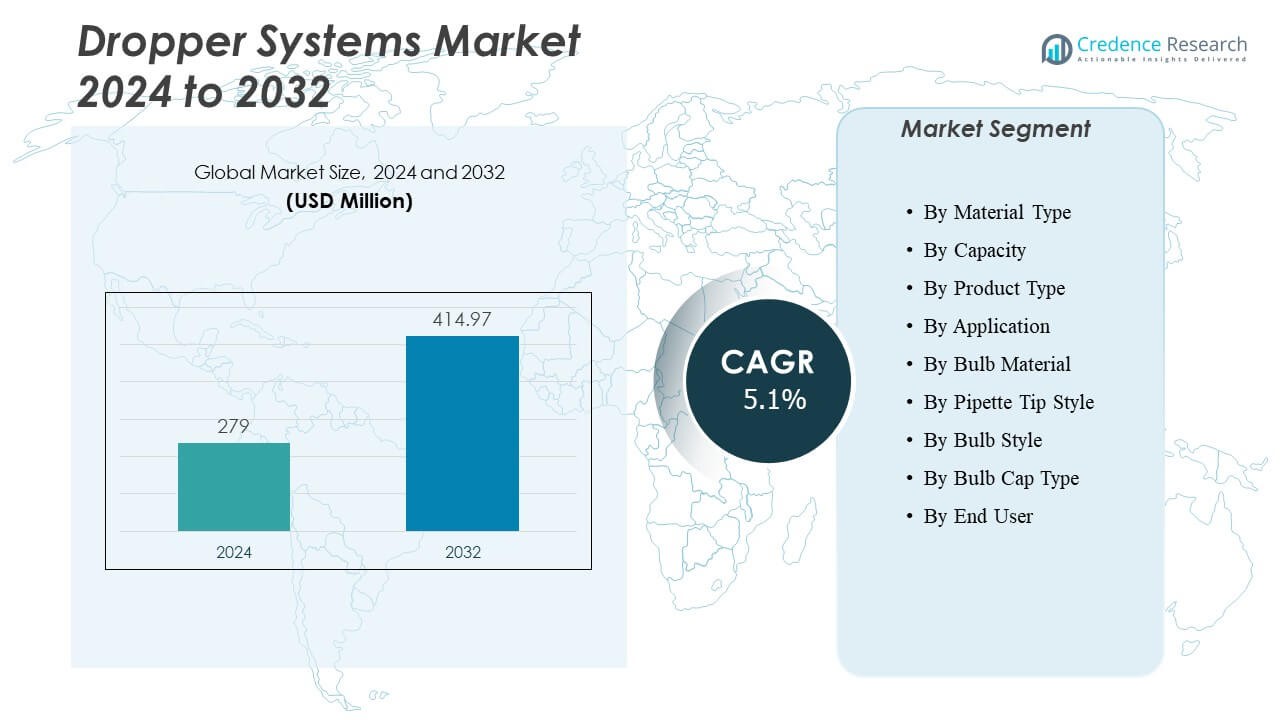
Home » Healthcare » Dropper Systems Market

Dropper Systems Market By Product Type (Dropper Bottles, Dropper Pipettes, Dropper Caps and Closures) By Material Type (Glass Droppers, Plastic Droppers, Rubber Bulbs and Components) -Growth, Future Prospects & Competitive Analysis, 2022 – 2030

Price: $4999

Published: | Report ID: 22850 | Report Format : PDF

Market Insights

  • The global demand for dropper systems was valued at USD 65.1 million in 2022 and is expected to reach USD 99.90 million in 2030, growing at a CAGR of 5.50% between 2023 and 2030.
  • Dropper bottles are the leading segment by product type. The Dropper pipettes, on the other hand, are expected to grow at a strong CAGR.
  • The leading material type segment is plastic droppers.
  • The CAGR for pharmaceuticals is expected to be the highest during the projection period.
  • During the forecast time frame, the micro droppers are likely to have the highest CAGR.
  • During the forecast period, child-resistant closures are estimated to have the greatest CAGR.
  • The pharmaceutical and healthcare industry is probably going to have the highest CAGR during the prediction period.
  • Direct sales are the largest distribution channel categorization.
  • Asia Pacific dominated the dropper system market.
  • Europe is predicted to be the second-largest region in the dropper system market.
  • In the market for dropper systems, North America is anticipated to grow at the fastest rate.
  • Dropper system industry growth is anticipated to be primarily driven by factors including the rising prevalence of chronic diseases, growing need for accurate dosing, rising preference for innovative healthcare packaging and rising demand for pharma droppers.
  • Consumers are becoming more environmentally conscious and are looking for products that are made from sustainable materials. Dropper system manufacturers are responding to this demand by developing dropper systems that are made from recyclable or compostable materials. This is a growing opportunity for the dropper system market.

Executive Summary

Market Definition

The dropper system market is a niche within the broader packaging industry that focuses on the development, manufacture, and distribution of specialized packaging systems and parts used for the controlled application and precise dispensing of liquids. Pharmaceuticals, healthcare, cosmetics, personal care, food and beverages, e-liquids, and more are a few of the sectors and uses for which this market offers a range of solutions and products that are tailored.

Design Element 2

Access crucial information at unmatched prices!

Request your free sample report today & start making informed decisions powered by Credence Research!

Download Free Sample
CTA Design Element 3

Market Overview

The market for dropper systems has been expanding steadily in recent years, and between 2023 and 2030, it is anticipated to rise at a CAGR of 5.50%. The market was estimated to be worth USD 65.1 million in 2022, and it is anticipated to be worth USD 99.90 million in 2030.

The growing importance of private-label brands is one of the major factors driving the expansion of the dropper system industry. Private-label droppers are becoming more and more of a priority for shops all around the world. In order to boost their income, a number of market participants are offering various kinds of droppers under their private-label brands. Additionally, many market participants from around the world are launching their brands of droppers.

Consumer preferences are changing, and there is an increasing need for personalization in the dropper system market. More and more buyers are looking for goods that satisfy their specific demands and preferences. A vast range of customization possibilities, including bottle sizes, materials, colors, and dropper tip designs, are now available due to this trend. Customized dropper systems allow firms to stand out in a congested market while simultaneously improving the customer experience.

Additionally, it has developed into a crucial selling point to be able to alter dropper systems to fit different sectors and product categories. To meet certain formulas and viscosities, for instance, brands in the cosmetics industry have tailored dropper bottles and pipettes. Along with meeting customer expectations, this flexibility gives organizations a competitive edge. The capacity to provide adaptable dropper solutions will probably be crucial in addressing the wide range of client wants and propelling the market’s continued expansion.

Segmentation by Product Type

  • By product type, dropper bottles are the market leader. These containers exist in a variety of sizes, materials, and designs to meet the needs of diverse industries and product requirements. They are specifically made to carry liquids and have an integrated dropper assembly.
  • During the projected period, the dropper pipettes category is anticipated to exhibit a sizable CAGR. Dropper pipettes are a crucial part of the dropper system market because they provide precise and controlled dispensing of liquids in a variety of applications and industries. They are crucial tools for delivering liquids to end users safely and effectively because of their accuracy, adaptability, and customizability.
  • Other product types, such as dropper caps and closures, also contribute to the demand for dropper systems.

Segmentation by Material Type

  • The main material type category is plastic droppers. Plastic droppers are intended to deliver accurate dosing of liquids by precise and controlled dispensing. When it comes to patient safety and treatment effectiveness, the correct medication dose is critical in sectors like pharmaceuticals and healthcare.
  • The glass droppers category is likely to register a significant CAGR during the period of forecasting. High-quality borosilicate glass is usually used to create glass droppers. Pharmaceuticals, essential oils, and fragrances can all be stored in this type of glass because of its long lifespan, chemical resistance, and inertness. Additionally, it is less likely to react with the contents of the dropper bottle, preserving the integrity of the final product.
  • Other material types, such as rubber bulbs and components, also contribute to the demand for dropper systems.

Segmentation by Application

  • The category for pharmaceuticals is anticipated to experience the highest CAGR during the projection period. Dropper systems are frequently used in the pharmaceutical industry to precisely dispense and dose liquid drugs. To ensure their effectiveness and safety, many drugs, especially those for oral, ophthalmic (eye), otic (ear), and nasal administration, require precise doses.
  • Other applications, such as cosmetics and skincare, food and beverages, chemical and laboratory, and e-liquids and vaping, also contribute to the demand for dropper systems.

Segmentation by Capacity

  • During the projection period, the micro droppers are likely to have the highest CAGR. Micro droppers are designed to disperse liquid in incredibly minute amounts, frequently in microliters (L) or even nanoliters (nL). This accuracy is crucial for applications like medication formulation, analytical chemistry, and diagnostic testing, where even minute dosage fluctuations can have a big impact on results.
  • Other capacities, such as standard droppers and large droppers, also contribute to the demand for dropper systems.

Segmentation by Closure Type

  • Child-resistant closures will be expected to have the foremost CAGR during the prediction period. Child-resistant closures, or CRCs as they are frequently referred to, are security measures intended to keep young children from having easy access to potentially toxic compounds kept in containers, particularly dropper bottles in the market for dropper systems.
  • Other closure types, such as tamper-evident closures, screw caps, and push button closures, also contribute to the demand for dropper systems.

Segmentation by End User

  • Throughout the forecast duration, the category for the pharmaceutical and healthcare industry is anticipated to have the greatest CAGR. Dropper systems are widely used in the pharmaceutical and healthcare industries to deliver pharmaceuticals to elderly and young patients, as well as other vulnerable groups. Pediatric and geriatric patients both benefit greatly from the exact dosage management that dropper systems offer.
  • The need for dropper systems is also influenced by other end user, such as cosmetic and personal care industry, food and beverage industry, chemical and laboratory applications, and e-liquid manufacturers.

Segmentation by Distribution channel

  • The highest CAGR is anticipated for direct sales throughout estimation. Manufacturers or sellers of dropper systems establish direct connections with end users, who might be corporate entities, nonprofits, or private individuals. As a result, businesses are better able to cater their product offers and provide better customer service by having a deeper grasp of the wants and preferences of their customers.
  • Other distribution channels, such as retail, wholesalers and distributors, also contribute to the demand for dropper systems.

Segmentation by Region

  • The dropper system market was led by Asia Pacific. In the Asia Pacific market, smart packaging that uses RFID or NFC for tracking and authentication is one example of how technology is being integrated into dropper systems.
  • Europe is estimated to rank second in terms of market size for dropper systems.
  • North America will witness the most rapid growth in the dropper system market.
  • The rest of the world, including Latin America, the Middle East, and Africa, meets the rest of the dropper system demand.

The expansion of the dropper system market is being propelled by the pharmaceutical and healthcare sector, cosmetics and personal care industry, food and beverage sector, and evolving consumer preferences. Products, including serums, essential oils, and skincare solutions, are frequently utilized in dropper systems in the cosmetics and personal care sector. This industry promotes demand for cutting-edge and visually pleasing dropper systems due to the growing emphasis on personal grooming and beauty.

During the time of forecasting, Asia Pacific will probably rule the dropper system market. Dropper systems are frequently utilized in the Asia Pacific region for otic and ophthalmic applications. The industry for dropper systems used in these applications has been expanding gradually as people become more aware of the need to maintain good eye and ear conditions.

China has seen particularly significant growth in the color cosmetics and fragrances sector, which has led to more premium sales and improved products. Additionally, the development of China’s e-commerce market, social media, and digitization have been driving Chinese customers to purchase more beauty items. Dropper system sales are benefiting from this as they are now perfect ingredients for a variety of cosmetic and personal care products.

The North American area is projected to show the fastest growth throughout the forecast time frame. The region’s market is likely to rise as a result of the region’s booming industries, technological prowess, consumer tastes, and dedication to quality and innovation; the North American dropper system market is positioned for rapid growth.

Manufacturers in the market for droppers are expanding their research efforts to create unique technologies that aid in creating patient-centric dropper designs.

Key Highlights of the Report

The global dropper system market is segmented by product type, material type, application, capacity, end user, closure type, distribution channel, and region. As far as the product type is concerned, dropper bottles are the market spearhead. The plastic dropper is the top material type segment. During the forecast period, the pharmaceuticals category is expected to grow at the highest CAGR. The type of micro droppers is anticipated to experience the highest CAGR during the forecast period. Asia Pacific is driving the dropper system market growth.

The growing attention to appearance, particularly in terms of hair, skin, and beauty care treatments, is driving the dropper system market’s growth in terms of cosmetic and beauty care product consumption. Cosmetic droppers are used for massage oils and essential oils, allowing for simple and accurate oil distribution while reducing oil consumption and waste. Cosmetic droppers were deemed by beauty salons and beauty care professionals to be the ideal option for makeup and cosmetic procedures.

However, according to forecasts, Asia Pacific will hold the largest share of the market for dropper systems globally. Because of the growing consumer tendency toward personal care and beauty care products, Asia Pacific is the largest market for cosmetic droppers. The rising popularity of men’s grooming products in China and the rising preference for makeup during festivals, parties, and gatherings may both contribute to the market’s expansion. Additionally, the North American region is assumed to have the market’s sharpest growth. Dropper systems are frequently used in high-end alcoholic beverages, which opens up possibilities for personalized designs in the North American market.

Which Key Factors Are Driving The Global Dropper System Market?

The drivers propelling the growth of the dropper system industry are nutraceuticals, dietary supplements, and direct-to-consumer sales, as well as sustainability and eco-friendliness.

What Are The Key Challenges In The Global Market For Dropper system?

Stringent regulatory requirements, high manufacturing costs, and commodity price fluctuations are some of the challenges hindering the growth of the market for dropper systems.

What Market Opportunities Exist For the Dropper System Globally?

Global market potential for dropper systems includes direct-to-consumer (DTC) sales and e-commerce. The market will benefit from continuous research into the effectiveness of the dropper system for various medical uses, which may lead to new uses and treatment regimens.

Market Drivers

Several factors influence the market for dropper systems globally. The main factors influencing the market for dropper systems globally are as follows:

Growing Prominence of Online Shopping

Due to the introduction of online distribution of goods, there is an increase in sales of homecare products, particularly droppers. The key benefit of using online distribution channels is that they provide a vast selection of dropper items from various brands that cater to a wide range of customer segments.

Additionally, internet shopping platforms that offer individualized shopping assistance and product recommendations based on the application are becoming more and more popular for buying droppers. Furthermore, internet shoppers can research and contrast various droppers due to e-commerce sites. As a result, these variables are having a favorable effect on the market, which will encourage its expansion over the forecast period.

Market Restraints

Several challenges could prevent the expansion of the global market for dropper systems. Among them are the following:

Increasing Waste Generation and Emissions

Growing waste generation and emissions is limiting the dropper system market growth because it can lead to environmental concerns, regulatory scrutiny, and increased costs for businesses. Droppers are typically made of plastic or glass, which are both non-biodegradable materials. When droppers are disposed of in landfills, they can take hundreds of years to decompose. Additionally, the production and transportation of droppers requires energy, which contributes to greenhouse gas emissions.

Businesses in the dropper system market may also face increased costs due to the need to comply with environmental regulations. For example, they may need to invest in new technologies or equipment to reduce their waste and emissions. Additionally, they may need to pay higher fees for waste disposal or carbon emissions. The dropper system market needs to find ways to reduce its environmental impact in order to mitigate the risks associated with increasing waste generation and emissions. This can be done by using more sustainable materials, developing more efficient manufacturing processes, and reducing the amount of packaging used.

Opportunities

The global market for dropper systems presents significant potential opportunities. The following is an example of these:

Biotechnology and Precision Medicine Advancements

The dropper system market is seeing a number of opportunities due to developments in precision medicine and biotechnology. These advancements are increasing the necessity for extremely accurate and specialized dropper systems, especially in the biotechnology, pharmaceutical, and healthcare industries. Customizing medical care for each patient according to their genetic composition, medical history, and unique illness features is known as precision medicine. Dropper systems can be modified to deliver exact dosages and compositions for customized treatments, necessitating highly adjustable medication delivery systems. The acquisition, preservation, and retrieval of biological samples are frequently required in precision medicine applications and research. Dropper systems are used in biobanks to provide precise and secure sample transfers.

Competitive Landscape

Key Players

The global market for dropper systems is very competitive, with many powerful players. Some of the leading market participants and their corresponding market shares are listed below:

  • HCP Packaging Co. Ltd
  • Albéa Group
  • Quadpack SA
  • HEIM Pharma Tropfsysteme GmbH
  • Paramark Corporation
  • Cosmetic Specialties International, LLC
  • Carow Packaging Inc.
  • RTN Applicator Company LLC
  • Guangzhou Jiaxing Glass Products Co. Ltd
  • Hangzhou Lecos Packaging Co., Ltd
  • Guangzhou YELLO Packaging Co., Ltd.
  • Bestpak Packaging Solutions, Inc.
  • Radcom Packaging Pvt Ltd
  • Taiwan K. K. Corp (COSJAR)
  • Others

These companies give mergers and acquisitions, expanding their distribution network, and developing new products a priority in order to remain competitive in the market.

The leading competitors in the global market for dropper systems are constantly looking for ways to get an advantage by releasing new items and advancements.

In April 2023, A new 100% sustainable mono-material dropper called the Eco Dropper has been introduced by Lumson Spa.

In March 2023, The acquisition of iD SCENT, a provider of comprehensive paper fragrance sample systems with numerous sustainability features, was announced by Aptar Group Inc.

Shape Your Report to Specific Countries or Regions & Enjoy 30% Off!

Summary of Key Findings

  • The market for dropper systems is seeing an increase in the importance of e-commerce. Dropper system goods are increasingly being bought online by patients since e-commerce is convenient and affordable.
  • Market segmented by product type, material type, application, capacity, end user, closure type, distribution channel, and region.
  • A product type that is leading the market is dropper bottles.
  • The most ubiquitous material type fragment is plastic droppers.
  • In terms of CAGR, pharmaceuticals are expected to grow at the fastest rate during the forecast period.
  • The category for child-resistant closures will likely see the highest CAGR during the anticipated time frame.
  • Asia Pacific is leading market development; the market is highly competitive with key players including HCP Packaging Co. Ltd, Albéa Group, Quadpack SA, HEIM Pharma Tropfsysteme GmbH, Paramark Corporation, Cosmetic Specialties International, LLC, Carow Packaging Inc., RTN Applicator Company LLC, Guangzhou Jiaxing Glass Products Co. Ltd, Hangzhou Lecos packaging Co., Ltd, Guangzhou YELLO Packaging Co., Ltd., Bestpak Packaging Solutions, Inc., Radcom Packaging Pvt Ltd, Taiwan K. K. Corp (COSJAR), and others.

Future Outlook

  • Optimistic viewpoint for the global dropper system market with noteworthy growth potential in the Asia Pacific region.
  • One of the major factors supporting the growth of the dropper system market is the innovation in dropper system design.
  • Concerns about product quality and safety may be a significant barrier to the market’s expansion in the near future.
  • Foremost companies must concentrate on product innovation, expanding their market reach, and maintaining competitive pricing to stay ahead.

Segmentation

  • By Product Type
    • Dropper Bottles
    • Dropper Pipettes
    • Dropper Caps and Closures
  • By Material Type
    • Glass Droppers
    • Plastic Droppers
    • Rubber Bulbs and Components
  • By Application
    • Pharmaceuticals
    • Cosmetics and Skincare
    • Food and Beverages
    • Chemical and Laboratory
    • E-liquids and Vaping
  • By Capacity
    • Micro Droppers
    • Standard Droppers
    • Large Droppers
  • By Closure Type
    • Child-Resistant Closures
    • Tamper-Evident Closures
    • Screw Caps
    • Push Button Closures
  • By End User
    • Pharmaceutical and Healthcare Industry
    • Cosmetic and Personal Care Industry
    • Food and Beverage Industry
    • Chemical and Laboratory Applications
    • E-liquid Manufacturers
  • By Distribution channel
    • Direct Sales
    • Retail
    • Wholesalers and Distributors
  • By Region
    • North America
      • The US.
      • Canada
      • Mexico
    • Europe
      • Germany
      • France
      • The U.K.
      • Italy
      • Spain
      • Rest of Europe
    • Asia Pacific
      • China
      • Japan
      • India
      • South Korea
      • South-east Asia
      • Rest of Asia Pacific
    • Latin America
      • Brazil
      • Argentina
      • Rest of Latin America
    • Middle East & Africa
      • GCC Countries
      • South Africa
      • Rest of the Middle East and Africa

Adjacent Markets

There are several related markets in the dropper system industry with significant potential for revenue growth. The major markets adjacent to the dropper system market –

1. Preface
1.1. Report Description
1.1.1. Purpose of the Report
1.1.2. Target Audience
1.1.3. USP and Key Offerings
1.2. Research Scope
1.3. Market Introduction

2. Executive Summary
2.1. Market Snapshot: Global Dropper System Market
2.1.1. Global Dropper System Market, By Product Type
2.1.2. Global Dropper System Market, By Material Type
2.1.3. Global Dropper System Market, By Application
2.1.4. Global Dropper System Market, By Capacity
2.1.5. Global Dropper System Market, By Closure Type
2.1.6. Global Dropper System Market, By End User
2.1.7. Global Dropper System Market, By Distribution Channel
2.1.8. Global Dropper System Market, By Region
2.2. Insights from Primary Respondents

3. Market Dynamics & Factors Analysis
3.1. Introduction
3.1.1. Global Dropper System Market Value, 2017-2030, (US$ Mn)
3.1.2. Y-o-Y Growth Trend Analysis
3.2. Market Dynamics
3.2.1. Dropper System Market Drivers
3.2.2. Dropper System Market Restraints
3.2.3. Dropper System Market Opportunities
3.2.4. Major Dropper System Industry Challenges
3.3. Growth and Development Patterns
3.4. Investment Feasibility Analysis
3.5. Market Opportunity Analysis
3.5.1. Product Type
3.5.2. Material Type
3.5.3. Application
3.5.4. Capacity
3.5.5. Closure Type
3.5.6. End User
3.5.7. Distribution Channel
3.5.8. Geography

4. Market Competitive Landscape Analysis
4.1. Company Market Share Analysis, 2022
4.1.1. Global Dropper System Market: Company Market Share, Value 2022
4.1.2. Global Dropper System Market: Top 6 Company Market Share, Value 2022
4.1.3. Global Dropper System Market: Top 3 Company Market Share, Value 2022
4.2. Global Dropper System Market: Company Revenue Share Analysis, 2022
4.3. Company Assessment Metrics, 2022
4.3.1. Stars
4.3.2. Emerging Leaders
4.3.3. Pervasive Players
4.3.4. Participants
4.4. Startups/ SMEs Assessment Metrics, 2022
4.4.1. Progressive Companies
4.4.2. Responsive Companies
4.4.3. Dynamic Companies
4.4.4. Starting Blocks
4.5. Strategic Development
4.5.1. Acquisition and Mergers
4.5.2. New Product Launch
4.5.3. Regional Expansion
4.5.4. Partnerships
4.6. Key Player Product Matrix
4.7. Potential for New Players in the Global Dropper System Market

5. Premium Insights
5.1. STAR (Situation, Task, Action, Results) Analysis
5.2. Porter’s Five Forces Analysis
5.2.1. Threat of New Entrants
5.2.2. Bargaining Power of Buyers/Consumers
5.2.3. Bargaining Power of Suppliers
5.2.4. Threat of Substitute Types
5.2.5. Intensity of Competitive Rivalry
5.3. PESTEL Analysis
5.3.1. Political Factors
5.3.2. Economic Factors
5.3.3. Social Factors
5.3.4. Technological Factors
5.3.5. Environmental Factors
5.3.6. Legal Factors
5.4. Key Market Trends
5.4.1. Demand Side Trends
5.4.2. Supply Side Trends
5.5. Value Chain Analysis
5.6. Technology Analysis
5.6.1. Research and development in the global market
5.6.2. Patent Analysis
5.6.3. Emerging technologies and their potential disruption to the market
5.7. Consumer Behaviour Analysis
5.7.1. Consumer Preferences and Expectations
5.7.2. Factors Influencing Consumer Buying Decisions
5.7.2.1. North America
5.7.2.2. Europe
5.7.2.3. Asia Pacific
5.7.2.4. Latin America
5.7.2.5. Middle East and Africa
5.7.3. Consumer Pain Points
5.8. Analysis and Recommendations
5.9. Adjacent Market Analysis

6. Market Positioning of Key Players, 2022
6.1. Company market share of key players, 2022
6.2. Competitive Benchmarking
6.3. Market Positioning of Key Vendors
6.4. Geographical Presence Analysis
6.5. Major Strategies Adopted by Key Players
6.5.1. Key Strategies Analysis
6.5.2. Mergers and Acquisitions
6.5.3. Partnerships
6.5.4. Product Launch
6.5.5. Geographical Expansion
6.5.6. Others

7. Impact Analysis of COVID 19 and Russia – Ukraine War on Dropper System Market
7.1. Ukraine-Russia War Impact
7.1.1. Uncertainty and Economic Instability
7.1.2. Supply chain disruptions
7.1.3. Regional market shifts
7.1.4. Shift in government priorities
7.2. COVID-19 Impact Analysis
7.2.1. Supply Chain Disruptions
7.2.2. Demand Fluctuations
7.2.3. Shift in Product Mix
7.2.4. Reduced Industrial Activity
7.2.5. Regional Impact Analysis
7.2.5.1. North America
7.2.5.2. Europe
7.2.5.3. Asia Pacific
7.2.5.4. Latin America
7.2.5.5. Middle East and Africa

8. Global Dropper System Market, By Product Type
8.1. Global Dropper System Market Overview, by Product Type
8.1.1. Global Dropper System Market Revenue Share, By Product Type, 2022 Vs 2030 (in %)
8.2. Dropper Bottles
8.2.1. Global Dropper System Market, By Dropper Bottles, By Region, 2017-2030 (US$ Mn)
8.2.2. Market Dynamics for Dropper Bottles
8.2.2.1. Drivers
8.2.2.2. Restraints
8.2.2.3. Opportunities
8.2.2.4. Trends
8.3. Dropper Pipettes
8.3.1. Global Dropper System Market, By Dropper Pipettes, By Region, 2017-2030 (US$ Mn)
8.3.2. Market Dynamics for Dropper Pipettes
8.3.2.1. Drivers
8.3.2.2. Restraints
8.3.2.3. Opportunities
8.3.2.4. Trends
8.4. Dropper Caps and Closures
8.4.1. Global Dropper System Market, By Dropper Caps and Closures, By Region, 2017-2030 (US$ Mn)
8.4.2. Market Dynamics for Dropper Caps and Closures
8.4.2.1. Drivers
8.4.2.2. Restraints
8.4.2.3. Opportunities
8.4.2.4. Trends

9. Global Dropper System Market, By Material Type
9.1. Global Dropper System Market Overview, by Material Type
9.1.1. Global Dropper System Market Revenue Share, By Material Type, 2022 Vs 2030 (in %)
9.2. Glass Droppers
9.2.1. Global Dropper System Market, By Glass Droppers, By Region, 2017-2030 (US$ Mn)
9.2.2. Market Dynamics for Glass Droppers
9.2.2.1. Drivers
9.2.2.2. Restraints
9.2.2.3. Opportunities
9.2.2.4. Trends
9.3. Plastic Droppers
9.3.1. Global Dropper System Market, By Plastic Droppers, By Region, 2017-2030 (US$ Mn)
9.3.2. Market Dynamics for Plastic Droppers
9.3.2.1. Drivers
9.3.2.2. Restraints
9.3.2.3. Opportunities
9.3.2.4. Trends
9.4. Rubber Bulbs and Components
9.4.1. Global Dropper System Market, By Rubber Bulbs and Components, By Region, 2017-2030 (US$ Mn)
9.4.2. Market Dynamics for Rubber Bulbs and Components
9.4.2.1. Drivers
9.4.2.2. Restraints
9.4.2.3. Opportunities
9.4.2.4. Trends

10. Global Dropper System Market, By Application
10.1. Global Dropper System Market Overview, by Application
10.1.1. Global Dropper System Market Revenue Share, By Application, 2022 Vs 2030 (in %)
10.2. Pharmaceuticals
10.2.1. Global Dropper System Market, By Pharmaceuticals, By Region, 2017-2030 (US$ Mn)
10.2.2. Market Dynamics for Pharmaceuticals
10.2.2.1. Drivers
10.2.2.2. Restraints
10.2.2.3. Opportunities
10.2.2.4. Trends
10.3. Cosmetics and Skincare
10.3.1. Global Dropper System Market, By Cosmetics and Skincare, By Region, 2017-2030 (US$ Mn)
10.3.2. Market Dynamics for Cosmetics and Skincare
10.3.2.1. Drivers
10.3.2.2. Restraints
10.3.2.3. Opportunities
10.3.2.4. Trends
10.4. Food and Beverages
10.4.1. Global Dropper System Market, By Food and Beverages, By Region, 2017-2030 (US$ Mn)
10.4.2. Market Dynamics for Food and Beverages
10.4.2.1. Drivers
10.4.2.2. Restraints
10.4.2.3. Opportunities
10.4.2.4. Trends
10.5. Chemical and Laboratory
10.5.1. Global Dropper System Market, By Chemical and Laboratory, By Region, 2017-2030 (US$ Mn)
10.5.2. Market Dynamics for Chemical and Laboratory
10.5.2.1. Drivers
10.5.2.2. Restraints
10.5.2.3. Opportunities
10.5.2.4. Trends
10.6. E-liquids and Vaping
10.6.1. Global Dropper System Market, By E-liquids and Vaping, By Region, 2017-2030 (US$ Mn)
10.6.2. Market Dynamics for E-liquids and Vaping
10.6.2.1. Drivers
10.6.2.2. Restraints
10.6.2.3. Opportunities
10.6.2.4. Trends

11. Global Dropper System Market, By Capacity
11.1. Global Dropper System Market Overview, by Capacity
11.1.1. Global Dropper System Market Revenue Share, By Capacity, 2022 Vs 2030 (in %)
11.2. Micro Droppers
11.2.1. Global Dropper System Market, By Micro Droppers, By Region, 2017-2030 (US$ Mn)
11.2.2. Market Dynamics for Micro Droppers
11.2.2.1. Drivers
11.2.2.2. Restraints
11.2.2.3. Opportunities
11.2.2.4. Trends
11.3. Standard Droppers
11.3.1. Global Dropper System Market, By Standard Droppers, By Region, 2017-2030 (US$ Mn)
11.3.2. Market Dynamics for Standard Droppers
11.3.2.1. Drivers
11.3.2.2. Restraints
11.3.2.3. Opportunities
11.3.2.4. Trends
11.4. Large Droppers
11.4.1. Global Dropper System Market, By Large Droppers, By Region, 2017-2030 (US$ Mn)
11.4.2. Market Dynamics for Large Droppers
11.4.2.1. Drivers
11.4.2.2. Restraints
11.4.2.3. Opportunities
11.4.2.4. Trends

12. Global Dropper System Market, By Closure Type
12.1. Global Dropper System Market Overview, by Closure Type
12.1.1. Global Dropper System Market Revenue Share, By Closure Type, 2022 Vs 2030 (in %)
12.2. Child-Resistant Closures
12.2.1. Global Dropper System Market, By Child-Resistant Closures, By Region, 2017-2030 (US$ Mn)
12.2.2. Market Dynamics for Child-Resistant Closures
12.2.2.1. Drivers
12.2.2.2. Restraints
12.2.2.3. Opportunities
12.2.2.4. Trends
12.3. Tamper-Evident Closures
12.3.1. Global Dropper System Market, By Tamper-Evident Closures, By Region, 2017-2030 (US$ Mn)
12.3.2. Market Dynamics for Tamper-Evident Closures
12.3.2.1. Drivers
12.3.2.2. Restraints
12.3.2.3. Opportunities
12.3.2.4. Trends
12.4. Screw Caps
12.4.1. Global Dropper System Market, By Screw Caps, By Region, 2017-2030 (US$ Mn)
12.4.2. Market Dynamics for Screw Caps
12.4.2.1. Drivers
12.4.2.2. Restraints
12.4.2.3. Opportunities
12.4.2.4. Trends
12.5. Push Button Closures
12.5.1. Global Dropper System Market, By Push Button Closures, By Region, 2017-2030 (US$ Mn)
12.5.2. Market Dynamics for Push Button Closures
12.5.2.1. Drivers
12.5.2.2. Restraints
12.5.2.3. Opportunities
12.5.2.4. Trends

13. Global Dropper System Market, By End User
13.1. Global Dropper System Market Overview, by End User
13.1.1. Global Dropper System Market Revenue Share, By End User, 2022 Vs 2030 (in %)
13.2. Pharmaceutical and Healthcare Industry
13.2.1. Global Dropper System Market, By Pharmaceutical and Healthcare Industry, By Region, 2017-2030 (US$ Mn)
13.2.2. Market Dynamics for Pharmaceutical and Healthcare Industry
13.2.2.1. Drivers
13.2.2.2. Restraints
13.2.2.3. Opportunities
13.2.2.4. Trends
13.3. Cosmetic and Personal Care Industry
13.3.1. Global Dropper System Market, By Cosmetic and Personal Care Industry, By Region, 2017-2030 (US$ Mn)
13.3.2. Market Dynamics for Cosmetic and Personal Care Industry
13.3.2.1. Drivers
13.3.2.2. Restraints
13.3.2.3. Opportunities
13.3.2.4. Trends
13.4. Food and Beverage Industry
13.4.1. Global Dropper System Market, By Food and Beverage Industry, By Region, 2017-2030 (US$ Mn)
13.4.2. Market Dynamics for Food and Beverage Industry
13.4.2.1. Drivers
13.4.2.2. Restraints
13.4.2.3. Opportunities
13.4.2.4. Trends
13.5. Chemical and Laboratory Applications
13.5.1. Global Dropper System Market, By Chemical and Laboratory Applications, By Region, 2017-2030 (US$ Mn)
13.5.2. Market Dynamics for Chemical and Laboratory Applications
13.5.2.1. Drivers
13.5.2.2. Restraints
13.5.2.3. Opportunities
13.5.2.4. Trends
13.6. E-liquid Manufacturers
13.6.1. Global Dropper System Market, By E-liquid Manufacturers, By Region, 2017-2030 (US$ Mn)
13.6.2. Market Dynamics for E-liquid Manufacturers
13.6.2.1. Drivers
13.6.2.2. Restraints
13.6.2.3. Opportunities
13.6.2.4. Trends

14. Global Dropper System Market, By Distribution Channel
14.1. Global Dropper System Market Overview, by Distribution Channel
14.1.1. Global Dropper System Market Revenue Share, By Distribution Channel, 2022 Vs 2030 (in %)
14.2. Direct Sales
14.2.1. Global Dropper System Market, By Direct Sales, By Region, 2017-2030 (US$ Mn)
14.2.2. Market Dynamics for Direct Sales
14.2.2.1. Drivers
14.2.2.2. Restraints
14.2.2.3. Opportunities
14.2.2.4. Trends
14.3. Retail
14.3.1. Global Dropper System Market, By Retail, By Region, 2017-2030 (US$ Mn)
14.3.2. Market Dynamics for Retail
14.3.2.1. Drivers
14.3.2.2. Restraints
14.3.2.3. Opportunities
14.3.2.4. Trends
14.4. Wholesalers and Distributors
14.4.1. Global Dropper System Market, By Wholesalers and Distributors, By Region, 2017-2030 (US$ Mn)
14.4.2. Market Dynamics for Wholesalers and Distributors
14.4.2.1. Drivers
14.4.2.2. Restraints
14.4.2.3. Opportunities
14.4.2.4. Trends

15. Global Dropper System Market, By Region
15.1. Global Dropper System Market Overview, by Region
15.1.1. Global Dropper System Market, By Region, 2022 vs 2030 (in%)
15.2. Product Type
15.2.1. Global Dropper System Market, By Product Type, 2017-2030 (US$ Mn)
15.3. Material Type
15.3.1. Global Dropper System Market, By Material Type, 2017-2030 (US$ Mn)
15.4. Application
15.4.1. Global Dropper System Market, By Application, 2017-2030 (US$ Mn)
15.5. Capacity
15.5.1. Global Dropper System Market, By Capacity, 2017-2030 (US$ Mn)
15.6. Closure Type
15.6.1. Global Dropper System Market, By Closure Type, 2017-2030 (US$ Mn)
15.7. End User
15.7.1. Global Dropper System Market, By End User, 2017-2030 (US$ Mn)
15.8. Distribution Channel
15.8.1. Global Dropper System Market, By Distribution Channel, 2017-2030 (US$ Mn)

16. North America Dropper System Market Analysis
16.1. Overview
16.1.1. Market Dynamics for North America
16.1.1.1. Drivers
16.1.1.2. Restraints
16.1.1.3. Opportunities
16.1.1.4. Trends
16.2. North America Dropper System Market, by Product Type, 2017-2030(US$ Mn)
16.2.1. Overview
16.2.2. SRC Analysis
16.3. North America Dropper System Market, by Material Type, 2017-2030(US$ Mn)
16.3.1. Overview
16.3.2. SRC Analysis
16.4. North America Dropper System Market, by Application, 2017-2030(US$ Mn)
16.4.1. Overview
16.4.2. SRC Analysis
16.5. North America Dropper System Market, by Capacity, 2017-2030(US$ Mn)
16.5.1. Overview
16.5.2. SRC Analysis
16.6. North America Dropper System Market, by Closure Type, 2017-2030(US$ Mn)
16.6.1. Overview
16.6.2. SRC Analysis
16.7. North America Dropper System Market, by End User, 2017-2030(US$ Mn)
16.7.1. Overview
16.7.2. SRC Analysis
16.8. North America Dropper System Market, by Distribution Channel, 2017-2030(US$ Mn)
16.8.1. Overview
16.8.2. SRC Analysis
16.9. North America Dropper System Market, by Country, 2017-2030 (US$ Mn)
16.9.1. North America Dropper System Market, by Country, 2022 Vs 2030 (in%)
16.9.2. U.S.
16.9.3. Canada
16.9.4. Mexico

17. Europe Dropper System Market Analysis
17.1. Overview
17.1.1. Market Dynamics for Europe
17.1.1.1. Drivers
17.1.1.2. Restraints
17.1.1.3. Opportunities
17.1.1.4. Trends
17.2. Europe Dropper System Market, by Product Type, 2017-2030(US$ Mn)
17.2.1. Overview
17.2.2. SRC Analysis
17.3. Europe Dropper System Market, by Material Type, 2017-2030(US$ Mn)
17.3.1. Overview
17.3.2. SRC Analysis
17.4. Europe Dropper System Market, by Application, 2017-2030(US$ Mn)
17.4.1. Overview
17.4.2. SRC Analysis
17.5. Europe Dropper System Market, by Capacity, 2017-2030(US$ Mn)
17.5.1. Overview
17.5.2. SRC Analysis
17.6. Europe Dropper System Market, by Closure Type, 2017-2030(US$ Mn)
17.6.1. Overview
17.6.2. SRC Analysis
17.7. Europe Dropper System Market, by End User, 2017-2030(US$ Mn)
17.7.1. Overview
17.7.2. SRC Analysis
17.8. Europe Dropper System Market, by Distribution Channel, 2017-2030(US$ Mn)
17.8.1. Overview
17.8.2. SRC Analysis
17.9. Europe Dropper System Market, by Country, 2017-2030 (US$ Mn)
17.9.1. Europe Dropper System Market, by Country, 2022 Vs 2030 (in%)
17.9.2. UK
17.9.3. France
17.9.4. Germany
17.9.5. Italy
17.9.6. Spain
17.9.7. Benelux
17.9.8. Russia
17.9.9. Rest of Europe

18. Asia Pacific Dropper System Market Analysis
18.1. Overview
18.1.1. Market Dynamics for Asia Pacific
18.1.1.1. Drivers
18.1.1.2. Restraints
18.1.1.3. Opportunities
18.1.1.4. Trends
18.2. Asia Pacific Dropper System Market, by Product Type, 2017-2030(US$ Mn)
18.2.1. Overview
18.2.2. SRC Analysis
18.3. Asia Pacific Dropper System Market, by Material Type, 2017-2030(US$ Mn)
18.3.1. Overview
18.3.2. SRC Analysis
18.4. Asia Pacific Dropper System Market, by Application, 2017-2030(US$ Mn)
18.4.1. Overview
18.4.2. SRC Analysis
18.5. Asia Pacific Dropper System Market, by Capacity, 2017-2030(US$ Mn)
18.5.1. Overview
18.5.2. SRC Analysis
18.6. Asia Pacific Dropper System Market, by Closure Type, 2017-2030(US$ Mn)
18.6.1. Overview
18.6.2. SRC Analysis
18.7. Asia Pacific Dropper System Market, by End User, 2017-2030(US$ Mn)
18.7.1. Overview
18.7.2. SRC Analysis
18.8. Asia Pacific Dropper System Market, by Distribution Channel, 2017-2030(US$ Mn)
18.8.1. Overview
18.8.2. SRC Analysis
18.9. Asia Pacific Dropper System Market, by Country, 2017-2030 (US$ Mn)
18.9.1. Asia Pacific Dropper System Market, by Country, 2022 Vs 2030 (in%)
18.9.2. China
18.9.3. Japan
18.9.4. India
18.9.5. South Korea
18.9.6. South East Asia
18.9.7. Rest of Asia Pacific

19. Latin America Dropper System Market Analysis
19.1. Overview
19.1.1. Market Dynamics for Latin America
19.1.1.1. Drivers
19.1.1.2. Restraints
19.1.1.3. Opportunities
19.1.1.4. Trends
19.2. Latin America Dropper System Market, by Product Type, 2017-2030(US$ Mn)
19.2.1. Overview
19.2.2. SRC Analysis
19.3. Latin America Dropper System Market, by Material Type, 2017-2030(US$ Mn)
19.3.1. Overview
19.3.2. SRC Analysis
19.4. Latin America Dropper System Market, by Application, 2017-2030(US$ Mn)
19.4.1. Overview
19.4.2. SRC Analysis
19.5. Latin America Dropper System Market, by Capacity, 2017-2030(US$ Mn)
19.5.1. Overview
19.5.2. SRC Analysis
19.6. Latin America Dropper System Market, by Closure Type, 2017-2030(US$ Mn)
19.6.1. Overview
19.6.2. SRC Analysis
19.7. Latin America Dropper System Market, by End User, 2017-2030(US$ Mn)
19.7.1. Overview
19.7.2. SRC Analysis
19.8. Latin America Dropper System Market, by Distribution Channel, 2017-2030(US$ Mn)
19.8.1. Overview
19.8.2. SRC Analysis
19.9. Latin America Dropper System Market, by Country, 2017-2030 (US$ Mn)
19.9.1. Latin America Dropper System Market, by Country, 2022 Vs 2030 (in%)
19.9.2. Brazil
19.9.3. Argentina
19.9.4. Rest of Latin America

20. Middle East Dropper System Market Analysis
20.1. Overview
20.1.1. Market Dynamics for Middle East
20.1.1.1. Drivers
20.1.1.2. Restraints
20.1.1.3. Opportunities
20.1.1.4. Trends
20.2. Middle East Dropper System Market, by Product Type, 2017-2030(US$ Mn)
20.2.1. Overview
20.2.2. SRC Analysis
20.3. Middle East Dropper System Market, by Material Type, 2017-2030(US$ Mn)
20.3.1. Overview
20.3.2. SRC Analysis
20.4. Middle East Dropper System Market, by Application, 2017-2030(US$ Mn)
20.4.1. Overview
20.4.2. SRC Analysis
20.5. Middle East Dropper System Market, by Capacity, 2017-2030(US$ Mn)
20.5.1. Overview
20.5.2. SRC Analysis
20.6. Middle East Dropper System Market, by Closure Type, 2017-2030(US$ Mn)
20.6.1. Overview
20.6.2. SRC Analysis
20.7. Middle East Dropper System Market, by End User, 2017-2030(US$ Mn)
20.7.1. Overview
20.7.2. SRC Analysis
20.8. Middle East Dropper System Market, by Distribution Channel, 2017-2030(US$ Mn)
20.8.1. Overview
20.8.2. SRC Analysis
20.9. Middle East Dropper System Market, by Country, 2017-2030 (US$ Mn)
20.9.1. Middle East Dropper System Market, by Country, 2022 Vs 2030 (in%)
20.9.2. UAE
20.9.3. Saudi Arabia
20.9.4. Rest of Middle East

21. Africa Dropper System Market Analysis
21.1. Overview
21.1.1. Market Dynamics for Africa
21.1.1.1. Drivers
21.1.1.2. Restraints
21.1.1.3. Opportunities
21.1.1.4. Trends
21.2. Africa Dropper System Market, by Product Type, 2017-2030(US$ Mn)
21.2.1. Overview
21.2.2. SRC Analysis
21.3. Africa Dropper System Market, by Material Type, 2017-2030(US$ Mn)
21.3.1. Overview
21.3.2. SRC Analysis
21.4. Africa Dropper System Market, by Application, 2017-2030(US$ Mn)
21.4.1. Overview
21.4.2. SRC Analysis
21.5. Africa Dropper System Market, by Capacity, 2017-2030(US$ Mn)
21.5.1. Overview
21.5.2. SRC Analysis
21.6. Africa Dropper System Market, by Closure Type, 2017-2030(US$ Mn)
21.6.1. Overview
21.6.2. SRC Analysis
21.7. Africa Dropper System Market, by End User, 2017-2030(US$ Mn)
21.7.1. Overview
21.7.2. SRC Analysis
21.8. Africa Dropper System Market, by Distribution Channel, 2017-2030(US$ Mn)
21.8.1. Overview
21.8.2. SRC Analysis
21.9. Africa Dropper System Market, by Country, 2017-2030 (US$ Mn)
21.9.1. Africa Dropper System Market, by Country, 2022 Vs 2030 (in%)
21.9.2. South Africa
21.9.3. Egypt
21.9.4. Rest of Africa

22. Company Profiles
22.1. HCP Packaging Co. Ltd
22.1.1. Company Overview
22.1.2. Products/Services Portfolio
22.1.3. Geographical Presence
22.1.4. SWOT Analysis
22.1.5. Financial Summary
22.1.5.1. Market Revenue and Net Profit (2019-2022)
22.1.5.2. Business Segment Revenue Analysis
22.1.5.3. Geographical Revenue Analysis
22.2. Albéa Group
22.3. Quadpack SA
22.4. HEIM Pharma Tropfsysteme GmbH
22.5. Paramark Corporation
22.6. Cosmetic Specialties International, LLC
22.7. Carow Packaging Inc.
22.8. RTN Applicator Company LLC
22.9. Guangzhou Jiaxing Glass Products Co. Ltd
22.10. Hangzhou Lecos packaging Co., Ltd
22.11. Guangzhou YELLO Packaging Co., Ltd.
22.12. Bestpak Packaging Solutions, Inc.
22.13. Radcom Packaging Pvt Ltd
22.14. Taiwan K. K. Corp (COSJAR)
22.15. Others
23. Research Methodology
23.1. Research Methodology
23.2. Phase I – Secondary Research
23.3. Phase II – Data Modelling
23.3.1. Company Share Analysis Model
23.3.2. Revenue Based Modelling
23.4. Phase III – Primary Research
23.5. Research Limitations
23.5.1. Assumptions

List of Figures
FIG. 1 Global Dropper System Market: Research Methodology
FIG. 2 Market Size Estimation – Top Down & Bottom up Approach
FIG. 3 Global Dropper System Market Segmentation
FIG. 4 Global Dropper System Market, by Product Type, 2022 (US$ Mn)
FIG. 5 Global Dropper System Market, by Material Type, 2022 (US$ Mn)
FIG. 6 Global Dropper System Market, by Application, 2022 (US$ Mn)
FIG. 7 Global Dropper System Market, by Capacity, 2022 (US$ Mn)
FIG. 8 Global Dropper System Market, by Closure Type, 2022 (US$ Mn)
FIG. 9 Global Dropper System Market, by End User, 2022 (US$ Mn)
FIG. 10 Global Dropper System Market, by Distribution Channel, 2022 (US$ Mn)
FIG. 11 Global Dropper System Market, by Geography, 2022 (US$ Mn)
FIG. 12 Attractive Investment Proposition, by Product Type, 2022
FIG. 13 Attractive Investment Proposition, by Material Type, 2022
FIG. 14 Attractive Investment Proposition, by Application, 2022
FIG. 15 Attractive Investment Proposition, by Capacity, 2022
FIG. 16 Attractive Investment Proposition, by Closure Type, 2022
FIG. 17 Attractive Investment Proposition, by End User, 2022
FIG. 18 Attractive Investment Proposition, by Distribution Channel, 2022
FIG. 19 Attractive Investment Proposition, by Geography, 2022
FIG. 20 Global Market Share Analysis of Key Dropper System Market Manufacturers, 2022
FIG. 21 Global Market Positioning of Key Dropper System Market Manufacturers, 2022
FIG. 22 Global Dropper System Market Value Contribution, By Product Type, 2022 & 2030 (Value %)
FIG. 23 Global Dropper System Market, by Dropper Bottles, Value, 2017-2030 (US$ Mn)
FIG. 24 Global Dropper System Market, by Dropper Pipettes, Value, 2017-2030 (US$ Mn)
FIG. 25 Global Dropper System Market, by Dropper Caps and Closures, Value, 2017-2030 (US$ Mn)
FIG. 26 Global Dropper System Market Value Contribution, By Material Type, 2022 & 2030 (Value %)
FIG. 27 Global Dropper System Market, by Glass Droppers, Value, 2017-2030 (US$ Mn)
FIG. 28 Global Dropper System Market, by Plastic Droppers, Value, 2017-2030 (US$ Mn)
FIG. 29 Global Dropper System Market, by Rubber Bulbs and Components, Value, 2017-2030 (US$ Mn)
FIG. 30 Global Dropper System Market Value Contribution, By Application, 2022 & 2030 (Value %)
FIG. 31 Global Dropper System Market, by Pharmaceuticals, Value, 2017-2030 (US$ Mn)
FIG. 32 Global Dropper System Market, by Cosmetics and Skincare, Value, 2017-2030 (US$ Mn)
FIG. 33 Global Dropper System Market, by Food and Beverages, Value, 2017-2030 (US$ Mn)
FIG. 34 Global Dropper System Market, by Chemical and Laboratory, Value, 2017-2030 (US$ Mn)
FIG. 35 Global Dropper System Market, by E-liquids and Vaping, Value, 2017-2030 (US$ Mn)
FIG. 36 Global Dropper System Market Value Contribution, By Capacity, 2022 & 2030 (Value %)
FIG. 37 Global Dropper System Market, by Micro Droppers, Value, 2017-2030 (US$ Mn)
FIG. 38 Global Dropper System Market, by Standard Droppers, Value, 2017-2030 (US$ Mn)
FIG. 39 Global Dropper System Market, by Large Droppers, Value, 2017-2030 (US$ Mn)
FIG. 40 Global Dropper System Market Value Contribution, By Closure Type, 2022 & 2030 (Value %)
FIG. 41 Global Dropper System Market, by Child-Resistant Closures, Value, 2017-2030 (US$ Mn)
FIG. 42 Global Dropper System Market, by Tamper-Evident Closures, Value, 2017-2030 (US$ Mn)
FIG. 43 Global Dropper System Market, by Screw Caps, Value, 2017-2030 (US$ Mn)
FIG. 44 Global Dropper System Market, by Push Button Closures, Value, 2017-2030 (US$ Mn)
FIG. 45 Global Dropper System Market Value Contribution, By End User, 2022 & 2030 (Value %)
FIG. 46 Global Dropper System Market, by Pharmaceutical and Healthcare Industry, Value, 2017-2030 (US$ Mn)
FIG. 47 Global Dropper System Market, by Cosmetic and Personal Care Industry, Value, 2017-2030 (US$ Mn)
FIG. 48 Global Dropper System Market, by Food and Beverage Industry, Value, 2017-2030 (US$ Mn)
FIG. 49 Global Dropper System Market, by Chemical and Laboratory Applications, Value, 2017-2030 (US$ Mn)
FIG. 50 Global Dropper System Market, by E-liquid Manufacturers, Value, 2017-2030 (US$ Mn)

FIG. 51 Global Dropper System Market Value Contribution, By Distribution Channel, 2022 & 2030 (Value %)
FIG. 52 Global Dropper System Market, by Direct Sales, Value, 2017-2030 (US$ Mn)
FIG. 53 Global Dropper System Market, by Retail, Value, 2017-2030 (US$ Mn)
FIG. 54 Global Dropper System Market, by Wholesalers and Distributors, Value, 2017-2030 (US$ Mn)
FIG. 55 North America Dropper System Market, 2017-2030 (US$ Mn)
FIG. 56 U.S. Dropper System Market, 2017-2030 (US$ Mn)
FIG. 57 Canada Dropper System Market, 2017-2030 (US$ Mn)
FIG. 58 Mexico Dropper System Market, 2017-2030 (US$ Mn)
FIG. 59 Europe Dropper System Market, 2017-2030 (US$ Mn)
FIG. 60 Germany Dropper System Market, 2017-2030 (US$ Mn)
FIG. 61 France Dropper System Market, 2017-2030 (US$ Mn)
FIG. 62 U.K. Dropper System Market, 2017-2030 (US$ Mn)
FIG. 63 Italy Dropper System Market, 2017-2030 (US$ Mn)
FIG. 64 Spain Dropper System Market, 2017-2030 (US$ Mn)
FIG. 65 Benelux Dropper System Market, 2017-2030 (US$ Mn)
FIG. 66 Russia Dropper System Market, 2017-2030 (US$ Mn)
FIG. 67 Rest of Europe Dropper System Market, 2017-2030 (US$ Mn)
FIG. 68 Asia Pacific Dropper System Market, 2017-2030 (US$ Mn)
FIG. 69 China Dropper System Market, 2017-2030 (US$ Mn)
FIG. 70 Japan Dropper System Market, 2017-2030 (US$ Mn)
FIG. 71 India Dropper System Market, 2017-2030 (US$ Mn)
FIG. 72 South Korea Dropper System Market, 2017-2030 (US$ Mn)
FIG. 73 South-East Asia Dropper System Market, 2017-2030 (US$ Mn)
FIG. 74 Rest of Asia Pacific Dropper System Market, 2017-2030 (US$ Mn)
FIG. 75 Latin America Dropper System Market, 2017-2030 (US$ Mn)
FIG. 76 Brazil Dropper System Market, 2017-2030 (US$ Mn)
FIG. 77 Argentina Dropper System Market, 2017-2030 (US$ Mn)
FIG. 78 Rest of Latin America Dropper System Market, 2017-2030 (US$ Mn)
FIG. 79 Middle East Dropper System Market, 2017-2030 (US$ Mn)
FIG. 80 UAE Dropper System Market, 2017-2030 (US$ Mn)
FIG. 81 Saudi Arabia Dropper System Market, 2017-2030 (US$ Mn)
FIG. 82 Rest of Middle East Dropper System Market, 2017-2030 (US$ Mn)
FIG. 83 Africa Dropper System Market, 2017-2030 (US$ Mn)
FIG. 84 South Africa Dropper System Market, 2017-2030 (US$ Mn)
FIG. 85 Egypt Dropper System Market, 2017-2030 (US$ Mn)
FIG. 86 Rest of Africa Dropper System Market, 2017-2030 (US$ Mn)


List of Tables
TABLE 1 Market Snapshot: Global Dropper System Market
TABLE 2 Global Dropper System Market: Market Drivers Impact Analysis
TABLE 3 Global Dropper System Market: Market Restraints Impact Analysis
TABLE 4 Global Dropper System Market, by Competitive Benchmarking, 2022
TABLE 5 Global Dropper System Market, by Geographical Presence Analysis, 2022
TABLE 6 Global Dropper System Market, by Key Strategies Analysis, 2022
TABLE 7 Global Dropper System Market, by Dropper Bottles, By Region, 2017-2022 (US$ Mn)
TABLE 8 Global Dropper System Market, by Dropper Bottles, By Region, 2023-2030 (US$ Mn)
TABLE 9 Global Dropper System Market, by Dropper Pipettes, By Region, 2017-2022 (US$ Mn)
TABLE 10 Global Dropper System Market, by Dropper Pipettes, By Region, 2023-2030 (US$ Mn)
TABLE 11 Global Dropper System Market, by Dropper Caps and Closures, By Region, 2017-2022 (US$ Mn)
TABLE 12 Global Dropper System Market, by Dropper Caps and Closures, By Region, 2023-2030 (US$ Mn)
TABLE 13 Global Dropper System Market, by Glass Droppers, By Region, 2017-2022 (US$ Mn)
TABLE 14 Global Dropper System Market, by Glass Droppers, By Region, 2023-2030 (US$ Mn)
TABLE 15 Global Dropper System Market, by Plastic Droppers, By Region, 2017-2022 (US$ Mn)
TABLE 16 Global Dropper System Market, by Plastic Droppers, By Region, 2023-2030 (US$ Mn)
TABLE 17 Global Dropper System Market, by Rubber Bulbs and Components, By Region, 2017-2022 (US$ Mn)
TABLE 18 Global Dropper System Market, by Rubber Bulbs and Components, By Region, 2023-2030 (US$ Mn)
TABLE 19 Global Dropper System Market, by Pharmaceuticals, By Region, 2017-2022 (US$ Mn)
TABLE 20 Global Dropper System Market, by Pharmaceuticals, By Region, 2023-2030 (US$ Mn)
TABLE 21 Global Dropper System Market, by Cosmetics and Skincare, By Region, 2017-2022 (US$ Mn)
TABLE 22 Global Dropper System Market, by Cosmetics and Skincare, By Region, 2023-2030 (US$ Mn)
TABLE 23 Global Dropper System Market, by Food and Beverages, By Region, 2017-2022 (US$ Mn)
TABLE 24 Global Dropper System Market, by Food and Beverages, By Region, 2023-2030 (US$ Mn)
TABLE 25 Global Dropper System Market, by Chemical and Laboratory, By Region, 2017-2022 (US$ Mn)
TABLE 26 Global Dropper System Market, by Chemical and Laboratory, By Region, 2023-2030 (US$ Mn)
TABLE 27 Global Dropper System Market, by E-liquids and Vaping, By Region, 2017-2022 (US$ Mn)
TABLE 28 Global Dropper System Market, by E-liquids and Vaping, By Region, 2023-2030 (US$ Mn)
TABLE 29 Global Dropper System Market, by Micro Droppers, By Region, 2017-2022 (US$ Mn)
TABLE 30 Global Dropper System Market, by Micro Droppers, By Region, 2023-2030 (US$ Mn)
TABLE 31 Global Dropper System Market, by Standard Droppers, By Region, 2017-2022 (US$ Mn)
TABLE 32 Global Dropper System Market, by Standard Droppers, By Region, 2023-2030 (US$ Mn)
TABLE 33 Global Dropper System Market, by Large Droppers, By Region, 2017-2022 (US$ Mn)
TABLE 34 Global Dropper System Market, by Large Droppers, By Region, 2023-2030 (US$ Mn)
TABLE 35 Global Dropper System Market, by Child-Resistant Closures, By Region, 2017-2022 (US$ Mn)
TABLE 36 Global Dropper System Market, by Child-Resistant Closures, By Region, 2023-2030 (US$ Mn)
TABLE 37 Global Dropper System Market, by Tamper-Evident Closures, By Region, 2017-2022 (US$ Mn)
TABLE 38 Global Dropper System Market, by Tamper-Evident Closures, By Region, 2023-2030 (US$ Mn)
TABLE 39 Global Dropper System Market, by Screw Caps, By Region, 2017-2022 (US$ Mn)
TABLE 40 Global Dropper System Market, by Screw Caps, By Region, 2023-2030 (US$ Mn)
TABLE 41 Global Dropper System Market, by Push Button Closures, By Region, 2017-2022 (US$ Mn)
TABLE 42 Global Dropper System Market, by Push Button Closures, By Region, 2023-2030 (US$ Mn)
TABLE 43 Global Dropper System Market, by Pharmaceutical and Healthcare Industry, By Region, 2017-2022 (US$ Mn)
TABLE 44 Global Dropper System Market, by Pharmaceutical and Healthcare Industry, By Region, 2023-2030 (US$ Mn)
TABLE 45 Global Dropper System Market, by Cosmetic and Personal Care Industry, By Region, 2017-2022 (US$ Mn)
TABLE 46 Global Dropper System Market, by Cosmetic and Personal Care Industry, By Region, 2023-2030 (US$ Mn)
TABLE 47 Global Dropper System Market, by Food and Beverage Industry, By Region, 2017-2022 (US$ Mn)
TABLE 48 Global Dropper System Market, by Food and Beverage Industry, By Region, 2023-2030 (US$ Mn)
TABLE 49 Global Dropper System Market, by Chemical and Laboratory Applications, By Region, 2017-2022 (US$ Mn)
TABLE 50 Global Dropper System Market, by Chemical and Laboratory Applications, By Region, 2023-2030 (US$ Mn)
TABLE 51 Global Dropper System Market, by E-liquid Manufacturers, By Region, 2017-2022 (US$ Mn)
TABLE 52 Global Dropper System Market, by E-liquid Manufacturers, By Region, 2023-2030 (US$ Mn)
TABLE 53 Global Dropper System Market, by Direct Sales, By Region, 2017-2022 (US$ Mn)
TABLE 54 Global Dropper System Market, by Direct Sales, By Region, 2023-2030 (US$ Mn)
TABLE 55 Global Dropper System Market, by Retail, By Region, 2017-2022 (US$ Mn)
TABLE 56 Global Dropper System Market, by Retail, By Region, 2023-2030 (US$ Mn)
TABLE 57 Global Dropper System Market, by Wholesalers and Distributors, By Region, 2017-2022 (US$ Mn)
TABLE 58 Global Dropper System Market, by Wholesalers and Distributors, By Region, 2023-2030 (US$ Mn)
TABLE 59 Global Dropper System Market, by Product Type, 2017-2022 (US$ Mn)
TABLE 60 Global Dropper System Market, by Product Type, 2023-2030 (US$ Mn)
TABLE 61 Global Dropper System Market, by Material Type, 2017-2022 (US$ Mn)
TABLE 62 Global Dropper System Market, by Material Type, 2023-2030 (US$ Mn)
TABLE 63 Global Dropper System Market, by Application, 2017-2022 (US$ Mn)
TABLE 64 Global Dropper System Market, by Application, 2023-2030 (US$ Mn)
TABLE 65 Global Dropper System Market, by Capacity, 2017-2022 (US$ Mn)
TABLE 66 Global Dropper System Market, by Capacity, 2023-2030 (US$ Mn)
TABLE 67 Global Dropper System Market, by Closure Type, 2017-2022 (US$ Mn)
TABLE 68 Global Dropper System Market, by Closure Type, 2023-2030 (US$ Mn)
TABLE 69 Global Dropper System Market, by End User, 2017-2022 (US$ Mn)
TABLE 70 Global Dropper System Market, by End User, 2023-2030 (US$ Mn)
TABLE 71 Global Dropper System Market, by Distribution Channel, 2017-2022 (US$ Mn)
TABLE 72 Global Dropper System Market, by Distribution Channel, 2023-2030 (US$ Mn)
TABLE 73 Global Dropper System Market, by Region, 2017-2022 (US$ Mn)
TABLE 74 Global Dropper System Market, by Region, 2023-2030 (US$ Mn)
TABLE 75 North America Dropper System Market, by Product Type, 2017-2022 (US$ Mn)
TABLE 76 North America Dropper System Market, by Product Type, 2023-2030 (US$ Mn)
TABLE 77 North America Dropper System Market, by Material Type, 2017-2022 (US$ Mn)
TABLE 78 North America Dropper System Market, by Material Type, 2023-2030 (US$ Mn)
TABLE 79 North America Dropper System Market, by Application, 2017-2022 (US$ Mn)
TABLE 80 North America Dropper System Market, by Application, 2023-2030 (US$ Mn)
TABLE 81 North America Dropper System Market, by Capacity, 2017-2022 (US$ Mn)
TABLE 82 North America Dropper System Market, by Capacity, 2023-2030 (US$ Mn)
TABLE 83 North America Dropper System Market, by Closure Type, 2017-2022 (US$ Mn)
TABLE 84 North America Dropper System Market, by Closure Type, 2023-2030 (US$ Mn)
TABLE 85 North America Dropper System Market, by End User, 2017-2022 (US$ Mn)
TABLE 86 North America Dropper System Market, by End User, 2023-2030 (US$ Mn)
TABLE 87 North America Dropper System Market, by Distribution Channel, 2017-2022 (US$ Mn)
TABLE 88 North America Dropper System Market, by Distribution Channel, 2023-2030 (US$ Mn)
TABLE 89 North America Dropper System Market, by Country, 2017-2022 (US$ Mn)
TABLE 90 North America Dropper System Market, by Country, 2023-2030 (US$ Mn)
TABLE 91 United States Dropper System Market, by Product Type, 2017-2022 (US$ Mn)
TABLE 92 United States Dropper System Market, by Product Type, 2023-2030 (US$ Mn)
TABLE 93 United States Dropper System Market, by Material Type, 2017-2022 (US$ Mn)
TABLE 94 United States Dropper System Market, by Material Type, 2023-2030 (US$ Mn)
TABLE 95 United States Dropper System Market, by Application, 2017-2022 (US$ Mn)
TABLE 96 United States Dropper System Market, by Application, 2023-2030 (US$ Mn)
TABLE 97 United States Dropper System Market, by Capacity, 2017-2022 (US$ Mn)
TABLE 98 United States Dropper System Market, by Capacity, 2023-2030 (US$ Mn)
TABLE 99 United States Dropper System Market, by Closure Type, 2017-2022 (US$ Mn)
TABLE 100 United States Dropper System Market, by Closure Type, 2023-2030 (US$ Mn)
TABLE 101 United States Dropper System Market, by End User, 2017-2022 (US$ Mn)
TABLE 102 United States Dropper System Market, by End User, 2023-2030 (US$ Mn)
TABLE 103 United States Dropper System Market, by Distribution Channel, 2017-2022 (US$ Mn)
TABLE 104 United States Dropper System Market, by Distribution Channel, 2023-2030 (US$ Mn)
TABLE 105 Canada Dropper System Market, by Product Type, 2017-2022 (US$ Mn)
TABLE 106 Canada Dropper System Market, by Product Type, 2023-2030 (US$ Mn)
TABLE 107 Canada Dropper System Market, by Material Type, 2017-2022 (US$ Mn)
TABLE 108 Canada Dropper System Market, by Material Type, 2023-2030 (US$ Mn)
TABLE 109 Canada Dropper System Market, by Application, 2017-2022 (US$ Mn)
TABLE 110 Canada Dropper System Market, by Application, 2023-2030 (US$ Mn)
TABLE 111 Canada Dropper System Market, by Capacity, 2017-2022 (US$ Mn)
TABLE 112 Canada Dropper System Market, by Capacity, 2023-2030 (US$ Mn)
TABLE 113 Canada Dropper System Market, by Closure Type, 2017-2022 (US$ Mn)
TABLE 114 Canada Dropper System Market, by Closure Type, 2023-2030 (US$ Mn)
TABLE 115 Canada Dropper System Market, by End User, 2017-2022 (US$ Mn)
TABLE 116 Canada Dropper System Market, by End User, 2023-2030 (US$ Mn)
TABLE 117 Canada Dropper System Market, by Distribution Channel, 2017-2022 (US$ Mn)
TABLE 118 Canada Dropper System Market, by Distribution Channel, 2023-2030 (US$ Mn)
TABLE 119 Mexico Dropper System Market, by Product Type, 2017-2022 (US$ Mn)
TABLE 120 Mexico Dropper System Market, by Product Type, 2023-2030 (US$ Mn)
TABLE 121 Mexico Dropper System Market, by Material Type, 2017-2022 (US$ Mn)
TABLE 122 Mexico Dropper System Market, by Material Type, 2023-2030 (US$ Mn)
TABLE 123 Mexico Dropper System Market, by Application, 2017-2022 (US$ Mn)
TABLE 124 Mexico Dropper System Market, by Application, 2023-2030 (US$ Mn)
TABLE 125 Mexico Dropper System Market, by Capacity, 2017-2022 (US$ Mn)
TABLE 126 Mexico Dropper System Market, by Capacity, 2023-2030 (US$ Mn)
TABLE 127 Mexico Dropper System Market, by Closure Type, 2017-2022 (US$ Mn)
TABLE 128 Mexico Dropper System Market, by Closure Type, 2023-2030 (US$ Mn)
TABLE 129 Mexico Dropper System Market, by End User, 2017-2022 (US$ Mn)
TABLE 130 Mexico Dropper System Market, by End User, 2023-2030 (US$ Mn)
TABLE 131 Mexico Dropper System Market, by Distribution Channel, 2017-2022 (US$ Mn)
TABLE 132 Mexico Dropper System Market, by Distribution Channel, 2023-2030 (US$ Mn)
TABLE 133 Europe Dropper System Market, by Product Type, 2017-2022 (US$ Mn)
TABLE 134 Europe Dropper System Market, by Product Type, 2023-2030 (US$ Mn)
TABLE 135 Europe Dropper System Market, by Material Type, 2017-2022 (US$ Mn)
TABLE 136 Europe Dropper System Market, by Material Type, 2023-2030 (US$ Mn)
TABLE 137 Europe Dropper System Market, by Application, 2017-2022 (US$ Mn)
TABLE 138 Europe Dropper System Market, by Application, 2023-2030 (US$ Mn)
TABLE 139 Europe Dropper System Market, by Capacity, 2017-2022 (US$ Mn)
TABLE 140 Europe Dropper System Market, by Capacity, 2023-2030 (US$ Mn)
TABLE 141 Europe Dropper System Market, by Closure Type, 2017-2022 (US$ Mn)
TABLE 142 Europe Dropper System Market, by Closure Type, 2023-2030 (US$ Mn)
TABLE 143 Europe Dropper System Market, by End User, 2017-2022 (US$ Mn)
TABLE 144 Europe Dropper System Market, by End User, 2023-2030 (US$ Mn)
TABLE 145 Europe Dropper System Market, by Distribution Channel, 2017-2022 (US$ Mn)
TABLE 146 Europe Dropper System Market, by Distribution Channel, 2023-2030 (US$ Mn)
TABLE 147 Europe Dropper System Market, by Country, 2017-2022 (US$ Mn)
TABLE 148 Europe Dropper System Market, by Country, 2023-2030 (US$ Mn)
TABLE 149 Germany Dropper System Market, by Product Type, 2017-2022 (US$ Mn)
TABLE 150 Germany Dropper System Market, by Product Type, 2023-2030 (US$ Mn)
TABLE 151 Germany Dropper System Market, by Material Type, 2017-2022 (US$ Mn)
TABLE 152 Germany Dropper System Market, by Material Type, 2023-2030 (US$ Mn)
TABLE 153 Germany Dropper System Market, by Application, 2017-2022 (US$ Mn)
TABLE 154 Germany Dropper System Market, by Application, 2023-2030 (US$ Mn)
TABLE 155 Germany Dropper System Market, by Capacity, 2017-2022 (US$ Mn)
TABLE 156 Germany Dropper System Market, by Capacity, 2023-2030 (US$ Mn)
TABLE 157 Germany Dropper System Market, by Closure Type, 2017-2022 (US$ Mn)
TABLE 158 Germany Dropper System Market, by Closure Type, 2023-2030 (US$ Mn)
TABLE 159 Germany Dropper System Market, by End User, 2017-2022 (US$ Mn)
TABLE 160 Germany Dropper System Market, by End User, 2023-2030 (US$ Mn)
TABLE 161 Germany Dropper System Market, by Distribution Channel, 2017-2022 (US$ Mn)
TABLE 162 Germany Dropper System Market, by Distribution Channel, 2023-2030 (US$ Mn)
TABLE 163 France Dropper System Market, by Product Type, 2017-2022 (US$ Mn)
TABLE 164 France Dropper System Market, by Product Type, 2023-2030 (US$ Mn)
TABLE 165 France Dropper System Market, by Material Type, 2017-2022 (US$ Mn)
TABLE 166 France Dropper System Market, by Material Type, 2023-2030 (US$ Mn)
TABLE 167 France Dropper System Market, by Application, 2017-2022 (US$ Mn)
TABLE 168 France Dropper System Market, by Application, 2023-2030 (US$ Mn)
TABLE 169 France Dropper System Market, by Capacity, 2017-2022 (US$ Mn)
TABLE 170 France Dropper System Market, by Capacity, 2023-2030 (US$ Mn)
TABLE 171 France Dropper System Market, by Closure Type, 2017-2022 (US$ Mn)
TABLE 172 France Dropper System Market, by Closure Type, 2023-2030 (US$ Mn)
TABLE 173 France Dropper System Market, by End User, 2017-2022 (US$ Mn)
TABLE 174 France Dropper System Market, by End User, 2023-2030 (US$ Mn)
TABLE 175 France Dropper System Market, by Distribution Channel, 2017-2022 (US$ Mn)
TABLE 176 France Dropper System Market, by Distribution Channel, 2023-2030 (US$ Mn)
TABLE 177 United Kingdom Dropper System Market, by Product Type, 2017-2022 (US$ Mn)
TABLE 178 United Kingdom Dropper System Market, by Product Type, 2023-2030 (US$ Mn)
TABLE 179 United Kingdom Dropper System Market, by Material Type, 2017-2022 (US$ Mn)
TABLE 180 United Kingdom Dropper System Market, by Material Type, 2023-2030 (US$ Mn)
TABLE 181 United Kingdom Dropper System Market, by Application, 2017-2022 (US$ Mn)
TABLE 182 United Kingdom Dropper System Market, by Application, 2023-2030 (US$ Mn)
TABLE 183 United Kingdom Dropper System Market, by Capacity, 2017-2022 (US$ Mn)
TABLE 184 United Kingdom Dropper System Market, by Capacity, 2023-2030 (US$ Mn)
TABLE 185 United Kingdom Dropper System Market, by Closure Type, 2017-2022 (US$ Mn)
TABLE 186 United Kingdom Dropper System Market, by Closure Type, 2023-2030 (US$ Mn)
TABLE 187 United Kingdom Dropper System Market, by End User, 2017-2022 (US$ Mn)
TABLE 188 United Kingdom Dropper System Market, by End User, 2023-2030 (US$ Mn)
TABLE 189 United Kingdom Dropper System Market, by Distribution Channel, 2017-2022 (US$ Mn)
TABLE 190 United Kingdom Dropper System Market, by Distribution Channel, 2023-2030 (US$ Mn)
TABLE 191 Italy Dropper System Market, by Product Type, 2017-2022 (US$ Mn)
TABLE 192 Italy Dropper System Market, by Product Type, 2023-2030 (US$ Mn)
TABLE 193 Italy Dropper System Market, by Material Type, 2017-2022 (US$ Mn)
TABLE 194 Italy Dropper System Market, by Material Type, 2023-2030 (US$ Mn)
TABLE 195 Italy Dropper System Market, by Application, 2017-2022 (US$ Mn)
TABLE 196 Italy Dropper System Market, by Application, 2023-2030 (US$ Mn)
TABLE 197 Italy Dropper System Market, by Capacity, 2017-2022 (US$ Mn)
TABLE 198 Italy Dropper System Market, by Capacity, 2023-2030 (US$ Mn)
TABLE 199 Italy Dropper System Market, by Closure Type, 2017-2022 (US$ Mn)
TABLE 200 Italy Dropper System Market, by Closure Type, 2023-2030 (US$ Mn)
TABLE 201 Italy Dropper System Market, by End User, 2017-2022 (US$ Mn)
TABLE 202 Italy Dropper System Market, by End User, 2023-2030 (US$ Mn)
TABLE 203 Italy Dropper System Market, by Distribution Channel, 2017-2022 (US$ Mn)
TABLE 204 Italy Dropper System Market, by Distribution Channel, 2023-2030 (US$ Mn)
TABLE 205 Spain Dropper System Market, by Product Type, 2017-2022 (US$ Mn)
TABLE 206 Spain Dropper System Market, by Product Type, 2023-2030 (US$ Mn)
TABLE 207 Spain Dropper System Market, by Material Type, 2017-2022 (US$ Mn)
TABLE 208 Spain Dropper System Market, by Material Type, 2023-2030 (US$ Mn)
TABLE 209 Spain Dropper System Market, by Application, 2017-2022 (US$ Mn)
TABLE 210 Spain Dropper System Market, by Application, 2023-2030 (US$ Mn)
TABLE 211 Spain Dropper System Market, by Capacity, 2017-2022 (US$ Mn)
TABLE 212 Spain Dropper System Market, by Capacity, 2023-2030 (US$ Mn)
TABLE 213 Spain Dropper System Market, by Closure Type, 2017-2022 (US$ Mn)
TABLE 214 Spain Dropper System Market, by Closure Type, 2023-2030 (US$ Mn)
TABLE 215 Spain Dropper System Market, by End User, 2017-2022 (US$ Mn)
TABLE 216 Spain Dropper System Market, by End User, 2023-2030 (US$ Mn)
TABLE 217 Spain Dropper System Market, by Distribution Channel, 2017-2022 (US$ Mn)
TABLE 218 Spain Dropper System Market, by Distribution Channel, 2023-2030 (US$ Mn)
TABLE 219 Benelux Dropper System Market, by Product Type, 2017-2022 (US$ Mn)
TABLE 220 Benelux Dropper System Market, by Product Type, 2023-2030 (US$ Mn)
TABLE 221 Benelux Dropper System Market, by Material Type, 2017-2022 (US$ Mn)
TABLE 222 Benelux Dropper System Market, by Material Type, 2023-2030 (US$ Mn)
TABLE 223 Benelux Dropper System Market, by Application, 2017-2022 (US$ Mn)
TABLE 224 Benelux Dropper System Market, by Application, 2023-2030 (US$ Mn)
TABLE 225 Benelux Dropper System Market, by Capacity, 2017-2022 (US$ Mn)
TABLE 226 Benelux Dropper System Market, by Capacity, 2023-2030 (US$ Mn)
TABLE 227 Benelux Dropper System Market, by Closure Type, 2017-2022 (US$ Mn)
TABLE 228 Benelux Dropper System Market, by Closure Type, 2023-2030 (US$ Mn)
TABLE 229 Benelux Dropper System Market, by End User, 2017-2022 (US$ Mn)
TABLE 230 Benelux Dropper System Market, by End User, 2023-2030 (US$ Mn)
TABLE 231 Benelux Dropper System Market, by Distribution Channel, 2017-2022 (US$ Mn)
TABLE 232 Benelux Dropper System Market, by Distribution Channel, 2023-2030 (US$ Mn)
TABLE 233 Russia Dropper System Market, by Product Type, 2017-2022 (US$ Mn)
TABLE 234 Russia Dropper System Market, by Product Type, 2023-2030 (US$ Mn)
TABLE 235 Russia Dropper System Market, by Material Type, 2017-2022 (US$ Mn)
TABLE 236 Russia Dropper System Market, by Material Type, 2023-2030 (US$ Mn)
TABLE 237 Russia Dropper System Market, by Application, 2017-2022 (US$ Mn)
TABLE 238 Russia Dropper System Market, by Application, 2023-2030 (US$ Mn)
TABLE 239 Russia Dropper System Market, by Capacity, 2017-2022 (US$ Mn)
TABLE 240 Russia Dropper System Market, by Capacity, 2023-2030 (US$ Mn)
TABLE 241 Russia Dropper System Market, by Closure Type, 2017-2022 (US$ Mn)
TABLE 242 Russia Dropper System Market, by Closure Type, 2023-2030 (US$ Mn)
TABLE 243 Russia Dropper System Market, by End User, 2017-2022 (US$ Mn)
TABLE 244 Russia Dropper System Market, by End User, 2023-2030 (US$ Mn)
TABLE 245 Russia Dropper System Market, by Distribution Channel, 2017-2022 (US$ Mn)
TABLE 246 Russia Dropper System Market, by Distribution Channel, 2023-2030 (US$ Mn)
TABLE 247 Rest of Europe Dropper System Market, by Product Type, 2017-2022 (US$ Mn)
TABLE 248 Rest of Europe Dropper System Market, by Product Type, 2023-2030 (US$ Mn)
TABLE 249 Rest of Europe Dropper System Market, by Material Type, 2017-2022 (US$ Mn)
TABLE 250 Rest of Europe Dropper System Market, by Material Type, 2023-2030 (US$ Mn)
TABLE 251 Rest of Europe Dropper System Market, by Application, 2017-2022 (US$ Mn)
TABLE 252 Rest of Europe Dropper System Market, by Application, 2023-2030 (US$ Mn)
TABLE 253 Rest of Europe Dropper System Market, by Capacity, 2017-2022 (US$ Mn)
TABLE 254 Rest of Europe Dropper System Market, by Capacity, 2023-2030 (US$ Mn)
TABLE 255 Rest of Europe Dropper System Market, by Closure Type, 2017-2022 (US$ Mn)
TABLE 256 Rest of Europe Dropper System Market, by Closure Type, 2023-2030 (US$ Mn)
TABLE 257 Rest of Europe Dropper System Market, by End User, 2017-2022 (US$ Mn)
TABLE 258 Rest of Europe Dropper System Market, by End User, 2023-2030 (US$ Mn)
TABLE 259 Rest of Europe Dropper System Market, by Distribution Channel, 2017-2022 (US$ Mn)
TABLE 260 Rest of Europe Dropper System Market, by Distribution Channel, 2023-2030 (US$ Mn)
TABLE 261 Asia Pacific Dropper System Market, by Product Type, 2017-2022 (US$ Mn)
TABLE 262 Asia Pacific Dropper System Market, by Product Type, 2023-2030 (US$ Mn)
TABLE 263 Asia Pacific Dropper System Market, by Material Type, 2017-2022 (US$ Mn)
TABLE 264 Asia Pacific Dropper System Market, by Material Type, 2023-2030 (US$ Mn)
TABLE 265 Asia Pacific Dropper System Market, by Application, 2017-2022 (US$ Mn)
TABLE 266 Asia Pacific Dropper System Market, by Application, 2023-2030 (US$ Mn)
TABLE 267 Asia Pacific Dropper System Market, by Capacity, 2017-2022 (US$ Mn)
TABLE 268 Asia Pacific Dropper System Market, by Capacity, 2023-2030 (US$ Mn)
TABLE 269 Asia Pacific Dropper System Market, by Closure Type, 2017-2022 (US$ Mn)
TABLE 270 Asia Pacific Dropper System Market, by Closure Type, 2023-2030 (US$ Mn)
TABLE 271 Asia Pacific Dropper System Market, by End User, 2017-2022 (US$ Mn)
TABLE 272 Asia Pacific Dropper System Market, by End User, 2023-2030 (US$ Mn)
TABLE 273 Asia Pacific Dropper System Market, by Distribution Channel, 2017-2022 (US$ Mn)
TABLE 274 Asia Pacific Dropper System Market, by Distribution Channel, 2023-2030 (US$ Mn)
TABLE 275 China Dropper System Market, by Product Type, 2017-2022 (US$ Mn)
TABLE 276 China Dropper System Market, by Product Type, 2023-2030 (US$ Mn)
TABLE 277 China Dropper System Market, by Material Type, 2017-2022 (US$ Mn)
TABLE 278 China Dropper System Market, by Material Type, 2023-2030 (US$ Mn)
TABLE 279 China Dropper System Market, by Application, 2017-2022 (US$ Mn)
TABLE 280 China Dropper System Market, by Application, 2023-2030 (US$ Mn)
TABLE 281 China Dropper System Market, by Capacity, 2017-2022 (US$ Mn)
TABLE 282 China Dropper System Market, by Capacity, 2023-2030 (US$ Mn)
TABLE 283 China Dropper System Market, by Closure Type, 2017-2022 (US$ Mn)
TABLE 284 China Dropper System Market, by Closure Type, 2023-2030 (US$ Mn)
TABLE 285 China Dropper System Market, by End User, 2017-2022 (US$ Mn)
TABLE 286 China Dropper System Market, by End User, 2023-2030 (US$ Mn)
TABLE 287 China Dropper System Market, by Distribution Channel, 2017-2022 (US$ Mn)
TABLE 288 China Dropper System Market, by Distribution Channel, 2023-2030 (US$ Mn)
TABLE 289 Japan Dropper System Market, by Product Type, 2017-2022 (US$ Mn)
TABLE 290 Japan Dropper System Market, by Product Type, 2023-2030 (US$ Mn)
TABLE 291 Japan Dropper System Market, by Material Type, 2017-2022 (US$ Mn)
TABLE 292 Japan Dropper System Market, by Material Type, 2023-2030 (US$ Mn)
TABLE 293 Japan Dropper System Market, by Application, 2017-2022 (US$ Mn)
TABLE 294 Japan Dropper System Market, by Application, 2023-2030 (US$ Mn)
TABLE 295 Japan Dropper System Market, by Capacity, 2017-2022 (US$ Mn)
TABLE 296 Japan Dropper System Market, by Capacity, 2023-2030 (US$ Mn)
TABLE 297 Japan Dropper System Market, by Closure Type, 2017-2022 (US$ Mn)
TABLE 298 Japan Dropper System Market, by Closure Type, 2023-2030 (US$ Mn)
TABLE 299 Japan Dropper System Market, by End User, 2017-2022 (US$ Mn)
TABLE 300 Japan Dropper System Market, by End User, 2023-2030 (US$ Mn)
TABLE 301 Japan Dropper System Market, by Distribution Channel, 2017-2022 (US$ Mn)
TABLE 302 Japan Dropper System Market, by Distribution Channel, 2023-2030 (US$ Mn)
TABLE 303 India Dropper System Market, by Product Type, 2017-2022 (US$ Mn)
TABLE 304 India Dropper System Market, by Product Type, 2023-2030 (US$ Mn)
TABLE 305 India Dropper System Market, by Material Type, 2017-2022 (US$ Mn)
TABLE 306 India Dropper System Market, by Material Type, 2023-2030 (US$ Mn)
TABLE 307 India Dropper System Market, by Application, 2017-2022 (US$ Mn)
TABLE 308 India Dropper System Market, by Application, 2023-2030 (US$ Mn)
TABLE 309 India Dropper System Market, by Capacity, 2017-2022 (US$ Mn)
TABLE 310 India Dropper System Market, by Capacity, 2023-2030 (US$ Mn)
TABLE 311 India Dropper System Market, by Closure Type, 2017-2022 (US$ Mn)
TABLE 312 India Dropper System Market, by Closure Type, 2023-2030 (US$ Mn)
TABLE 313 India Dropper System Market, by End User, 2017-2022 (US$ Mn)
TABLE 314 India Dropper System Market, by End User, 2023-2030 (US$ Mn)
TABLE 315 India Dropper System Market, by Distribution Channel, 2017-2022 (US$ Mn)
TABLE 316 India Dropper System Market, by Distribution Channel, 2023-2030 (US$ Mn)
TABLE 317 South Korea Dropper System Market, by Product Type, 2017-2022 (US$ Mn)
TABLE 318 South Korea Dropper System Market, by Product Type, 2023-2030 (US$ Mn)
TABLE 319 South Korea Dropper System Market, by Material Type, 2017-2022 (US$ Mn)
TABLE 320 South Korea Dropper System Market, by Material Type, 2023-2030 (US$ Mn)
TABLE 321 South Korea Dropper System Market, by Application, 2017-2022 (US$ Mn)
TABLE 322 South Korea Dropper System Market, by Application, 2023-2030 (US$ Mn)
TABLE 323 South Korea Dropper System Market, by Capacity, 2017-2022 (US$ Mn)
TABLE 324 South Korea Dropper System Market, by Capacity, 2023-2030 (US$ Mn)
TABLE 325 South Korea Dropper System Market, by Closure Type, 2017-2022 (US$ Mn)
TABLE 326 South Korea Dropper System Market, by Closure Type, 2023-2030 (US$ Mn)
TABLE 327 South Korea Dropper System Market, by End User, 2017-2022 (US$ Mn)
TABLE 328 South Korea Dropper System Market, by End User, 2023-2030 (US$ Mn)
TABLE 329 South Korea Dropper System Market, by Distribution Channel, 2017-2022 (US$ Mn)
TABLE 330 South Korea Dropper System Market, by Distribution Channel, 2023-2030 (US$ Mn)
TABLE 331 South-East Asia Dropper System Market, by Product Type, 2017-2022 (US$ Mn)
TABLE 332 South-East Asia Dropper System Market, by Product Type, 2023-2030 (US$ Mn)
TABLE 333 South-East Asia Dropper System Market, by Material Type, 2017-2022 (US$ Mn)
TABLE 334 South-East Asia Dropper System Market, by Material Type, 2023-2030 (US$ Mn)
TABLE 335 South-East Asia Dropper System Market, by Application, 2017-2022 (US$ Mn)
TABLE 336 South-East Asia Dropper System Market, by Application, 2023-2030 (US$ Mn)
TABLE 337 South-East Asia Dropper System Market, by Capacity, 2017-2022 (US$ Mn)
TABLE 338 South-East Asia Dropper System Market, by Capacity, 2023-2030 (US$ Mn)
TABLE 339 South-East Asia Dropper System Market, by Closure Type, 2017-2022 (US$ Mn)
TABLE 340 South-East Asia Dropper System Market, by Closure Type, 2023-2030 (US$ Mn)
TABLE 341 South-East Asia Dropper System Market, by End User, 2017-2022 (US$ Mn)
TABLE 342 South-East Asia Dropper System Market, by End User, 2023-2030 (US$ Mn)
TABLE 343 South-East Asia Dropper System Market, by Distribution Channel, 2017-2022 (US$ Mn)
TABLE 344 South-East Asia Dropper System Market, by Distribution Channel, 2023-2030 (US$ Mn)
TABLE 345 Rest of Asia Pacific Dropper System Market, by Product Type, 2017-2022 (US$ Mn)
TABLE 346 Rest of Asia Pacific Dropper System Market, by Product Type, 2023-2030 (US$ Mn)
TABLE 347 Rest of Asia Pacific Dropper System Market, by Material Type, 2017-2022 (US$ Mn)
TABLE 348 Rest of Asia Pacific Dropper System Market, by Material Type, 2023-2030 (US$ Mn)
TABLE 349 Rest of Asia Pacific Dropper System Market, by Application, 2017-2022 (US$ Mn)
TABLE 350 Rest of Asia Pacific Dropper System Market, by Application, 2023-2030 (US$ Mn)
TABLE 351 Rest of Asia Pacific Dropper System Market, by Capacity, 2017-2022 (US$ Mn)
TABLE 352 Rest of Asia Pacific Dropper System Market, by Capacity, 2023-2030 (US$ Mn)
TABLE 353 Rest of Asia Pacific Dropper System Market, by Closure Type, 2017-2022 (US$ Mn)
TABLE 354 Rest of Asia Pacific Dropper System Market, by Closure Type, 2023-2030 (US$ Mn)
TABLE 355 Rest of Asia Pacific Dropper System Market, by End User, 2017-2022 (US$ Mn)
TABLE 356 Rest of Asia Pacific Dropper System Market, by End User, 2023-2030 (US$ Mn)
TABLE 357 Rest of Asia Pacific Dropper System Market, by Distribution Channel, 2017-2022 (US$ Mn)
TABLE 358 Rest of Asia Pacific Dropper System Market, by Distribution Channel, 2023-2030 (US$ Mn)
TABLE 359 Latin America Dropper System Market, by Product Type, 2017-2022 (US$ Mn)
TABLE 360 Latin America Dropper System Market, by Product Type, 2023-2030 (US$ Mn)
TABLE 361 Latin America Dropper System Market, by Material Type, 2017-2022 (US$ Mn)
TABLE 362 Latin America Dropper System Market, by Material Type, 2023-2030 (US$ Mn)
TABLE 363 Latin America Dropper System Market, by Application, 2017-2022 (US$ Mn)
TABLE 364 Latin America Dropper System Market, by Application, 2023-2030 (US$ Mn)
TABLE 365 Latin America Dropper System Market, by Capacity, 2017-2022 (US$ Mn)
TABLE 366 Latin America Dropper System Market, by Capacity, 2023-2030 (US$ Mn)
TABLE 367 Latin America Dropper System Market, by Closure Type, 2017-2022 (US$ Mn)
TABLE 368 Latin America Dropper System Market, by Closure Type, 2023-2030 (US$ Mn)
TABLE 369 Latin America Dropper System Market, by End User, 2017-2022 (US$ Mn)
TABLE 370 Latin America Dropper System Market, by End User, 2023-2030 (US$ Mn)
TABLE 371 Latin America Dropper System Market, by Distribution Channel, 2017-2022 (US$ Mn)
TABLE 372 Latin America Dropper System Market, by Distribution Channel, 2023-2030 (US$ Mn)
TABLE 373 Brazil Dropper System Market, by Product Type, 2017-2022 (US$ Mn)
TABLE 374 Brazil Dropper System Market, by Product Type, 2023-2030 (US$ Mn)
TABLE 375 Brazil Dropper System Market, by Material Type, 2017-2022 (US$ Mn)
TABLE 376 Brazil Dropper System Market, by Material Type, 2023-2030 (US$ Mn)
TABLE 377 Brazil Dropper System Market, by Application, 2017-2022 (US$ Mn)
TABLE 378 Brazil Dropper System Market, by Application, 2023-2030 (US$ Mn)
TABLE 379 Brazil Dropper System Market, by Capacity, 2017-2022 (US$ Mn)
TABLE 380 Brazil Dropper System Market, by Capacity, 2023-2030 (US$ Mn)
TABLE 381 Brazil Dropper System Market, by Closure Type, 2017-2022 (US$ Mn)
TABLE 382 Brazil Dropper System Market, by Closure Type, 2023-2030 (US$ Mn)
TABLE 383 Brazil Dropper System Market, by End User, 2017-2022 (US$ Mn)
TABLE 384 Brazil Dropper System Market, by End User, 2023-2030 (US$ Mn)
TABLE 385 Brazil Dropper System Market, by Distribution Channel, 2017-2022 (US$ Mn)
TABLE 386 Brazil Dropper System Market, by Distribution Channel, 2023-2030 (US$ Mn)
TABLE 387 Argentina Dropper System Market, by Product Type, 2017-2022 (US$ Mn)
TABLE 388 Argentina Dropper System Market, by Product Type, 2023-2030 (US$ Mn)
TABLE 389 Argentina Dropper System Market, by Material Type, 2017-2022 (US$ Mn)
TABLE 390 Argentina Dropper System Market, by Material Type, 2023-2030 (US$ Mn)
TABLE 391 Argentina Dropper System Market, by Application, 2017-2022 (US$ Mn)
TABLE 392 Argentina Dropper System Market, by Application, 2023-2030 (US$ Mn)
TABLE 393 Argentina Dropper System Market, by Capacity, 2017-2022 (US$ Mn)
TABLE 394 Argentina Dropper System Market, by Capacity, 2023-2030 (US$ Mn)
TABLE 395 Argentina Dropper System Market, by Closure Type, 2017-2022 (US$ Mn)
TABLE 396 Argentina Dropper System Market, by Closure Type, 2023-2030 (US$ Mn)
TABLE 397 Argentina Dropper System Market, by End User, 2017-2022 (US$ Mn)
TABLE 398 Argentina Dropper System Market, by End User, 2023-2030 (US$ Mn)
TABLE 399 Argentina Dropper System Market, by Distribution Channel, 2017-2022 (US$ Mn)
TABLE 400 Argentina Dropper System Market, by Distribution Channel, 2023-2030 (US$ Mn)
TABLE 401 Rest of Latin America Dropper System Market, by Product Type, 2017-2022 (US$ Mn)
TABLE 402 Rest of Latin America Dropper System Market, by Product Type, 2023-2030 (US$ Mn)
TABLE 403 Rest of Latin America Dropper System Market, by Material Type, 2017-2022 (US$ Mn)
TABLE 404 Rest of Latin America Dropper System Market, by Material Type, 2023-2030 (US$ Mn)
TABLE 405 Rest of Latin America Dropper System Market, by Application, 2017-2022 (US$ Mn)
TABLE 406 Rest of Latin America Dropper System Market, by Application, 2023-2030 (US$ Mn)
TABLE 407 Rest of Latin America Dropper System Market, by Capacity, 2017-2022 (US$ Mn)
TABLE 408 Rest of Latin America Dropper System Market, by Capacity, 2023-2030 (US$ Mn)
TABLE 409 Rest of Latin America Dropper System Market, by Closure Type, 2017-2022 (US$ Mn)
TABLE 410 Rest of Latin America Dropper System Market, by Closure Type, 2023-2030 (US$ Mn)
TABLE 411 Rest of Latin America Dropper System Market, by End User, 2017-2022 (US$ Mn)
TABLE 412 Rest of Latin America Dropper System Market, by End User, 2023-2030 (US$ Mn)
TABLE 413 Rest of Latin America Dropper System Market, by Distribution Channel, 2017-2022 (US$ Mn)
TABLE 414 Rest of Latin America Dropper System Market, by Distribution Channel, 2023-2030 (US$ Mn)
TABLE 415 Middle East Dropper System Market, by Product Type, 2017-2022 (US$ Mn)
TABLE 416 Middle East Dropper System Market, by Product Type, 2023-2030 (US$ Mn)
TABLE 417 Middle East Dropper System Market, by Material Type, 2017-2022 (US$ Mn)
TABLE 418 Middle East Dropper System Market, by Material Type, 2023-2030 (US$ Mn)
TABLE 419 Middle East Dropper System Market, by Application, 2017-2022 (US$ Mn)
TABLE 420 Middle East Dropper System Market, by Application, 2023-2030 (US$ Mn)
TABLE 421 Middle East Dropper System Market, by Capacity, 2017-2022 (US$ Mn)
TABLE 422 Middle East Dropper System Market, by Capacity, 2023-2030 (US$ Mn)
TABLE 423 Middle East Dropper System Market, by Closure Type, 2017-2022 (US$ Mn)
TABLE 424 Middle East Dropper System Market, by Closure Type, 2023-2030 (US$ Mn)
TABLE 425 Middle East Dropper System Market, by End User, 2017-2022 (US$ Mn)
TABLE 426 Middle East Dropper System Market, by End User, 2023-2030 (US$ Mn)
TABLE 427 Middle East Dropper System Market, by Distribution Channel, 2017-2022 (US$ Mn)
TABLE 428 Middle East Dropper System Market, by Distribution Channel, 2023-2030 (US$ Mn)
TABLE 429 UAE Dropper System Market, by Product Type, 2017-2022 (US$ Mn)
TABLE 430 UAE Dropper System Market, by Product Type, 2023-2030 (US$ Mn)
TABLE 431 UAE Dropper System Market, by Material Type, 2017-2022 (US$ Mn)
TABLE 432 UAE Dropper System Market, by Material Type, 2023-2030 (US$ Mn)
TABLE 433 UAE Dropper System Market, by Application, 2017-2022 (US$ Mn)
TABLE 434 UAE Dropper System Market, by Application, 2023-2030 (US$ Mn)
TABLE 435 UAE Dropper System Market, by Capacity, 2017-2022 (US$ Mn)
TABLE 436 UAE Dropper System Market, by Capacity, 2023-2030 (US$ Mn)
TABLE 437 UAE Dropper System Market, by Closure Type, 2017-2022 (US$ Mn)
TABLE 438 UAE Dropper System Market, by Closure Type, 2023-2030 (US$ Mn)
TABLE 439 UAE Dropper System Market, by End User, 2017-2022 (US$ Mn)
TABLE 440 UAE Dropper System Market, by End User, 2023-2030 (US$ Mn)
TABLE 441 UAE Dropper System Market, by Distribution Channel, 2017-2022 (US$ Mn)
TABLE 442 UAE Dropper System Market, by Distribution Channel, 2023-2030 (US$ Mn)
TABLE 443 Saudi Arabia Dropper System Market, by Product Type, 2017-2022 (US$ Mn)
TABLE 444 Saudi Arabia Dropper System Market, by Product Type, 2023-2030 (US$ Mn)
TABLE 445 Saudi Arabia Dropper System Market, by Material Type, 2017-2022 (US$ Mn)
TABLE 446 Saudi Arabia Dropper System Market, by Material Type, 2023-2030 (US$ Mn)
TABLE 447 Saudi Arabia Dropper System Market, by Application, 2017-2022 (US$ Mn)
TABLE 448 Saudi Arabia Dropper System Market, by Application, 2023-2030 (US$ Mn)
TABLE 449 Saudi Arabia Dropper System Market, by Capacity, 2017-2022 (US$ Mn)
TABLE 450 Saudi Arabia Dropper System Market, by Capacity, 2023-2030 (US$ Mn)
TABLE 451 Saudi Arabia Dropper System Market, by Closure Type, 2017-2022 (US$ Mn)
TABLE 452 Saudi Arabia Dropper System Market, by Closure Type, 2023-2030 (US$ Mn)
TABLE 453 Saudi Arabia Dropper System Market, by End User, 2017-2022 (US$ Mn)
TABLE 454 Saudi Arabia Dropper System Market, by End User, 2023-2030 (US$ Mn)
TABLE 455 Saudi Arabia Dropper System Market, by Distribution Channel, 2017-2022 (US$ Mn)
TABLE 456 Saudi Arabia Dropper System Market, by Distribution Channel, 2023-2030 (US$ Mn)
TABLE 457 Rest of Middle East Dropper System Market, by Product Type, 2017-2022 (US$ Mn)
TABLE 458 Rest of Middle East Dropper System Market, by Product Type, 2023-2030 (US$ Mn)
TABLE 459 Rest of Middle East Dropper System Market, by Material Type, 2017-2022 (US$ Mn)
TABLE 460 Rest of Middle East Dropper System Market, by Material Type, 2023-2030 (US$ Mn)
TABLE 461 Rest of Middle East Dropper System Market, by Application, 2017-2022 (US$ Mn)
TABLE 462 Rest of Middle East Dropper System Market, by Application, 2023-2030 (US$ Mn)
TABLE 463 Rest of Middle East Dropper System Market, by Capacity, 2017-2022 (US$ Mn)
TABLE 464 Rest of Middle East Dropper System Market, by Capacity, 2023-2030 (US$ Mn)
TABLE 465 Rest of Middle East Dropper System Market, by Closure Type, 2017-2022 (US$ Mn)
TABLE 466 Rest of Middle East Dropper System Market, by Closure Type, 2023-2030 (US$ Mn)
TABLE 467 Rest of Middle East Dropper System Market, by End User, 2017-2022 (US$ Mn)
TABLE 468 Rest of Middle East Dropper System Market, by End User, 2023-2030 (US$ Mn)
TABLE 469 Rest of Middle East Dropper System Market, by Distribution Channel, 2017-2022 (US$ Mn)
TABLE 470 Rest of Middle East Dropper System Market, by Distribution Channel, 2023-2030 (US$ Mn)
TABLE 471 Africa Dropper System Market, by Product Type, 2017-2022 (US$ Mn)
TABLE 472 Africa Dropper System Market, by Product Type, 2023-2030 (US$ Mn)
TABLE 473 Africa Dropper System Market, by Material Type, 2017-2022 (US$ Mn)
TABLE 474 Africa Dropper System Market, by Material Type, 2023-2030 (US$ Mn)
TABLE 475 Africa Dropper System Market, by Application, 2017-2022 (US$ Mn)
TABLE 476 Africa Dropper System Market, by Application, 2023-2030 (US$ Mn)
TABLE 477 Africa Dropper System Market, by Capacity, 2017-2022 (US$ Mn)
TABLE 478 Africa Dropper System Market, by Capacity, 2023-2030 (US$ Mn)
TABLE 479 Africa Dropper System Market, by Closure Type, 2017-2022 (US$ Mn)
TABLE 480 Africa Dropper System Market, by Closure Type, 2023-2030 (US$ Mn)
TABLE 481 Africa Dropper System Market, by End User, 2017-2022 (US$ Mn)
TABLE 482 Africa Dropper System Market, by End User, 2023-2030 (US$ Mn)
TABLE 483 Africa Dropper System Market, by Distribution Channel, 2017-2022 (US$ Mn)
TABLE 484 Africa Dropper System Market, by Distribution Channel, 2023-2030 (US$ Mn)
TABLE 485 South Africa Dropper System Market, by Product Type, 2017-2022 (US$ Mn)
TABLE 486 South Africa Dropper System Market, by Product Type, 2023-2030 (US$ Mn)
TABLE 487 South Africa Dropper System Market, by Material Type, 2017-2022 (US$ Mn)
TABLE 488 South Africa Dropper System Market, by Material Type, 2023-2030 (US$ Mn)
TABLE 489 South Africa Dropper System Market, by Application, 2017-2022 (US$ Mn)
TABLE 490 South Africa Dropper System Market, by Application, 2023-2030 (US$ Mn)
TABLE 491 South Africa Dropper System Market, by Capacity, 2017-2022 (US$ Mn)
TABLE 492 South Africa Dropper System Market, by Capacity, 2023-2030 (US$ Mn)
TABLE 493 South Africa Dropper System Market, by Closure Type, 2017-2022 (US$ Mn)
TABLE 494 South Africa Dropper System Market, by Closure Type, 2023-2030 (US$ Mn)
TABLE 495 South Africa Dropper System Market, by End User, 2017-2022 (US$ Mn)
TABLE 496 South Africa Dropper System Market, by End User, 2023-2030 (US$ Mn)
TABLE 497 South Africa Dropper System Market, by Distribution Channel, 2017-2022 (US$ Mn)
TABLE 498 South Africa Dropper System Market, by Distribution Channel, 2023-2030 (US$ Mn)
TABLE 499 Egypt Dropper System Market, by Product Type, 2017-2022 (US$ Mn)
TABLE 500 Egypt Dropper System Market, by Product Type, 2023-2030 (US$ Mn)
TABLE 501 Egypt Dropper System Market, by Material Type, 2017-2022 (US$ Mn)
TABLE 502 Egypt Dropper System Market, by Material Type, 2023-2030 (US$ Mn)
TABLE 503 Egypt Dropper System Market, by Application, 2017-2022 (US$ Mn)
TABLE 504 Egypt Dropper System Market, by Application, 2023-2030 (US$ Mn)
TABLE 505 Egypt Dropper System Market, by Capacity, 2017-2022 (US$ Mn)
TABLE 506 Egypt Dropper System Market, by Capacity, 2023-2030 (US$ Mn)
TABLE 507 Egypt Dropper System Market, by Closure Type, 2017-2022 (US$ Mn)
TABLE 508 Egypt Dropper System Market, by Closure Type, 2023-2030 (US$ Mn)
TABLE 509 Egypt Dropper System Market, by End User, 2017-2022 (US$ Mn)
TABLE 510 Egypt Dropper System Market, by End User, 2023-2030 (US$ Mn)
TABLE 511 Egypt Dropper System Market, by Distribution Channel, 2017-2022 (US$ Mn)
TABLE 512 Egypt Dropper System Market, by Distribution Channel, 2023-2030 (US$ Mn)
TABLE 513 Rest of Africa Dropper System Market, by Product Type, 2017-2022 (US$ Mn)
TABLE 514 Rest of Africa Dropper System Market, by Product Type, 2023-2030 (US$ Mn)
TABLE 515 Rest of Africa Dropper System Market, by Material Type, 2017-2022 (US$ Mn)
TABLE 516 Rest of Africa Dropper System Market, by Material Type, 2023-2030 (US$ Mn)
TABLE 517 Rest of Africa Dropper System Market, by Application, 2017-2022 (US$ Mn)
TABLE 518 Rest of Africa Dropper System Market, by Application, 2023-2030 (US$ Mn)
TABLE 519 Rest of Africa Dropper System Market, by Capacity, 2017-2022 (US$ Mn)
TABLE 520 Rest of Africa Dropper System Market, by Capacity, 2023-2030 (US$ Mn)
TABLE 521 Rest of Africa Dropper System Market, by Closure Type, 2017-2022 (US$ Mn)
TABLE 522 Rest of Africa Dropper System Market, by Closure Type, 2023-2030 (US$ Mn)
TABLE 523 Rest of Africa Dropper System Market, by End User, 2017-2022 (US$ Mn)
TABLE 524 Rest of Africa Dropper System Market, by End User, 2023-2030 (US$ Mn)
TABLE 525 Rest of Africa Dropper System Market, by Distribution Channel, 2017-2022 (US$ Mn)
TABLE 526 Rest of Africa Dropper System Market, by Distribution Channel, 2023-2030 (US$ Mn)

Frequently Asked Questions

How big is the global market for dropper systems right now?

In 2022, the market for dropper systems was estimated to be worth USD 65.1 million.

What is the dropper system market’s anticipated growth rate from 2023 to 2030?

The market for dropper systems is anticipated to increase at a CAGR of 5.50% from 2023 to 2030, reaching USD 99.90 million in 2030.

In terms of the product type, which market category is in the lead?

Dropper bottles are the most popular category of product type.

Which segment is leading the market in terms of material type?

Plastic droppers, by the material type, are the notable segment.

Which application segment is estimated to have the highest CAGR throughout the forecast period?

During the projection period, the pharmaceuticals category is anticipated to exhibit the highest CAGR.

In which region is the market for dropper systems expanding?

The dropper system market was ruled by Asia Pacific.

Who are the key participants in the market for dropper systems globally?

The top players include HCP Packaging Co. Ltd, Albéa Group, Quadpack SA, HEIM Pharma Tropfsysteme GmbH, Paramark Corporation, Cosmetic Specialties International, LLC, Carow Packaging Inc., RTN Applicator Company LLC, Guangzhou Jiaxing Glass Products Co. Ltd, Hangzhou Lecos packaging Co., Ltd, Guangzhou YELLO Packaging Co., Ltd., Bestpak Packaging Solutions, Inc., Radcom Packaging Pvt Ltd, Taiwan K. K. Corp (COSJAR), and others.

What are the main market factors driving the dropper system sector?

The requirement for precision dosing, adaptability, patient-friendliness, hygiene, personalization, demographic changes, global health events, emerging markets, and regulatory compliance are some of the factors that are driving the increased need for dropper systems in the healthcare and pharmaceutical industries. Dropper systems are a crucial link in the supply chain for medical and pharmaceutical products because of this encouraging reason.

What main market challenges prevent the dropper system sector from growing?

The challenges limiting the growth of the dropper system market are intense competition, supply chain disruptions, and limited innovation in materials.

1.   What are the main market opportunities for the dropper system sector?

Consumers are becoming increasingly aware of the importance of hygiene, especially when it comes to products that are used on the skin and hair. Droppers are a hygienic way to dispense a precise amount of product without contaminating the rest of the product. This is a key opportunity in the dropper system market.

Veterinary Endoscopy Market

Published:
Report ID: 37850

Veterinary Artificial Insemination Market

Published:
Report ID: 37847

Europe Veterinary Imaging Market

Published:
Report ID: 37843

PCR Technologies Market

Published:
Report ID: 37712

Genital Warts Market

Published:
Report ID: 37725

Chronic Spontaneous Urticaria Market

Published:
Report ID: 37728

Radiology Information Systems Market

Published:
Report ID: 8728

India Medical Tourism Market

Published:
Report ID: 37641

Indian Ventilator Market

Published:
Report ID: 37651

Endoscopic Submucosal Dissection (ESD) Market

Published:
Report ID: 37490

Hyperthermia Cancer Treatment Market

Published:
Report ID: 37492

Australia Veterinary Imaging Market

Published:
Report ID: 37574

Purchase Options

$2999
Delivery Format: Excel.
$4999
Designed for the individual purchaser.
$6999
Users located at a single corporate site or regional office.
$7999
Allowed for unlimited sharing globally within one company.
Smallform of Sample request

Have a question?

User Profile

Don’t settle for less – trust Mitul to help you find the best solution.

Report delivery within 24 to 48 hours

– Other Info –

What people say?-

User Review

I am very impressed with the information in this report. The author clearly did their research when they came up with this product and it has already given me a lot of ideas.

Jana Schmidt
CEDAR CX Technologies

– Connect with us –

Phone

+91 6232 49 3207


support

24/7 Research Support


sales@credenceresearch.com

– Research Methodology –

Going beyond the basics: advanced techniques in research methodology

– Trusted By –

Pepshi, LG, Nestle
Motorola, Honeywell, Johnson and johnson
LG Chem, SIEMENS, Pfizer
Unilever, Samsonite, QIAGEN