
Phones, ABHA rails and teleconsults widen mobile health use
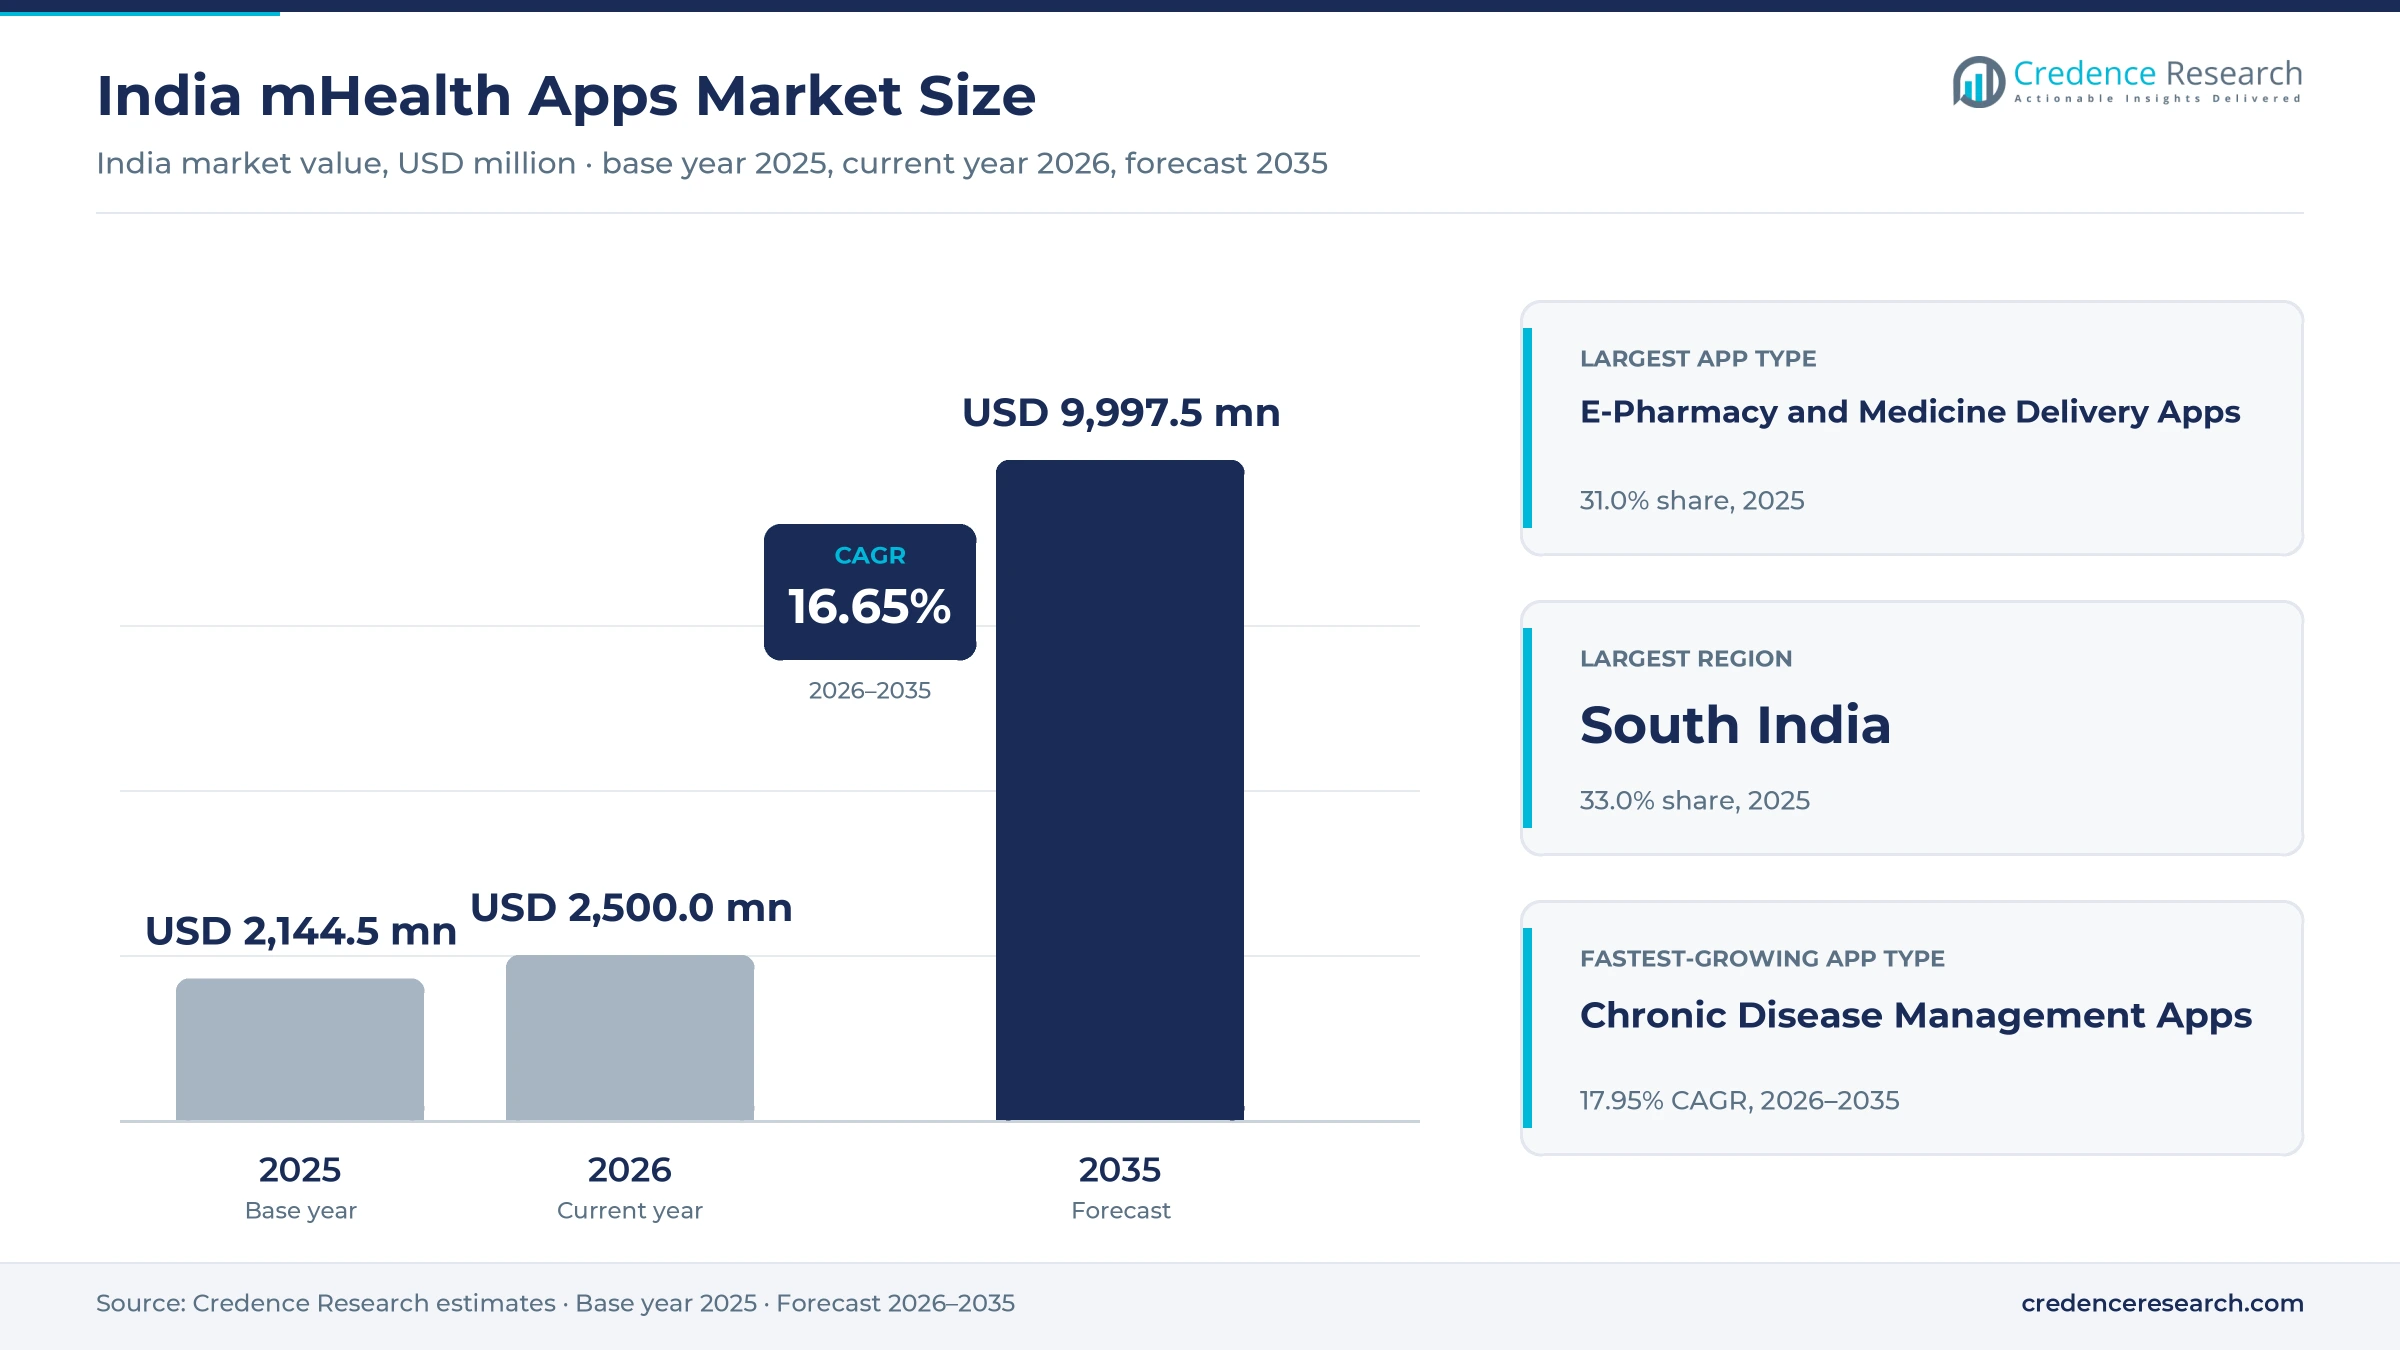
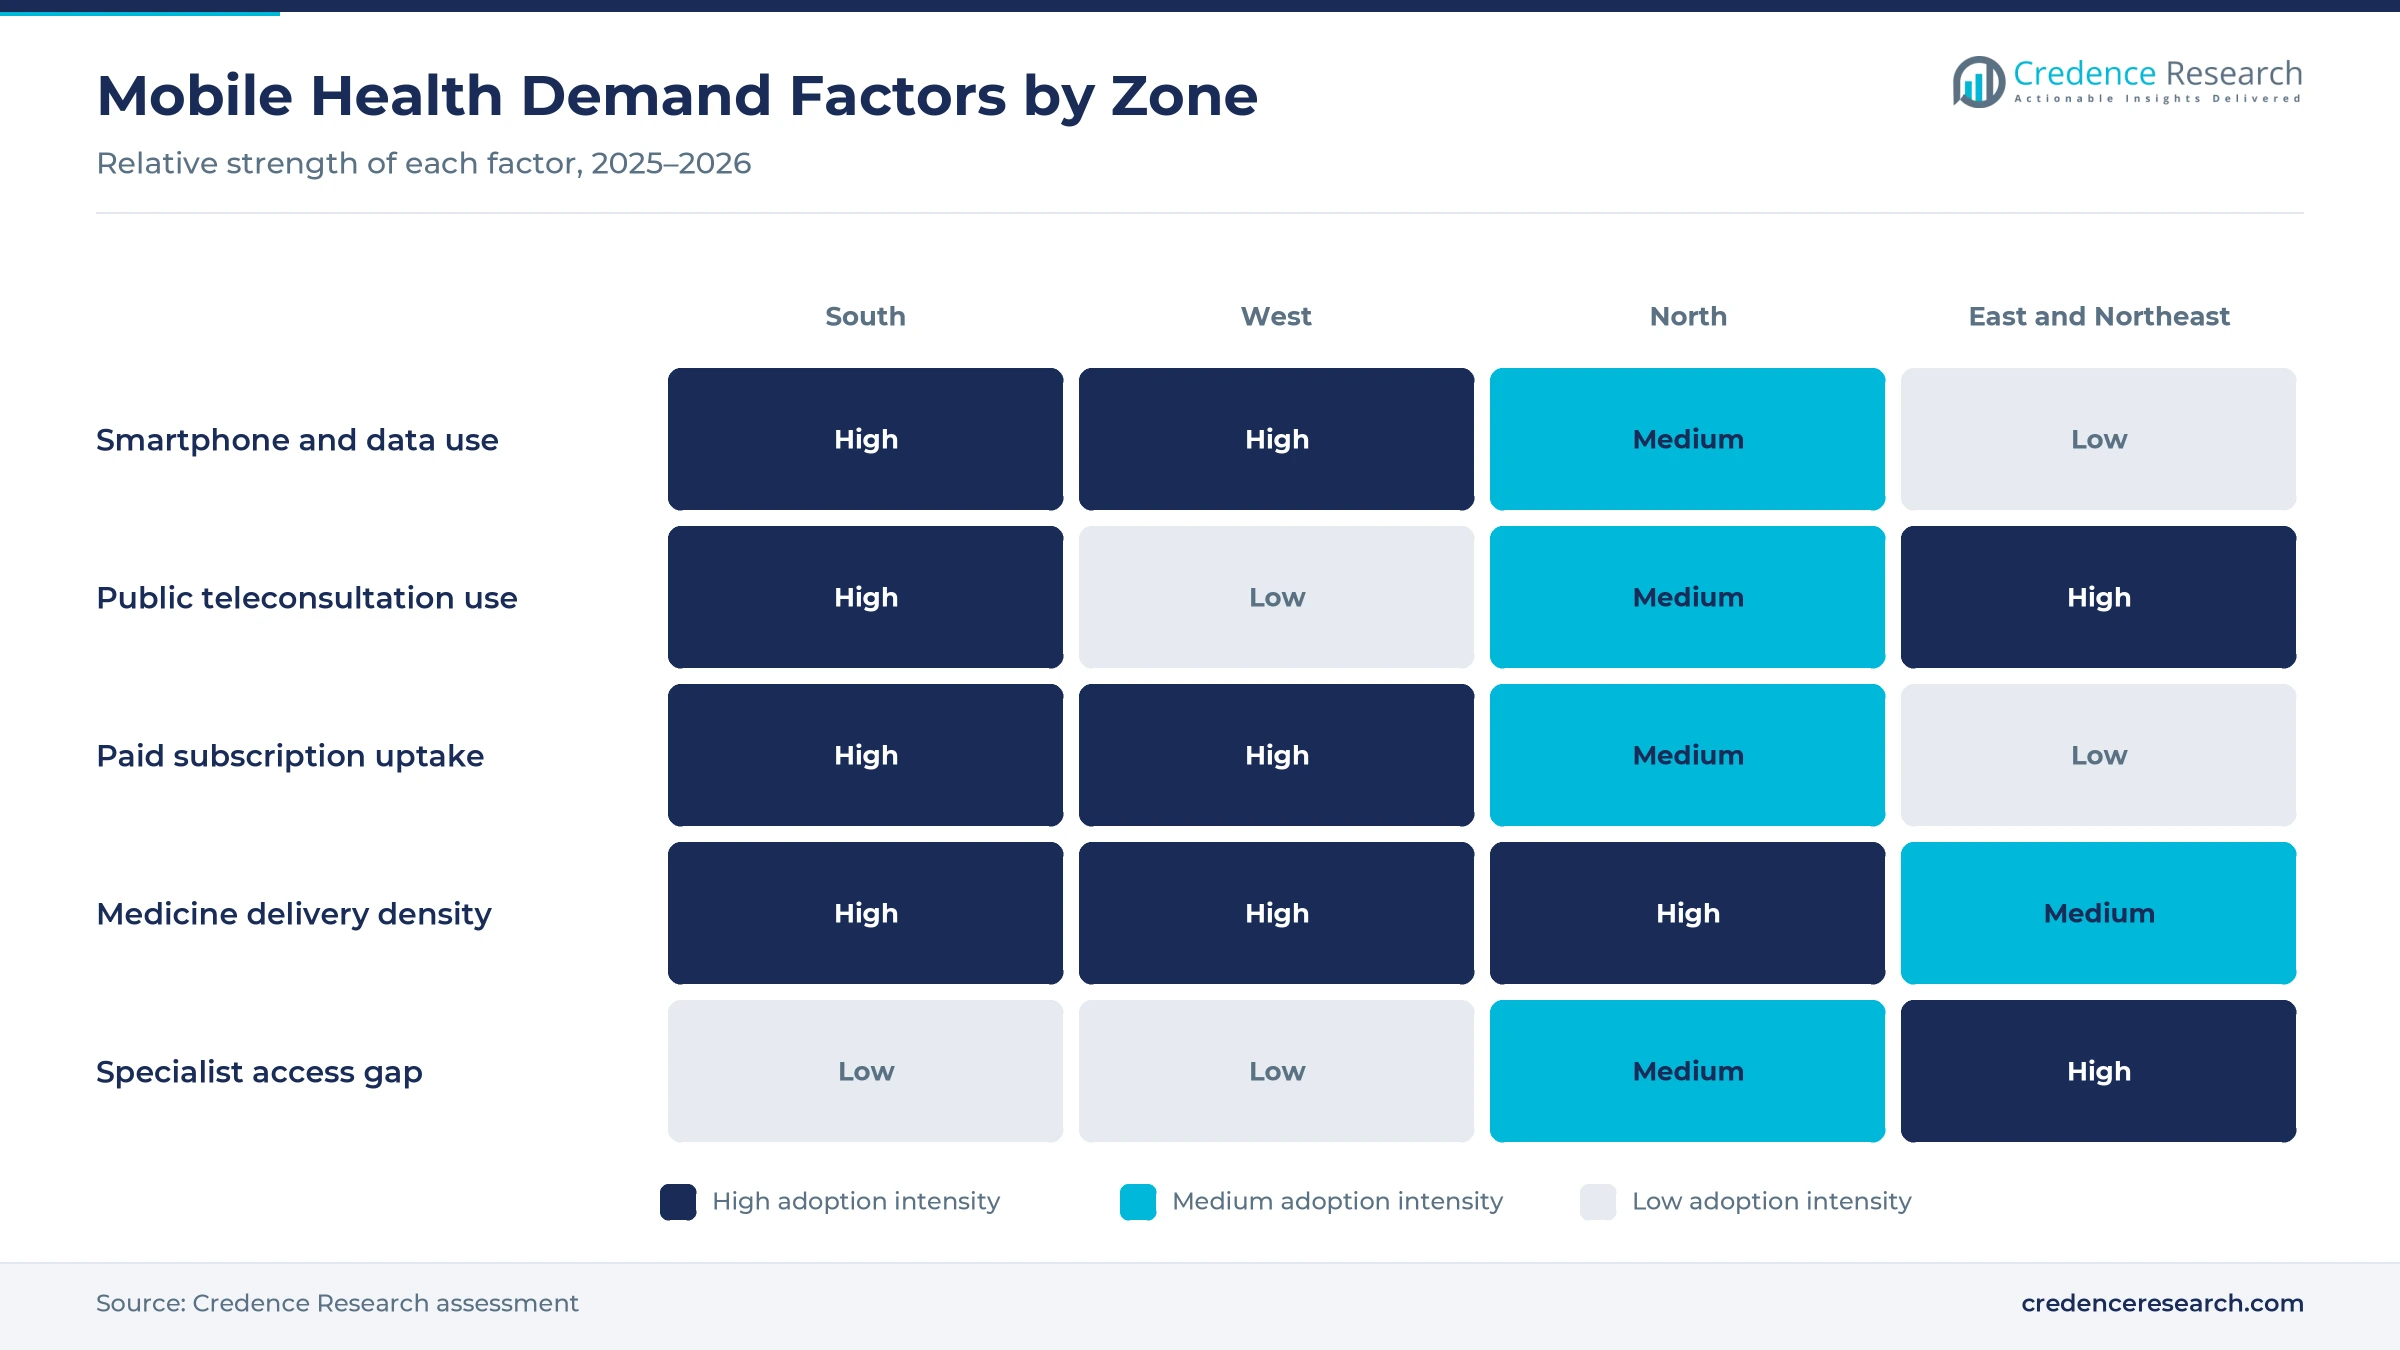
The India m-health apps market was valued at USD 2.14 billion in 2025 and is projected to increase from USD 2.50 billion in 2026 to USD 10.00 billion by 2035, registering a CAGR of 16.65% during 2026–2035. Demand comes from more than 111 crore internet subscribers, a national digital health backbone and wider acceptance of remote consultations, medicine delivery and fitness coaching on smartphones. South India held the largest regional share, 33.0% in 2025, because southern states combine high smartphone use with strong uptake of public teleconsultation. East and Northeast India grows fastest at 17.63% a year, as health services reach districts with fewer specialists and longer travel times. The Digital Personal Data Protection Rules, 2025, notified in November 2025, now set clear consent and breach notice duties for health platforms. AI assistants that speak Indian languages are also widening use among first-time users in smaller towns.
Which mobile health services are counted in this estimate?
The estimate measures consumer and institutional spending on mobile health applications in India, including medicine ordering and delivery, teleconsultation, fitness and wellness coaching, and chronic disease management. It counts platform commissions and service fees, paid subscriptions and advertising and partnership income earned through these applications. Values are stated in USD million at current prices, converted from Indian rupees at average annual exchange rates.
The estimate excludes the value of medicines, laboratory tests and doctor fees that pass through a platform to a pharmacy, laboratory or clinician. It also excludes hospital information systems, standalone wearable hardware and public platforms that charge no fee. The value chain runs from developers and cloud hosts through doctors, pharmacies and labs to patients, employers and insurers.
India M-Health Apps Market Insights
- The India m-health apps market was valued at USD 2.14 billion in 2025 and is projected to reach USD 10.00 billion by 2035, registering a CAGR of 16.65% during 2026–2035.
- South India held 33.0% of 2025 value, because southern states pair high smartphone use with strong uptake of public teleconsultation services.
- E-pharmacy and medicine delivery apps led with 31.0% of 2025 value, since repeat medicine orders create frequent and predictable use.
- More than 104 crore health records were linked to over 93 crore ABHA accounts by July 2026, which eases record sharing across platforms.
- Chronic disease management apps grow fastest at 17.95% a year during 2026–2035, as pharma partners add AI coaching to obesity care.
Medicine delivery and consumer users carry most of the value
Why do medicine delivery platforms lead mobile health spending?
Based on app type, the market is categorized into e-pharmacy and medicine delivery apps, fitness and wellness apps, teleconsultation apps and chronic disease management apps. E-Pharmacy and Medicine Delivery Apps led with 31.0% of 2025 value, because monthly refills for diabetes, blood pressure and thyroid care create steady orders. Chronic Disease Management Apps grow fastest at 17.95% a year, as pharma partners and AI coaching tools add daily tracking between clinic visits.
Why do transaction fees still outweigh subscriptions?
Based on revenue model, the market is categorized into transaction fees and commissions, subscriptions and advertising and partnerships. Transaction Fees and Commissions led with 52.0% of 2025 value, because most platforms earn a margin on each medicine order, test booking or consultation. Subscriptions grow fastest at 17.53% a year, as users pay for coaching plans, care programs and premium AI features.
Why do individual consumers account for most of the value?
Based on end user, the market is categorized into individual consumers, healthcare providers and employers and insurers. Individual Consumers led with 68.0% of 2025 value, because patients and families download and pay for most services directly. Employers and Insurers grow fastest at 17.80% a year, as companies add teleconsultation, fitness and chronic care benefits to staff and policyholder programs.
| Segment Group | Leading Sub-segment | Share, 2025 | Fastest-growing Sub-segment | CAGR, 2026–2035 |
|---|---|---|---|---|
| By App Type | E-Pharmacy and Medicine Delivery Apps | 31.0% | Chronic Disease Management Apps | 17.95% |
| By Revenue Model | Transaction Fees and Commissions | 52.0% | Subscriptions | 17.53% |
| By End User | Individual Consumers | 68.0% | Employers and Insurers | 17.80% |
Request a Free Sample
Fill in your details and we'll send you a free sample report.
- Sample data tables & charts
- Research methodology
Mobile reach, ABHA and remote visits lift daily app use
How does a large mobile and broadband base lift adoption?
A large mobile and broadband access base lifts adoption, because most health sessions in India begin on a low-cost smartphone. India had more than 111.41 crore internet subscribers at the end of June 2026, up from about 109.28 crore at the end of March 2026, according to TRAI data reported by News On AIR. Wireless connections made up about 106.64 crore of that base, while tele-density rose to 94.31% in the same quarter. World Bank data also show that internet use rose from 43.4% of the population in 2020 to 70% in 2025. As a result, individual consumers hold 68.0% of 2025 value, and many first-time users reach health services through mobile data before they use any other channel.
Why does national digital health infrastructure matter?
National digital health infrastructure supports growth, because shared IDs, registries and consent rails cut the cost of connecting platforms to hospitals, labs and pharmacies. More than 104 crore health records were linked to over 93 crore Ayushman Bharat Health Accounts by July 2026, according to a government factsheet. The same factsheet said over 23.21 crore ABHA-linked scan and share tokens had been issued by June 18, 2026, which cut hospital queue times to a few minutes. Digital solution companies had also received more than Rs 26 crore under the Digital Health Incentive Scheme by that date. In turn, platforms that plug into these rails can offer records, lab reports and prescriptions in one place, which raises repeat use.
How has remote clinical access become routine?
Remote clinical access has become routine for many patients, because public and private platforms have made audio and video consultations familiar. The government eSanjeevani service passed 50 crore teleconsultations on Sept. 15, 2026, according to GKToday. It now handles about 2.5 to 3 lakh consultations a day through 19,473 hubs and more than 1.42 lakh spokes, and women account for 57.14% of use. Practo said it had onboarded more than 500,000 verified doctors and served over 50 million patients globally in FY2024-25. Consequently, teleconsultation apps gain from patients who already trust remote doctor visits for routine follow-ups and prescription renewals.
Why do high out-of-pocket costs favor online pharmacies?
High out-of-pocket health spending pushes households toward price comparison, home delivery and bundled diagnostics on mobile platforms. Out-of-pocket payments made up 43.9% of current health expenditure in India in 2023, according to World Bank data. Tata 1mg said in May 2026 that its medicine delivery reached more than 20,000 pincodes, while its diagnostics labs operated in over 60 cities. The company also ran more than 280 pharmacy stores and planned about 500 outlets within 12 months. As a result, e-pharmacy and medicine delivery apps led with 31.0% of 2025 value, and transaction fees and commissions remain the main revenue model with 52.0%.
AI coaching, chronic care and omnichannel models gain ground
How is the shift to AI assistants in Indian languages playing out?
Health platforms are shifting toward AI assistants that speak Indian languages, because many new users prefer voice and mixed-language input. Healthify upgraded its Ria assistant on Dec. 2, 2025, with live voice conversations and camera-based food logging, according to TechCrunch. Ria supports more than 50 languages, including 14 Indian languages, and handles Hinglish. Healthify said it had more than 45 million registered users at the time. The government eSanjeevani platform also works in 15 languages, which shows that public services are adapting in the same way. In turn, subscriptions grow fastest among revenue models at 17.53% a year, as users pay for coaching and AI features.
Why are chronic care programs rising on mobile platforms?
The rise of chronic care programs is reshaping mobile health, because obesity, diabetes and heart risk need daily tracking between clinic visits. Novo Nordisk India and Healthify launched an AI-enabled patient support program for people living with obesity in December 2025. The program pairs GLP-1 medicines with dietitian-guided coaching, nutrition tracking and lifestyle guidance. Ria also pulls data from glucose, sleep and fitness trackers, which helps users act on glucose spikes. Citizens aged 46 and above made up 40% of eSanjeevani consultations, which shows strong demand from older patients. Practo named AI-led outcomes as one of three strategic pillars in August 2025. As a result, chronic disease management apps grow fastest at 17.95% a year during 2026–2035, and pharma partnerships become a new source of income.
Can omnichannel pharmacy and diagnostics models open new demand?
Omnichannel care offers a clear opening, because buyers want online ordering backed by nearby stores, labs and fast delivery. Tata 1mg said in May 2026 that all its core businesses turned EBITDA positive in December 2025 and that its e-pharmacy reached breakeven during the year. It runs 18 accredited labs and plans to expand into radiology and specialized testing. API Holdings, the parent of PharmEasy, repaid Rs 1,050 crore of term debt and set September 2027 as the target for profitability outside Thyrocare. Therefore, platforms that link neighborhood pharmacy chains with mobile ordering can lift basket size, repeat visits and test bookings.
Will privacy-ready consent design create an opening?
Privacy-ready design is a second opening, because new data rules reward platforms that earn trust with clear consent and fast responses. India notified the Digital Personal Data Protection Rules, 2025 on Nov. 14, 2025, with an 18-month window for phased compliance. The rules require a separate, plain-language notice for each purpose and a response to access, correction or erasure requests within 90 days. They also allow India-based consent managers that let people give, review or withdraw consent on one platform. As a result, platforms built on ABHA consent flows can win employer, insurer and hospital partners, and employers and insurers grow fastest among end users at 17.80% a year.
Privacy rules, access gaps and thin margins weigh on growth
How do new data rules raise compliance costs?
Compliance costs are rising, because the Digital Personal Data Protection Rules require clear notices, breach alerts and faster handling of user requests. Smaller developers must redesign consent screens, log data use and inform affected users without delay after a breach. These steps add legal, security and engineering costs before a product earns income. In turn, some startups may delay new features or seek partners with stronger compliance teams, while larger platforms spread these costs across more users.
Why do digital access gaps still limit reach?
Digital access gaps still limit reach, because about 30% of the population was not using the internet in 2025, according to World Bank data. Older adults, low-income rural households and many women have less access to smartphones, data and digital skills. As a result, many patients still rely on assisted models, such as health workers who connect them to doctors through public hubs. Developers must design for low bandwidth, voice input and shared devices to reach these groups.
How does profitability pressure weigh on platforms?
Profitability pressure weighs on the sector, because discounts, delivery costs and doctor fees leave thin margins for many platforms. API Holdings has tied any decision on a PharmEasy listing to reaching a profitability target by September 2027. Tata 1mg reported that its core businesses turned EBITDA positive only in December 2025. Consequently, investors now favor models with repeat purchases, subscriptions and enterprise contracts over heavy consumer discounts that may not last.
Why do clinical quality and trust remain hurdles?
Clinical quality and trust remain a hurdle, because patients cannot always judge doctor credentials, advice quality or medicine sources on a phone screen. Wrong advice or delayed referrals can harm patients and damage platform reputations quickly. Therefore, leading platforms verify doctors and publish ratings, while public rails such as the Healthcare Professionals Registry add another check. Clear escalation paths to in-person care also reduce risk for patients with complex or urgent conditions.
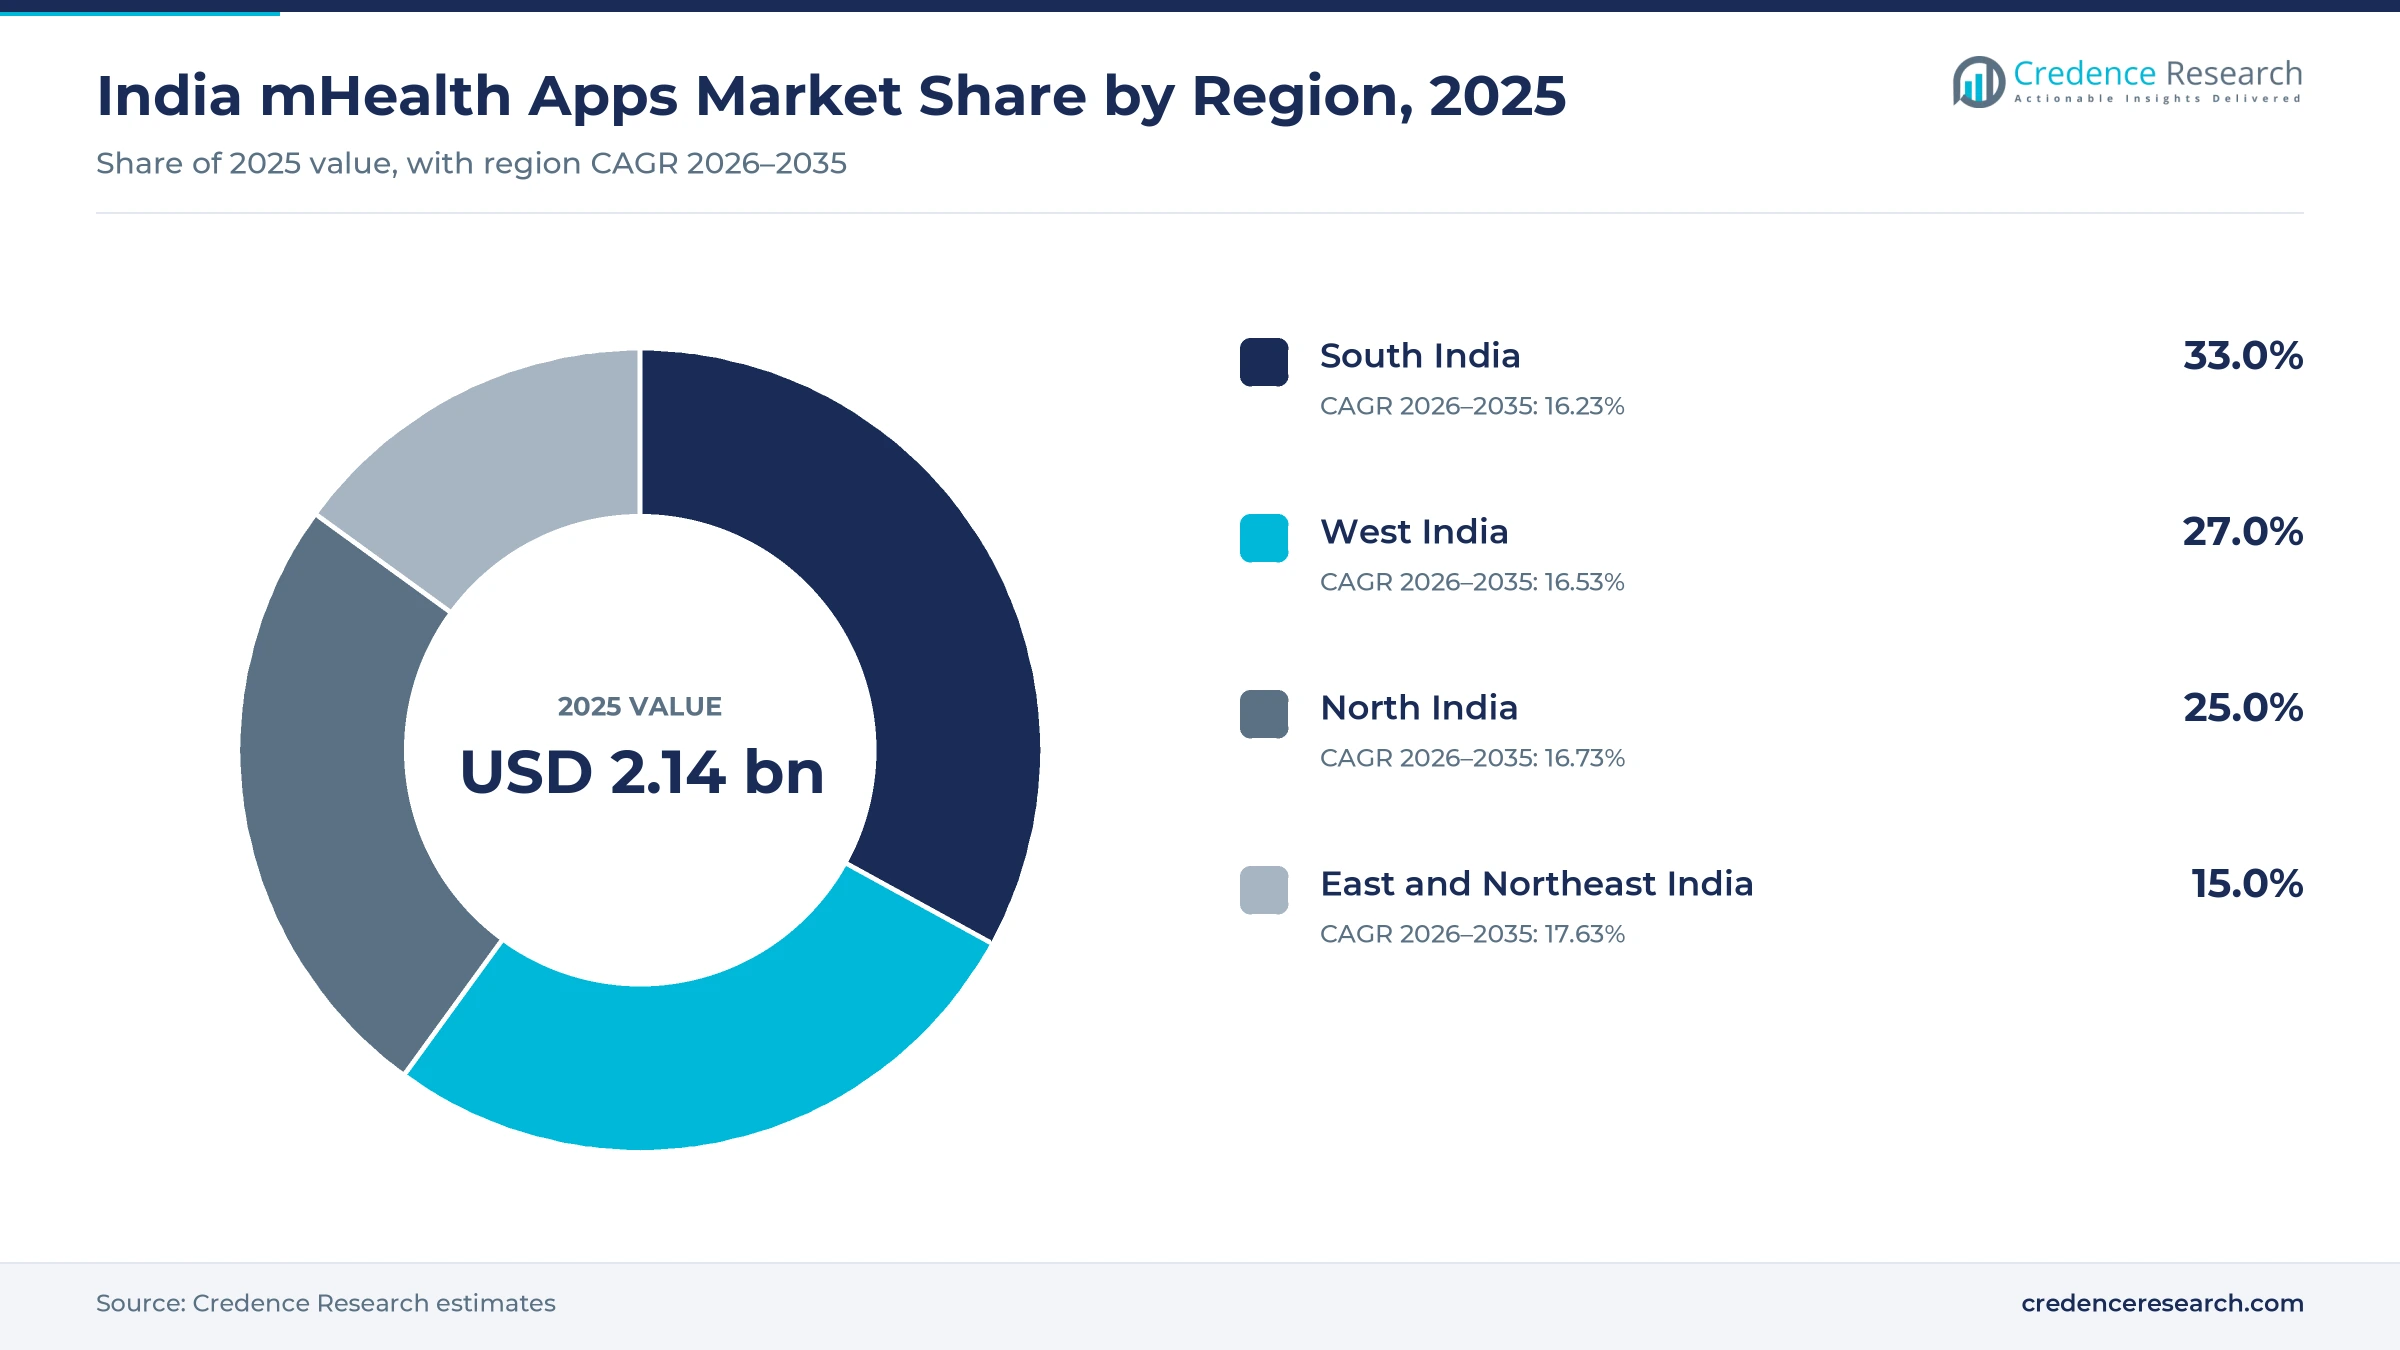
South India leads while the east and northeast grow fastest
| Region | Value, 2025 (USD billion) | Share, 2025 | CAGR, 2026–2035 |
|---|---|---|---|
| South India | 0.71 | 33.0% | 16.23% |
| West India | 0.58 | 27.0% | 16.53% |
| North India | 0.54 | 25.0% | 16.73% |
| East and Northeast India | 0.32 | 15.0% | 17.63% |
How does early teleconsultation uptake keep the south ahead?
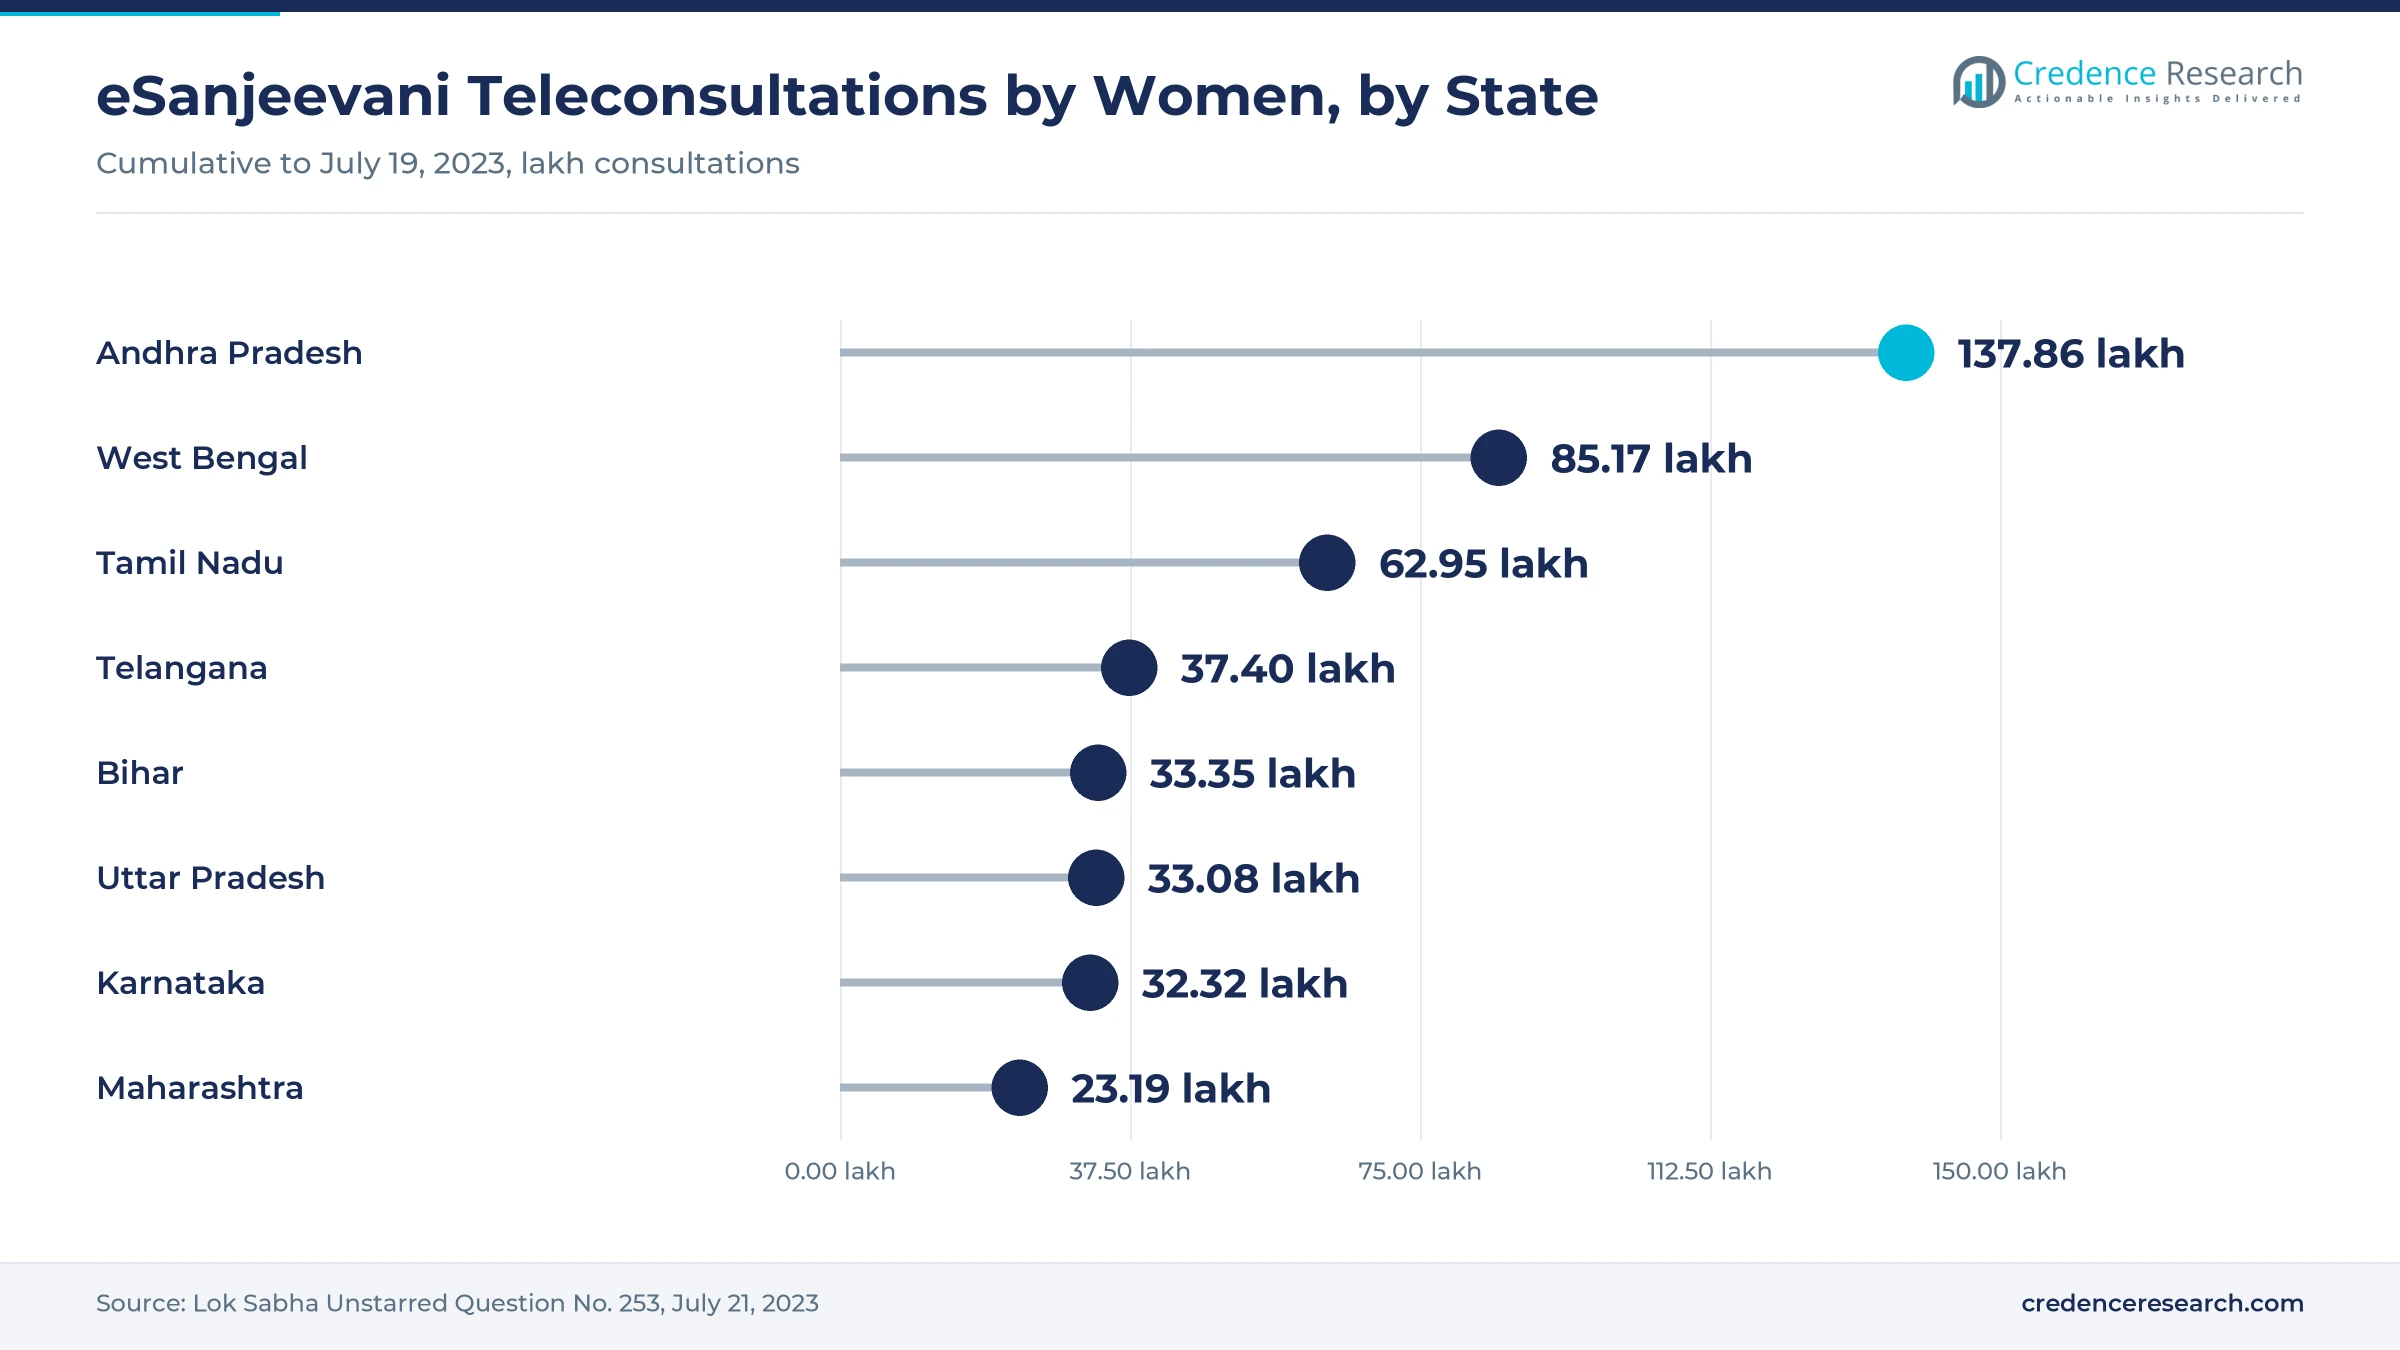
South India held 33.0% of 2025 value and grows at 16.23% a year, because southern states combine high smartphone use with early adoption of public teleconsultation. Andhra Pradesh recorded 137.86 lakh eSanjeevani consultations by women by July 19, 2023, the highest of any state in a Lok Sabha reply. Tamil Nadu, Telangana and Karnataka added 62.95 lakh, 37.40 lakh and 32.32 lakh in the same count. Bengaluru is also home to Practo, which now treats India, the UAE and the U.S. as its key markets.
Why do western cities favor paid pharmacy and diagnostics services?
West India is the second-largest region, with 27.0% of 2025 mobile health demand. The region grows at 16.53% a year, because Maharashtra and Gujarat have large urban populations with high spending on private care. Maharashtra recorded 23.19 lakh eSanjeevani consultations by women and Gujarat 11.71 lakh by July 19, 2023, below the leading southern states. Private medicine delivery and diagnostics platforms compete hard in large western cities, where dense delivery routes keep order costs lower and repeat orders frequent.
How do NCR and populous northern states add users?
North India held 25.0% of 2025 mobile health demand, a share close to that of the west. The region grows at 16.73% a year, because Delhi NCR, Uttar Pradesh, Punjab and Haryana hold a very large base of mobile users. Tata 1mg is based in Gurugram and delivers medicines to more than 20,000 pincodes across the country. Uttar Pradesh recorded 33.08 lakh eSanjeevani consultations by women by July 19, 2023. As a result, demand mixes wellness subscriptions in NCR with basic teleconsultation and medicine orders in smaller towns.
Why are east and Northeast India growing fastest?
The east and northeast form the smallest but fastest-growing region in the mobile health market. East and Northeast India held 15.0% of 2025 value and grows fastest at 17.63% a year, because many districts have fewer specialists and longer travel times to hospitals. West Bengal recorded 85.17 lakh eSanjeevani consultations by women and Bihar 33.35 lakh by July 19, 2023. Therefore, public teleconsultation hubs and low-cost medicine delivery give private platforms a path to first-time users.
Data rules, AI launches and teleconsult milestones
| Development | Status and market relevance |
|---|---|
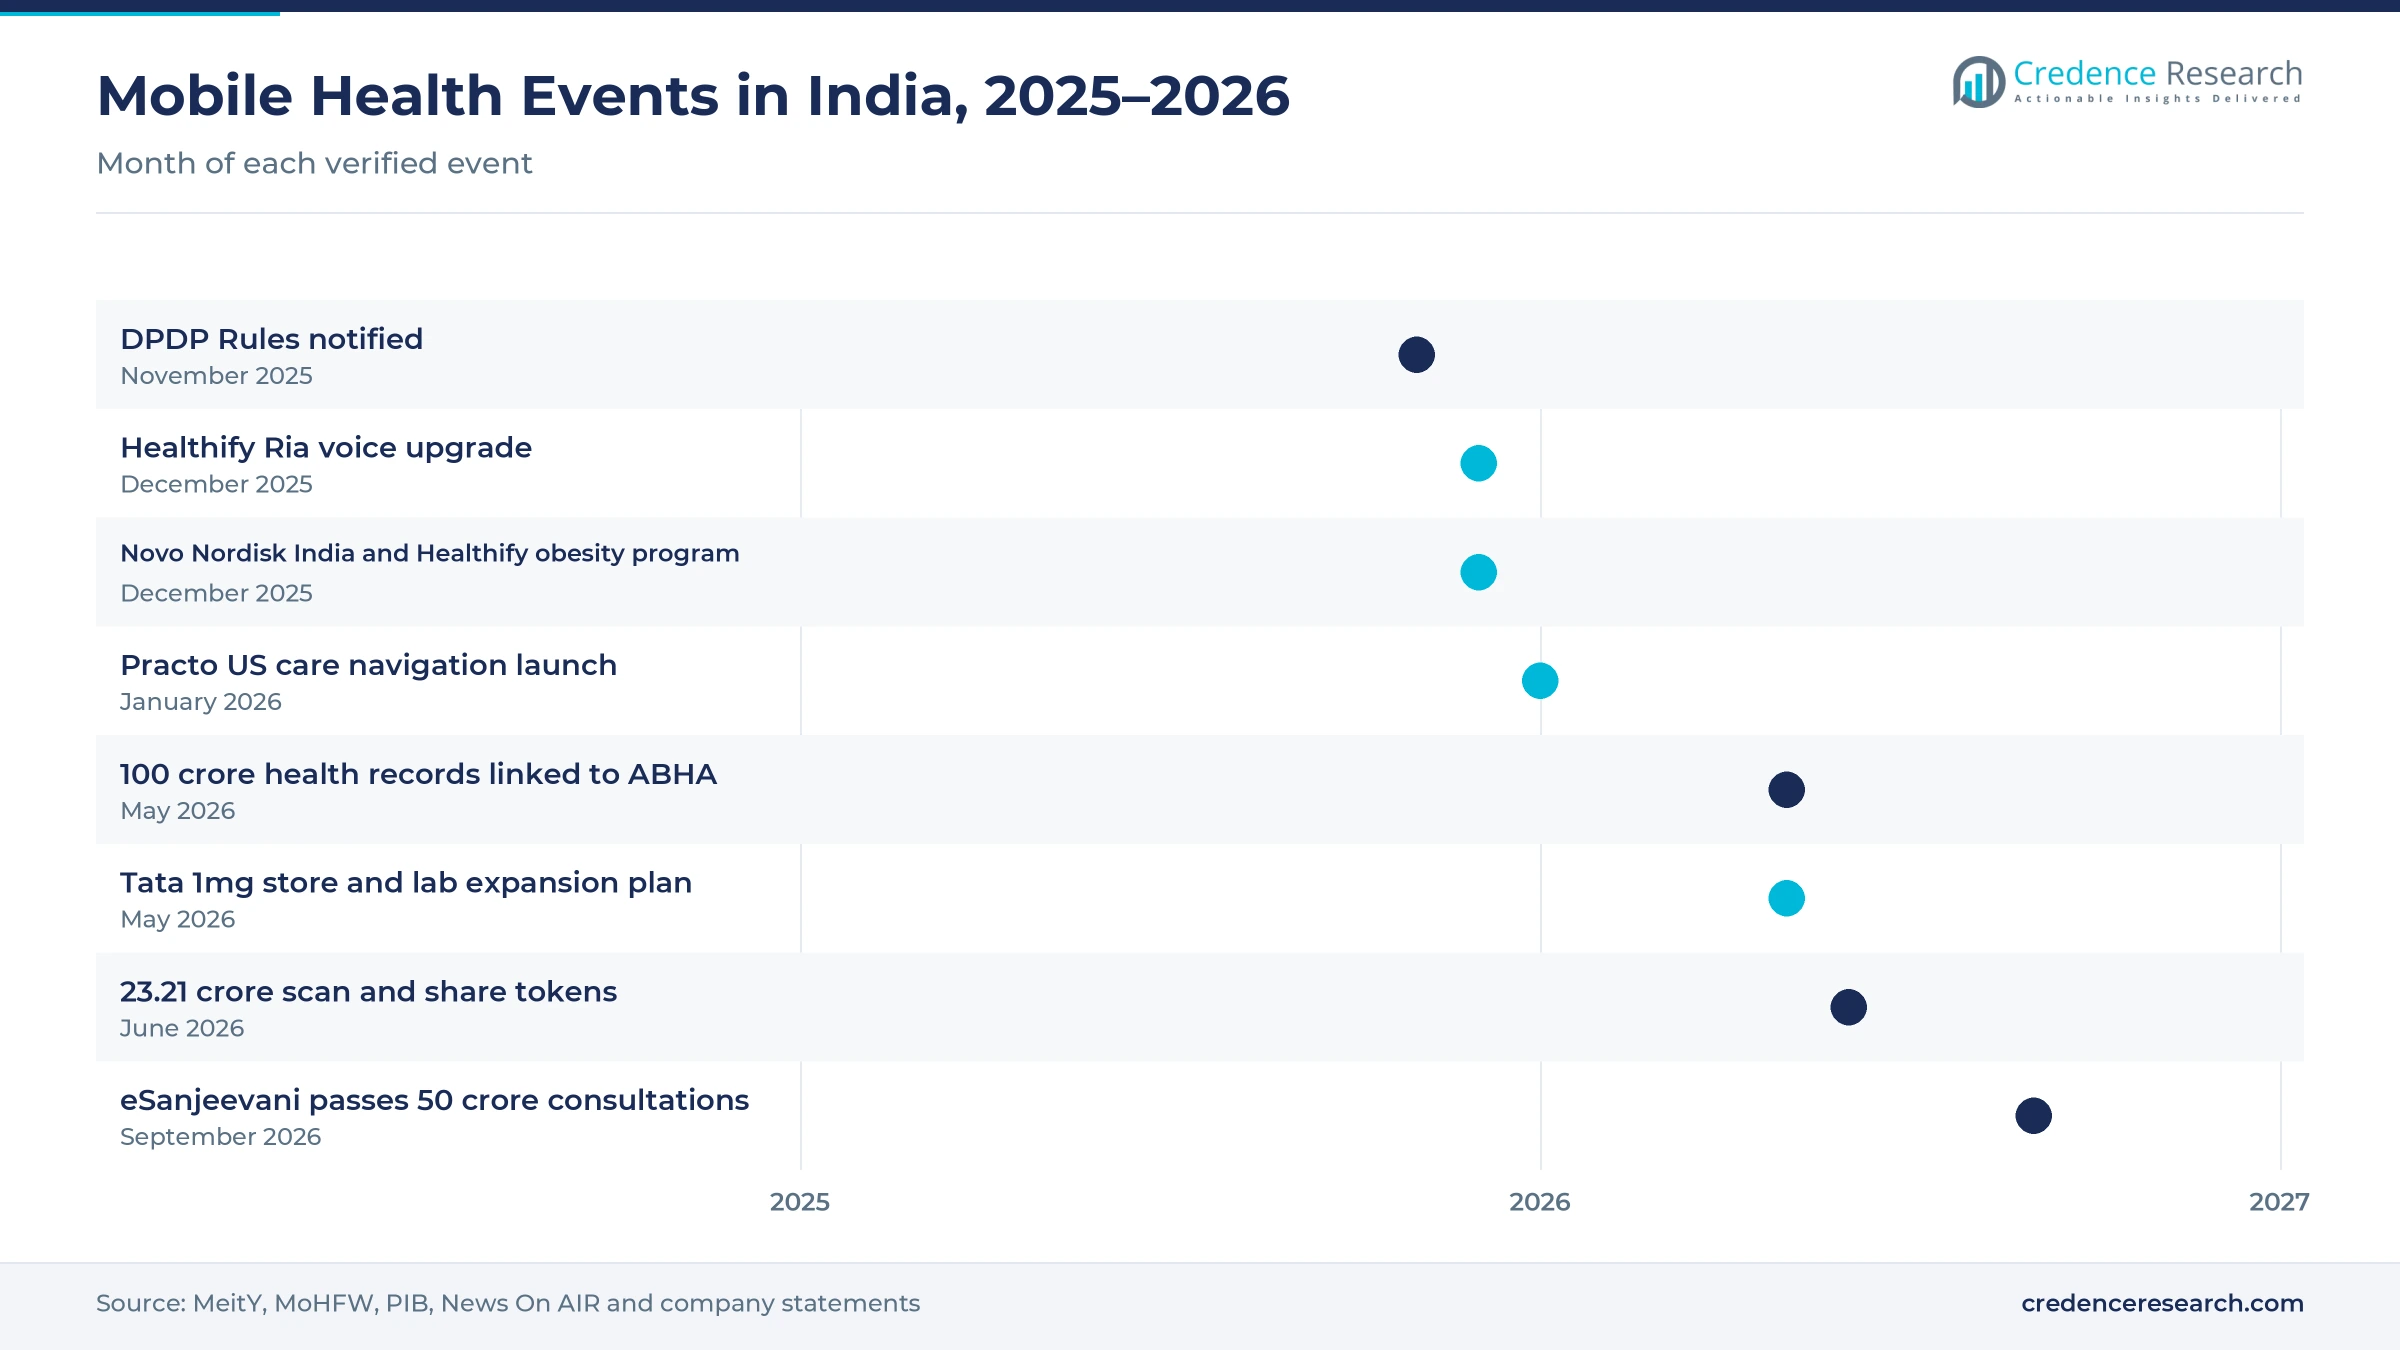
| In November 2025, India notified the Digital Personal Data Protection Rules, 2025, with an 18-month phased compliance window. | Sets consent, notice and breach duties for health platforms |
| In December 2025, Healthify upgraded its Ria AI assistant with live voice conversations in more than 50 languages. | Includes 14 Indian languages and camera-based food logging |
| In December 2025, Novo Nordisk India and Healthify launched an AI-enabled support program for people living with obesity. | Pairs GLP-1 therapy with dietitian-guided coaching |
| In May 2026, Tata 1mg announced that its core businesses had turned EBITDA positive and that it planned about 500 stores. | Expands omnichannel pharmacy and diagnostics reach |
| In September 2026, eSanjeevani crossed 50 crore teleconsultations across all states and union territories. | Handles about 2.5 to 3 lakh consultations a day |
Consent rails, QR check-in and AI assistants change use
- ABHA-linked consent and records let platforms pull lab reports and prescriptions from hospitals with patient approval, which removes repeat tests and paperwork.
- Scan and share QR check-in lets patients register at hospital counters by scanning a code, which cut waiting times from about an hour to a few minutes in one study.
- AI voice assistants let users log meals, ask questions and plan exercise in Indian languages and Hinglish, which widens use beyond English speakers.
- Tracker and glucose sensor integration feeds sleep, activity and glucose data into personal health tracking tools so coaches can respond to spikes and missed goals quickly.
Need a Custom Version of This Report?
Tailor the scope, geography, or segments to your exact requirements.
- Custom geography or segment scope
- Direct access to our analyst team
Pharmacy, consultation and fitness platforms vie on reach
Competition is led by large e-pharmacy, consultation and fitness platforms, with new pressure from public services that are free at the point of use. Tata 1mg combines medicine delivery, accredited labs and a growing store network, which gives it reach in more than 20,000 pincodes. PharmEasy, owned by API Holdings, competes in medicine delivery and diagnostics and has cut debt while it works toward a profitability target. Practo focuses on doctor discovery, appointments and consultations, and it now also serves the UAE and U.S. HealthifyMe competes in nutrition, fitness and chronic care through AI coaching and pharma partnerships. Apollo HealthCo runs Apollo 24/7, which combines medicine delivery, home lab tests and consultations with more than 2,200 doctors across 55-plus specialties. Companies compete on delivery speed, doctor networks, language support, ABHA integration and price, while larger groups link these services with broader mobile health solutions.
Companies profiled and their roles in this market
| Company | Type | Role in the market |
|---|---|---|
| Tata 1mg | Domestic company (Tata Digital) | Medicine delivery to 20,000+ pincodes; 18 accredited labs; 280+ stores |
| API Holdings Limited (PharmEasy) | Domestic company | Medicine delivery and diagnostics; repaid Rs 1,050 crore of term debt |
| Practo Technologies Private Limited | Domestic company | 500,000+ verified doctors; Bengaluru-based; India, UAE and U.S. focus |
| HealthifyMe Wellness Private Limited | Domestic company | Ria AI assistant in 14 Indian languages; obesity program with Novo Nordisk India |
| Apollo HealthCo Limited (Apollo 24/7) | Domestic company (Apollo group) | Medicine delivery, home lab tests and 2,200+ doctors across 55+ specialties |
Credence Research view on chronic care and trusted consent
Credence Research's view is that India m-health apps will move from discount-led growth to value-led growth through 2035, as chronic care, subscriptions and enterprise contracts take a larger share. More than 93 crore ABHA accounts and 50 crore public teleconsultations show that patients are ready for digital care at scale. However, platforms must turn this reach into repeat paid use while they meet new data protection duties. Medicine delivery should keep the largest share, while chronic care programs add the most new value.
How the mobile health spending estimate was built
The report uses 2025 as the base year, with values in USD million at current prices. Market values come from the Credence Research model, which combines internet users, active platform users, order frequency, subscription uptake and average fees. Regional zones and segment splits by app type, revenue model and end user are Credence Research estimates. Sources used are government factsheets, parliamentary replies, telecom data, World Bank data, company statements and news reports, and no interviews or surveys were used.
Chronic care and eastern demand set the path to 2035
The market is expected to reach USD 10.00 billion by 2035, a 16.65% CAGR during 2026–2035, as more patients order medicines, consult doctors and manage chronic conditions on their phones. Growth should be strongest in East and Northeast India and in chronic disease management, while South India keeps the largest share. ABHA records and consent rails should make it easier to share data across platforms. In contrast, slow progress on data protection compliance or a return to heavy discounting would weaken margins and slow investment.
Frequently Asked Questions
How big is the India m-health apps market?
Which region leads mobile health spending in India?
Which region grows fastest?
How does ABHA support mobile health platforms?
Which app type holds the largest share?
Which app type grows fastest?
Who are the leading companies in mobile health in India?
What are the main risks to growth?
Table of Content
Chapter 1 Market Segmentation
- 1.1 Segmentation Framework
- 1.1.1 Product and Service Classification
- 1.1.2 Application and End-Use Classification
- 1.1.3 Technology and Solution Classification
- 1.1.4 Customer and Distribution Channel Classification
- 1.1.5 Geographic Segmentation
- 1.1.6 Market Segment Definitions and Boundaries
- 1.2 By App Type
- 1.2.1 E-Pharmacy and Medicine Delivery Apps
- 1.2.2 Fitness and Wellness Apps
- 1.2.3 Teleconsultation Apps
- 1.2.4 Chronic Disease Management Apps
- 1.3 By Revenue Model
- 1.3.1 Transaction Fees and Commissions
- 1.3.2 Subscriptions
- 1.3.3 Advertising and Partnerships
- 1.4 By End User
- 1.4.1 Individual Consumers
- 1.4.2 Healthcare Providers
- 1.4.3 Employers and Insurers
Chapter 2 Introduction
- 2.1 Report Objectives and Scope
- 2.2 Product Definition and Industry Terminology
- 2.3 Market Inclusions and Exclusions
- 2.4 Research Process
- 2.4.1 Primary Research and Expert Interviews
- 2.4.2 Secondary Research and Source Review
- 2.4.3 Top-Down and Bottom-Up Estimation
- 2.4.4 Data Triangulation and Verification
- 2.5 Market Size Measurement Basis
- 2.5.1 2025: USD 2.14 billion → 2035: USD 10.00 billion
- 2.6 Historical and Forecast Reference Periods
- 2.6.1 Historical Period: 2018-2025
- 2.6.2 Base Year: 2025
- 2.6.3 Forecast Period: 2025-2035
- 2.7 Research Assumptions and Limitations
Chapter 3 Executive Summary
- 3.1 Market Snapshot and Key Findings
- 3.2 Base-Year Market Size, 2025
- 3.3 Forecast Market Size, 2035
- 3.4 Revenue and Volume Growth Outlook
- 3.5 Key Demand and Supply Indicators
- 3.6 Leading Market Segments
- 3.7 Fastest-Growing Market Opportunities
- 3.8 Regional Performance Highlights
- 3.9 Technology and Industry Transformation
- 3.10 Competitive Landscape Summary
- 3.11 Analyst View and Strategic Implications
Chapter 4 India M-Health Apps Market Trends and Developments
- 4.1 Historical Industry Development, 2018-2025
- 4.2 Recent Market Trends and Developments
- 4.3 Demand and Customer Behavior Trends
- 4.4 Technology and Product Innovation
- 4.5 Artificial Intelligence, Automation and Digitalization
- 4.6 Local Manufacturing and Supply Chain Realignment
- 4.7 Industry Partnerships, Mergers and Acquisitions
- 4.8 Sustainability and Circular Economy Developments
- 4.9 Government and Private Sector Investment Trends
- 4.10 Emerging Business Models and Commercialization
- 4.11 Industry Developments and Announcements
Chapter 5 India M-Health Apps Market Production, Supply and Demand Analysis
- 5.1 Demand Trend and Consumption Analysis, 2018-2025
- 5.2 Demand Forecast, 2025-2035
- 5.3 Production and Output Trend, 2018-2025
- 5.4 Production and Output Forecast, 2025-2035
- 5.5 Installed Capacity and Capacity Utilization
- 5.6 Company-Wise Production Plants and Statistics
- 5.6.1 Installed Production Capacity
- 5.6.2 Actual Production
- 5.6.3 Planned Capacity and Expansion Targets
- 5.7 Supply Chain Structure and Procurement Trends
- 5.8 Supply-Demand Gap and Bottlenecks
- 5.9 Import Dependence and Sourcing Structure
- 5.10 Contract Manufacturing and Outsourcing
- 5.11 Regional Supply and Demand Concentration
Chapter 6 India M-Health Apps Market Pricing Analysis
- 6.1 Pricing Structure and Measurement
- 6.2 Historical Pricing Trends, 2018-2025
- 6.3 Pricing Outlook, 2025-2035
- 6.4 Average Selling Price and Unit Economics
- 6.5 Pricing by Product and Market Segment
- 6.6 Geographic Pricing Differences
- 6.7 Key Input, Energy, Labor and Logistics Costs
- 6.8 Contract Pricing and Purchasing Models
- 6.9 Pricing Sensitivity and Competitive Positioning
- 6.10 Price, Margin and Profitability Implications
Chapter 7 India M-Health Apps Market Dynamics
- 7.1 Market Growth Drivers
- 7.1.1 Demand-Side Drivers
- 7.1.2 Technology and Innovation Drivers
- 7.1.3 Infrastructure and Investment Drivers
- 7.1.4 Regulatory and Policy Drivers
- 7.2 Market Restraints
- 7.2.1 Cost and Affordability Constraints
- 7.2.2 Technology and Adoption Barriers
- 7.2.3 Supply Chain and Operational Constraints
- 7.3 Market Challenges
- 7.3.1 Competitive Pressure and Margin Erosion
- 7.3.2 Skills, Infrastructure and Implementation Gaps
- 7.4 Emerging Market Opportunities
- 7.5 Market Dynamics Impact and Time-Horizon Assessment
Chapter 8 India M-Health Apps Value Chain Analysis
- 8.1 Industry Value Chain Overview
- 8.2 Upstream Suppliers and Critical Inputs
- 8.3 Technology and Component Providers
- 8.4 Manufacturing or Service Delivery
- 8.5 Distribution, Channel Partners and Integrators
- 8.6 Downstream Applications and End Users
- 8.7 Value Addition and Profit Pools
- 8.8 Vertical Integration and Outsourcing
- 8.9 Supplier Concentration and Risk
- 8.10 Supply Chain Localization and Resilience
Chapter 9 India M-Health Apps Market Regulations and Policies
- 9.1 Relevant Laws, Standards and Compliance Frameworks
- 9.2 Product, Service, Safety and Quality Requirements
- 9.3 Government Policies, Incentives and Subsidies
- 9.4 Imports, Exports and Trade Barriers
- 9.5 Public Procurement and Local Content Requirements
- 9.6 Environmental and Sustainability Compliance
- 9.7 Upcoming Policy Changes and Market Implications
Chapter 10 India M-Health Apps Market Hotspots and Opportunities
- 10.1 Market Opportunity Mapping and Growth Hotspots
- 10.2 High-Growth Applications and Customer Groups
- 10.3 Underserved Markets and White-Space Opportunities
- 10.4 Emerging Technology and Product Opportunities
- 10.5 New Capacity and Investment Hotspots
- 10.6 Market Entry and Expansion Opportunities
- 10.7 Distribution and Partnership Opportunities
- 10.8 Near-Term and Long-Term Commercial Potential
- 10.9 Opportunity Attractiveness and Execution Risks
Chapter 11 India M-Health Apps Market Outlook, 2025-2035
- 11.1 Market Size and Analysis
- 11.1.1 Revenue (Market Measurement: 2025: USD 2.14 billion → 2035: USD 10.00 billion)
- 11.1.2 Market Volume and Quantity Sold
- 11.1.3 Historical Market Size, 2018-2025
- 11.1.4 Base-Year Market Size, 2025
- 11.2 Market Forecast, 2025-2035
- 11.2.1 Revenue Forecast to 2035
- 11.2.2 Volume Forecast to 2035
- 11.2.3 CAGR and Year-on-Year Growth
- 11.2.4 Incremental Revenue Opportunity
- 11.3 Forecast Assumptions and Scenario Analysis
- 11.3.1 Base-Case Forecast
- 11.3.2 Optimistic and Conservative Scenarios
- 11.3.3 Technology, Pricing and Policy Sensitivities
- 11.4 Market Attractiveness and Growth Outlook
Chapter 12 India M-Health Apps Market Segmentation and Outlook
- 12.1 Segmentation Summary and Market Shares, 2025
- 12.2 Largest and Fastest-Growing Segments
- 12.3 By App Type - Market Size and Forecast, 2025-2035
- 12.3.1 Segment Definition and Scope
- 12.3.2 Historical Market Size, 2018-2025
- 12.3.3 Revenue Forecast, 2025-2035
- 12.3.4 Volume Forecast, 2025-2035
- 12.3.5 Base-Year Market Share, 2025
- 12.3.6 Segment CAGR and Growth Drivers
- 12.3.7 Subsegment Market Size and Forecast
- 12.3.7.1 E-Pharmacy and Medicine Delivery Apps
- 12.3.7.2 Fitness and Wellness Apps
- 12.3.7.3 Teleconsultation Apps
- 12.3.7.4 Chronic Disease Management Apps
- 12.3.8 Subsegment Pricing and Adoption Trends
- 12.3.9 Leading Suppliers and Competition
- 12.3.10 Regional Demand and Opportunities
- 12.4 By Revenue Model - Market Size and Forecast, 2025-2035
- 12.4.1 Segment Definition and Scope
- 12.4.2 Historical Market Size, 2018-2025
- 12.4.3 Revenue Forecast, 2025-2035
- 12.4.4 Volume Forecast, 2025-2035
- 12.4.5 Base-Year Market Share, 2025
- 12.4.6 Segment CAGR and Growth Drivers
- 12.4.7 Subsegment Market Size and Forecast
- 12.4.7.1 Transaction Fees and Commissions
- 12.4.7.2 Subscriptions
- 12.4.7.3 Advertising and Partnerships
- 12.4.8 Subsegment Pricing and Adoption Trends
- 12.4.9 Leading Suppliers and Competition
- 12.4.10 Regional Demand and Opportunities
- 12.5 By End User - Market Size and Forecast, 2025-2035
- 12.5.1 Segment Definition and Scope
- 12.5.2 Historical Market Size, 2018-2025
- 12.5.3 Revenue Forecast, 2025-2035
- 12.5.4 Volume Forecast, 2025-2035
- 12.5.5 Base-Year Market Share, 2025
- 12.5.6 Segment CAGR and Growth Drivers
- 12.5.7 Subsegment Market Size and Forecast
- 12.5.7.1 Individual Consumers
- 12.5.7.2 Healthcare Providers
- 12.5.7.3 Employers and Insurers
- 12.5.8 Subsegment Pricing and Adoption Trends
- 12.5.9 Leading Suppliers and Competition
- 12.5.10 Regional Demand and Opportunities
- 12.6 Segment Growth Comparison
- 12.7 Segment Attractiveness and Priority Matrix
Chapter 13 India M-Health Apps End-Use and Application Market Outlook
- 13.1 End-Use Industry and Customer Demand Structure
- 13.2 Leading Applications and Customer Groups
- 13.3 End-Use Market Size, Share and Forecast
- 13.4 Major End-Use Industry Deep Dives
- 13.4.1 Customer Requirements and Use Cases
- 13.4.2 Demand and Replacement Cycles
- 13.4.3 Technical and Regulatory Considerations
- 13.4.4 Purchasing and Procurement Models
- 13.4.5 Leading Vendors and Distribution Channels
- 13.4.6 Forecast and Commercial Opportunities
- 13.5 Emerging Applications and Cross-Segment Demand
- 13.6 End-Use Industry Investment Priorities
Chapter 14 India M-Health Apps Geographic Market Outlook, 2025-2035
- 14.1 Regional Market Size and Country-Level Shares, 2025
- 14.2 Country Market Size Comparison, 2025
- 14.3 Country Market Forecasts, 2025-2035
- 14.4 Subregional Industrial and Demand Clusters
- 14.5 Intra-Regional Pricing and Cost Differences
- 14.6 Cross-Border Trade and Supply Networks
- 14.7 Regional Supply and Demand Balances
- 14.8 Country Opportunity Comparison and Prioritization
Note: Every listed country is covered on the structure shown under the first country.
Chapter 15 India M-Health Apps Technology, Innovation and Sustainability Outlook
- 15.1 Technology Landscape and Maturity
- 15.2 Product, Process and Service Innovation
- 15.3 AI, Automation and Digital Tools in the Industry
- 15.4 Technology Adoption and Performance Benchmarking
- 15.5 Innovation Pipeline and R&D Investment
- 15.6 Patent and Intellectual Property Trends
- 15.7 Energy Efficiency and Resource Management
- 15.8 Sustainability, Recycling and Circularity
- 15.9 Technology Roadmap, 2025-2035
- 15.10 Risks of Obsolescence and Technology Substitution
Chapter 16 India M-Health Apps Market Key Strategic Imperatives
- 16.1 Growth and Market Entry Priorities
- 16.2 High-Return Products and Segments
- 16.3 Pricing, Profitability and Cost Optimization
- 16.4 Technology Investment and Product Differentiation
- 16.5 Supply Chain Localization and Resilience
- 16.6 Distribution and Customer Acquisition
- 16.7 Partnership, Acquisition and Capacity Strategy
- 16.8 Regional Expansion Priorities
- 16.9 Short-, Medium- and Long-Term Actions
Chapter 17 Competition Outlook
- 17.1 Industry Competition Characteristics
- 17.2 Market Structure and Concentration
- 17.3 Market Share and Competitive Positioning, 2025
- 17.4 Company-Wise Revenue and Product Benchmarking
- 17.5 Production and Service Capacity Benchmarking
- 17.6 Technology, Pricing and Differentiation
- 17.7 Regional Footprint and Distribution Strength
- 17.8 Mergers, Acquisitions and Strategic Alliances
- 17.9 New Entrants and Competitive Threats
- 17.10 Porter's Five Forces and Industry Attractiveness
- 17.11 Competitive Outlook, 2025-2035
Chapter 18 Company Profiles
- 18.1 Company Coverage and Selection Criteria
- 18.2 Tata 1mg
- 18.2.1 Business Description
- 18.2.2 Company Ownership and Geographic Presence
- 18.2.3 Product and Service Portfolio
- 18.2.4 Manufacturing and Operating Footprint
- 18.2.5 Production Capacity and Expansion Plans
- 18.2.6 Financial Performance and Investment
- 18.2.7 Market Share and Competitive Position
- 18.2.8 Technology and Innovation Capabilities
- 18.2.9 Strategic Alliances or Partnerships
- 18.2.10 Recent Developments
- 18.2.11 Growth Strategy and Outlook
- 18.3 API Holdings Limited (PharmEasy)
- 18.4 Practo Technologies Private Limited
- 18.5 HealthifyMe Wellness Private Limited
- 18.6 Apollo HealthCo Limited (Apollo 24/7)
- 18.7 Other Relevant Market Participants
Note: Every listed company is profiled on the structure shown under the first company. The company list is preliminary and may change based on research findings, market developments, data availability and client requirements.
Chapter 19 Disclaimer
- 19.1 Research and Forecast Disclaimer
- 19.2 Data Source and Estimation Limitations
Note: The depth of individual sections depends on data availability for this market. Volume, capacity, trade and other unit-based metrics are included where applicable.

