
Steel Rebar Market Overview:
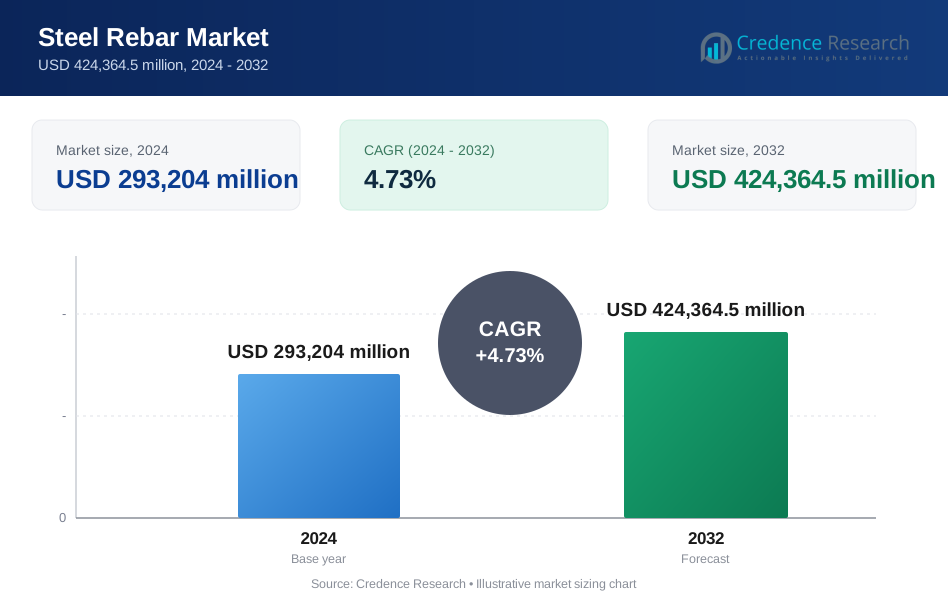
The Steel Rebar Market size was valued at USD 293,204 million in 2024 and is anticipated to reach USD 424,364.5 million by 2032, growing at a CAGR of 4.73% during the forecast period.
| REPORT ATTRIBUTE | DETAILS |
|---|---|
| Historical Period | 2020-2024 |
| Base Year | 2025 |
| Forecast Period | 2026-2032 |
| Steel Rebar Market Size 2024 | USD 293,204 million |
| Steel Rebar Market, CAGR | 4.73% |
| Steel Rebar Market Size 2032 | USD 424,364.5 million |
Steel Rebar Market Insights
- Infrastructure expansion across Asia Pacific, Latin America, and the Middle East is the primary growth driver, with governments investing heavily in roads, bridges, and railways requiring high volumes of rebar.
- Growing demand for earthquake-resistant and corrosion-resistant rebars is reshaping product innovation trends, especially in seismic zones and coastal infrastructure projects.
- ArcelorMittal, Nucor, Tata Steel, and POSCO lead the competitive landscape, focusing on capacity expansion, ESG compliance, and EAF-based production to gain a strategic edge.
- Asia Pacific dominates with over 60% market share, while public infrastructure accounts for the largest segment at over 45%, yet the market faces restraints from raw material price volatility and tight emission regulations in steelmaking regions.
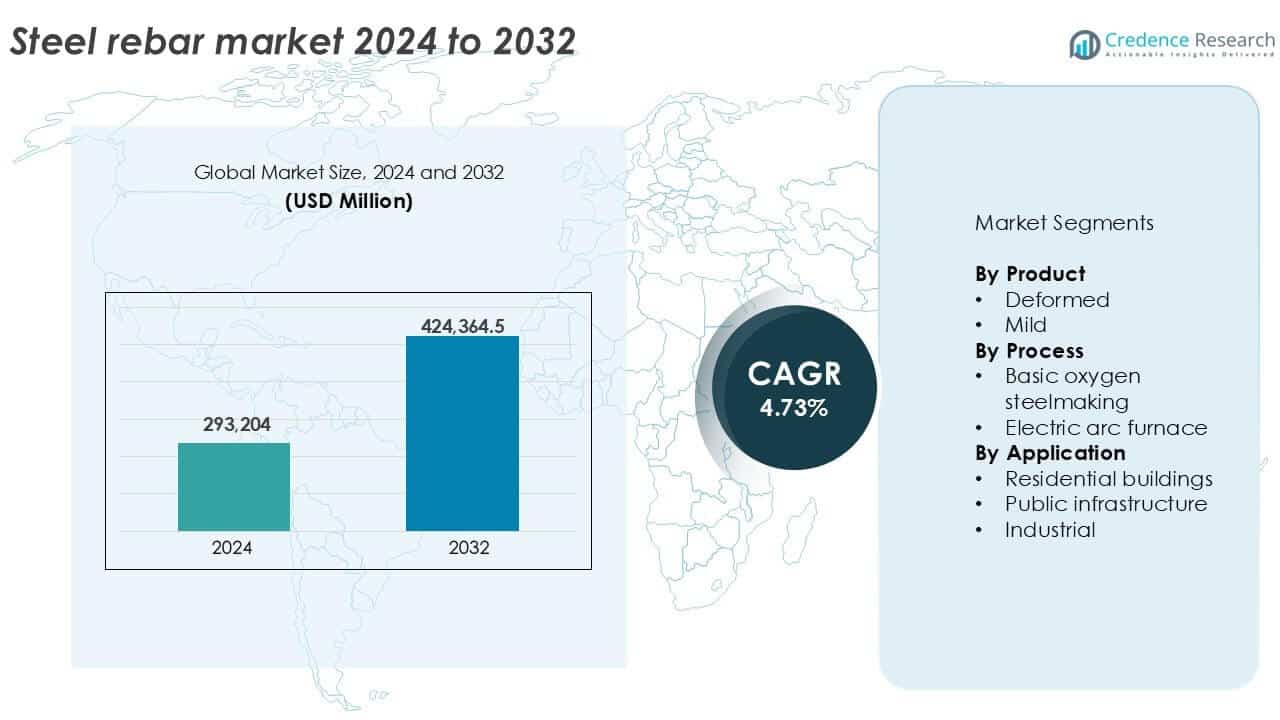
Steel Rebar Market Segmentation Analysis:
By Product
The deformed rebar segment holds the dominant share in the steel rebar market, accounting for over 85% of global demand. Deformed bars offer superior tensile strength and bonding with concrete due to their ridged surface, making them ideal for structural applications. Their high load-bearing capacity and resistance to slippage drive widespread adoption in construction. Mild steel bars, while still used in low-stress structures, are declining in preference due to lower strength and bond performance. Increasing infrastructure investments and seismic zone construction drive consistent demand for deformed rebars worldwide.
- For instance, grade 250 MPa mild steel rebars exhibit lower yield strength compared to high‑yield deformed grades, reducing load capacity.
By Process Basic oxygen steelmaking (BOS) leads the steel rebar market with a dominant production share of nearly 60%. This process offers high-volume output at relatively low cost, making it suitable for large-scale rebar manufacturing. BOS is preferred in regions with integrated steel plants and access to iron ore. However, the electric arc furnace (EAF) segment is gaining traction due to its use of recycled scrap and lower carbon footprint. EAF is increasingly adopted in developed regions emphasizing decarbonization. Government policies supporting green steel production further enhance EAF’s growth outlook.
- For instance, modern BOS furnaces can convert a 400‑ton charge of molten iron into steel in less than 40 minutes per batch, enabling large‑scale rebar feedstock production.
By Application
Public infrastructure is the leading application segment, contributing over 45% of total steel rebar consumption. This dominance stems from extensive use in roads, bridges, airports, and rail networks that demand high-strength structural reinforcement. Governments worldwide continue to allocate large budgets for infrastructure modernization and urban development, boosting rebar demand. The residential segment follows, supported by rising housing construction in emerging economies. Industrial construction, while smaller, shows steady growth driven by factory and warehouse expansion aligned with manufacturing and logistics sector growth.
Key Growth Drivers
Expanding Infrastructure Development Across Emerging Economies
Rapid urbanization and industrial growth in Asia-Pacific, Latin America, and Africa are fueling large-scale infrastructure investments. Governments in countries like India, China, and Indonesia are allocating significant budgets toward roadways, bridges, metros, and airports. For example, India's National Infrastructure Pipeline (NIP) outlines over 7,000 projects across transport, energy, and urban development. These public works rely heavily on steel rebar for structural reinforcement, driving long-term consumption. Rebar is also critical in earthquake-prone areas where high ductility and strength are required. Urban population growth leads to housing expansion, further increasing demand. Additionally, projects supported by public-private partnerships (PPPs) and foreign direct investment (FDI) accelerate rebar usage in developing nations. As economies build resilient, modern infrastructure, steel rebar remains a foundational material supporting sustainable growth.
- For instance, more than 13,000 projects are identified under India’s National Infrastructure Pipeline covering transport, urban, and energy sectors, with a projected investment of approximately ₹185 trillion as of 2025.
Government Mandates on Seismic-Resistant Construction Materials
Strict building codes and safety regulations are pushing demand for high-strength deformed steel rebars. Countries in seismic zones—such as Japan, Turkey, Mexico, and parts of the U.S.—enforce standards that require materials offering superior structural integrity under stress. Authorities promote the use of thermo-mechanically treated (TMT) rebars with high ductility and bendability to prevent collapse during earthquakes. Regulatory shifts in countries like Nepal and Indonesia after recent seismic events have accelerated rebar replacement and upgrades. Mandatory certifications and quality grading systems such as BIS (India), ASTM (U.S.), and JIS (Japan) further boost demand for certified, high-performance rebars. These policies, combined with rising awareness about structural safety, are driving market players to offer technologically advanced rebar products. Such regulatory enforcement significantly influences procurement patterns and drives continuous replacement cycles in both new construction and retrofitting projects.
- For instance, BIS IS 1786 specifies high‑strength deformed rebars such as Fe 500 and Fe 550 with rib patterns tailored for better anchorage in concrete.
Growing Adoption of Electric Arc Furnace (EAF) Steelmaking
The shift toward sustainable steel production methods is expanding the market for rebars made via electric arc furnaces. EAF technology uses recycled scrap metal, reducing carbon emissions and energy consumption compared to traditional basic oxygen furnace methods. Global decarbonization efforts, including the EU’s Green Deal and China’s emission-reduction targets, are pressuring steelmakers to adopt cleaner processes. As governments introduce carbon pricing and stricter environmental standards, EAF-based production is gaining preference. Major producers like Nucor and ArcelorMittal are investing heavily in EAF-based capacity to align with ESG mandates. The recyclability of steel used in EAF helps create a circular economy model, which appeals to sustainability-conscious construction firms. Moreover, advancements in scrap sorting and melting efficiency are making EAF processes more cost-competitive, especially in regions with reliable electricity and abundant scrap supplies. This transition boosts the supply of green steel rebars in the market.
Key Trends & Opportunities
Rising Demand for Earthquake-Resistant and Corrosion-Resistant Rebars
As urban density increases in seismic and coastal zones; the market is witnessing higher demand for specialty rebars that enhance structural durability. High-strength rebars with microalloying elements improve ductility, allowing buildings to absorb shocks during seismic events. In parallel, corrosion-resistant rebars such as epoxy-coated, galvanized, or stainless-steel variants are gaining adoption in coastal and high-moisture environments. These rebars prolong structural life and reduce maintenance costs in marine bridges, tunnels, and submerged piers. Project specifications increasingly call for customized grades that meet both structural and environmental challenges. Manufacturers are responding by developing advanced rebar technologies with dual features: seismic resilience and corrosion resistance. This trend opens opportunities for product differentiation and premium pricing in infrastructure projects requiring long service life. Innovation in composite rebars, like basalt fiber or glass fiber rebars, is also gaining traction for lightweight and anti-corrosive applications.
- For instance, epoxy‑coated rebars were first standardized under ASTM A615/A1055 with coating thickness between 7 mils and 12 mils on sizes No. 3–18 to improve corrosion resistance in harsh environments.
Technological Advancements in Rebar Processing and Quality Control
Automation and digitalization in steel processing are improving rebar consistency, traceability, and mechanical performance. Smart rebar production lines equipped with temperature monitoring, online rolling control, and robotic handling are becoming mainstream in modern steel plants. Technologies such as thermo-mechanical treatment (TMT) enhance tensile strength and fatigue resistance without adding weight. Digital tools, including barcoding and rebar tagging, support precise placement and tracking during construction. Contractors benefit from enhanced project planning and inventory management, while engineers ensure structural compliance. Furthermore, rebar couplers and pre-fabricated rebar cages are gaining popularity for simplifying construction on-site, reducing labor time, and increasing safety. These advancements align with the broader shift toward Industry 4.0 in construction and steel manufacturing. Companies investing in smart plants and process optimization are expected to gain a competitive edge by delivering higher quality, customized, and just-in-time rebar solutions.
Key Challenges
Volatility in Raw Material Prices and Supply Chain Disruptions
Fluctuations in raw material prices, particularly for iron ore, scrap steel, and ferroalloys, significantly affect the cost structure of rebar manufacturers. Market players face challenges in maintaining profitability due to unpredictable commodity cycles. Global events such as the Russia-Ukraine conflict, shipping disruptions in the Red Sea, or energy shortages can quickly escalate costs or delay deliveries. High dependence on imported raw materials exposes many countries to currency fluctuations and geopolitical risks. Additionally, environmental regulations around mining and steel production have led to capacity curbs in countries like China, affecting global supply. Manufacturers are often unable to pass on full cost increases to customers in competitive bidding environments. This results in margin pressures, especially for small and mid-sized players. Building a resilient supply chain, improving sourcing strategies, and securing long-term contracts become critical to mitigating raw material-related risks.
Intense Market Competition and Pricing Pressure
The steel rebar market is highly fragmented with the presence of numerous regional and local players, especially in developing countries. Price-sensitive buyers in construction and infrastructure projects often prioritize cost over quality, forcing suppliers to offer aggressive pricing. This intense competition leads to reduced margins, even as input costs rise. Additionally, grey market products and non-standard rebars further erode pricing power and compromise safety standards. Larger players are investing in branding, certifications, and distribution networks to maintain differentiation, but small producers struggle to survive in such a landscape. Price wars are particularly evident during public infrastructure tendering processes. As governments implement stricter quality and compliance mandates, unorganized players face barriers, but transition remains slow. Consolidation through mergers, partnerships, and capacity expansion may be necessary for firms to achieve economies of scale and remain competitive in the long term.
Regional Analysis
Asia Pacific
Asia Pacific dominates the global steel rebar market, holding over 60% of the total market share in 2024. The region’s leadership is driven by massive infrastructure and residential construction projects across China, India, Indonesia, and Vietnam. China remains the largest contributor due to its expansive urban development and public infrastructure programs. India’s rapid urbanization, smart city initiatives, and industrial corridor projects further boost demand. Governments are investing heavily in railways, bridges, and metros, all of which rely on rebar reinforcement. Growing population, industrial expansion, and rising housing needs continue to fuel consistent rebar consumption across the region.
North America
North America accounts for approximately 12% of the global steel rebar market share. The region benefits from infrastructure renovation programs, including bridge restorations, highway upgrades, and airport modernization across the United States and Canada. The U.S. Infrastructure Investment and Jobs Act allocates significant funding to rebuild aging structures using high-quality steel rebar. The region also sees growing demand for seismic-resistant and corrosion-resistant rebars, especially in coastal and earthquake-prone areas. Manufacturers focus on domestic production and low-carbon EAF steel to meet sustainability goals. Demand remains steady, supported by public-private partnerships and strict compliance with ASTM construction standards.
Europe
Europe holds nearly 10% of the steel rebar market share, driven by infrastructure upgrades and strict regulatory frameworks supporting high-performance materials. Countries such as Germany, France, and the UK lead in rebar consumption, with demand linked to energy-efficient buildings and green infrastructure projects. EU climate policies are pushing adoption of low-emission steel, encouraging the use of electric arc furnace-produced rebars. Renovation of old buildings, bridge rehabilitation, and transportation network upgrades are key demand areas. Northern and Western Europe exhibit higher per capita usage, while Eastern Europe is emerging with infrastructure spending aligned with EU cohesion policy funding.
Middle East & Africa (MEA)
The Middle East & Africa region represents about 9% of the global steel rebar market. Demand is driven by large-scale infrastructure and housing projects in countries like Saudi Arabia, UAE, Egypt, and South Africa. Saudi Arabia’s Vision 2030 and the UAE’s real estate developments fuel robust rebar demand for commercial towers, stadiums, and transit systems. Africa is witnessing increased construction activity in urban centers, supported by foreign direct investment and public works programs. MEA also shows growing interest in corrosion-resistant rebar due to harsh desert and coastal environments. Regional rebar production is expanding, particularly in the GCC countries.
Latin America
Latin America contributes around 5% of the global steel rebar market. Brazil and Mexico lead the regional demand due to residential housing growth and public infrastructure investments. Government stimulus for affordable housing and transportation expansion supports moderate but stable rebar consumption. However, market volatility and inconsistent funding limit large-scale expansion. The construction of highways, airports, and energy plants in Colombia, Chile, and Peru also drives demand. Increasing adoption of locally produced rebars and regulatory focus on quality standards is helping formalize the supply chain. While relatively small, the region presents growth opportunities with urbanization and industrial expansion.
Rest of the World
Other smaller regions, including parts of Central Asia, Eastern Europe (non-EU), and island economies, collectively account for the remaining 4% market share. These regions have limited domestic rebar production and rely heavily on imports. Demand stems from scattered infrastructure projects, mining activities, and tourism-related construction. Though growth is comparatively slower, improving political stability and international development funding support rebar consumption in specific markets. Small-scale projects in Central Asian countries and parts of the Caucasus are emerging as niche opportunities. Future growth depends on regional stability, access to construction financing, and better integration with global supply chains.
Steel Rebar Market Segmentations:
By Product
- Deformed
- Mild
By Process
- Basic oxygen steelmaking
- Electric arc furnace
By Application
- Residential buildings
- Public infrastructure
- Industrial
By Geography
- North America
- U.S.
- Canada
- Mexico
- Europe
- Germany
- France
- U.K.
- Italy
- Spain
- Rest of Europe
- Asia Pacific
- China
- Japan
- India
- South Korea
- South-east Asia
- Rest of Asia Pacific
- Latin America
- Brazil
- Argentina
- Rest of Latin America
- Middle East & Africa
- GCC Countries
- South Africa
- Rest of the Middle East and Africa
Competitive Landscape
The global steel rebar market is highly competitive, marked by the presence of multinational giants and regional manufacturers. Leading players such as ArcelorMittal, Nucor, Tata Steel, POSCO, and Nippon Steel dominate with integrated operations and strong global supply chains. These companies focus on capacity expansion, green steel production using electric arc furnaces, and high-strength product development to meet evolving construction standards. Regional leaders like JSW, Gerdau, and HBIS Group maintain a stronghold in emerging markets through cost competitiveness and localized supply. Strategic collaborations, mergers, and acquisitions continue to shape the competitive dynamics. Companies are also investing in automation, ESG compliance, and quality certifications to differentiate in public infrastructure tenders. Price volatility, trade regulations, and environmental policies influence market positioning. Smaller players often compete on pricing and regional distribution, while major firms leverage scale and technological advancement to sustain their leadership.
Key Player Analysis
- ArcelorMittal
- Nucor
- Tata Steel
- POSCO Holdings Inc.
- Nippon Steel Corporation
- JSW Steel
- Gerdau S.A.
- Steel Dynamics, Inc.
- HBIS Group
- Jiangsu Shagang Group
- Commercial Metals Company
- SAIL
- NLMK
- Acerinox S.A.
- Daido Steel Co., Ltd.
Recent Developments
- In November 2023, the month Nippon Steel focused on buying parts from Teck Resources for their needed coking coal for steel production and other needed parts. Nippon Steel remarked that the prices of raw materials and the raw materials themselves, such as iron ore, coal and coking coal, are volatile and such steps will help maintain a smooth supply. This plan is also part of a bigger movement to gain control over other places of supply as Nippon Steel outbids others to gain a 20% share.
- In February 2022. FABco, LLC, a prominent supplier of concrete construction materials and steel rebars, has purchased Volunteer Rebar. This acquisition is expected to help the company accelerate its expansion and provide services to customers in Tennessee, United States.
- In February 2022, Nucor Corporation announced the completion of its acquisition of a majority ownership position in California Steel Industries, Inc. (CSI), transforming CSI into a joint venture business held 51% by Nucor and 49% by JFE Steel. CSI is a flat-rolled steel converter that can generate over two million tons of finished steel and steel products per year.
Report Coverage
The research report offers an in-depth analysis based on Product, Process, Application and Geography. It details leading market players, providing an overview of their business, product offerings, investments, revenue streams, and key applications. Additionally, the report includes insights into the competitive environment, SWOT analysis, current market trends, as well as the primary drivers and constraints. Furthermore, it discusses various factors that have driven market expansion in recent years. The report also explores market dynamics, regulatory scenarios, and technological advancements that are shaping the industry. It assesses the impact of external factors and global economic changes on market growth. Lastly, it provides strategic recommendations for new entrants and established companies to navigate the complexities of the market.
Future Outlook
- Demand for steel rebar will grow steadily due to large-scale infrastructure development in emerging economies.
- Governments will increase investments in earthquake-resilient and climate-adaptive construction.
- Electric arc furnace production will gain momentum as sustainability targets become stricter.
- Corrosion-resistant and high-strength rebars will see wider adoption in marine and industrial structures.
- Asia Pacific will continue to lead global consumption with strong contributions from China and India.
- Public-private partnerships will support rebar demand through long-term construction projects.
- Automation and digital technologies will enhance rebar manufacturing efficiency and quality control.
- Trade policies and regional sourcing will influence supply chain strategies for major players.
- Smaller producers may face pressure to consolidate or upgrade to meet regulatory standards.
- Global rebar demand will increasingly align with green building codes and circular economy principles.
Request a Free Sample
Fill in your details and we'll send you a free sample report.
- Sample data tables & charts
- Research methodology
Need a Custom Version of This Report?
Tailor the scope, geography, or segments to your exact requirements.
- Custom geography or segment scope
- Direct access to our analyst team
Frequently Asked Questions
What is the current market size for Steel Rebar Market, and what is its projected size in 2032?
At what Compound Annual Growth Rate is the Steel Rebar Market projected to grow between 2024 and 2032?
Which Steel Rebar Market segment held the largest share in 2024?
What are the primary factors fueling the growth of the Steel Rebar Market?
Who are the leading companies in the Steel Rebar Market?
Which region commanded the largest share of the Steel Rebar Market in 2024?
Table of Content
Chapter 1. Report Introduction
- 1.1 Report Description & Purpose
- 1.1.1 Report Title & Market Definition
- 1.1.2 Unique Selling Propositions (USP) & Key Differentiators
- 1.1.3 Value Proposition for Stakeholders
- 1.2 Research Objectives
- 1.2.1 Market Sizing Objectives (Volume & Revenue)
- 1.2.2 Segmentation Objectives
- 1.2.3 Competitive Intelligence Objectives
- 1.2.4 Forecast & Scenario Objectives
- 1.3 Report Scope
- 1.3.1 Steel Rebar Scope – Types & Subtypes Covered
- 1.3.2 Geographic Scope – Regions & Countries Covered
- 1.3.3 Historical Period, Base Year & Forecast Period (2024; forecast to 2032)
- 1.3.4 Inclusions & Exclusions
- 1.4 HS Code & Classification Framework
- 1.5 Currency, Units & Pricing Basis
- 1.6 Target Stakeholders
- 1.7 Limitations & Assumptions
Chapter 2. Executive Summary
- 2.1 Global Steel Rebar Market Snapshot
- 2.1.1 Market Size – Historical (2024) & Forecast (2024-2032) (2024: USD 293,204 million → 2032: USD 424,364.5 million)
- 2.1.2 Volume & Revenue – Global Totals
- 2.1.3 Key Market Highlights – Top Five Facts
- 2.2 Steel Rebar Market Segmentation Snapshot
- 2.2.1 Market Split by Region – 2024 vs. 2032
- 2.3 Competitive Snapshot
- 2.3.1 Top 10 Players by Revenue Share – 2024
- 2.3.2 Top 10 Players by Volume Share – 2024
- 2.3.3 Recent Strategic Developments (18-Month Summary)
- 2.4 Key Investment Highlights & Strategic Conclusions
Chapter 3. Steel Rebar Market Dynamics & Industry Analysis
- 3.1 Market Overview & Context
- 3.1.1 Steel Rebar Market Position in the Broader Automotive Value Chain
- 3.1.2 OEM vs. Replacement Market Dynamics
- 3.1.3 Market Maturity & Development Stage by Region
- 3.2 Steel Rebar Market Drivers
- 3.3 Steel Rebar Market Restraints & Challenges
- 3.4 Steel Rebar Market Opportunities
- 3.5 Porter's Five Forces Analysis
- 3.5.1 Threat of New Entrants
- 3.5.2 Bargaining Power of Suppliers
- 3.5.3 Bargaining Power of Buyers
- 3.5.4 Threat of Substitutes
- 3.5.5 Competitive Rivalry – Intensity Assessment
- 3.6 Steel Rebar Value Chain Analysis
- 3.6.1 Upstream – Raw Material/Input Suppliers
- 3.6.1.1 Raw Material/Input 1
- 3.6.1.2 Raw Material/Input 2
- 3.6.1.3 Raw Material/Input 3
- 3.6.2 Midstream – Production/Manufacturing/Service Delivery
- 3.6.2.1 Production/Process Overview
- 3.6.2.2 Key Facility Locations & Capacity by Manufacturer
- 3.6.3 Downstream – Distribution & End Consumer
- 3.6.3.1 Primary Channel – B2B/OEM
- 3.6.3.2 Secondary Channels – Dealer, Retail, Online, Direct
- 3.6.4 Value Chain Profitability Analysis
- 3.6.1 Upstream – Raw Material/Input Suppliers
- 3.7 PESTEL Analysis
- 3.7.1 Political Factors
- 3.7.2 Economic Factors
- 3.7.3 Social Factors
- 3.7.4 Technological Factors
- 3.7.5 Environmental Factors
- 3.7.6 Legal Factors
- 3.8 Steel Rebar Supply Chain Analysis
- 3.8.1 Raw Material/Input Supply Risk Assessment
- 3.8.2 Manufacturing Concentration Risk (Geographic Exposure)
- 3.8.3 Trade Disruption Impact Analysis
- 3.9 Regulatory & Policy Landscape
Note: The regulatory and policy landscape section covers regulations based on their applicability to the market, Steel Rebar category, geography, and scope of the study. Only regulatory frameworks with a material impact on operations, compliance, trade, sustainability, or market access are analyzed in detail.
Chapter 4. Key Investment Pockets & Opportunity Analysis
- 4.1 Steel Rebar Market Attractiveness Analysis
- 4.1.1 By Region – Investment Attractiveness Matrix (Volume × CAGR)
- 4.2 Absolute Revenue Growth Opportunity
- 4.2.1 By Region – Absolute USD Growth Through 2032
- 4.3 Incremental Volume Opportunity
- 4.3.1 By Region – Incremental Volume Through 2032
- 4.3.2 Segment – Incremental Volume
- 4.4 Emerging Submarket Opportunity Deep Dive (Subject to Applicability)
- 4.5 Emerging Market Opportunity Scorecards
- 4.5.1 United States
- 4.5.2 Europe
- 4.5.3 Asia
- 4.5.4 Middle East & Africa
Note: Emerging Market Opportunity Scorecards will be included based on relevance and strategic importance. Regions listed are indicative and may vary depending on data availability and market dynamics.
Chapter 5. Steel Rebar Import-Export Analysis & Trade Flows
- 5.1 Global Trade Overview
- 5.1.1 Global Export Value by Country (2024)
- 5.1.2 Global Export Volume by Country (2024)
- 5.1.3 Global Import Value by Country (2024)
- 5.1.4 Global Import Volume by Country (2024)
- 5.1.5 Net Trade Balance by Country (2024)
- 5.2 Export Analysis – Segment
- 5.2.1 Type 1 (HS Code)
- 5.2.2 Type 2 (HS Code)
- 5.2.3 Type 3 (HS Code)
- 5.2.4 Type 4 (HS Code)
- 5.2.5 Type 5 (HS Code)
- 5.3 Import Analysis – Segment
- 5.3.1 Type 1 (HS Code)
- 5.3.2 Type 2 (HS Code)
- 5.3.3 Type 3 (HS Code)
- 5.3.4 Type 4 (HS Code)
- 5.3.5 Type 5 (HS Code)
- 5.4 Average Unit Trade Prices
- 5.4.1 Average Export Price – Segment & Country
- 5.4.2 Average Import Price – Segment & Source Country
- 5.4.3 Price Trends (2024)
- 5.5 Key Trade Route Analysis
- 5.5.1 Trade Route 1
- 5.5.2 Trade Route 2
- 5.5.3 Trade Route 3
- 5.5.4 Trade Route 4
- 5.5.5 Trade Route 5
- 5.6 Trade Policy Impact Assessment
- 5.6.1 US Anti-Dumping & Section 301 Tariffs
- 5.6.2 EU Customs Union Impact
- 5.6.3 Major Free Trade Agreements
- 5.6.4 USMCA Rules of Origin
Note: Trade policy analysis will be included only where relevant to the Steel Rebar market.
Chapter 6. Competitive Landscape & Company Benchmarking
- 6.1 Steel Rebar Market Concentration & Structure
- 6.1.1 Herfindahl-Hirschman Index (HHI) – vs. 2024
- 6.1.2 Tier 1, Tier 2 & Tier 3 Market Structure
- 6.1.3 Global, Regional & Local Player Dynamics
- 6.2 Steel Rebar Market Share Analysis – 2024
- 6.2.1 Global Revenue Share by Company
- 6.2.2 Global Volume Share by Company
- 6.2.3 Regional Revenue Share
- 6.2.4 Market Share Evolution ( vs. 2024)
- 6.2.5 OEM Segment Share by Company
- 6.2.6 Replacement Segment Share by Company
- 6.3 Production/Delivery Capacity & Facility Analysis
- 6.3.1 Global Installed Capacity
- 6.3.2 Capacity Utilization Rates
- 6.3.3 Production/Output Volume
- 6.3.4 Facility Locations & Capacity Map
- 6.3.5 Planned Capacity Additions
- 6.4 Steel Rebar Competitive Benchmarking Matrix
- 6.4.1 Revenue, Volume, CAGR & Profitability Comparison
- 6.4.2 Channel Revenue Mix
- 6.4.3 Geographic Revenue Exposure
- 6.4.4 R&D Intensity
- 6.4.5 Sustainability Maturity
- 6.5 Strategic Developments in Steel Rebar (Last 24 Months)
- 6.5.1 Mergers, Acquisitions & Divestments
- 6.5.2 New Steel Rebar Launches
- 6.5.3 Facility Expansions
- 6.5.4 Strategic Alliances, Joint Ventures & Partnerships
- 6.5.5 Distribution Expansion & Market Entry
- 6.5.6 Sustainability & ESG Initiatives
- 6.6 Competitive Strategy Mapping
- 6.6.1 Leader, Challenger, Follower & Niche Classification
- 6.6.2 Pricing Strategy Comparison
- 6.6.3 Channel Strategy Matrix
Note: Strategic developments are included based on their materiality and the availability of reliable information.
Chapter 7. Global Steel Rebar Market – By Distribution Channel
- 7.1 Segment Overview
- 7.1.1 Volume & Revenue Split by Channel (2024 & 2032)
- 7.1.2 Channel Mix Evolution (2024-2032)
Chapter 8. Regional Market Analysis – Global Overview
- 8.1 Global Regional Overview
- 8.1.1 Regional Volume Share
- 8.1.2 Regional Revenue Share
- 8.1.3 Regional Volume by Region
- 8.1.4 Regional Revenue by Region
- 8.1.5 Regional Forecast Through 2032
- 8.2 Cross-Regional Segment Analysis
- 8.2.1 By Distribution Channel
- 8.2.2 By Brand/Price Tier
Chapter 9. North America Steel Rebar Market
- 9.1 United States
- 9.2 Canada
- 9.3 Mexico
Chapter 10. Europe Steel Rebar Market
- 10.1 Germany
- 10.2 France
- 10.3 Italy
- 10.4 United Kingdom
- 10.5 Spain
- 10.6 Poland
- 10.7 Russia
- 10.8 Netherlands
- 10.9 Belgium
- 10.10 Sweden
- 10.11 Denmark
- 10.12 Norway
- 10.13 Rest of Europe
Chapter 11. Asia Pacific Steel Rebar Market
- 11.1 China
- 11.2 India
- 11.3 Japan
- 11.4 South Korea
- 11.5 Thailand
- 11.6 Indonesia
- 11.7 Vietnam
- 11.8 Malaysia
- 11.9 Australia
- 11.10 Rest of Asia Pacific
Chapter 12. Latin America Steel Rebar Market
- 12.1 Brazil
- 12.2 Argentina
- 12.3 Colombia
- 12.4 Chile
- 12.5 Rest of Latin America
Chapter 13. Middle East Steel Rebar Market
- 13.1 Saudi Arabia
- 13.2 United Arab Emirates
- 13.3 Turkey
- 13.4 Israel
- 13.5 Iran
- 13.6 Rest of the Middle East
Chapter 14. Africa Steel Rebar Market
- 14.1 South Africa
- 14.2 Egypt
- 14.3 Nigeria
- 14.4 Morocco
- 14.5 Rest of Africa
Chapter 15. Steel Rebar Company Profiles
- 15.1 [Company 01]
- 15.1.1 Company Overview
- 15.1.2 Key Management Personnel
- 15.1.3 Products & Services Portfolio
- 15.1.4 Financial Performance
- 15.1.5 Key Market Focus & Geographic Presence
- 15.1.6 Recent Developments & Strategic Initiatives
Note: The company profile list is preliminary and may change based on research findings, market developments, data availability, and client requirements.
Chapter 16. Appendices
- Appendix A – List of Abbreviations & Acronyms
- Appendix B – Industry Classification Code Reference – Full Series
- Appendix C – Production & Capacity Data Tables
- Appendix D – End-Use & Demand Base Tables
- Appendix E – Consumption & Replacement Rate Assumptions
- Appendix F – ASP Reference Tables
- Appendix G – Manufacturing & Facility Database
- Appendix H – Import-Export Data Tables
- Appendix I – Regulatory Summary Tables
- Appendix J – Primary Research Participant List (Anonymized)
- Appendix K – Primary Research Questionnaire Framework
- Appendix L – Data Sources & Bibliography
- Appendix M – Market Size Divergence & Source Comparison
Chapter 17. Research Methodology
- 17.1 Research Framework & Philosophy
- 17.2 Secondary Research – Sources, Hierarchy & Data Extraction
- 17.3 Data Modeling – Bottom-Up & Top-Down Market Sizing
- 17.4 Primary Research – Stakeholder Framework, LOI & Sample Sizes
- 17.5 Forecast Methodology – Regression, Scenario & Sensitivity Analysis
- 17.6 Quality Control – Four-Layer Validation Framework
- 17.7 Limitations & Standard Assumptions
- 17.8 Disclaimer
