
Fuel Piping Market Overview:
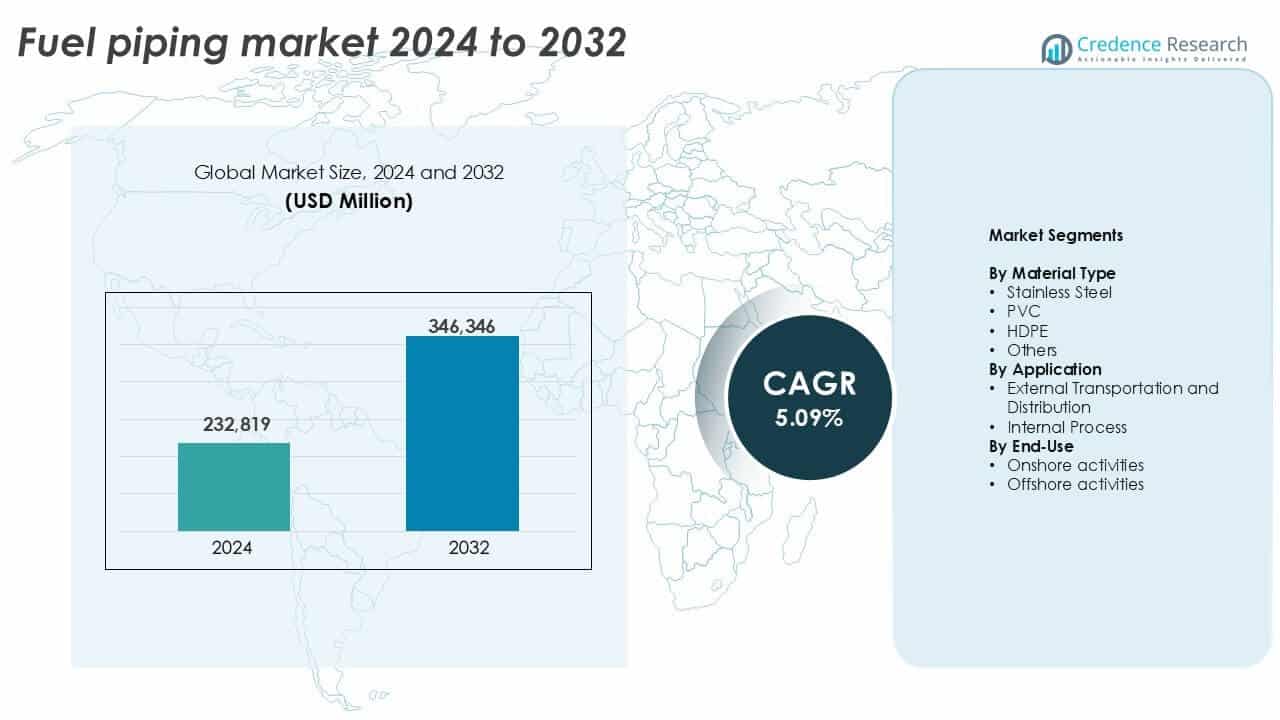
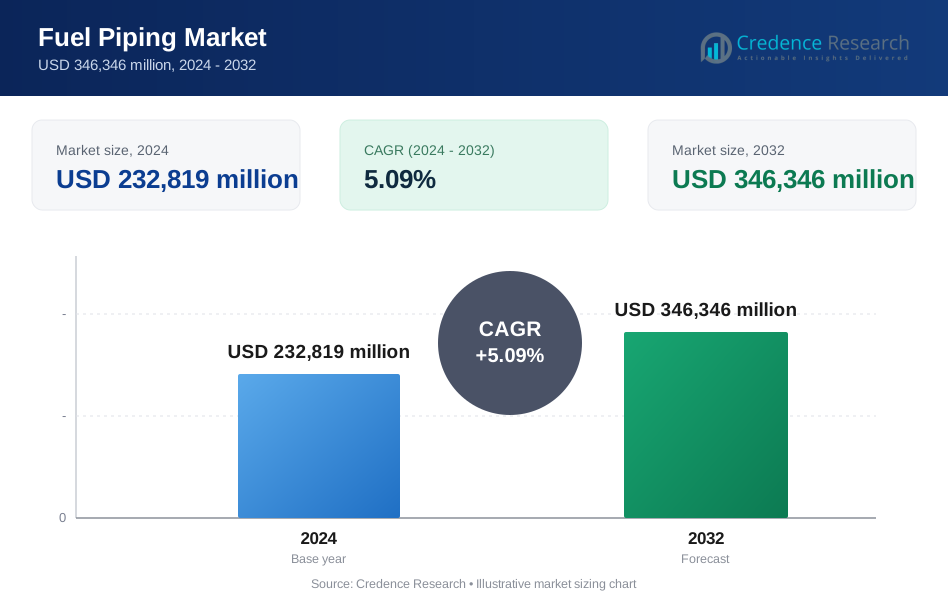
The Fuel Piping Market size was valued at USD 232,819 million in 2024 and is anticipated to reach USD 346,346 million by 2032, at a CAGR of 5.09% during the forecast period.
| REPORT ATTRIBUTE | DETAILS |
|---|---|
| Historical Period | 2020-2024 |
| Base Year | 2025 |
| Forecast Period | 2026-2032 |
| Fuel Piping Market Size 2024 | USD 232,819 million |
| Fuel Piping Market, CAGR | 5.09% |
| Fuel Piping Market Size 2032 | USD 346,346 million |
Fuel Piping Market Insights
- Rising investments in oil and gas infrastructure and long-distance pipeline expansion projects are driving market growth globally.
- Key trends include increased adoption of HDPE and composite piping, along with smart leak detection technologies across onshore and offshore applications.
- Leading players such as Tenaris S.A., ArcelorMittal S.A., and JFE Holdings Inc. focus on advanced materials and regional expansion to stay competitive.
- North America held a 32% share in 2024, followed by Asia-Pacific at 28% and Europe at 23%, while stainless steel accounted for over 40% of material usage and external transportation held 60% in application share.
Fuel Piping Market Segmentation Analysis:
By Material Type
Stainless steel holds the dominant share in the fuel piping market under the material type segment, accounting for over 40% of the global market in 2024. Its high corrosion resistance, durability, and ability to withstand high-pressure environments drive its widespread adoption across fuel transport systems. Stainless steel also supports extended service life, reducing maintenance costs in both onshore and offshore settings. While HDPE and PVC offer cost-effective alternatives for low-pressure or short-distance pipelines, their market share remains lower due to performance limitations in high-stress or hazardous conditions.
- For instance, Sandvik reports its SAF 2507 super-duplex stainless steel fuel pipes withstand operating pressures above 300 bar and deliver corrosion resistance ratings exceeding 40 PREN, supporting long-term fuel transport in offshore installations.
By Application
External transportation and distribution emerged as the leading application, capturing nearly 60% of the fuel piping market share in 2024. This dominance is attributed to growing fuel movement across long-distance pipelines, from refineries to storage and retail networks. The segment benefits from rising infrastructure investments in pipeline networks and government support for reducing fuel truck dependency. Internal process applications maintain steady demand within refining and petrochemical operations, but face lower volume due to localized usage and shorter pipeline lengths.
- For instance, Tenaris confirms its seamless steel line pipes are deployed in fuel pipelines exceeding 1,000 kilometers in cumulative project length, with wall thickness ranges up to 25 millimeters to support continuous high-flow fuel distribution networks.
By End-Use
Onshore activities dominate the end-use segment, accounting for over 65% of the total fuel piping market in 2024. The dominance is driven by the sheer scale of land-based infrastructure, such as refineries, terminals, and pipeline corridors across major oil-producing regions. Onshore projects benefit from lower installation costs, easier maintenance access, and wider regulatory support. Offshore activities, though technologically advanced and critical for deepwater exploration, hold a smaller share due to complex installation, higher costs, and limited operating geographies.
Key Growth Drivers
Rising Investments in Oil & Gas Infrastructure
The fuel piping market gains strong momentum from expanding oil and gas infrastructure projects worldwide. Governments and private firms continue to invest heavily in pipeline systems to support rising fuel demand, particularly in developing regions. Long-distance transmission pipelines, refinery expansions, and terminal upgrades require high volumes of durable fuel piping systems. The U.S., India, China, and Middle Eastern countries lead in pipeline extension and modernization projects to reduce dependency on road tankers and optimize transport efficiency. These efforts include both crude and refined product pipelines, which drive steady procurement of advanced material types like stainless steel and HDPE. Regulatory easing and public-private partnerships also support project viability. As energy security gains national priority, new investment inflows sustain the demand outlook across the fuel piping value chain, making infrastructure expansion a primary growth pillar.
- For instance, Indian Oil Corporation reports its Paradip–Haldia–Barauni crude pipeline (PHBPL) spans 1,465 kilometers and operates with high design pressures requiring high-grade steel (API 5L X80) fuel piping for the continuous transport of 20.4 MMTPA of crude oil.
Technological Advancements in Piping Materials
Innovations in fuel piping materials significantly enhance the market's growth potential. Modern materials such as high-density polyethylene (HDPE) and flexible composite piping offer improved corrosion resistance, lightweight handling, and extended durability. These alternatives reduce long-term maintenance costs, especially in corrosive or harsh environments. Advanced coatings and internal linings for metallic pipes further increase their lifecycle performance, making them suitable for both onshore and offshore applications. With rising regulatory pressure to ensure pipeline safety and reduce environmental risks, technology-driven material upgrades are becoming central to procurement decisions. Leading manufacturers invest in R&D to develop piping systems that meet evolving industry codes and withstand operational stresses. Adoption of smart sensing and leak detection technologies within piping structures also contributes to higher efficiency and safety standards. This evolution in materials and embedded intelligence supports sustained market expansion by addressing performance and compliance gaps in traditional systems.
- For instance, Chevron Phillips Chemical states its PE100 HDPE fuel piping systems support operating temperatures up to 60 °C and pressure ratings of 16 bar, while achieving documented service lives exceeding 50 years in buried fuel pipeline installations.
Expansion of Offshore Exploration Activities
The ongoing expansion of offshore oil and gas exploration boosts demand for specialized fuel piping systems. Deepwater and ultra-deepwater projects require corrosion-resistant and pressure-tolerant piping solutions that perform reliably under extreme conditions. Offshore platforms and FPSOs (Floating Production Storage and Offloading units) rely on complex internal process piping and external fuel transport networks for operations. With many shallow reserves depleting, energy companies are increasingly investing in deeper and more remote offshore fields, particularly in the Gulf of Mexico, Brazil, and West Africa. This trend drives the need for advanced materials like duplex stainless steel and composite piping tailored to offshore dynamics. Subsea installation also requires prefabricated piping systems with robust joining techniques. The shift toward offshore production acts as a significant market accelerator, with fuel piping suppliers adapting their portfolios to meet technical and logistical demands associated with offshore asset deployment.
Key Trends & Opportunities
Shift Toward Composite and Plastic-Based Piping Solutions
A notable trend in the fuel piping market is the shift toward plastic-based and composite piping systems. These alternatives offer significant advantages in terms of flexibility, corrosion resistance, weight reduction, and ease of installation. HDPE and reinforced thermoplastic pipes are increasingly used in external fuel transport and non-critical internal processes, especially where metal pipes are cost-prohibitive or prone to corrosion. This shift is also fueled by growing environmental regulations and the need to minimize leakage risks. Composite pipes, particularly those with fiberglass or epoxy reinforcements, are gaining traction in offshore and remote installations where weight and durability are key factors. The expanding use of these materials presents an opportunity for manufacturers to differentiate offerings and tap into fast-growing subsegments. As technology advances, composite piping systems are expected to penetrate traditional steel-dominated segments, expanding their application base and creating new revenue streams.
Integration of Smart Monitoring and Leak Detection Systems
Growing environmental concerns and stricter safety regulations have accelerated the adoption of smart monitoring technologies in fuel piping networks. Operators increasingly integrate sensors, automated control systems, and real-time leak detection technologies to reduce response times and prevent large-scale spills. These systems help monitor pressure fluctuations, flow rates, and structural integrity, enabling predictive maintenance and reducing unplanned downtimes. The trend is prominent in high-risk and high-value installations, such as offshore rigs and cross-country pipelines. Digital twins and remote surveillance tools further support efficient pipeline management. As governments enforce tighter pipeline safety laws, particularly in North America and Europe, the demand for intelligent piping solutions is expected to grow. This shift presents an opportunity for fuel piping manufacturers to offer bundled solutions that combine hardware with software, thereby enhancing value propositions and opening new service-based revenue models.
Key Challenges
Corrosion and Maintenance Costs in Harsh Environments
One of the most pressing challenges in the fuel piping market is corrosion, especially in offshore and chemically aggressive environments. Metal-based pipelines, even those with protective coatings, are susceptible to degradation due to prolonged exposure to saltwater, fluctuating temperatures, and high-pressure fuel transport. Corrosion not only shortens the operational life of pipelines but also increases safety risks and maintenance costs. Regular inspections, replacements, and the application of corrosion inhibitors raise the total cost of ownership. In regions with aging infrastructure, these issues become more pronounced, causing unplanned downtime and regulatory penalties. While non-metallic alternatives like HDPE and composite materials offer relief, their limited load tolerance and performance variability in high-temperature operations restrict their use. The need to balance durability, safety, and cost remains a core challenge, especially for operators managing mixed-material pipeline networks across diverse terrains.
Regulatory Complexity and Environmental Compliance
Fuel piping projects often face delays and cost overruns due to complex regulatory frameworks and environmental clearance hurdles. Governments across regions have implemented strict guidelines for pipeline design, material usage, safety audits, and emissions control. Compliance with evolving regulations such as EPA standards in the U.S. or environmental impact assessments in Europe adds layers of procedural complexity. For cross-border pipelines, geopolitical factors and bilateral agreements further complicate approvals. Smaller operators find it particularly difficult to keep up with changing standards, leading to compliance gaps or project cancellations. Even large companies must invest significantly in legal, engineering, and environmental expertise to meet requirements. These regulatory bottlenecks slow down deployment, restrict market entry for new players, and limit innovation timelines. Navigating this landscape remains a structural hurdle for sustained fuel piping market growth.
Regional Analysis
North America
North America led the fuel piping market in 2024 with a market share of over 32%, driven by robust oil and gas infrastructure in the U.S. and Canada. Extensive networks of onshore pipelines, refinery expansions, and shale gas activities support the region’s high demand. Regulatory frameworks like the PHMSA pipeline safety standards also boost investments in advanced piping materials. Offshore projects in the Gulf of Mexico continue to contribute to segment growth. Technological upgrades, retrofitting of old systems, and demand for corrosion-resistant solutions strengthen North America’s position in the global fuel piping industry.
Europe
Europe accounted for approximately 23% of the global fuel piping market in 2024, supported by strong regulatory frameworks and ongoing investments in energy transition infrastructure. The region emphasizes pipeline integrity, safety, and environmental compliance. Countries like Germany, the UK, and Norway are investing in modernizing fuel transport systems, including offshore pipeline replacements in the North Sea. Adoption of smart leak detection systems and stricter emission controls fuel demand for advanced fuel piping materials. Europe’s shift toward cleaner fuels and synthetic alternatives also drives upgrades in existing pipeline infrastructure.
Asia-Pacific
Asia-Pacific held a 28% share in the fuel piping market in 2024, emerging as the fastest-growing region. Rapid industrialization, expanding refining capacities, and growing fuel demand in China, India, and Southeast Asia are major drivers. Government-led pipeline expansion projects, such as India’s National Gas Grid and China’s West-East pipelines, stimulate demand. The region is also witnessing increased investments in offshore production and LNG terminals. Rising urbanization and energy security concerns push both public and private players to enhance pipeline networks, especially for long-distance transport and urban fuel distribution.
Latin America
Latin America contributed around 9% to the global fuel piping market in 2024, with Brazil and Mexico leading the regional growth. The region’s potential lies in expanding oil exploration and the modernization of outdated pipeline infrastructure. Brazil’s offshore activities in the pre-salt basin create demand for specialized piping systems. Mexico’s energy reforms and new pipeline projects for fuel distribution improve market prospects. However, investment delays and political uncertainties challenge consistent growth. Still, rising fuel consumption and regional integration projects are expected to support moderate growth over the forecast period.
Middle East & Africa
Middle East & Africa accounted for nearly 8% of the global market in 2024, driven by large-scale oil production and export activities. Major oil-exporting countries like Saudi Arabia, UAE, and Nigeria rely heavily on durable and high-capacity fuel pipelines for both domestic transport and global shipping. The development of offshore fields and refineries contributes to growing demand for corrosion-resistant and high-pressure piping solutions. While infrastructure in parts of Africa remains underdeveloped, investment in cross-border fuel transport pipelines continues to rise. The region shows strong potential for growth, especially with rising energy investments.
Fuel Piping Market Segmentations:
By Material Type
- Stainless Steel
- PVC
- HDPE
- Others
By Application
- External Transportation and Distribution
- Internal Process
By End-Use
- Onshore activities
- Offshore activities
By Geography
- North America
- U.S.
- Canada
- Mexico
- Europe
- Germany
- France
- U.K.
- Italy
- Spain
- Rest of Europe
- Asia Pacific
- China
- Japan
- India
- South Korea
- South-east Asia
- Rest of Asia Pacific
- Latin America
- Brazil
- Argentina
- Rest of Latin America
- Middle East & Africa
- GCC Countries
- South Africa
- Rest of the Middle East and Africa
Competitive Landscape
The fuel piping market features a mix of global steel manufacturers, composite material innovators, and infrastructure solution providers competing across onshore and offshore segments. Key players include Tenaris S.A., Vallourec S.A., ArcelorMittal S.A., and JFE Holdings Inc., who lead with extensive production capacity and advanced steel grades tailored for energy applications. Companies like Aliaxis Group S.A. and Mexichem S.A.B. de C.V. specialize in plastic-based and HDPE piping systems, targeting flexible and corrosion-resistant installations. Strategic initiatives include mergers, material innovations, and partnerships with oil and gas operators to expand global reach. Players also invest in smart monitoring integration and high-performance coatings to comply with evolving safety standards. Competition is defined by technological capabilities, delivery timelines, and regional presence. Emerging players in Asia are scaling operations to tap into rising energy infrastructure demand, creating pressure on established firms to innovate and optimize pricing without compromising on quality or regulatory compliance.
Key Player Analysis
- American Cast Iron Pipe Company
- Aliaxis Group S.A.
- ArcelorMittal S.A.
- China Steel Corporation
- JFE Holdings Inc.
- JSW Steel Limited
- Metalúrgica Gerdau S.A.
- Mexichem S.A.B. de C.V.
- Tenaris S.A.
- Vallourec S.A.
Recent Developments
- In November 2023 (Partnership), NextEra Energy Partners, LP finalized a binding agreement with Kinder Morgan to divest its Texas natural gas pipeline portfolio for a total consideration of USD 1.815 billion.
- In April 2023, the Pipeline and Hazardous Materials Safety Administration (PHMSA) and U.S. Transportation Secretary Pete Buttigieg will present a historic $196 million in funding for 37 projects across 19 states. With the assistance of this new funding program, public health, safety, and methane emissions from gas distribution pipes are all improved.
Report Coverage
The research report offers an in-depth analysis based on Material Type, Application, End-Use and Geography. It details leading market players, providing an overview of their business, product offerings, investments, revenue streams, and key applications. Additionally, the report includes insights into the competitive environment, SWOT analysis, current market trends, as well as the primary drivers and constraints. Furthermore, it discusses various factors that have driven market expansion in recent years. The report also explores market dynamics, regulatory scenarios, and technological advancements that are shaping the industry. It assesses the impact of external factors and global economic changes on market growth. Lastly, it provides strategic recommendations for new entrants and established companies to navigate the complexities of the market.
Future Outlook
- Fuel piping demand will grow steadily as countries invest in modernizing oil and gas networks.
- Long-distance pipeline expansion and refinery upgrades will support material and service demand.
- Adoption of HDPE and composite materials will rise in both onshore and corrosive environments.
- Manufacturers will integrate smart monitoring and leak detection into premium piping systems.
- Companies will expand presence in Asia-Pacific due to rising energy needs and infrastructure spending.
- Stainless steel will remain the preferred material, led by its corrosion resistance and high-pressure tolerance.
- External transportation will dominate applications, driven by pipeline network growth across continents.
- Regulatory approvals and environmental assessments will delay some cross-border pipeline projects.
- Offshore operations will create demand for advanced, high-performance fuel piping under harsh conditions.
- North America will retain market leadership, but Asia-Pacific will close the gap with faster growth.
Request a Free Sample
Fill in your details and we'll send you a free sample report.
- Sample data tables & charts
- Research methodology
Need a Custom Version of This Report?
Tailor the scope, geography, or segments to your exact requirements.
- Custom geography or segment scope
- Direct access to our analyst team
Frequently Asked Questions
What is the current market size for Fuel piping market, and what is its projected size in 2032?
At what Compound Annual Growth Rate is the Fuel piping market projected to grow between 2024 and 2032?
Which Fuel piping market segment held the largest share in 2024?
What are the primary factors fueling the growth of the Fuel piping market?
Who are the leading companies in the Fuel piping market?
Which region commanded the largest share of the Fuel piping market in 2024?
Table of Content
Chapter 1. Report Introduction
- 1.1 Report Description & Purpose
- 1.1.1 Report Title & Market Definition
- 1.1.2 Unique Selling Propositions (USP) & Key Differentiators
- 1.1.3 Value Proposition for Stakeholders
- 1.2 Research Objectives
- 1.2.1 Market Sizing Objectives (Volume & Revenue)
- 1.2.2 Segmentation Objectives
- 1.2.3 Competitive Intelligence Objectives
- 1.2.4 Forecast & Scenario Objectives
- 1.3 Report Scope
- 1.3.1 Fuel Piping Scope – Types & Subtypes Covered
- 1.3.2 Geographic Scope – Regions & Countries Covered
- 1.3.3 Historical Period, Base Year & Forecast Period (2024; forecast to 2032)
- 1.3.4 Inclusions & Exclusions
- 1.4 HS Code & Classification Framework
- 1.5 Currency, Units & Pricing Basis
- 1.6 Target Stakeholders
- 1.7 Limitations & Assumptions
Chapter 2. Executive Summary
- 2.1 Global Fuel Piping Market Snapshot
- 2.1.1 Market Size – Historical (2024) & Forecast (2024-2032) (2024: USD 232,819 million → 2032: USD 346,346 million)
- 2.1.2 Volume & Revenue – Global Totals
- 2.1.3 Key Market Highlights – Top Five Facts
- 2.2 Fuel Piping Market Segmentation Snapshot
- 2.2.1 Market Split by Region – 2024 vs. 2032
- 2.3 Competitive Snapshot
- 2.3.1 Top 10 Players by Revenue Share – 2024
- 2.3.2 Top 10 Players by Volume Share – 2024
- 2.3.3 Recent Strategic Developments (18-Month Summary)
- 2.4 Key Investment Highlights & Strategic Conclusions
Chapter 3. Fuel Piping Market Dynamics & Industry Analysis
- 3.1 Market Overview & Context
- 3.1.1 Fuel Piping Market Position in the Broader Automotive Value Chain
- 3.1.2 OEM vs. Replacement Market Dynamics
- 3.1.3 Market Maturity & Development Stage by Region
- 3.2 Fuel Piping Market Drivers
- 3.3 Fuel Piping Market Restraints & Challenges
- 3.4 Fuel Piping Market Opportunities
- 3.5 Porter's Five Forces Analysis
- 3.5.1 Threat of New Entrants
- 3.5.2 Bargaining Power of Suppliers
- 3.5.3 Bargaining Power of Buyers
- 3.5.4 Threat of Substitutes
- 3.5.5 Competitive Rivalry – Intensity Assessment
- 3.6 Fuel Piping Value Chain Analysis
- 3.6.1 Upstream – Raw Material/Input Suppliers
- 3.6.1.1 Raw Material/Input 1
- 3.6.1.2 Raw Material/Input 2
- 3.6.1.3 Raw Material/Input 3
- 3.6.2 Midstream – Production/Manufacturing/Service Delivery
- 3.6.2.1 Production/Process Overview
- 3.6.2.2 Key Facility Locations & Capacity by Manufacturer
- 3.6.3 Downstream – Distribution & End Consumer
- 3.6.3.1 Primary Channel – B2B/OEM
- 3.6.3.2 Secondary Channels – Dealer, Retail, Online, Direct
- 3.6.4 Value Chain Profitability Analysis
- 3.6.1 Upstream – Raw Material/Input Suppliers
- 3.7 PESTEL Analysis
- 3.7.1 Political Factors
- 3.7.2 Economic Factors
- 3.7.3 Social Factors
- 3.7.4 Technological Factors
- 3.7.5 Environmental Factors
- 3.7.6 Legal Factors
- 3.8 Fuel Piping Supply Chain Analysis
- 3.8.1 Raw Material/Input Supply Risk Assessment
- 3.8.2 Manufacturing Concentration Risk (Geographic Exposure)
- 3.8.3 Trade Disruption Impact Analysis
- 3.9 Regulatory & Policy Landscape
Note: The regulatory and policy landscape section covers regulations based on their applicability to the market, Fuel Piping category, geography, and scope of the study. Only regulatory frameworks with a material impact on operations, compliance, trade, sustainability, or market access are analyzed in detail.
Chapter 4. Key Investment Pockets & Opportunity Analysis
- 4.1 Fuel Piping Market Attractiveness Analysis
- 4.1.1 By Region – Investment Attractiveness Matrix (Volume × CAGR)
- 4.2 Absolute Revenue Growth Opportunity
- 4.2.1 By Region – Absolute USD Growth Through 2032
- 4.3 Incremental Volume Opportunity
- 4.3.1 By Region – Incremental Volume Through 2032
- 4.3.2 Segment – Incremental Volume
- 4.4 Emerging Submarket Opportunity Deep Dive (Subject to Applicability)
- 4.5 Emerging Market Opportunity Scorecards
- 4.5.1 United States
- 4.5.2 Europe
- 4.5.3 Asia
- 4.5.4 Middle East & Africa
Note: Emerging Market Opportunity Scorecards will be included based on relevance and strategic importance. Regions listed are indicative and may vary depending on data availability and market dynamics.
Chapter 5. Fuel Piping Import-Export Analysis & Trade Flows
- 5.1 Global Trade Overview
- 5.1.1 Global Export Value by Country (2024)
- 5.1.2 Global Export Volume by Country (2024)
- 5.1.3 Global Import Value by Country (2024)
- 5.1.4 Global Import Volume by Country (2024)
- 5.1.5 Net Trade Balance by Country (2024)
- 5.2 Export Analysis – Segment
- 5.2.1 Type 1 (HS Code)
- 5.2.2 Type 2 (HS Code)
- 5.2.3 Type 3 (HS Code)
- 5.2.4 Type 4 (HS Code)
- 5.2.5 Type 5 (HS Code)
- 5.3 Import Analysis – Segment
- 5.3.1 Type 1 (HS Code)
- 5.3.2 Type 2 (HS Code)
- 5.3.3 Type 3 (HS Code)
- 5.3.4 Type 4 (HS Code)
- 5.3.5 Type 5 (HS Code)
- 5.4 Average Unit Trade Prices
- 5.4.1 Average Export Price – Segment & Country
- 5.4.2 Average Import Price – Segment & Source Country
- 5.4.3 Price Trends (2024)
- 5.5 Key Trade Route Analysis
- 5.5.1 Trade Route 1
- 5.5.2 Trade Route 2
- 5.5.3 Trade Route 3
- 5.5.4 Trade Route 4
- 5.5.5 Trade Route 5
- 5.6 Trade Policy Impact Assessment
- 5.6.1 US Anti-Dumping & Section 301 Tariffs
- 5.6.2 EU Customs Union Impact
- 5.6.3 Major Free Trade Agreements
- 5.6.4 USMCA Rules of Origin
Note: Trade policy analysis will be included only where relevant to the Fuel Piping market.
Chapter 6. Competitive Landscape & Company Benchmarking
- 6.1 Fuel Piping Market Concentration & Structure
- 6.1.1 Herfindahl-Hirschman Index (HHI) – vs. 2024
- 6.1.2 Tier 1, Tier 2 & Tier 3 Market Structure
- 6.1.3 Global, Regional & Local Player Dynamics
- 6.2 Fuel Piping Market Share Analysis – 2024
- 6.2.1 Global Revenue Share by Company
- 6.2.2 Global Volume Share by Company
- 6.2.3 Regional Revenue Share
- 6.2.4 Market Share Evolution ( vs. 2024)
- 6.2.5 OEM Segment Share by Company
- 6.2.6 Replacement Segment Share by Company
- 6.3 Production/Delivery Capacity & Facility Analysis
- 6.3.1 Global Installed Capacity
- 6.3.2 Capacity Utilization Rates
- 6.3.3 Production/Output Volume
- 6.3.4 Facility Locations & Capacity Map
- 6.3.5 Planned Capacity Additions
- 6.4 Fuel Piping Competitive Benchmarking Matrix
- 6.4.1 Revenue, Volume, CAGR & Profitability Comparison
- 6.4.2 Channel Revenue Mix
- 6.4.3 Geographic Revenue Exposure
- 6.4.4 R&D Intensity
- 6.4.5 Sustainability Maturity
- 6.5 Strategic Developments in Fuel Piping (Last 24 Months)
- 6.5.1 Mergers, Acquisitions & Divestments
- 6.5.2 New Fuel Piping Launches
- 6.5.3 Facility Expansions
- 6.5.4 Strategic Alliances, Joint Ventures & Partnerships
- 6.5.5 Distribution Expansion & Market Entry
- 6.5.6 Sustainability & ESG Initiatives
- 6.6 Competitive Strategy Mapping
- 6.6.1 Leader, Challenger, Follower & Niche Classification
- 6.6.2 Pricing Strategy Comparison
- 6.6.3 Channel Strategy Matrix
Note: Strategic developments are included based on their materiality and the availability of reliable information.
Chapter 7. Global Fuel Piping Market – By Distribution Channel
- 7.1 Segment Overview
- 7.1.1 Volume & Revenue Split by Channel (2024 & 2032)
- 7.1.2 Channel Mix Evolution (2024-2032)
Chapter 8. Regional Market Analysis – Global Overview
- 8.1 Global Regional Overview
- 8.1.1 Regional Volume Share
- 8.1.2 Regional Revenue Share
- 8.1.3 Regional Volume by Region
- 8.1.4 Regional Revenue by Region
- 8.1.5 Regional Forecast Through 2032
- 8.2 Cross-Regional Segment Analysis
- 8.2.1 By Distribution Channel
- 8.2.2 By Brand/Price Tier
Chapter 9. North America Fuel Piping Market
- 9.1 United States
- 9.2 Canada
- 9.3 Mexico
Chapter 10. Europe Fuel Piping Market
- 10.1 Germany
- 10.2 France
- 10.3 Italy
- 10.4 United Kingdom
- 10.5 Spain
- 10.6 Poland
- 10.7 Russia
- 10.8 Netherlands
- 10.9 Belgium
- 10.10 Sweden
- 10.11 Denmark
- 10.12 Norway
- 10.13 Rest of Europe
Chapter 11. Asia Pacific Fuel Piping Market
- 11.1 China
- 11.2 India
- 11.3 Japan
- 11.4 South Korea
- 11.5 Thailand
- 11.6 Indonesia
- 11.7 Vietnam
- 11.8 Malaysia
- 11.9 Australia
- 11.10 Rest of Asia Pacific
Chapter 12. Latin America Fuel Piping Market
- 12.1 Brazil
- 12.2 Argentina
- 12.3 Colombia
- 12.4 Chile
- 12.5 Rest of Latin America
Chapter 13. Middle East Fuel Piping Market
- 13.1 Saudi Arabia
- 13.2 United Arab Emirates
- 13.3 Turkey
- 13.4 Israel
- 13.5 Iran
- 13.6 Rest of the Middle East
Chapter 14. Africa Fuel Piping Market
- 14.1 South Africa
- 14.2 Egypt
- 14.3 Nigeria
- 14.4 Morocco
- 14.5 Rest of Africa
Chapter 15. Fuel Piping Company Profiles
- 15.1 [Company 01]
- 15.1.1 Company Overview
- 15.1.2 Key Management Personnel
- 15.1.3 Products & Services Portfolio
- 15.1.4 Financial Performance
- 15.1.5 Key Market Focus & Geographic Presence
- 15.1.6 Recent Developments & Strategic Initiatives
Note: The company profile list is preliminary and may change based on research findings, market developments, data availability, and client requirements.
Chapter 16. Appendices
- Appendix A – List of Abbreviations & Acronyms
- Appendix B – Industry Classification Code Reference – Full Series
- Appendix C – Production & Capacity Data Tables
- Appendix D – End-Use & Demand Base Tables
- Appendix E – Consumption & Replacement Rate Assumptions
- Appendix F – ASP Reference Tables
- Appendix G – Manufacturing & Facility Database
- Appendix H – Import-Export Data Tables
- Appendix I – Regulatory Summary Tables
- Appendix J – Primary Research Participant List (Anonymized)
- Appendix K – Primary Research Questionnaire Framework
- Appendix L – Data Sources & Bibliography
- Appendix M – Market Size Divergence & Source Comparison
Chapter 17. Research Methodology
- 17.1 Research Framework & Philosophy
- 17.2 Secondary Research – Sources, Hierarchy & Data Extraction
- 17.3 Data Modeling – Bottom-Up & Top-Down Market Sizing
- 17.4 Primary Research – Stakeholder Framework, LOI & Sample Sizes
- 17.5 Forecast Methodology – Regression, Scenario & Sensitivity Analysis
- 17.6 Quality Control – Four-Layer Validation Framework
- 17.7 Limitations & Standard Assumptions
- 17.8 Disclaimer
