CHAPTER NO. 1 : GENESIS OF THE MARKET
1.1 Market Prelude – Introduction & Scope
1.2 The Big Picture – Objectives & Vision
1.3 Strategic Edge – Unique Value Proposition
1.4 Stakeholder Compass – Key Beneficiaries
CHAPTER NO. 2 : EXECUTIVE LENS
2.1 Pulse of the Industry – Market Snapshot
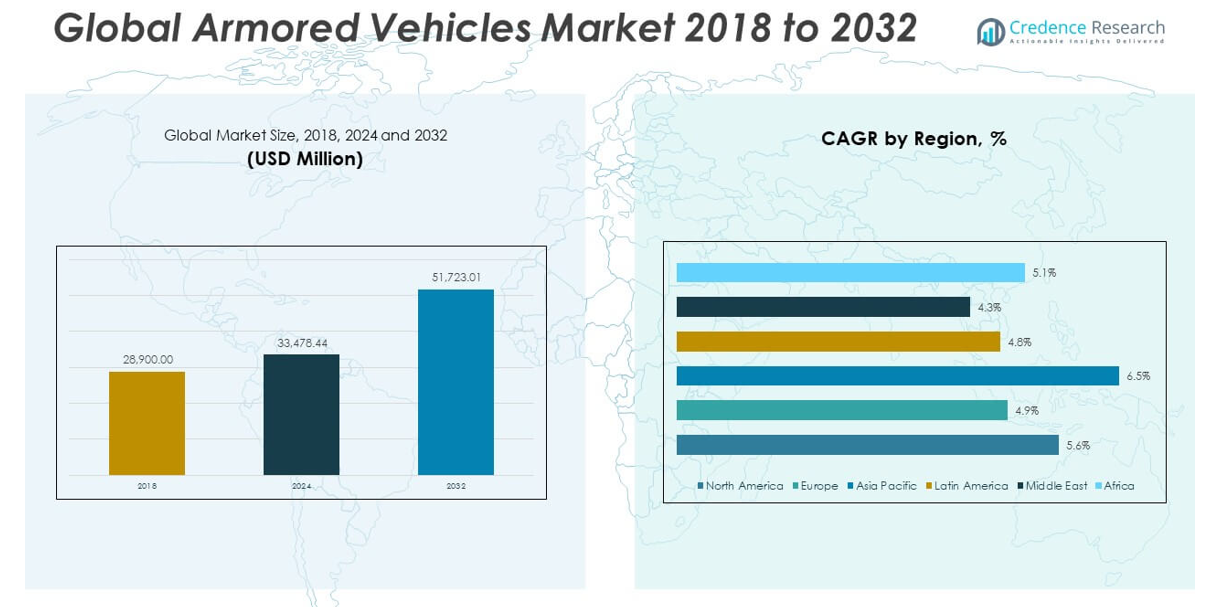
2.2 Growth Arc – Revenue Projections (USD Million)
2.3. Premium Insights – Based on Primary Interviews
CHAPTER NO. 3 : ARMORED VEHICLES MARKET FORCES & INDUSTRY PULSE
3.1 Foundations of Change – Market Overview
3.2 Catalysts of Expansion – Key Market Drivers
3.2.1 Momentum Boosters – Growth Triggers
3.2.2 Innovation Fuel – Disruptive Technologies
3.3 Headwinds & Crosswinds – Market Restraints
3.3.1 Regulatory Tides – Compliance Challenges
3.3.2 Economic Frictions – Inflationary Pressures
3.4 Untapped Horizons – Growth Potential & Opportunities
3.5 Strategic Navigation – Industry Frameworks
3.5.1 Market Equilibrium – Porter’s Five Forces
3.5.2 Ecosystem Dynamics – Value Chain Analysis
3.5.3 Macro Forces – PESTEL Breakdown
3.6 Price Trend Analysis
3.6.1 Regional Price Trend
3.6.2 Price Trend by product
CHAPTER NO. 4 : KEY INVESTMENT EPICENTER
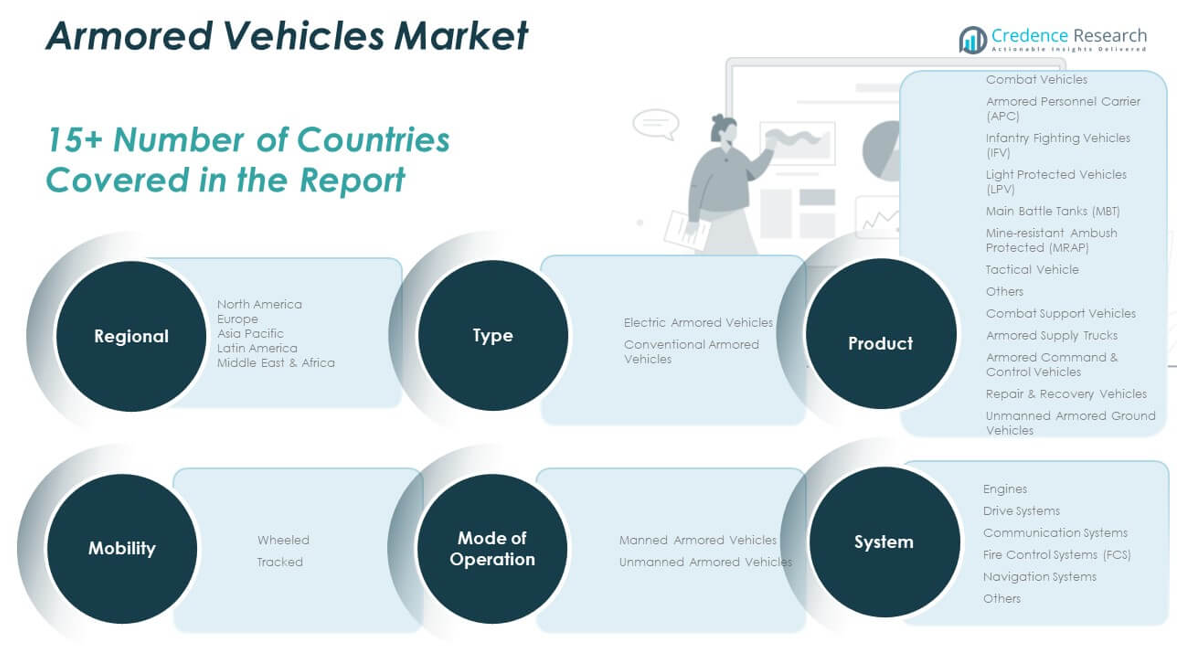
4.1 Regional Goldmines – High-Growth Geographies
4.2 Mobility Frontiers – Lucrative Mobility Categories
4.3 Type Sweet Spots – Emerging Demand Segments
CHAPTER NO. 5: REVENUE TRAJECTORY & WEALTH MAPPING
5.1 Momentum Metrics – Forecast & Growth Curves
5.2 Regional Revenue Footprint – Market Share Insights
5.3 Segmental Wealth Flow – Product & Type Revenue
CHAPTER NO. 6 : TRADE & COMMERCE ANALYSIS
6.1. Import Analysis by Region
6.1.1. Global Armored Vehicles Market Import Revenue By Region
6.2. Export Analysis by Region
6.2.1. Global Armored Vehicles Market Export Revenue By Region
CHAPTER NO. 7 : COMPETITION ANALYSIS
7.1. Company Market Share Analysis
7.1.1. Global Armored Vehicles Market: Company Market Share
7.2. Global Armored Vehicles Market Company Revenue Market Share
7.3. Strategic Developments
7.3.1. Acquisitions & Mergers
7.3.2. New Mobility Launch
7.3.3. Regional Expansion
7.4. Competitive Dashboard
7.5. Company Assessment Metrics, 2024
CHAPTER NO. 8 : ARMORED VEHICLES MARKET – BY PRODUCT SEGMENT ANALYSIS
8.1. Armored Vehicles Market Overview by Product Segment
8.1.1. Armored Vehicles Market Revenue Share By Product
8.2. Combat Vehicles
8.2.1 Armored Personnel Carrier (APC)
8.2.2 Infantry Fighting Vehicles (IFV)
8.2.3 Light Protected Vehicles (LPV)
8.2.4 Main Battle Tanks (MBT)
8.2.5 Mine-resistant Ambush Protected (MRAP)
8.2.6 Tactical Vehicle
8.2.7 Others
8.3. Combat Support Vehicles
8.3.1 Armored Supply Trucks
8.3.2 Armored Command & Control Vehicles
8.3.3 Repair & Recovery Vehicles
8.3.4 Unmanned Armored Ground Vehicles
CHAPTER NO. 9 : ARMORED VEHICLES MARKET – BY TYPE SEGMENT ANALYSIS
9.1. Armored Vehicles Market Overview by Type Segment
9.1.1. Armored Vehicles Market Revenue Share By Type
9.2. Electric Armored Vehicles
9.3. Conventional Armored Vehicles
CHAPTER NO. 10 : ARMORED VEHICLES MARKET – BY MOBILITY SEGMENT ANALYSIS
10.1. Armored Vehicles Market Overview by Mobility Segment
10.1.1. Armored Vehicles Market Revenue Share By Mobility
10.2. Wheeled
10.3. Tracked
CHAPTER NO. 11 : ARMORED VEHICLES MARKET – BY MODE OF OPERATION SEGMENT ANALYSIS
11.1. Armored Vehicles Market Overview by Mode of Operation Segment
11.1.1. Armored Vehicles Market Revenue Share By Mode of Operation
11.2. Manned Armored Vehicles
11.3. Unmanned Armored Vehicles
CHAPTER NO. 12 : ARMORED VEHICLES MARKET – BY SYSTEM SEGMENT ANALYSIS
12.1. Armored Vehicles Market Overview by System Segment
12.1.1. Armored Vehicles Market Revenue Share By System
12.2. Engines
12.3. Drive Systems
12.4. Communication Systems
12.5. Fire Control Systems (FCS)
12.6. Navigation Systems
12.7. Others
CHAPTER NO. 13 : ARMORED VEHICLES MARKET – REGIONAL ANALYSIS
13.1. Armored Vehicles Market Overview by Region Segment
13.1.1. Global Armored Vehicles Market Revenue Share By Region
13.1.2. Regions
13.1.3. Global Armored Vehicles Market Revenue By Region
13.1.4. Product
13.1.5. Global Armored Vehicles Market Revenue By Product
13.1.6. Type
13.1.7. Global Armored Vehicles Market Revenue By Type
13.1.8. Mobility
13.1.9. Global Armored Vehicles Market Revenue By Mobility
13.1.10. Mode of Operation
13.1.12. Global Armored Vehicles Market Revenue By Mode of Operation
13.1.13. System
13.1.14. Global Armored Vehicles Market Revenue By System
CHAPTER NO. 14 : NORTH AMERICA ARMORED VEHICLES MARKET – COUNTRY ANALYSIS
14.1. North America Armored Vehicles Market Overview by Country Segment
14.1.1. North America Armored Vehicles Market Revenue Share By Region
14.2. North America
14.2.1. North America Armored Vehicles Market Revenue By Country
14.2.2. Product
14.2.3. North America Armored Vehicles Market Revenue By Product
14.2.4. Type
14.2.5. North America Armored Vehicles Market Revenue By Type
14.2.6. Mobility
14.2.7. North America Armored Vehicles Market Revenue By Mobility
14.2.8. Mode of Operation
14.2.9. North America Armored Vehicles Market Revenue By Mode of Operation
14.2.10. System
14.2.11. North America Armored Vehicles Market Revenue By System
14.3. U.S.
14.4. Canada
14.5. Mexico
CHAPTER NO. 15 : EUROPE ARMORED VEHICLES MARKET – COUNTRY ANALYSIS
15.1. Europe Armored Vehicles Market Overview by Country Segment
15.1.1. Europe Armored Vehicles Market Revenue Share By Region
15.2. Europe
15.2.1. Europe Armored Vehicles Market Revenue By Country
15.2.2. Product
15.2.3. Europe Armored Vehicles Market Revenue By Product
15.2.4. Type
15.2.5. Europe Armored Vehicles Market Revenue By Type
15.2.6. Mobility
15.2.7. Europe Armored Vehicles Market Revenue By Mobility
15.2.8. Mode of Operation
15.2.9. Europe Armored Vehicles Market Revenue By Mode of Operation
15.2.10. System
15.2.11. Europe Armored Vehicles Market Revenue By System
15.3. UK
15.4. France
15.5. Germany
15.6. Italy
15.7. Spain
15.8. Russia
15.9. Rest of Europe
CHAPTER NO. 16 : ASIA PACIFIC ARMORED VEHICLES MARKET – COUNTRY ANALYSIS
16.1. Asia Pacific Armored Vehicles Market Overview by Country Segment
16.1.1.Asia Pacific Armored Vehicles Market Revenue Share By Region
16.2. Asia Pacific
16.2.1. Asia Pacific Armored Vehicles Market Revenue By Country
16.2.2. Product
16.2.3. Asia Pacific Armored Vehicles Market Revenue By Product
16.2.4. Type
16.2.5. Asia Pacific Armored Vehicles Market Revenue By Type
16.2.6. Mobility
16.2.7. Asia Pacific Armored Vehicles Market Revenue By Mobility
16.2.8. Mode of Operation
16.2.9. Asia Pacific Armored Vehicles Market Revenue By Mode of Operation
16.2.10. System
16.2.11. Asia Pacific Armored Vehicles Market Revenue By System
16.3. China
16.4. Japan
16.5. South Korea
16.6. India
16.7. Australia
16.8. Southeast Asia
16.9. Rest of Asia Pacific
CHAPTER NO. 17 : LATIN AMERICA ARMORED VEHICLES MARKET – COUNTRY ANALYSIS
17.1. Latin America Armored Vehicles Market Overview by Country Segment
17.1.1. Latin America Armored Vehicles Market Revenue Share By Region
17.2. Latin America
17.2.1. Latin America Armored Vehicles Market Revenue By Country
17.2.2. Product
17.2.3. Latin America Armored Vehicles Market Revenue By Product
17.2.4. Type
17.2.5. Latin America Armored Vehicles Market Revenue By Type
17.2.6. Mobility
17.2.7. Latin America Armored Vehicles Market Revenue By Mobility
17.2.8. Mode of Operation
17.2.9. Latin America Armored Vehicles Market Revenue By Mode of Operation
17.2.10. System
17.2.11. Latin America Armored Vehicles Market Revenue By System
17.3. Brazil
17.4. Argentina
17.5. Rest of Latin America
CHAPTER NO. 18 : MIDDLE EAST ARMORED VEHICLES MARKET – COUNTRY ANALYSIS
18.1. Middle East Armored Vehicles Market Overview by Country Segment
18.1.1.Middle East Armored Vehicles Market Revenue Share By Region
18.2. Middle East
18.2.1. Middle East Armored Vehicles Market Revenue By Country
18.2.2. Product
18.2.3. Middle East Armored Vehicles Market Revenue By Product
18.2.4. Type
18.2.5. Middle East Armored Vehicles Market Revenue By Type
18.2.6. Mobility
18.2.7. Middle East Armored Vehicles Market Revenue By Mobility
18.2.8. Mode of Operation
18.2.9. Middle East Armored Vehicles Market Revenue By Mode of Operation
18.2.10. System
18.2.11. Middle East Armored Vehicles Market Revenue By System
18.3. GCC Countries
18.4. Israel
18.5. Turkey
18.6. Rest of Middle East
CHAPTER NO. 19 : AFRICA ARMORED VEHICLES MARKET – COUNTRY ANALYSIS
19.1. Africa Armored Vehicles Market Overview by Country Segment
19.1.1. Africa Armored Vehicles Market Revenue Share By Region
19.2. Africa
19.2.1. Africa Armored Vehicles Market Revenue By Country
19.2.2. Product
19.2.3. Africa Armored Vehicles Market Revenue By Product
19.2.4. Type
19.2.5. Africa Armored Vehicles Market Revenue By Type
19.2.6. Mobility
19.2.7. Africa Armored Vehicles Market Revenue By Mobility
19.2.8. Mode of Operation
19.2.9. Africa Armored Vehicles Market Revenue By Mode of Operation
19.2.10. System
19.2.11. Africa Armored Vehicles Market Revenue By System
19.3. South Africa
19.4. Egypt
19.5. Rest of Africa
CHAPTER NO. 20 : COMPANY PROFILES
20.1. AE Systems
20.1.1. Company Overview
20.1.2. Mobility Portfolio
20.1.3. Financial Overview
20.1.4.Recent Developments
20.1.5. Growth Strategy
20.1.6. SWOT Analysis
20.2. BMW AG
20.3. Daimler AG (Mercedes Benz)
20.4. Elbit Systems
20.5. Ford Motor Company
20.6. General Dynamics Corporation
20.7. INKAS Armored Vehicle OEM
20.8. International Armored Group
20.9. IVECO
20.10. Krauss-Maffei Wegmann GmbH & Co. (KMW)
20.11 Lenco Industries, Inc.
20.12. Lockheed Martin Corporation
20.13. Navistar, Inc.
20.14. Oshkosh Defense, LLC
20.15. Rheinmetall AG
20.16. STAT, Inc.
20.17. Textron, Inc.
20.18. Thales Group.