
Masstige ranges and online reorders widen complexion use
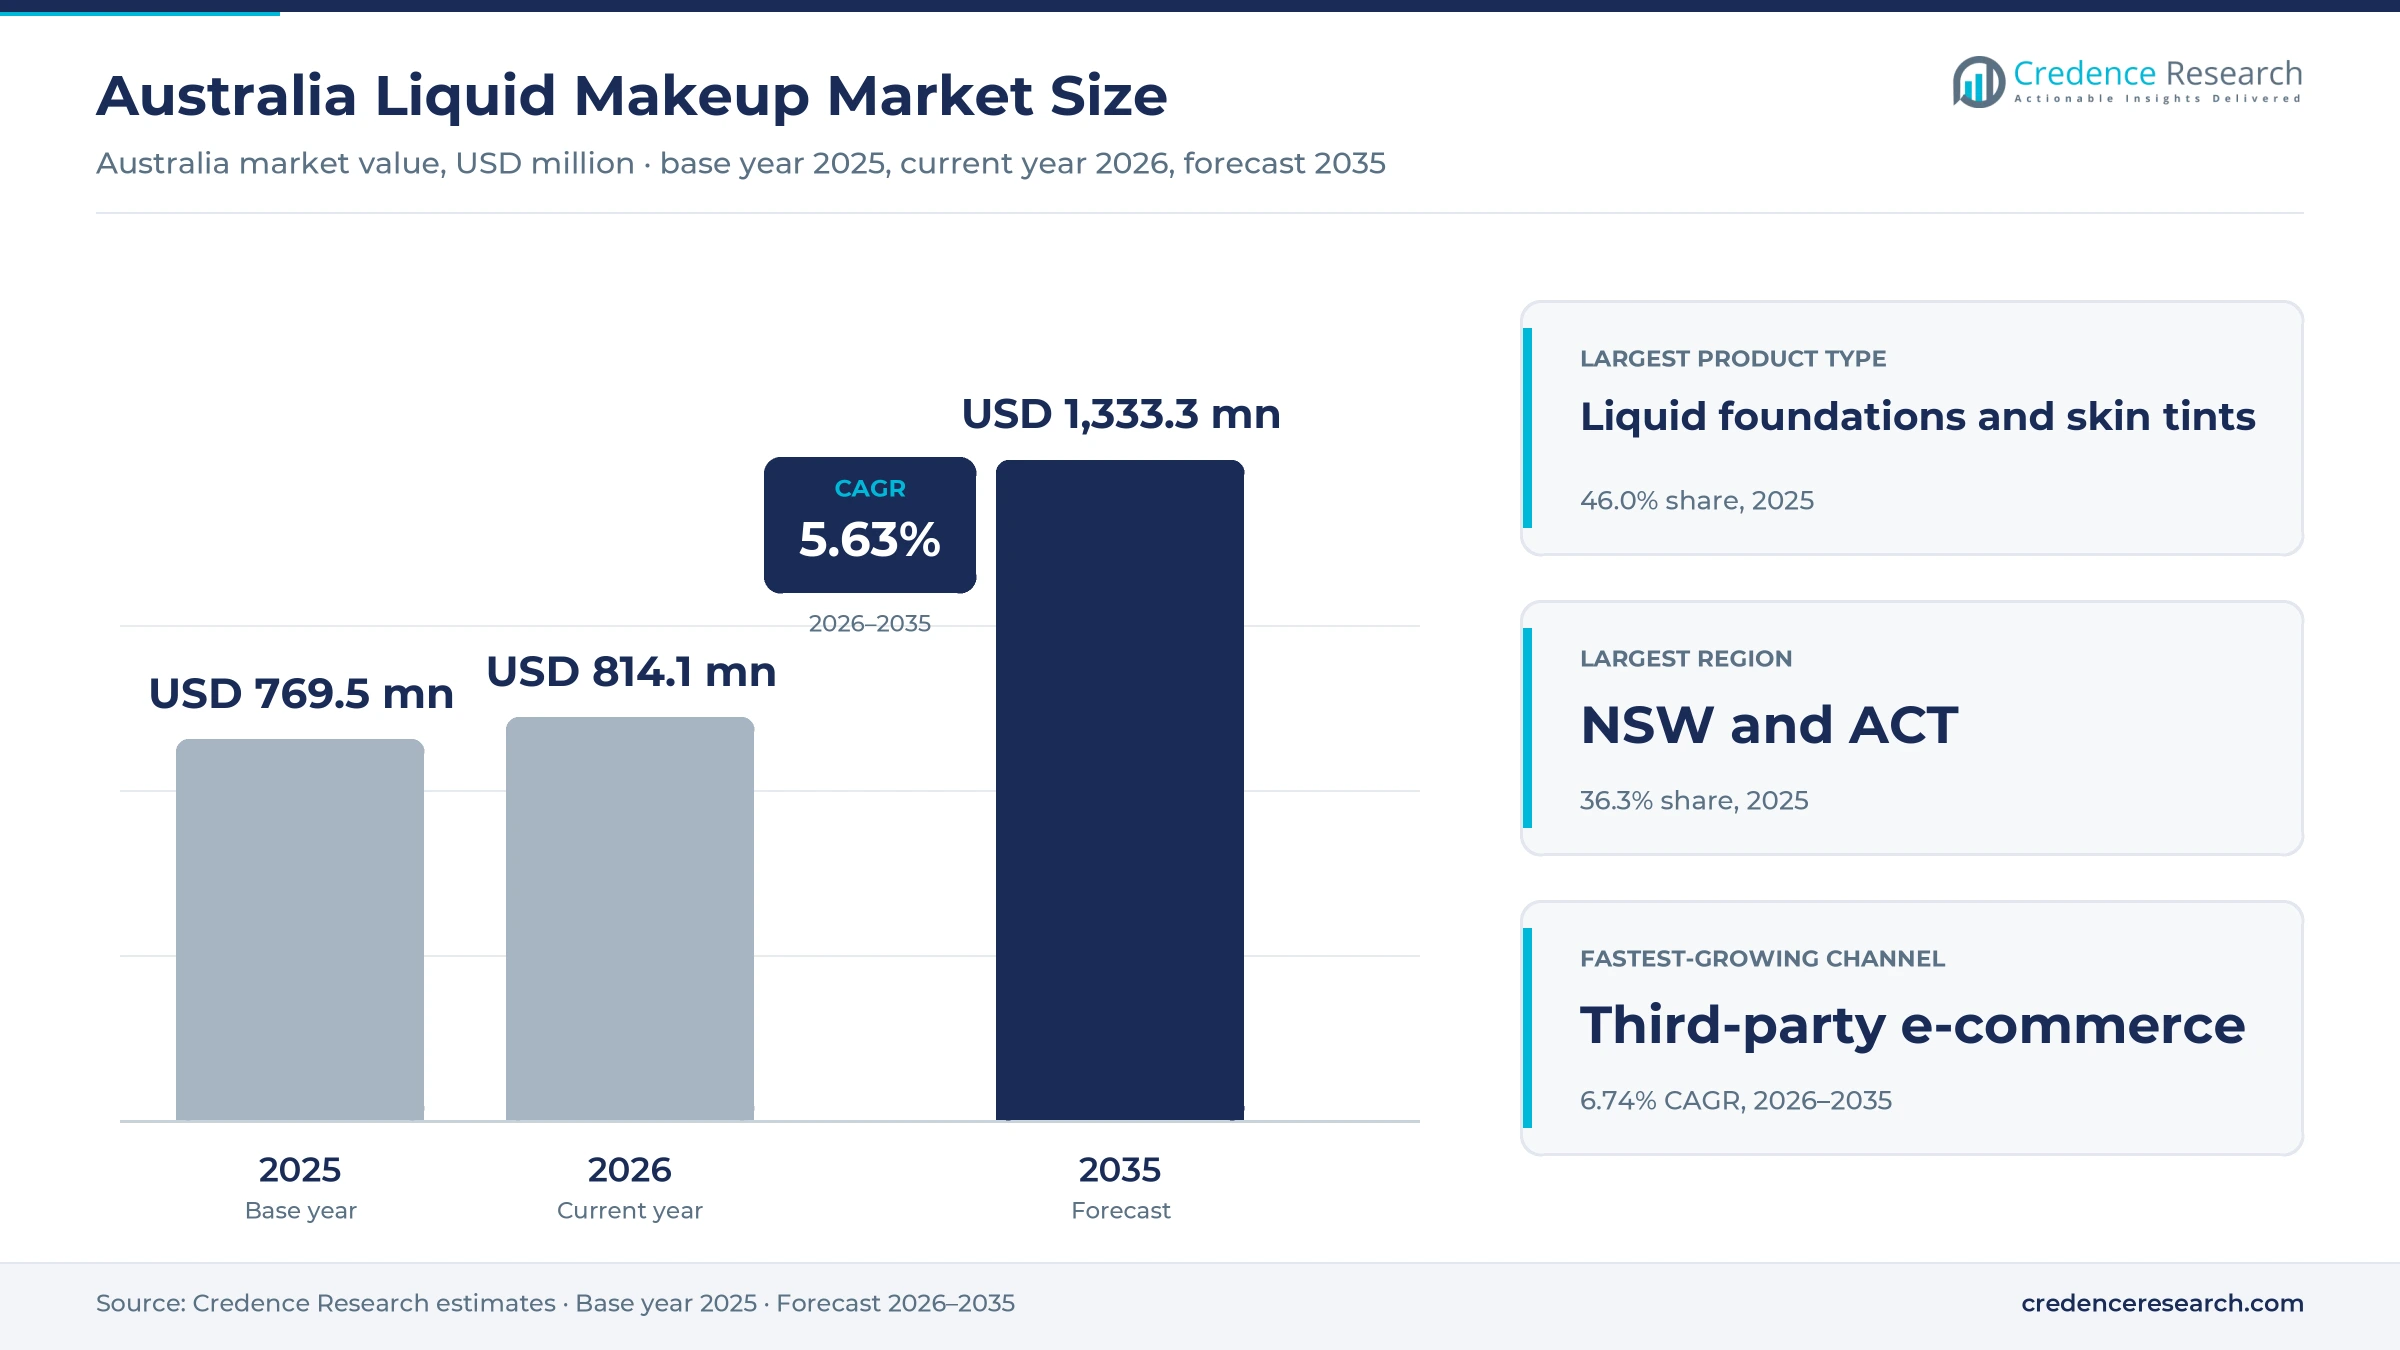
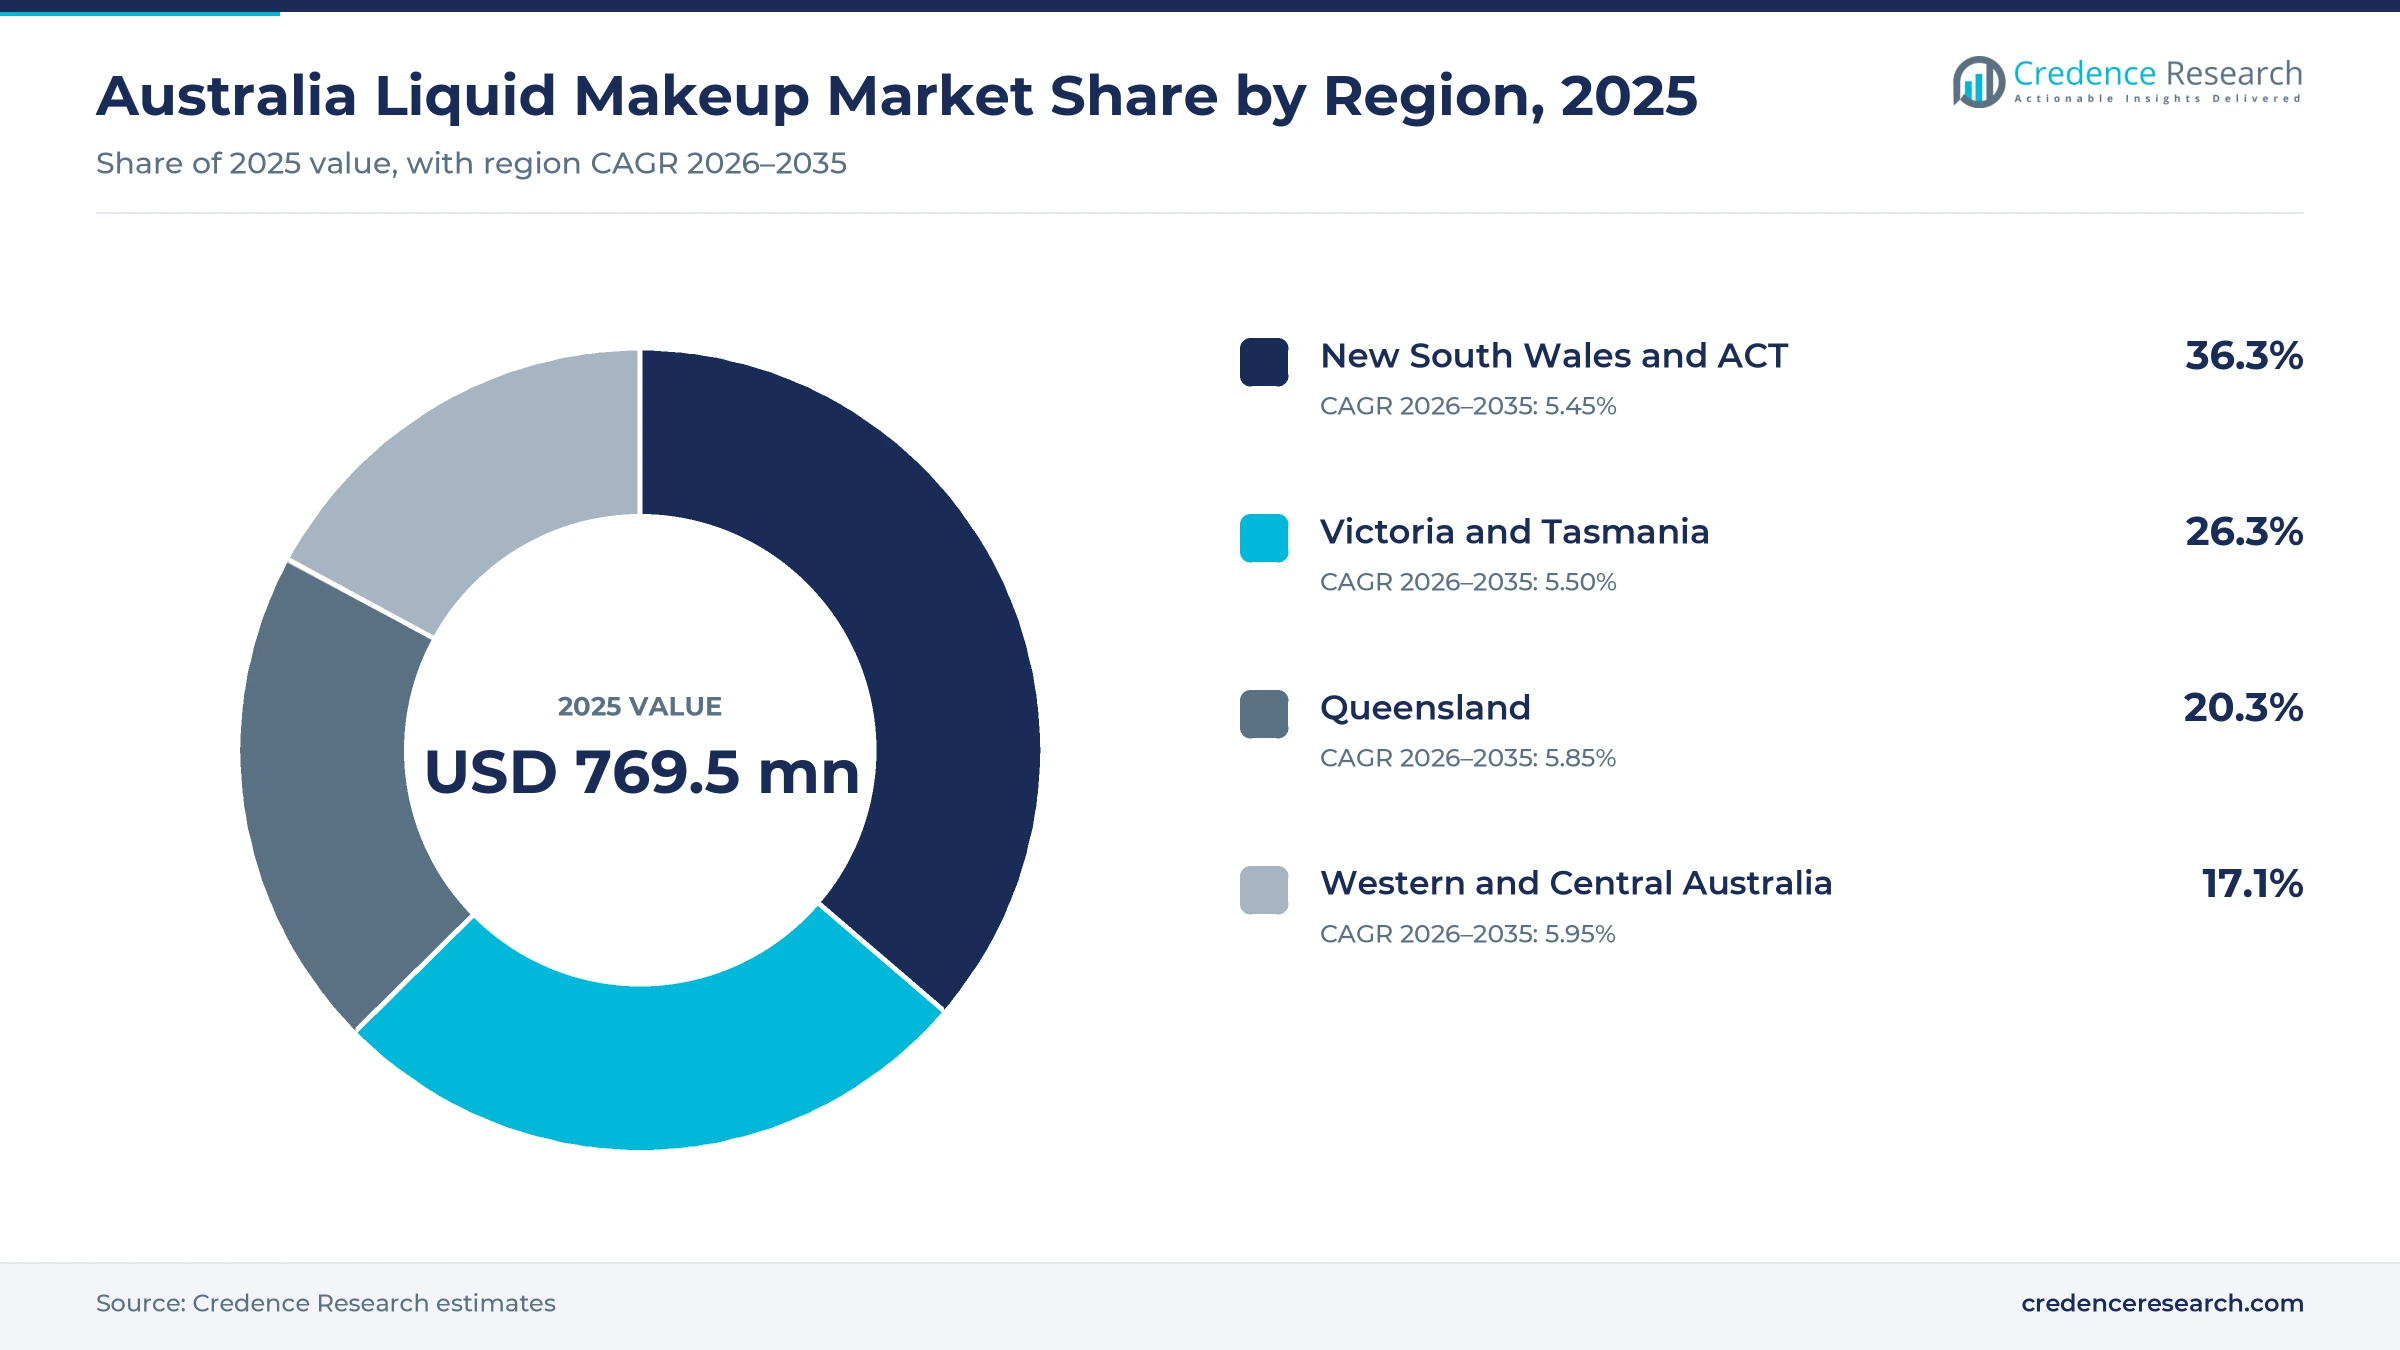
The Australia liquid makeup market was valued at USD 769.5 million in 2025 and is projected to increase from USD 814.1 million in 2026 to USD 1.33 billion by 2035, registering a CAGR of 5.63% during 2026–2035. Demand comes from personal buyers who replace foundations, concealers, blushes and lip tints, from shoppers trying new shades and from professional artists who prepare clients for events. New South Wales and ACT held the largest regional share, 36.3% in 2025, because the zone had about 9.16 million residents at March 2026. Western and Central Australia is the fastest-growing region at 5.95% a year, as Western Australia led population growth at 2.1%. In turn, pharmacy chains, specialist stores and online marketplaces are widening access to masstige ranges priced below prestige brands.
Which fluid complexion and color products are counted in Australia?
The estimate measures spending in Australia on liquid foundations and skin tints, concealers and correctors, blushes, bronzers and highlighters, and eye and lip color sold in pump, dropper, tube and applicator packs. It covers value, masstige, prestige and luxury ranges bought by personal buyers and professional artists through pharmacies, specialist stores and online channels. Values are stated in USD million at retail prices and exclude goods and services tax.
The estimate excludes powders, sticks, pressed palettes, skin care without color and sunscreens registered as therapeutic goods. The value chain runs from global and local brand owners and contract makers through importers and distributors to pharmacies, department stores, beauty specialists, brand websites and marketplaces.
Australia Liquid Makeup Market Insights
- The Australia liquid makeup market was valued at USD 769.5 million in 2025 and is projected to reach USD 1.33 billion by 2035, at a 5.63% CAGR during 2026–2035.
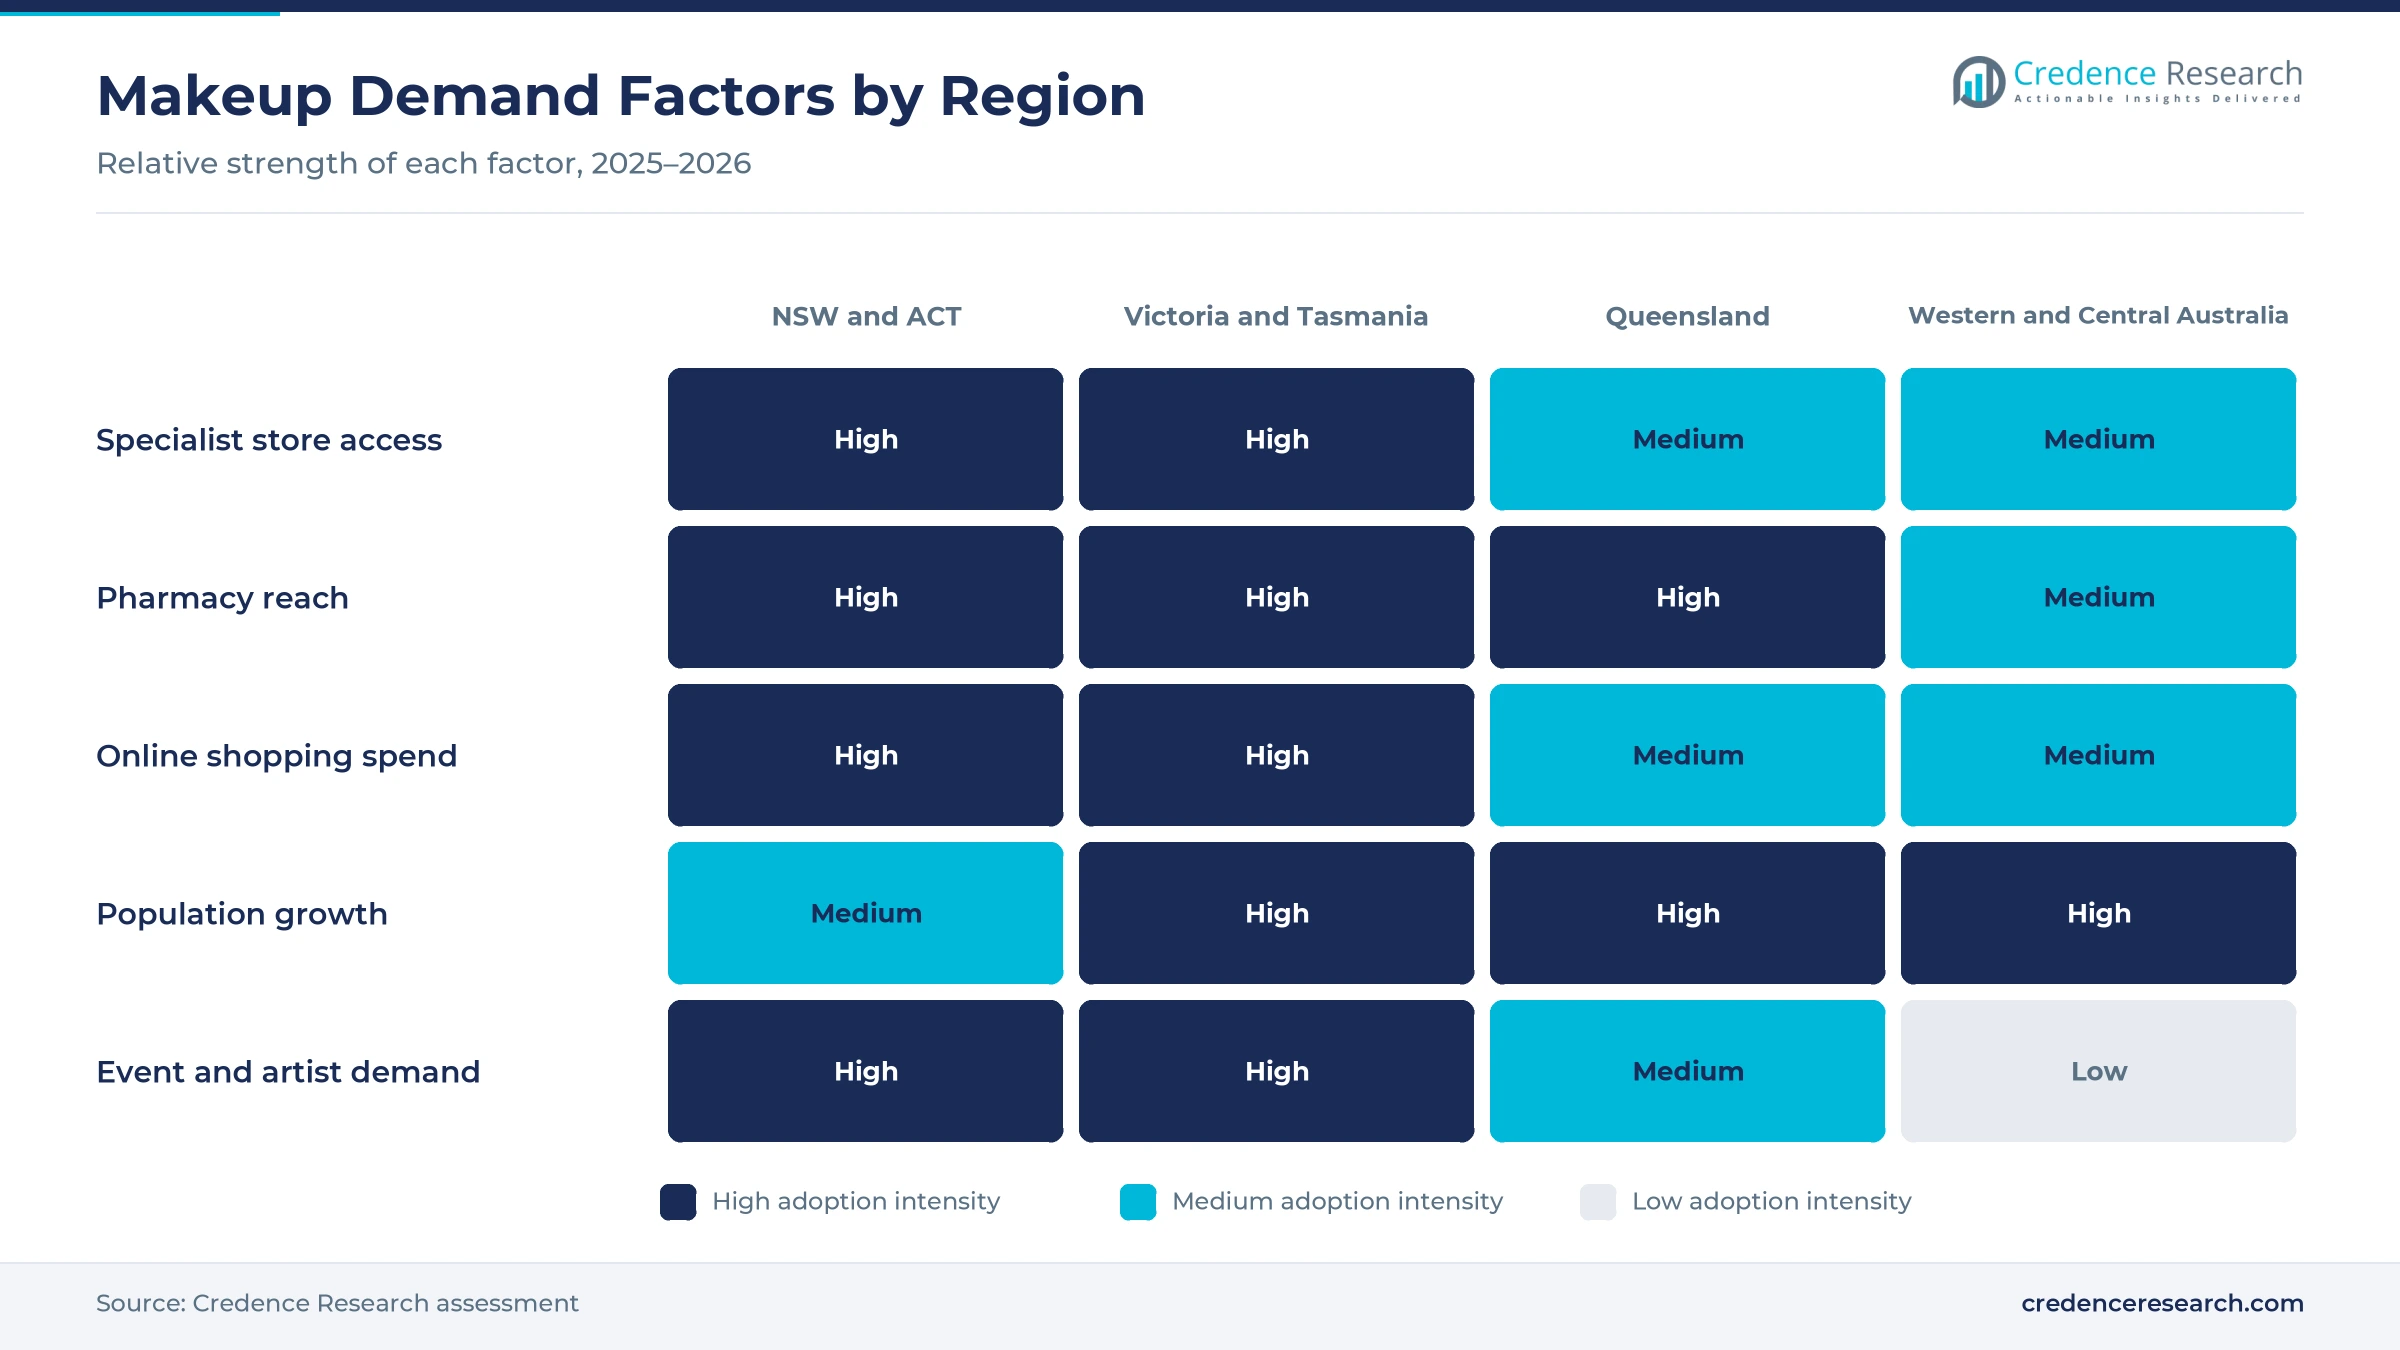
- New South Wales and ACT held 36.3% of 2025 value, because the zone hosts the largest population and the highest online shopping spend.
- Liquid foundations and skin tints led product types with 46.0% of 2025 value, as complexion products are replaced most often.
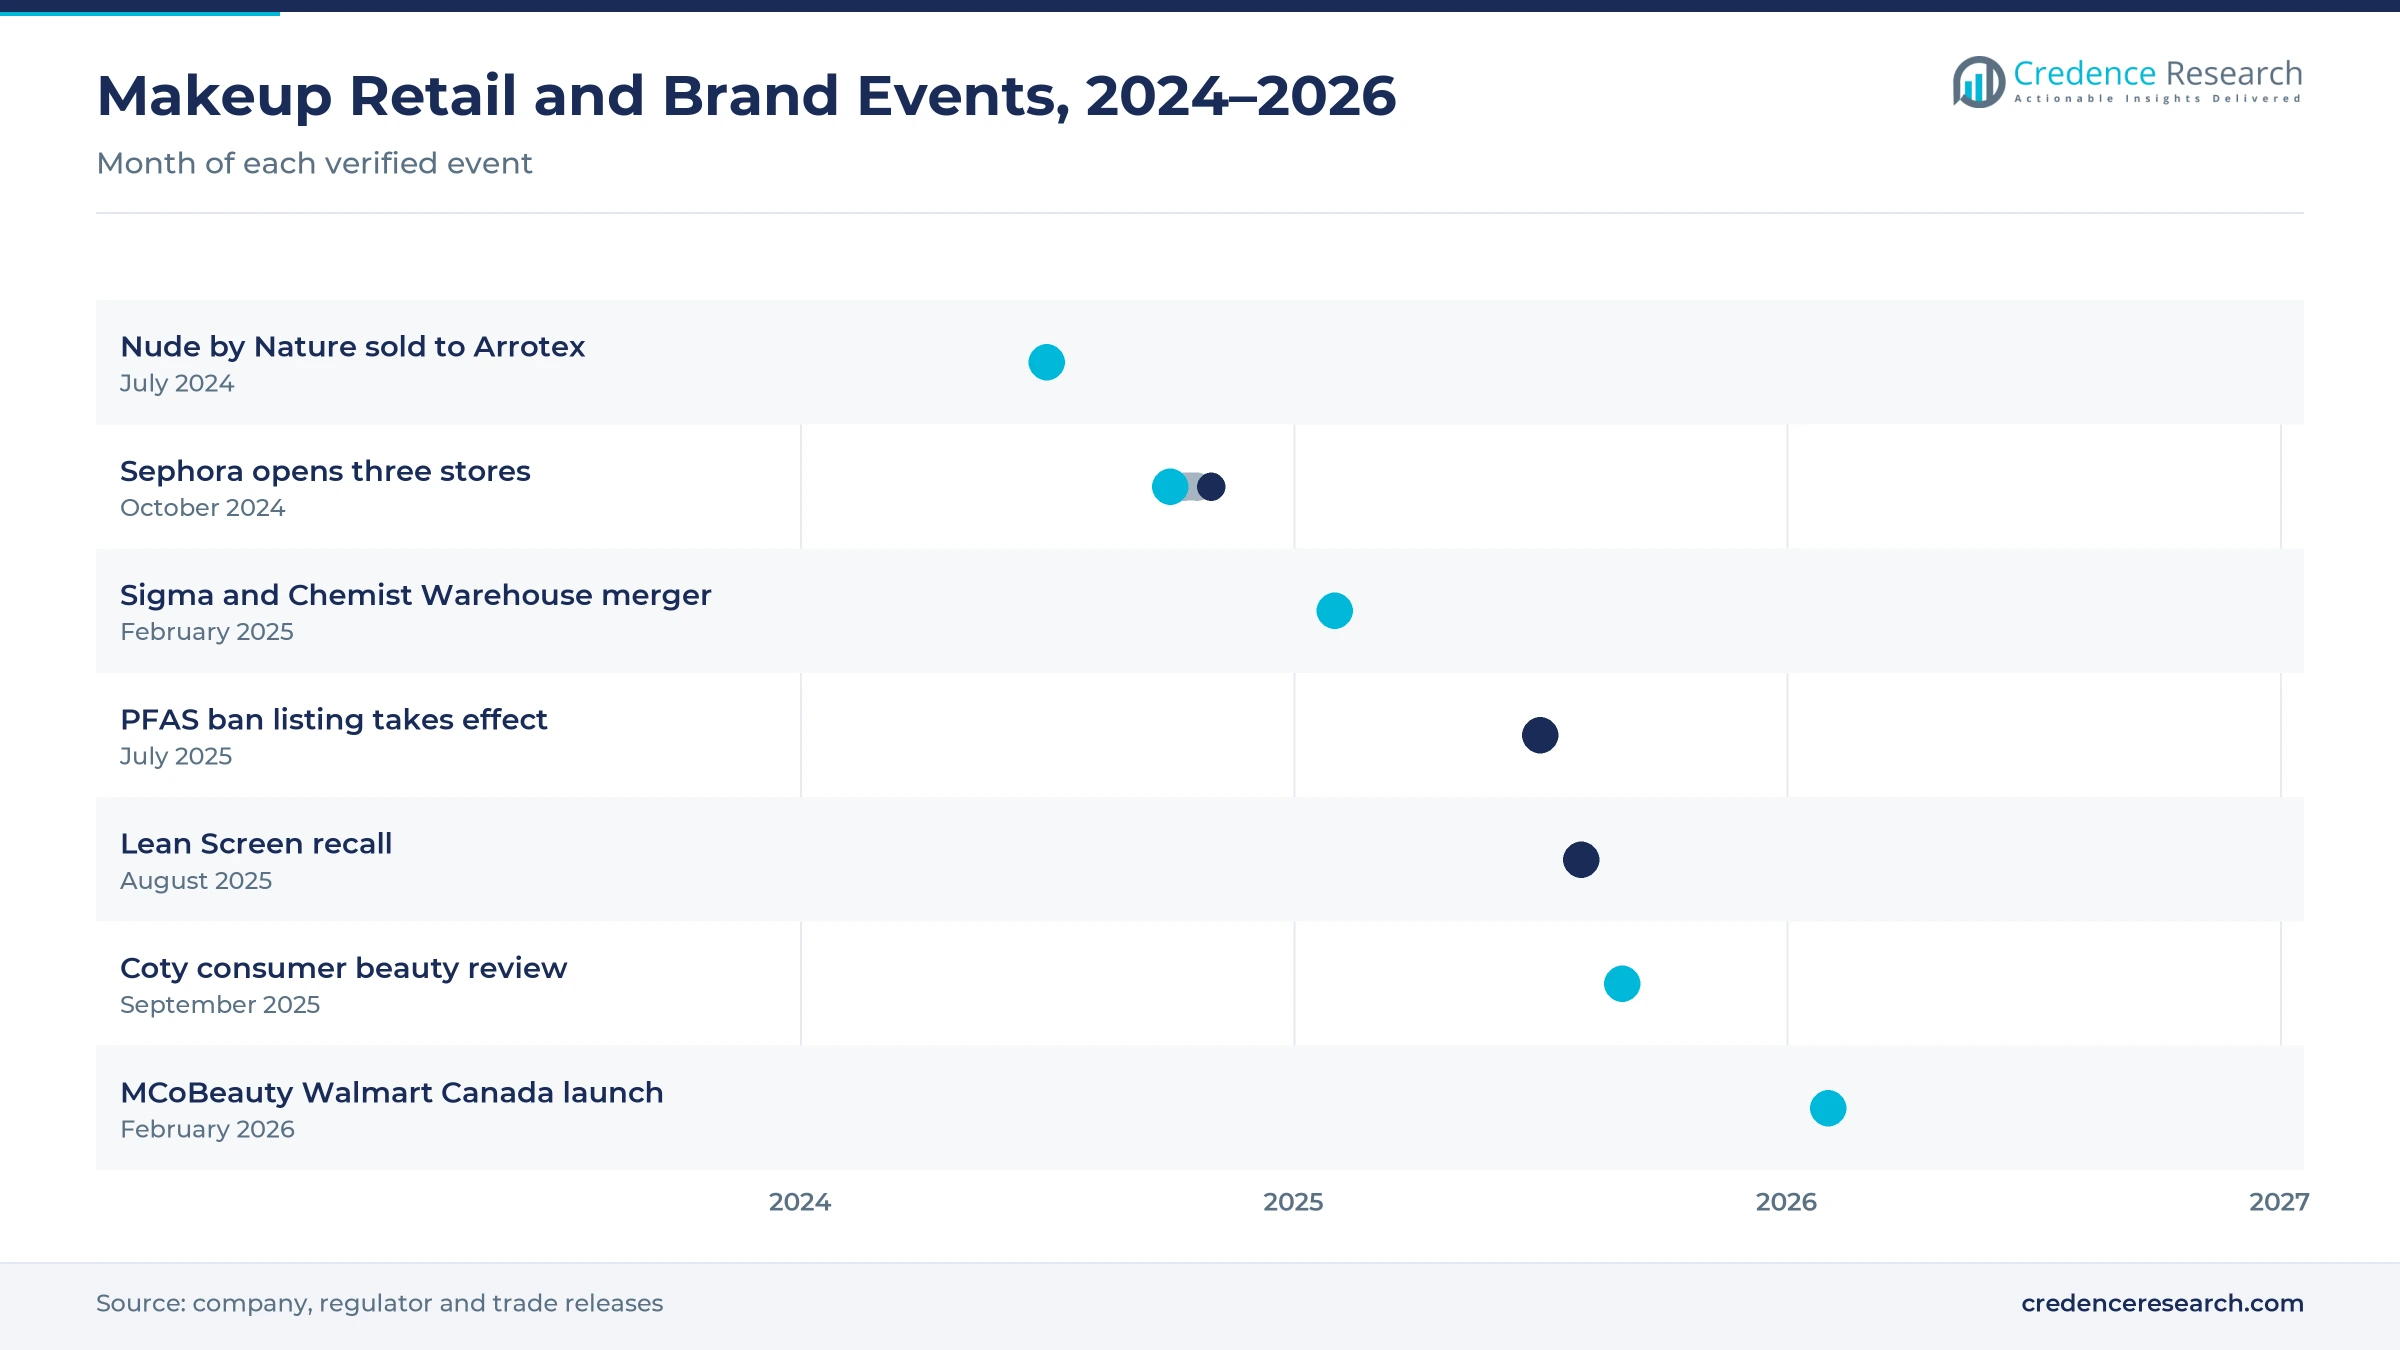
- Sigma Healthcare completed its merger with Chemist Warehouse in February 2025, which joined two of the largest pharmacy networks selling makeup.
- Third-party e-commerce grows fastest among channels at 6.74% a year during 2026–2035, as marketplaces win more beauty reorders.
Foundations lead as blush and bronzer formats grow fastest
Why do foundations and skin tints lead demand?
Based on product type, the market is categorized into liquid foundations and skin tints, liquid concealers and correctors, liquid blushes, bronzers and highlighters, and liquid eye and lip colour. Liquid foundations and skin tints led with 46.0% of 2025 value, because complexion products are used daily and replaced often. Liquid blushes, bronzers and highlighters grow fastest at 6.40% a year, as buyers add sheer color to light routines.
How do price tiers split complexion spending?
Based on price tier, the market is categorized into value, masstige, prestige and luxury ranges. Prestige led with 34.0% of 2025 value, because specialist stores and department stores sell many high-priced foundations with wide shade ranges. Masstige grows fastest at 6.25% a year, as local and global brands offer prestige-style formulas at pharmacy prices, which draws buyers who once paid full prestige prices for liquid makeup.
Which buyers account for most purchases?
Based on customer type, the market is categorized into personal buyers under 30, personal buyers aged 30-44, personal buyers aged 45 and above, and professional makeup artists. Personal buyers under 30 led with 35.0% of 2025 value, because younger buyers try more shades and finishes. Personal buyers under 30 grow fastest at 6.07% a year, as creator content and online stores drive frequent trial.
Where do Australian buyers purchase complexion products?
Based on distribution channel, the market is categorized into pharmacies and mass retailers, beauty specialists and department stores, brand-owned e-commerce and third-party e-commerce. Pharmacies and mass retailers led with 38.0% of 2025 value, because pharmacy chains reach most suburbs and towns. Third-party e-commerce grows fastest at 6.74% a year, as marketplaces win routine reorders from buyers who already know their shade and want fast, low-cost delivery.
| Segment Group | Leading Sub-segment | Share, 2025 | Fastest-growing Sub-segment | CAGR, 2026–2035 |
|---|---|---|---|---|
| By Product Type | Liquid foundations and skin tints | 46.0% | Liquid blushes, bronzers and highlighters | 6.40% |
| By Price Tier | Prestige | 34.0% | Masstige | 6.25% |
| By Customer Type | Personal buyers under 30 | 35.0% | Personal buyers under 30 | 6.07% |
| By Distribution Channel | Pharmacies and mass retailers | 38.0% | Third-party e-commerce | 6.74% |
Request a Free Sample
Fill in your details and we'll send you a free sample report.
- Sample data tables & charts
- Research methodology
Affordable quality and online reorders drive demand
How does accessible performance broaden product trial?
Accessible performance broadens trial, because buyers can now find prestige-style textures and shades at mass prices. MCoBeauty, launched in Australia in 2016, sells vegan and cruelty-free makeup with all products priced under USD 20. Nude by Nature's Natural Mineral Cover Foundation was the fifth-biggest seller in Australian pharmacies, and the brand sold through more than 2,370 retail doors, according to BeautyMatter. e.l.f. Beauty also launched in Coles, its first Australian grocery channel, and planned a wider Priceline range from fall 2024, according to a company release. As a result, masstige liquid makeup grows fastest among price tiers at 6.25% a year, as more buyers trade into quality at lower prices.
Why does digital replenishment lower purchase friction?
Digital replenishment lowers purchase friction, because buyers who know their shade can reorder a foundation in minutes. Australians spent a record AUD 82.6 billion online in 2025, up 13.9% from the year before, according to Australia Post data. About 96.1% of Australians used the internet in 2024, according to the World Bank. Millennials spent AUD 29.7 billion online in 2025, while Gen Z shoppers spent AUD 14.6 billion. Online marketplaces generated about AUD 200 million of beauty sales in the fourth quarter of 2025, matching specialist retailers. Consequently, third-party e-commerce grows fastest among liquid makeup channels at 6.74% a year, as shoppers compare shades, reviews and delivery times.
How do skin-compatible complexion formats expand use?
Skin-compatible complexion formats expand use, because buyers want light textures that feel like skin care and suit daily wear. Nude by Nature positions its range as clean, high-performance makeup and skin care, and Arrotex Pharmaceuticals bought the brand on July 8, 2024, for a new health and beauty group named VidaCorp. MCoBeauty also sells vegan beauty and skin care, which links color with gentle formulas. In October 2025, L'Oréal Groupe showcased its 36-brand portfolio across fragrance, skin, hair and makeup at SXSW Sydney, with free skin checks for visitors. As a result, liquid foundations and skin tints lead product types with 46.0% of 2025 value, as sheer tints replace heavier bases in many routines.
Why does pharmacy reach widen access across states?
Pharmacy reach widens access across states, because chains sell makeup in suburbs and towns that lack department stores. Sigma Healthcare completed its merger with Chemist Warehouse in February 2025, and Chemist Warehouse had 658 outlets at Dec. 31, 2024. Sigma also runs the Amcal and Discount Drug Stores pharmacy chains across Australia. Napoleon Perdis became the first premium label in Priceline stores in June 2018, which opened pharmacy shelves to higher-priced complexion lines. Australia also had 27.9 million residents at March 2026, according to the Australian Bureau of Statistics. In turn, pharmacies and mass retailers lead channels with 38.0% of 2025 value.
Dupes, SPF scrutiny and new specialist stores shape demand
How is the rise of local dupe brands reshaping shelves?
The rise of local dupe brands is reshaping shelves, because Australian masstige labels now copy prestige looks and sell them at lower prices. MCoBeauty built its range mostly on lower-priced versions of luxury products with glass components and premium-style packs. The brand debuted in the United States in spring 2024 at the Kroger family of stores and also sells through Target and Amazon. In 2026, it launched at Walmart Canada in more than 247 stores and online. Pump bottles and premium cosmetics packaging help these brands look like prestige lines. Consequently, prestige brands face sharper price comparison on pharmacy and online shelves.
Why is scrutiny of SPF claims rising for tinted products?
Scrutiny of SPF claims is rising, because a 2025 sunscreen test raised doubts about how protection is measured and labeled. CHOICE tested 20 sunscreens in June 2025 and found that 16 did not meet their SPF 50+ claims, according to Cosmetics Design Asia. The regulator later reported that one base formulation was unlikely to exceed SPF 21, and the Lean Screen product was recalled in August 2025. The same report noted that color tints and fragrances can alter a product's SPF level. As a result, brands of tinted foundations and skin tints are reviewing test labs, claims and labels before launch.
Can new specialist stores open room for premium ranges?
New specialist stores open room for premium ranges, because each opening puts more than 100 brands in front of new shoppers. Sephora opened stores at Westfield Marion, Fountain Gate and North Lakes in October and November 2024, which lifted its Australian network from 31 to 34 stores. Each store stocks brands such as Rare Beauty and Fenty Beauty, part of the Kendo portfolio sold in more than 60 countries. Its redesigned Melbourne flagship covers about 7,500 square feet and hosts the first Sephora Beauty School in Australia. Consequently, specialist channels can lift sales of luxury cosmetics and prestige foundations in Adelaide, Melbourne and Brisbane suburbs.
Is there an opening as global portfolios are reshaped?
The reshaping of global portfolios offers an opening, because brand sales and reviews can shift shelf space and marketing support. On Sept. 29, 2025, Coty launched a strategic review of its consumer beauty business, including CoverGirl, Rimmel, Sally Hansen and Max Factor. Crescent Capital Partners sold Nude by Nature to Arrotex after nearly 10 years of ownership in July 2024. Kendo Brands, a division of LVMH, also develops brands such as Fenty Beauty and KVD Beauty for global retail. In turn, local labels and Korean beauty products can win shelf space in pharmacies and online stores where mass color brands lose focus.
Claim checks, price pressure and shade stock weigh on brands
How do claim checks raise launch costs?
Claim checks raise launch costs, because tinted products with SPF, long-wear or skin-care claims need reliable testing. The 2025 sunscreen review showed how one weak test result can force recalls across several brands. As a result, smaller labels may delay launches or drop SPF claims. Brands respond by using several test labs, keeping clear records and separating color products from primary sunscreens. This approach protects buyer trust in tinted liquid makeup with sun protection claims.
Why does price competition squeeze margins?
Price competition squeezes margins, because dupe brands sell prestige-style formulas at much lower prices. MCoBeauty prices all products under USD 20, while marketplaces make price comparison instant. Consequently, prestige brands must defend value with shade range, service and launches. Mass brands also face higher promotion costs to stay visible on crowded pharmacy and online shelves. In response, many brands focus on hero products and creator marketing rather than wide ranges.
How do wide shade ranges strain inventory?
Wide shade ranges strain inventory, because each foundation may need dozens of shades across several sizes. Pharmacies and specialist stores have limited shelf space, so slow shades tie up cash and risk expiry. In turn, retailers trim ranges, which frustrates buyers with deeper or fairer tones. Brands respond with online-only shades, sample sizes and shade-matching tools that cut returns and waste. These tools also help buyers in regional towns find a match without visiting a counter.
Will chemical rules add formulation work?
Chemical rules add formulation work, because Australia listed PFOS, PFOA and PFHxS for import, export, manufacture and use bans from July 1, 2025. The listing applies to these chemicals in mixtures and articles, although each jurisdiction must adopt it in its own law. As a result, brands must check ingredients and packaging from global suppliers before each shipment. Suppliers respond with ingredient audits, supplier declarations and fluorine-free formulas for long-wear products.
NSW and ACT lead while western states grow fastest
| Region | Value, 2025 (USD million) | Share, 2025 | CAGR, 2026–2035 |
|---|---|---|---|
| New South Wales and ACT | 279.3 | 36.3% | 5.45% |
| Victoria and Tasmania | 202.4 | 26.3% | 5.50% |
| Queensland | 156.2 | 20.3% | 5.85% |
| Western and Central Australia | 131.6 | 17.1% | 5.95% |
Why do New South Wales and the ACT lead demand?
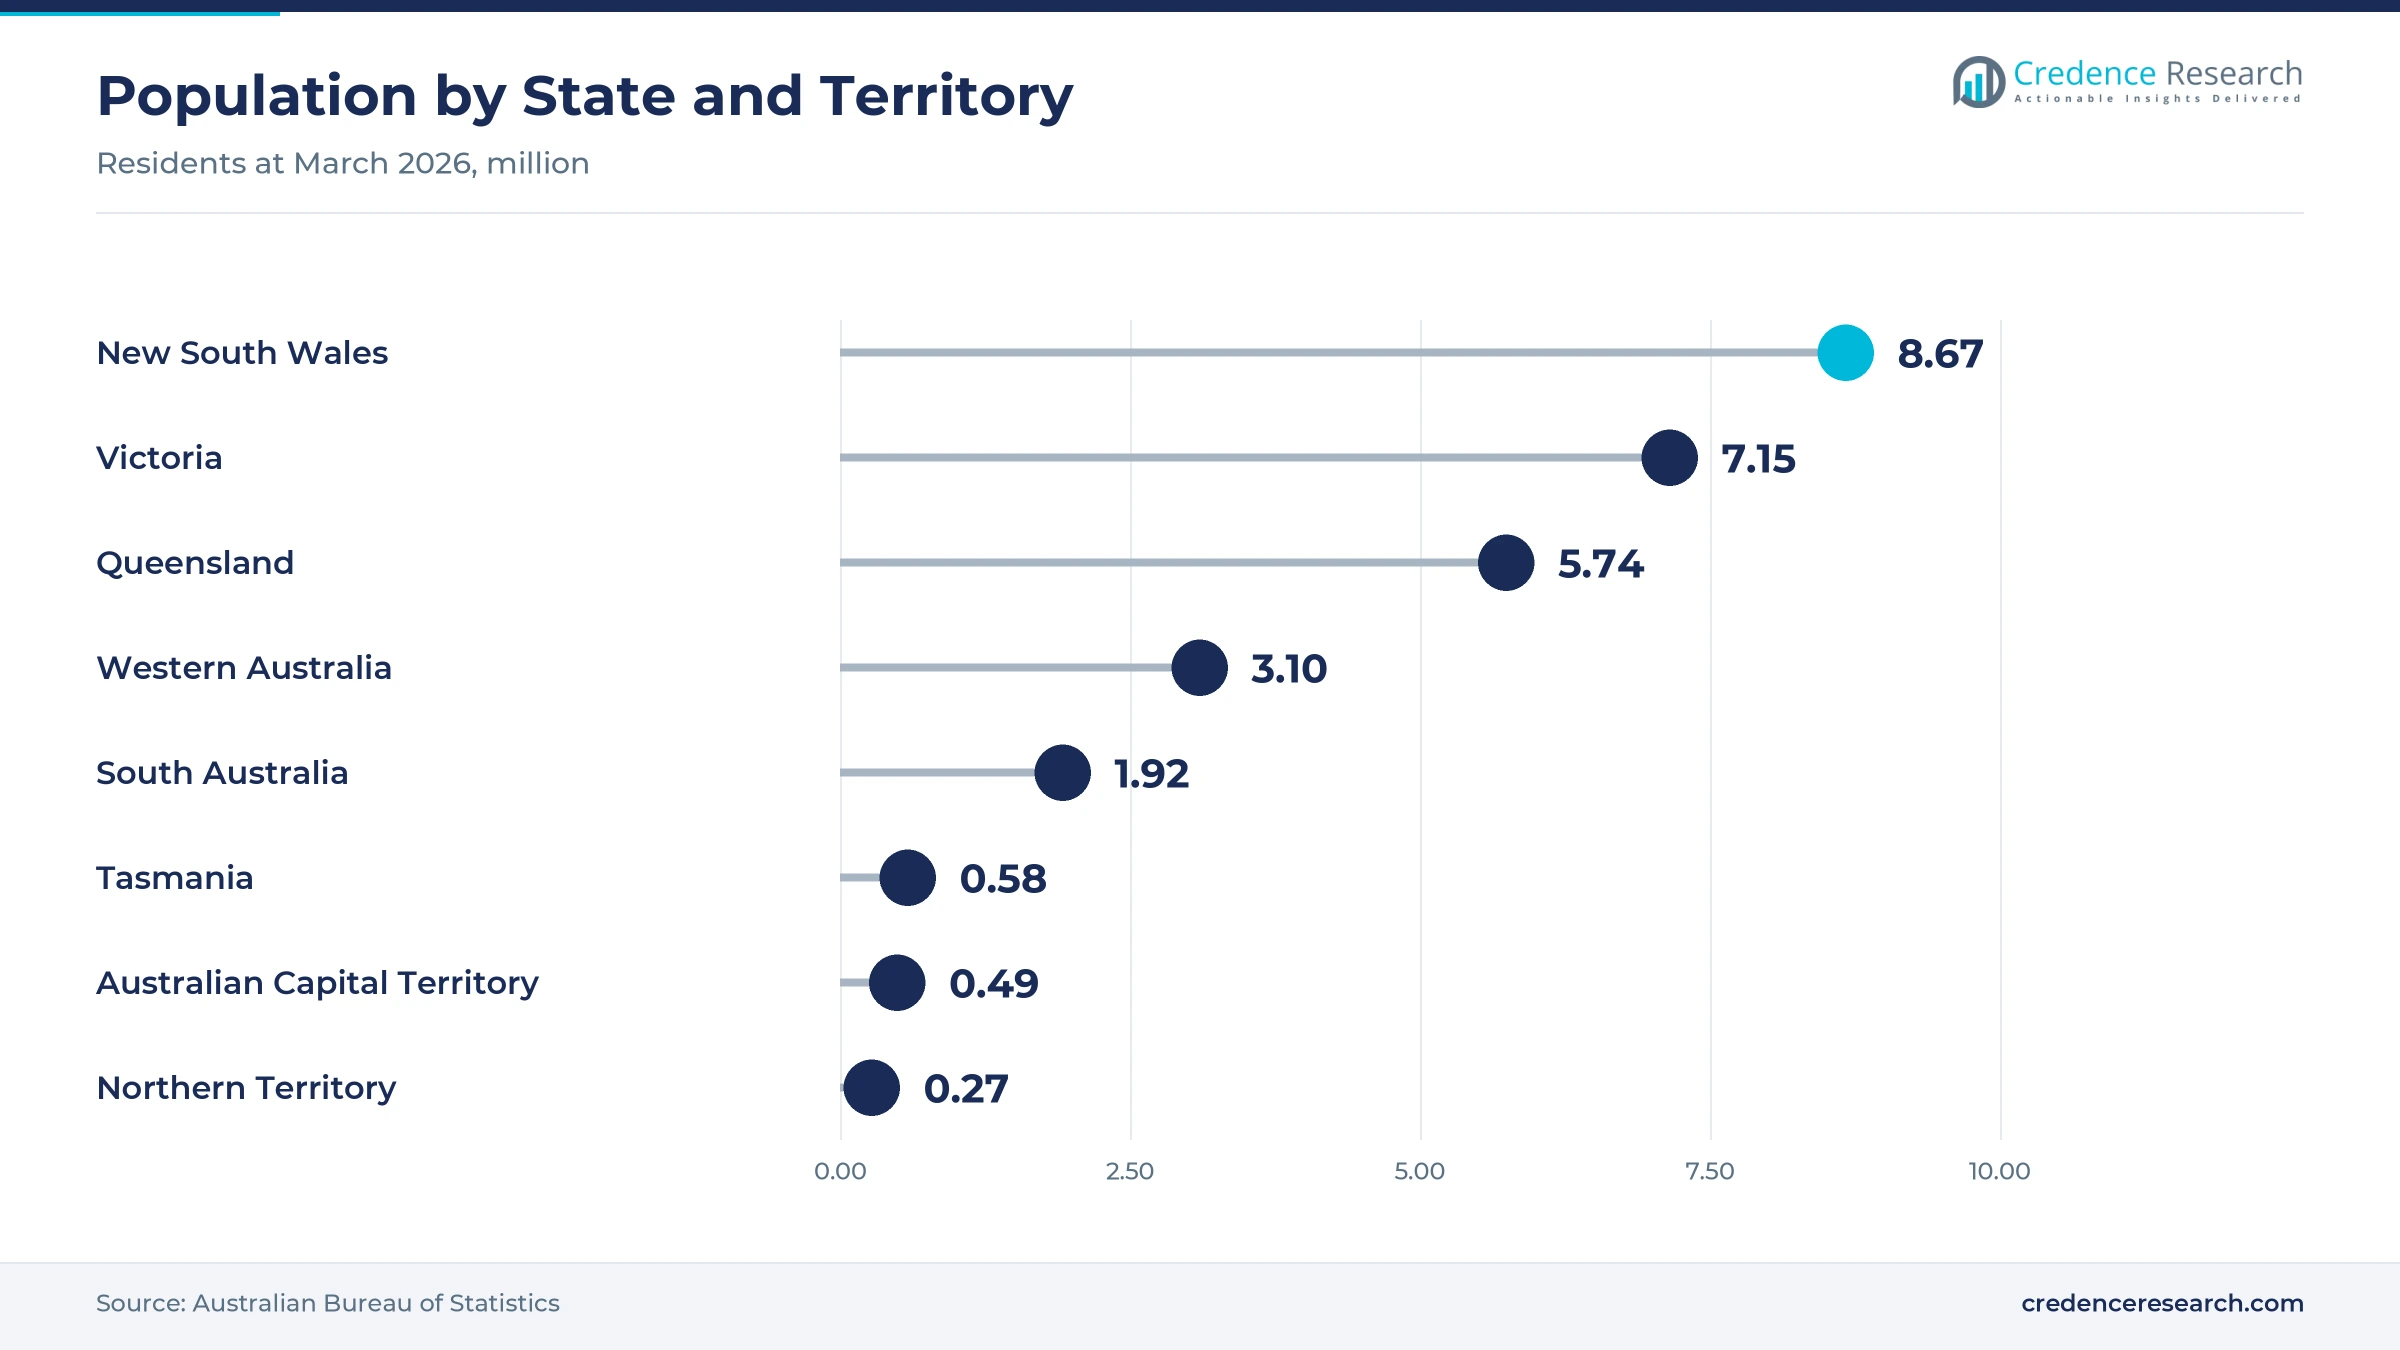
New South Wales and ACT held 36.3% of 2025 value and grows at 5.45% a year. New South Wales had 8.67 million residents at March 2026, while its households spent AUD 26.4 billion online in 2025, the most of any state. Sydney also hosted the L'Oréal Groupe showcase at SXSW Sydney in October 2025. As a result, the zone keeps the largest share of prestige and pharmacy makeup sales through 2035.
How do Victoria and Tasmania support specialist sales?
Victoria and Tasmania held 26.3% of 2025 value and grow at 5.50% a year. Victoria added 109,500 residents in the year to March 2026, the largest increase of any state, and Victorians spent AUD 20 billion online in 2025. Sephora opened at Westfield Fountain Gate in October 2024 and runs its redesigned flagship in Melbourne. Consequently, specialist stores and online reorders drive demand for liquid makeup among 7.15 million Victorians, mainly in Melbourne and its suburbs.
Why does Queensland add strong pharmacy and online demand?
Queensland held 20.3% of 2025 value and grows at 5.85% a year, because its population grew 1.6% to 5.74 million in the year to March 2026. Queensland households also spent AUD 17.8 billion online during 2025. Sephora opened at Westfield North Lakes in Brisbane in November 2024, which widened access to prestige brands. In turn, Queensland demand for liquid makeup keeps rising through 2035 as growing suburbs add pharmacy, specialist and online buyers.
Why are Western and Central Australia the fastest zone?
Western and Central Australia held 17.1% of 2025 value and grows fastest at 5.95% a year. Western Australia grew 2.1% in the year to March 2026, the fastest rate of any state, while South Australia reached 1.92 million residents. Sephora also opened at Westfield Marion in Adelaide in October 2024. As a result, demand for liquid makeup in the zone rises as 3.10 million Western Australians rely more on online and pharmacy channels.
Brand sales, store openings and SPF reviews, 2024–2026
| Development | Status and market relevance |
|---|---|
| In July 2024, Arrotex Pharmaceuticals acquired Nude by Nature from Crescent Capital Partners for its new VidaCorp health and beauty group. | Moves a leading pharmacy complexion brand to local ownership |
| In October 2024, Sephora opened stores at Westfield Marion and Westfield Fountain Gate, followed by North Lakes in November. | Widens specialist access in three states |
| In February 2025, Sigma Healthcare completed its merger with Chemist Warehouse. | Joins large pharmacy networks that sell makeup |
| In August 2025, the Lean Screen SPF 50+ product was recalled after testing raised doubts about its SPF claim. | Raises scrutiny of tinted SPF claims |
| In September 2025, Coty launched a strategic review of its consumer beauty brands, including CoverGirl, Rimmel and Max Factor. | May shift mass color shelf space |
Light textures, pumps and online shade tools shape use
- Lightweight emulsions blend pigment with water and skin-care actives, which gives sheer coverage that feels close to bare skin.
- Airless pump bottles limit air contact and dose a steady amount, which protects formulas and reduces waste at the end of use.
- Dropper bottles let buyers mix a few drops of tint into moisturizer, which builds coverage step by step.
- Online shade-matching tools compare skin tone photos with shade libraries, which cuts wrong purchases and returns on web orders.
Need a Custom Version of This Report?
Tailor the scope, geography, or segments to your exact requirements.
- Custom geography or segment scope
- Direct access to our analyst team
Brands compete on price, shade range and retail reach
Competition combines global beauty groups, local masstige brands and pharmacy-led labels. L'Oréal Groupe runs a 36-brand portfolio in Australia, while The Estée Lauder Companies, Shiseido Company and Coty sell prestige and mass color through specialist and department stores. e.l.f. Beauty expanded into Coles and Priceline, and MCoBeauty sells lower-priced versions of luxury looks under USD 20. Nude by Nature, now owned by Arrotex, holds strong pharmacy distribution, while Napoleon Perdis sells premium lines through Priceline. Kendo Brands supplies Fenty Beauty through specialist stores across the major capital cities. The wider supplier field covered in this report also includes Revlon. Companies compete on shade range, texture, price, claims, creator marketing and access to pharmacy, specialist and online shelves.
Companies profiled and their roles in this market
| Company | Type | Role in the market |
|---|---|---|
| L'Oréal Groupe | Global beauty group | 36-brand portfolio showcased at SXSW Sydney in October 2025 |
| e.l.f. Beauty | Global masstige brand | Coles grocery launch and wider Priceline range from 2024 |
| MCoBeauty | Australian masstige brand | Launched in 2016; all products under USD 20 |
| Nude by Nature | Australian pharmacy brand | Acquired by Arrotex in July 2024; more than 2,370 retail doors |
| Napoleon Perdis | Australian premium brand | First premium label in Priceline stores |
| Coty | Global beauty group | Consumer beauty review covering CoverGirl, Rimmel and Max Factor |
| Kendo Brands | LVMH brand incubator | Fenty Beauty and KVD Beauty, sold in more than 60 countries |
Credence Research sees masstige and online buying lead
Credence Research's view is that Australian demand for fluid complexion and color products will grow steadily through 2035, as masstige ranges, pharmacy reach and online reorders widen use. Liquid foundations and skin tints should keep the largest product share, while blushes, bronzers and highlighters gain most from lighter routines. New South Wales and ACT will remain the largest zone, although Western and Central Australia adds demand fastest. However, claim checks and price competition will reward brands that pair tested formulas with clear value.
Buyer counts and channel prices anchor the makeup model
The report uses 2025 as the base year, with values in USD million at retail prices. Market values come from the Credence Research model, which combines buyer numbers, use frequency, product prices and channel mix. Regional shares follow the client data set, while regional growth and segment splits by product type, price tier, customer type and distribution channel are Credence Research estimates. Sources used are official statistics, regulator and company releases and trade news, and no interviews or surveys were used.
Masstige and online reorders shape demand to 2035
The market is expected to reach USD 1.33 billion by 2035, a 5.63% CAGR during 2026–2035, as masstige ranges, pharmacy reach and online reorders keep demand rising. Growth should be strongest in blushes, bronzers and highlighters, third-party e-commerce and Western and Central Australia, while New South Wales and ACT keeps the largest share. New specialist stores and local masstige brands will widen choice after 2026. In contrast, tighter claim checks or weaker household budgets could slow premium spending in some years.
Frequently Asked Questions
How big is the Australia liquid makeup market?
Which region leads demand?
Which region grows fastest?
Which product type holds the largest share?
Why are masstige brands gaining share?
Which channel grows fastest?
Who are the leading companies in this market?
What are the main risks to growth?
Table of Content
Chapter 1 Market Segmentation
- 1.1 Segmentation Framework
- 1.1.1 Product and Service Classification
- 1.1.2 Application and End-Use Classification
- 1.1.3 Technology and Solution Classification
- 1.1.4 Customer and Distribution Channel Classification
- 1.1.5 Geographic Segmentation
- 1.1.6 Market Segment Definitions and Boundaries
- 1.2 By Product Type
- 1.2.1 Liquid foundations and skin tints
- 1.2.2 Liquid concealers and correctors
- 1.2.3 Liquid blushes, bronzers and highlighters
- 1.2.4 Liquid eye and lip colour
- 1.3 By Price Tier
- 1.3.1 Value
- 1.3.2 Masstige
- 1.3.3 Prestige
- 1.3.4 Luxury
- 1.4 By Customer Type
- 1.4.1 Personal buyers under 30
- 1.4.2 Personal buyers aged 30-44
- 1.4.3 Personal buyers aged 45 and above
- 1.4.4 Professional makeup artists
Chapter 2 Introduction
- 2.1 Report Objectives and Scope
- 2.2 Product Definition and Industry Terminology
- 2.3 Market Inclusions and Exclusions
- 2.4 Research Process
- 2.4.1 Primary Research and Expert Interviews
- 2.4.2 Secondary Research and Source Review
- 2.4.3 Top-Down and Bottom-Up Estimation
- 2.4.4 Data Triangulation and Verification
- 2.5 Market Size Measurement Basis
- 2.5.1 2025: USD 769.5 million → 2035: USD 1.33 billion
- 2.6 Historical and Forecast Reference Periods
- 2.6.1 Historical Period: 2018-2025
- 2.6.2 Base Year: 2025
- 2.6.3 Forecast Period: 2025-2035
- 2.7 Research Assumptions and Limitations
Chapter 3 Executive Summary
- 3.1 Market Snapshot and Key Findings
- 3.2 Base-Year Market Size, 2025
- 3.3 Forecast Market Size, 2035
- 3.4 Revenue and Volume Growth Outlook
- 3.5 Key Demand and Supply Indicators
- 3.6 Leading Market Segments
- 3.7 Fastest-Growing Market Opportunities
- 3.8 Regional Performance Highlights
- 3.9 Technology and Industry Transformation
- 3.10 Competitive Landscape Summary
- 3.11 Analyst View and Strategic Implications
Chapter 4 Australia Liquid Makeup Market Trends and Developments
- 4.1 Historical Industry Development, 2018-2025
- 4.2 Recent Market Trends and Developments
- 4.3 Demand and Customer Behavior Trends
- 4.4 Technology and Product Innovation
- 4.5 Artificial Intelligence, Automation and Digitalization
- 4.6 Local Manufacturing and Supply Chain Realignment
- 4.7 Industry Partnerships, Mergers and Acquisitions
- 4.8 Sustainability and Circular Economy Developments
- 4.9 Government and Private Sector Investment Trends
- 4.10 Emerging Business Models and Commercialization
- 4.11 Industry Developments and Announcements
Chapter 5 Australia Liquid Makeup Market Production, Supply and Demand Analysis
- 5.1 Demand Trend and Consumption Analysis, 2018-2025
- 5.2 Demand Forecast, 2025-2035
- 5.3 Production and Output Trend, 2018-2025
- 5.4 Production and Output Forecast, 2025-2035
- 5.5 Installed Capacity and Capacity Utilization
- 5.6 Company-Wise Production Plants and Statistics
- 5.6.1 Installed Production Capacity
- 5.6.2 Actual Production
- 5.6.3 Planned Capacity and Expansion Targets
- 5.7 Supply Chain Structure and Procurement Trends
- 5.8 Supply-Demand Gap and Bottlenecks
- 5.9 Import Dependence and Sourcing Structure
- 5.10 Contract Manufacturing and Outsourcing
- 5.11 Regional Supply and Demand Concentration
Chapter 6 Australia Liquid Makeup Market Pricing Analysis
- 6.1 Pricing Structure and Measurement
- 6.2 Historical Pricing Trends, 2018-2025
- 6.3 Pricing Outlook, 2025-2035
- 6.4 Average Selling Price and Unit Economics
- 6.5 Pricing by Product and Market Segment
- 6.6 Geographic Pricing Differences
- 6.7 Key Input, Energy, Labor and Logistics Costs
- 6.8 Contract Pricing and Purchasing Models
- 6.9 Pricing Sensitivity and Competitive Positioning
- 6.10 Price, Margin and Profitability Implications
Chapter 7 Australia Liquid Makeup Market Dynamics
- 7.1 Market Growth Drivers
- 7.1.1 Demand-Side Drivers
- 7.1.2 Technology and Innovation Drivers
- 7.1.3 Infrastructure and Investment Drivers
- 7.1.4 Regulatory and Policy Drivers
- 7.2 Market Restraints
- 7.2.1 Cost and Affordability Constraints
- 7.2.2 Technology and Adoption Barriers
- 7.2.3 Supply Chain and Operational Constraints
- 7.3 Market Challenges
- 7.3.1 Competitive Pressure and Margin Erosion
- 7.3.2 Skills, Infrastructure and Implementation Gaps
- 7.4 Emerging Market Opportunities
- 7.5 Market Dynamics Impact and Time-Horizon Assessment
Chapter 8 Australia Liquid Makeup Value Chain Analysis
- 8.1 Industry Value Chain Overview
- 8.2 Upstream Suppliers and Critical Inputs
- 8.3 Technology and Component Providers
- 8.4 Manufacturing or Service Delivery
- 8.5 Distribution, Channel Partners and Integrators
- 8.6 Downstream Applications and End Users
- 8.7 Value Addition and Profit Pools
- 8.8 Vertical Integration and Outsourcing
- 8.9 Supplier Concentration and Risk
- 8.10 Supply Chain Localization and Resilience
Chapter 9 Australia Liquid Makeup Market Regulations and Policies
- 9.1 Relevant Laws, Standards and Compliance Frameworks
- 9.2 Product, Service, Safety and Quality Requirements
- 9.3 Government Policies, Incentives and Subsidies
- 9.4 Imports, Exports and Trade Barriers
- 9.5 Public Procurement and Local Content Requirements
- 9.6 Environmental and Sustainability Compliance
- 9.7 Upcoming Policy Changes and Market Implications
Chapter 10 Australia Liquid Makeup Market Hotspots and Opportunities
- 10.1 Market Opportunity Mapping and Growth Hotspots
- 10.2 High-Growth Applications and Customer Groups
- 10.3 Underserved Markets and White-Space Opportunities
- 10.4 Emerging Technology and Product Opportunities
- 10.5 New Capacity and Investment Hotspots
- 10.6 Market Entry and Expansion Opportunities
- 10.7 Distribution and Partnership Opportunities
- 10.8 Near-Term and Long-Term Commercial Potential
- 10.9 Opportunity Attractiveness and Execution Risks
Chapter 11 Australia Liquid Makeup Market Outlook, 2025-2035
- 11.1 Market Size and Analysis
- 11.1.1 Revenue (Market Measurement: 2025: USD 769.5 million → 2035: USD 1.33 billion)
- 11.1.2 Market Volume and Quantity Sold
- 11.1.3 Historical Market Size, 2018-2025
- 11.1.4 Base-Year Market Size, 2025
- 11.2 Market Forecast, 2025-2035
- 11.2.1 Revenue Forecast to 2035
- 11.2.2 Volume Forecast to 2035
- 11.2.3 CAGR and Year-on-Year Growth
- 11.2.4 Incremental Revenue Opportunity
- 11.3 Forecast Assumptions and Scenario Analysis
- 11.3.1 Base-Case Forecast
- 11.3.2 Optimistic and Conservative Scenarios
- 11.3.3 Technology, Pricing and Policy Sensitivities
- 11.4 Market Attractiveness and Growth Outlook
Chapter 12 Australia Liquid Makeup Market Segmentation and Outlook
- 12.1 Segmentation Summary and Market Shares, 2025
- 12.2 Largest and Fastest-Growing Segments
- 12.3 By Product Type - Market Size and Forecast, 2025-2035
- 12.3.1 Segment Definition and Scope
- 12.3.2 Historical Market Size, 2018-2025
- 12.3.3 Revenue Forecast, 2025-2035
- 12.3.4 Volume Forecast, 2025-2035
- 12.3.5 Base-Year Market Share, 2025
- 12.3.6 Segment CAGR and Growth Drivers
- 12.3.7 Subsegment Market Size and Forecast
- 12.3.7.1 Liquid foundations and skin tints
- 12.3.7.2 Liquid concealers and correctors
- 12.3.7.3 Liquid blushes, bronzers and highlighters
- 12.3.7.4 Liquid eye and lip colour
- 12.3.8 Subsegment Pricing and Adoption Trends
- 12.3.9 Leading Suppliers and Competition
- 12.3.10 Regional Demand and Opportunities
- 12.4 By Price Tier - Market Size and Forecast, 2025-2035
- 12.4.1 Segment Definition and Scope
- 12.4.2 Historical Market Size, 2018-2025
- 12.4.3 Revenue Forecast, 2025-2035
- 12.4.4 Volume Forecast, 2025-2035
- 12.4.5 Base-Year Market Share, 2025
- 12.4.6 Segment CAGR and Growth Drivers
- 12.4.7 Subsegment Market Size and Forecast
- 12.4.7.1 Value
- 12.4.7.2 Masstige
- 12.4.7.3 Prestige
- 12.4.7.4 Luxury
- 12.4.8 Subsegment Pricing and Adoption Trends
- 12.4.9 Leading Suppliers and Competition
- 12.4.10 Regional Demand and Opportunities
- 12.5 By Customer Type - Market Size and Forecast, 2025-2035
- 12.5.1 Segment Definition and Scope
- 12.5.2 Historical Market Size, 2018-2025
- 12.5.3 Revenue Forecast, 2025-2035
- 12.5.4 Volume Forecast, 2025-2035
- 12.5.5 Base-Year Market Share, 2025
- 12.5.6 Segment CAGR and Growth Drivers
- 12.5.7 Subsegment Market Size and Forecast
- 12.5.7.1 Personal buyers under 30
- 12.5.7.2 Personal buyers aged 30-44
- 12.5.7.3 Personal buyers aged 45 and above
- 12.5.7.4 Professional makeup artists
- 12.5.8 Subsegment Pricing and Adoption Trends
- 12.5.9 Leading Suppliers and Competition
- 12.5.10 Regional Demand and Opportunities
- 12.6 Segment Growth Comparison
- 12.7 Segment Attractiveness and Priority Matrix
Chapter 13 Australia Liquid Makeup End-Use and Application Market Outlook
- 13.1 End-Use Industry and Customer Demand Structure
- 13.2 Leading Applications and Customer Groups
- 13.3 End-Use Market Size, Share and Forecast
- 13.4 Major End-Use Industry Deep Dives
- 13.4.1 Customer Requirements and Use Cases
- 13.4.2 Demand and Replacement Cycles
- 13.4.3 Technical and Regulatory Considerations
- 13.4.4 Purchasing and Procurement Models
- 13.4.5 Leading Vendors and Distribution Channels
- 13.4.6 Forecast and Commercial Opportunities
- 13.5 Emerging Applications and Cross-Segment Demand
- 13.6 End-Use Industry Investment Priorities
Chapter 14 Australia Liquid Makeup Geographic Market Outlook, 2025-2035
- 14.1 Domestic Market Distribution and Demand Clusters
- 14.2 State- or Province-Wise Market Size and Forecast, 2025-2035
- 14.3 City and Metropolitan Market Outlook
- 14.4 Industrial, Manufacturing and Commercial Clusters
- 14.5 Geographic Concentration of Key End Users
- 14.6 Local Pricing and Purchasing Differences
- 14.7 Domestic Production Facilities and Capacity Map
- 14.8 Local Infrastructure and Project Pipeline
- 14.9 State-Level Policy and Incentive Differences
- 14.10 Subnational Investment Hotspots and Opportunities
- 14.11 Distribution and Logistics Networks
- 14.12 Domestic Competitive Footprint
Chapter 15 Australia Liquid Makeup Technology, Innovation and Sustainability Outlook
- 15.1 Technology Landscape and Maturity
- 15.2 Product, Process and Service Innovation
- 15.3 AI, Automation and Digital Tools in the Industry
- 15.4 Technology Adoption and Performance Benchmarking
- 15.5 Innovation Pipeline and R&D Investment
- 15.6 Patent and Intellectual Property Trends
- 15.7 Energy Efficiency and Resource Management
- 15.8 Sustainability, Recycling and Circularity
- 15.9 Technology Roadmap, 2025-2035
- 15.10 Risks of Obsolescence and Technology Substitution
Chapter 16 Australia Liquid Makeup Market Key Strategic Imperatives
- 16.1 Growth and Market Entry Priorities
- 16.2 High-Return Products and Segments
- 16.3 Pricing, Profitability and Cost Optimization
- 16.4 Technology Investment and Product Differentiation
- 16.5 Supply Chain Localization and Resilience
- 16.6 Distribution and Customer Acquisition
- 16.7 Partnership, Acquisition and Capacity Strategy
- 16.8 Regional Expansion Priorities
- 16.9 Short-, Medium- and Long-Term Actions
Chapter 17 Competition Outlook
- 17.1 Industry Competition Characteristics
- 17.2 Market Structure and Concentration
- 17.3 Market Share and Competitive Positioning, 2025
- 17.4 Company-Wise Revenue and Product Benchmarking
- 17.5 Production and Service Capacity Benchmarking
- 17.6 Technology, Pricing and Differentiation
- 17.7 Regional Footprint and Distribution Strength
- 17.8 Mergers, Acquisitions and Strategic Alliances
- 17.9 New Entrants and Competitive Threats
- 17.10 Porter's Five Forces and Industry Attractiveness
- 17.11 Competitive Outlook, 2025-2035
Chapter 18 Company Profiles
- 18.1 Company Coverage and Selection Criteria
- 18.2 L'Oréal Groupe
- 18.2.1 Business Description
- 18.2.2 Company Ownership and Geographic Presence
- 18.2.3 Product and Service Portfolio
- 18.2.4 Manufacturing and Operating Footprint
- 18.2.5 Production Capacity and Expansion Plans
- 18.2.6 Financial Performance and Investment
- 18.2.7 Market Share and Competitive Position
- 18.2.8 Technology and Innovation Capabilities
- 18.2.9 Strategic Alliances or Partnerships
- 18.2.10 Recent Developments
- 18.2.11 Growth Strategy and Outlook
- 18.3 The Estée Lauder Companies
- 18.4 Coty
- 18.5 Shiseido Company
- 18.6 e.l.f. Beauty
- 18.7 Revlon
- 18.8 Kendo Brands
- 18.9 MCoBeauty
- 18.10 Nude by Nature
- 18.11 Napoleon Perdis
- 18.12 Other Relevant Market Participants
Note: Every listed company is profiled on the structure shown under the first company. The company list is preliminary and may change based on research findings, market developments, data availability and client requirements.
Chapter 19 Disclaimer
- 19.1 Research and Forecast Disclaimer
- 19.2 Data Source and Estimation Limitations
Note: The depth of individual sections depends on data availability for this market. Volume, capacity, trade and other unit-based metrics are included where applicable.

