
Traditional plant remedies move into daily beauty routines
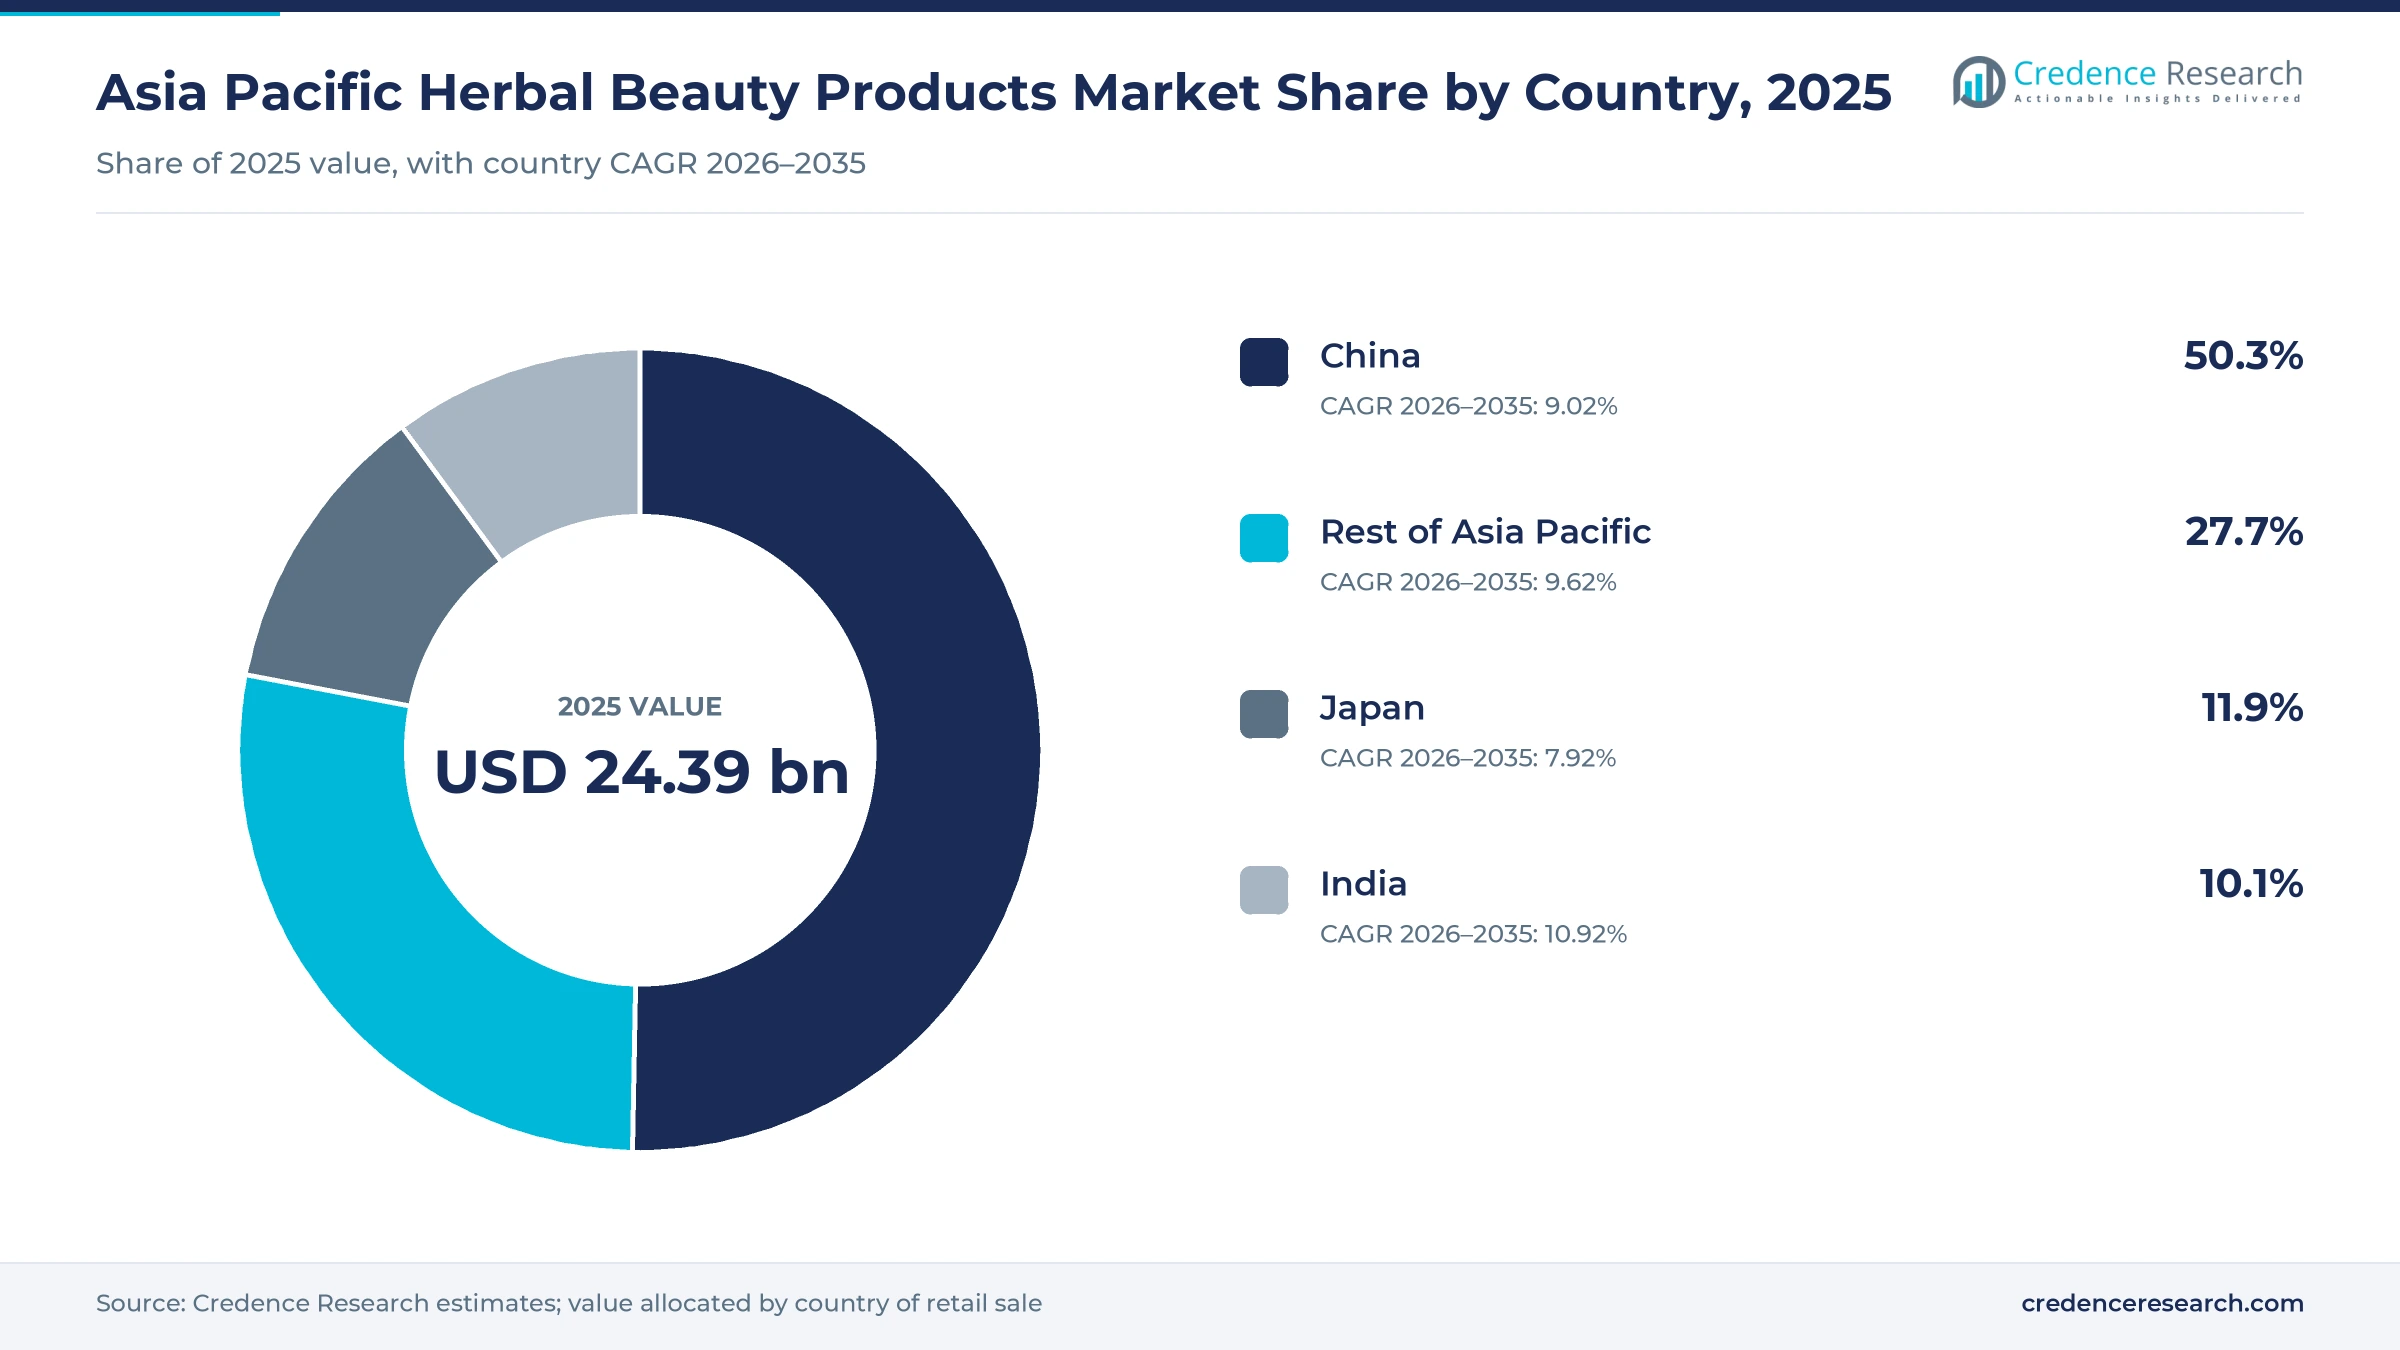
The Asia Pacific herbal beauty products market was valued at USD 24.39 billion in 2025 and is projected to increase from USD 26.71 billion in 2026 to USD 59.32 billion by 2035, registering a CAGR of 9.27% during 2026–2035. Demand comes from shoppers who trust ginseng, neem, saffron, turmeric and other plant ingredients rooted in traditional Chinese medicine, Ayurveda, Korean court formulas and Indonesian jamu. China held the largest regional share, 50.3% in 2025, because it has the largest cosmetics retail base in the region. India is the fastest-growing country at 10.92% a year, as Ayurvedic brands reach new buyers through e-commerce and quick commerce. In turn, premium launches are reshaping the category, with Himalaya Wellness entering premium beauty in March 2026 and Estée Lauder agreeing that month to take full ownership of Forest Essentials.
Which plant-based beauty products does the estimate cover?
The estimate measures the retail value of skincare, hair care, body care, color cosmetics and fragrance products positioned on herbal, Ayurvedic, traditional Chinese medicine, Korean botanical or jamu ingredients in Asia Pacific. It covers mass market, masstige, premium and luxury lines sold to adult women, adult men, teenagers and children and babies.
The estimate excludes herbal supplements taken by mouth, medicines registered as drugs and raw botanical ingredients sold to manufacturers. The value chain runs from growers and extract makers through brand owners and contract manufacturers to grocery stores, beauty specialty chains, pharmacies, brand stores and online platforms in China, Japan, India and the rest of the region.
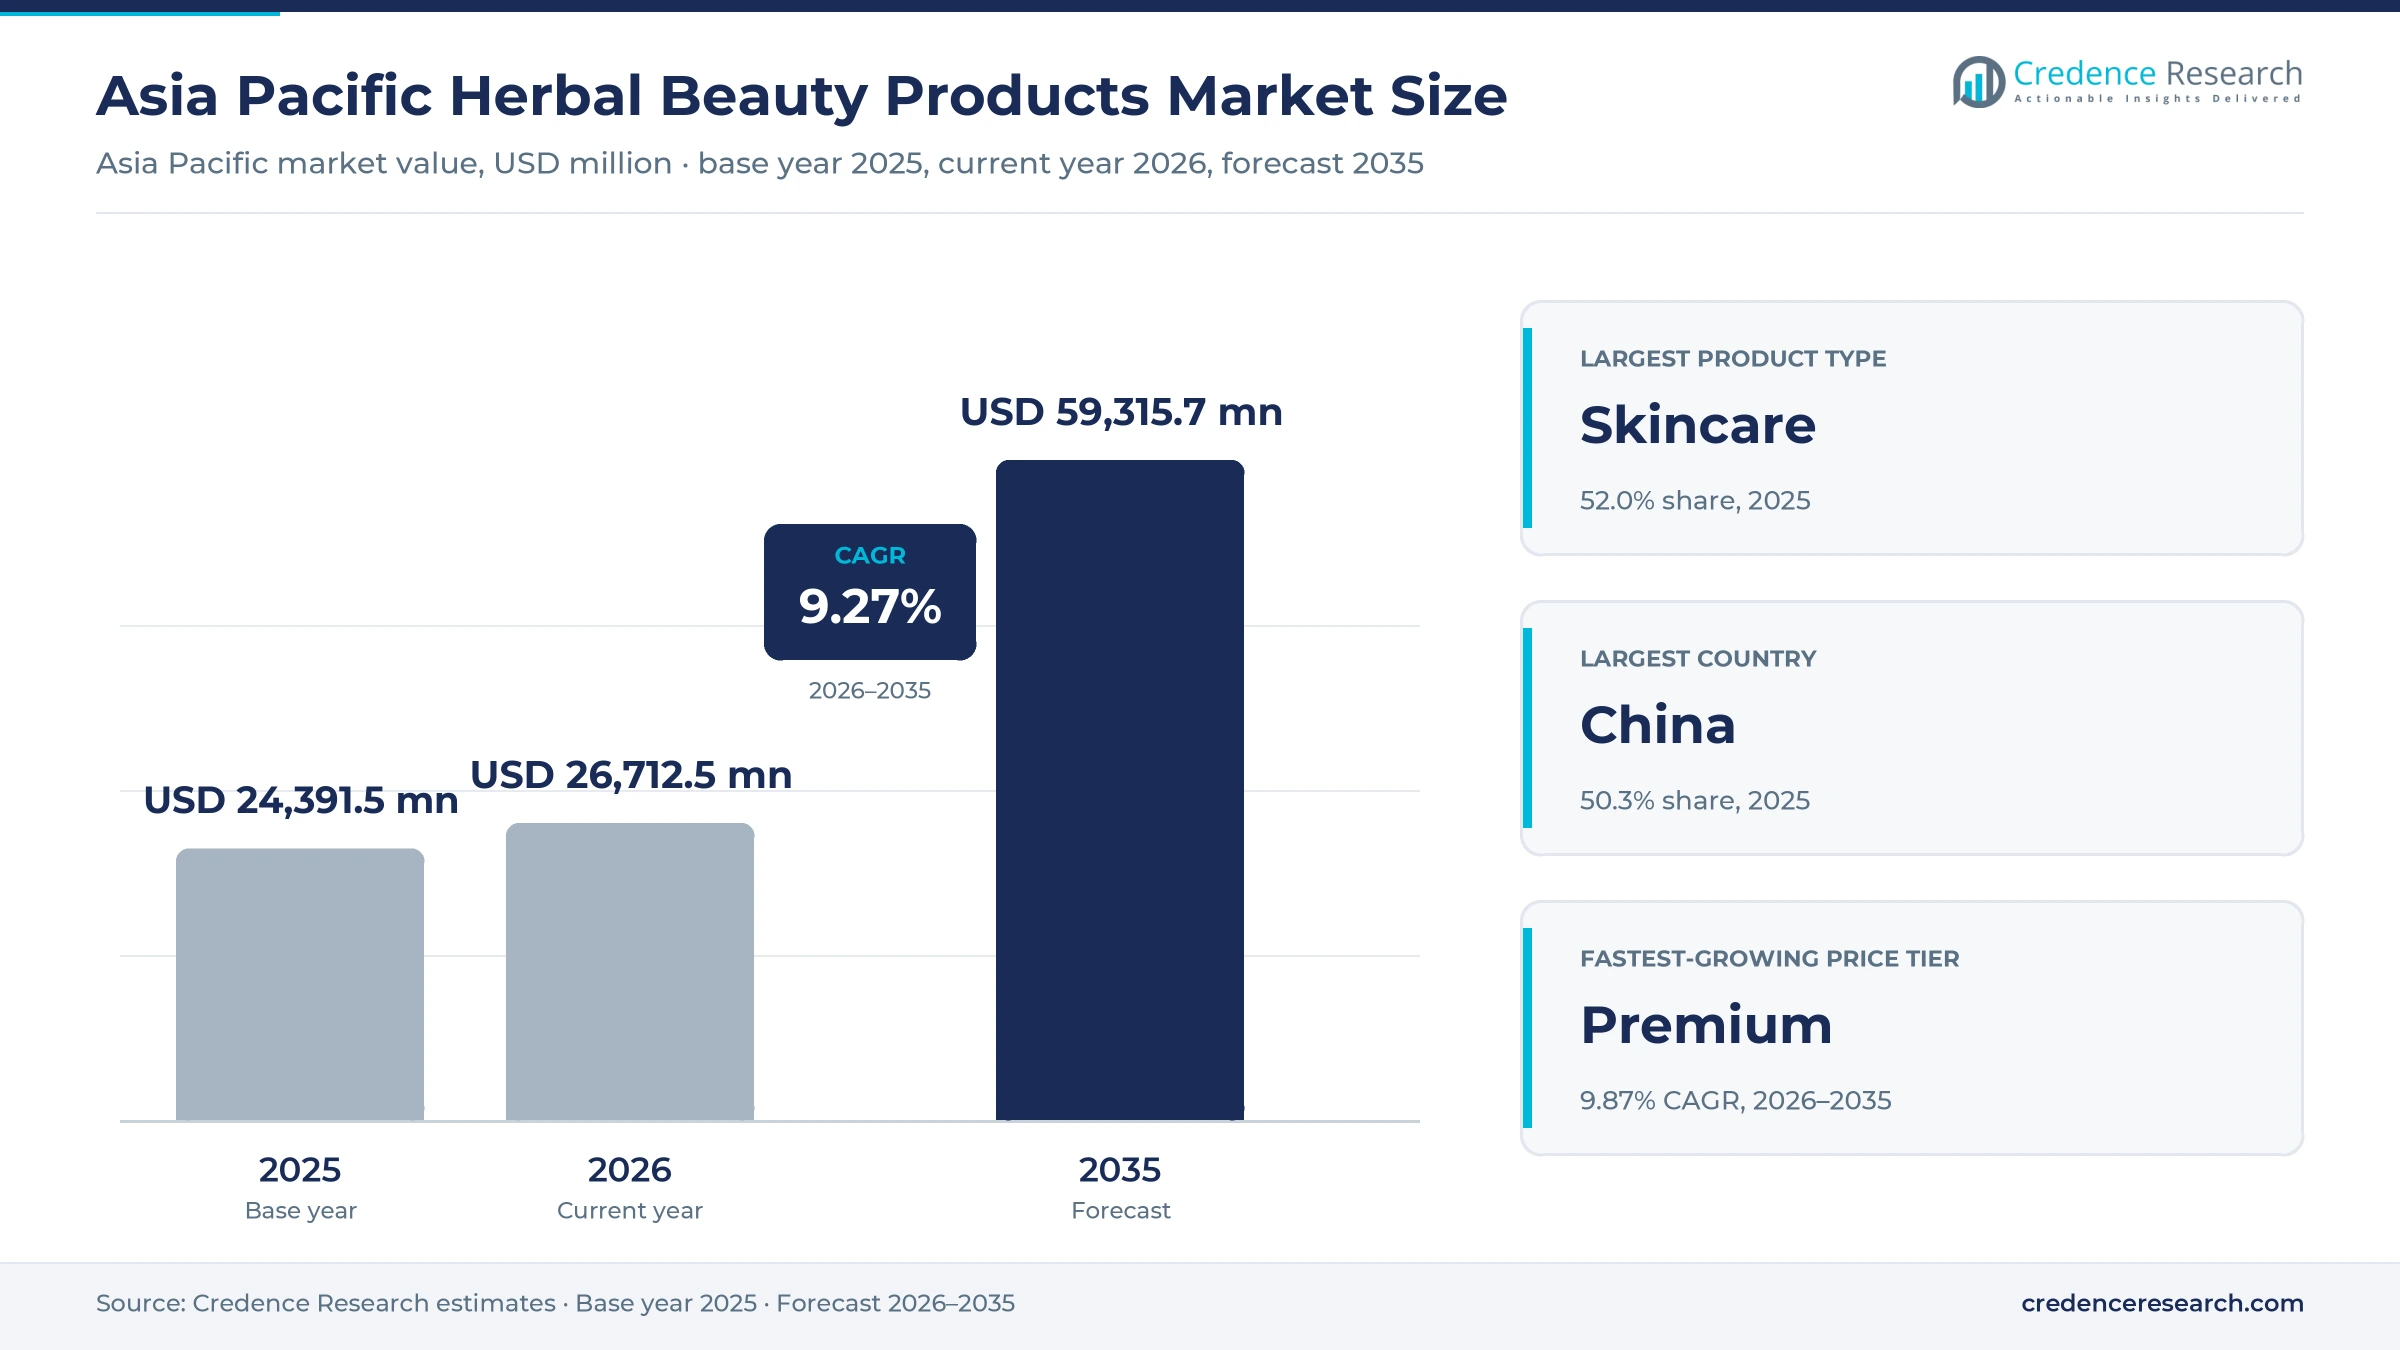
Asia Pacific Herbal Beauty Products Market Insights
- The Asia Pacific herbal beauty products market was valued at USD 24.39 billion in 2025 and is projected to reach USD 59.32 billion by 2035, registering a CAGR of 9.27% during 2026–2035.
- China held a 50.3% share of 2025 value, because its cosmetics retail sales reached a record 465.3 billion yuan in 2025.
- Skincare led with a 52.0% share of 2025 value, because face washes, creams and serums are bought most often.
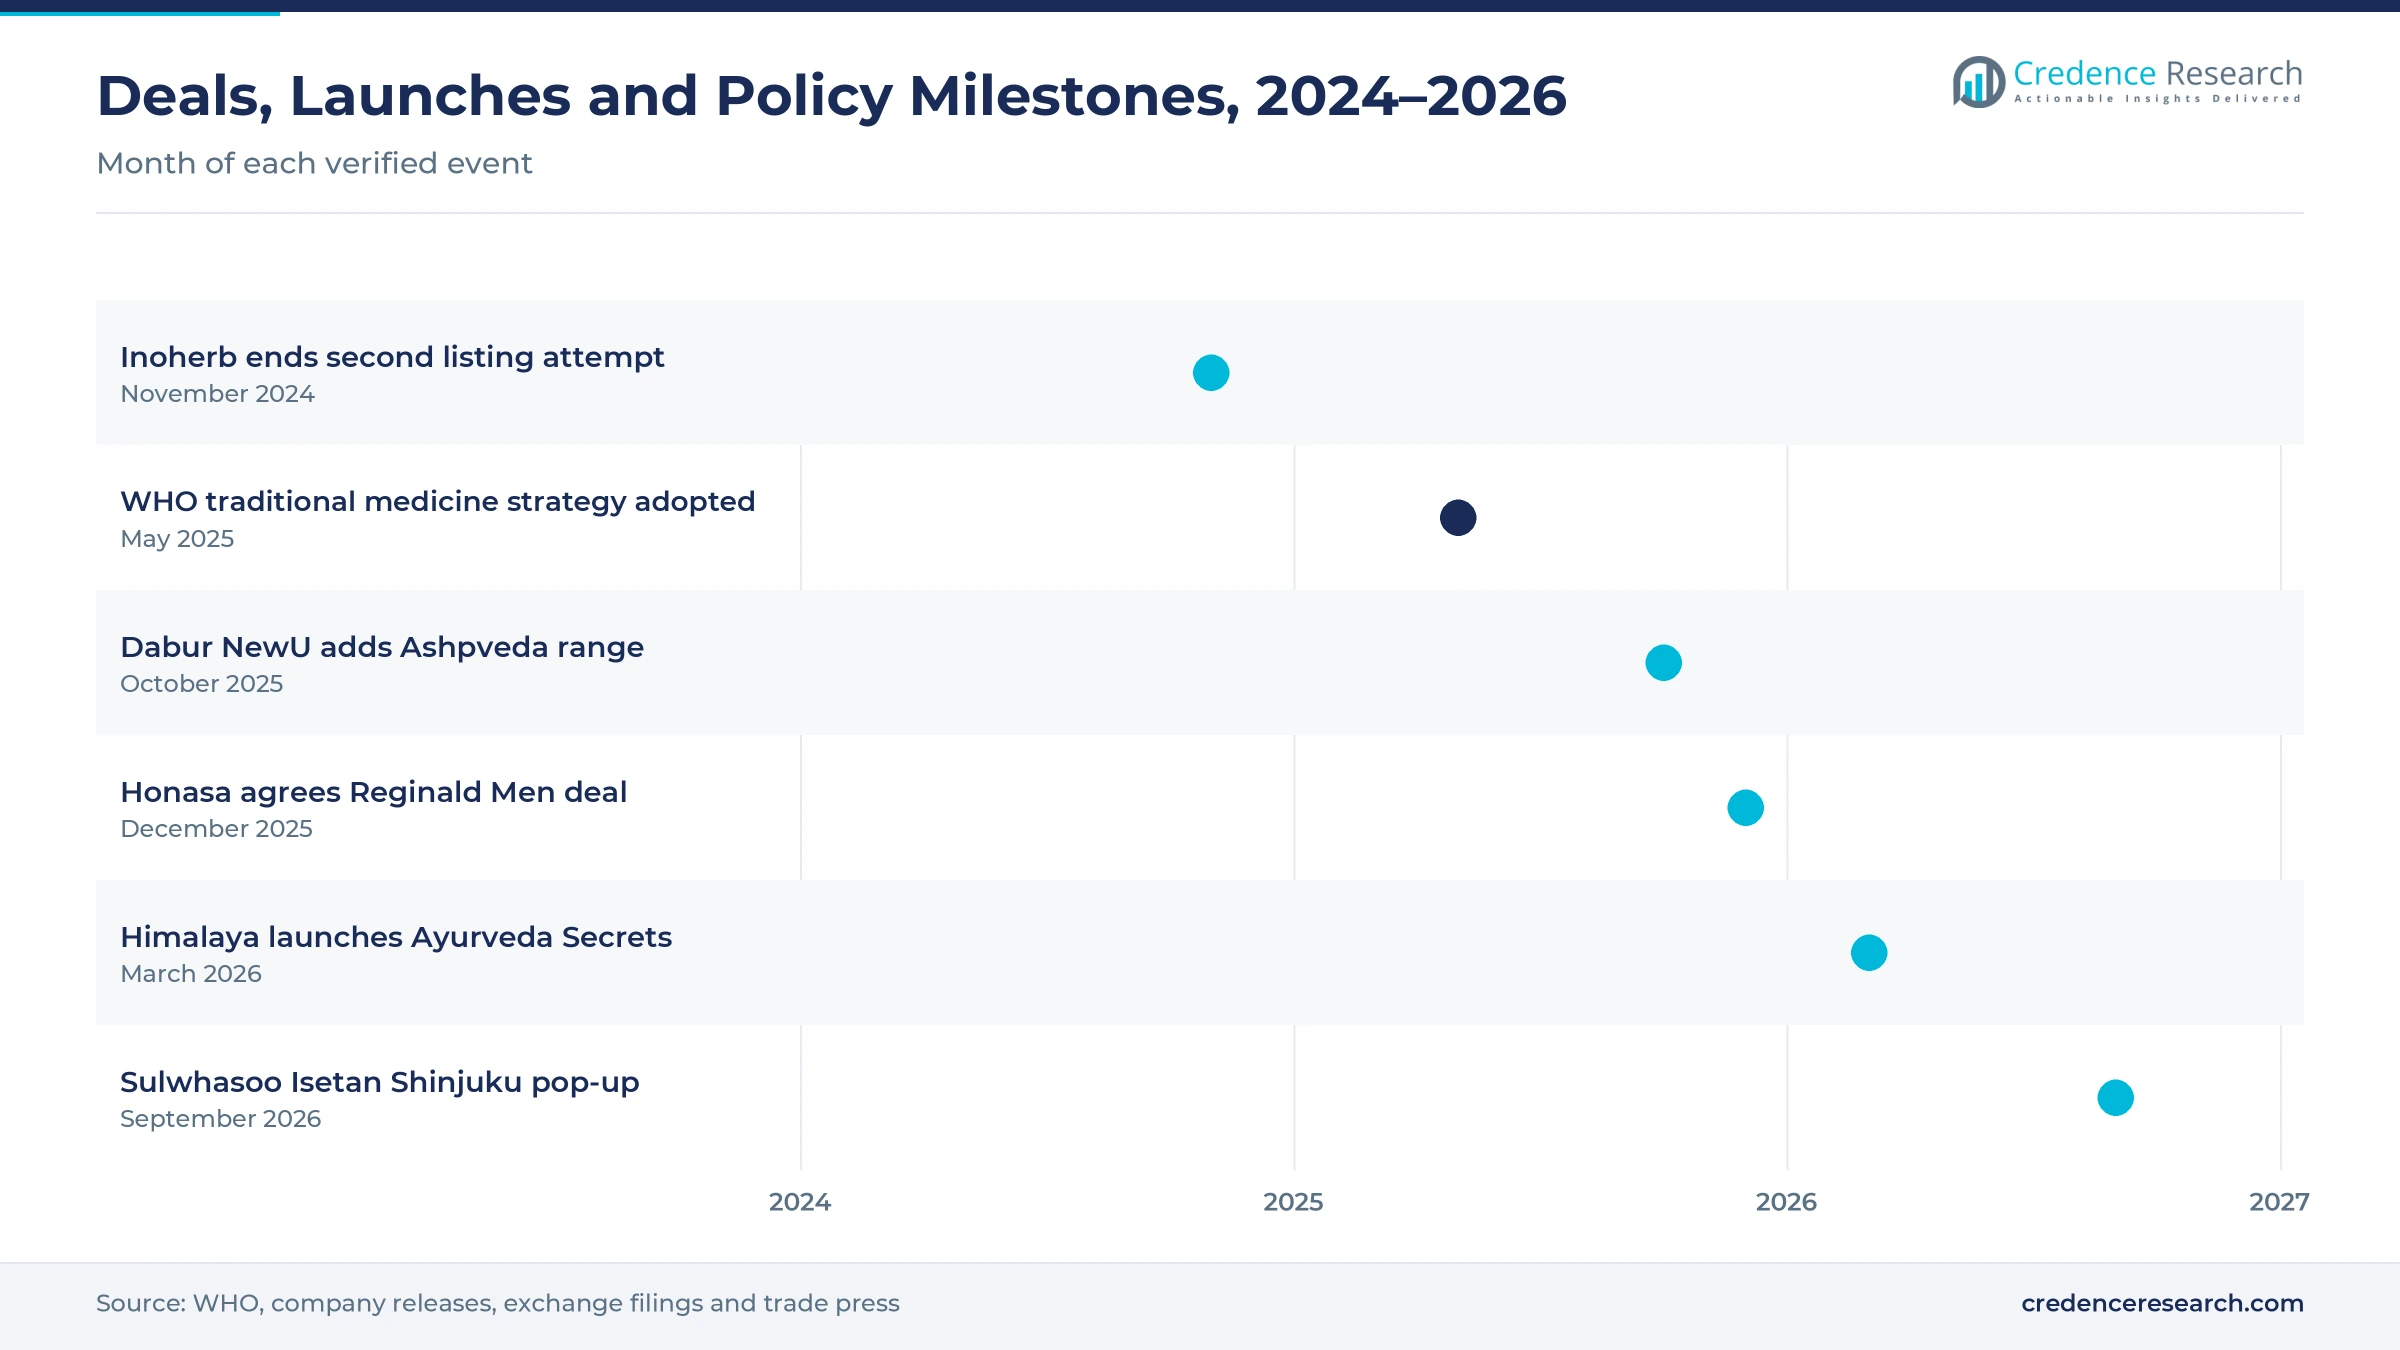
- The World Health Assembly adopted the Global Traditional Medicine Strategy 2025–2034 in May 2025, which supports trust in plant-based care.
- Honasa Consumer agreed on Dec. 11, 2025, to acquire 95% of the parent of Reginald Men, widening its men's grooming range.
Skincare leads while premium botanical lines rise fastest
Why does skincare lead product demand?
Based on product type, the market is categorized into skincare, hair care, body care and color cosmetics and fragrance. Skincare led with a 52.0% share of 2025 value, because face washes, creams and serums are bought most often. Hair Care grows fastest at 9.60% a year, as Ayurvedic oils and herbal shampoos move into premium ranges.
How do mass and premium tiers split value?
Based on price tier, the market is categorized into mass market, masstige, premium and luxury. Mass Market led with a 38.0% share of 2025 value, because neem, aloe and turmeric products sell widely through grocery stores and village shops across India and China. Premium grows fastest at 9.87% a year, as groups launch ginseng, saffron and ghee lines at higher prices through brand stores and online flagships.
Why do adult women lead buyer demand?
Based on customer type, the market is categorized into adult women, adult men, teenagers and children and babies. Adult Women led with a 64.0% share of 2025 value, because they buy the widest range of skincare and hair care. Adult Men grow fastest at 10.10% a year, as sunscreen, serum and face wash brands target younger men.
How does e-commerce lead channel demand?
Based on distribution channel, the market is categorized into general trade and grocery, beauty specialty and pharmacies, brand stores and professional outlets, and e-commerce. E-Commerce led with 35.0% of 2025 value, because Chinese and Indian shoppers discover brands on marketplaces. E-Commerce also grows fastest at 10.14% a year, as quick commerce expands in Indian cities.
| Segment Group | Leading Sub-segment | Share, 2025 | Fastest-growing Sub-segment | CAGR, 2026–2035 |
|---|---|---|---|---|
| By Product Type | Skincare | 52.0% | Hair Care | 9.60% |
| By Price Tier | Mass Market | 38.0% | Premium | 9.87% |
| By Customer Type | Adult Women | 64.0% | Adult Men | 10.10% |
| By Distribution Channel | E-Commerce | 35.0% | E-Commerce | 10.14% |
Request a Free Sample
Fill in your details and we'll send you a free sample report.
- Sample data tables & charts
- Research methodology
Heritage trust, online discovery and premium lines
How does heritage-led repeat buying anchor demand?
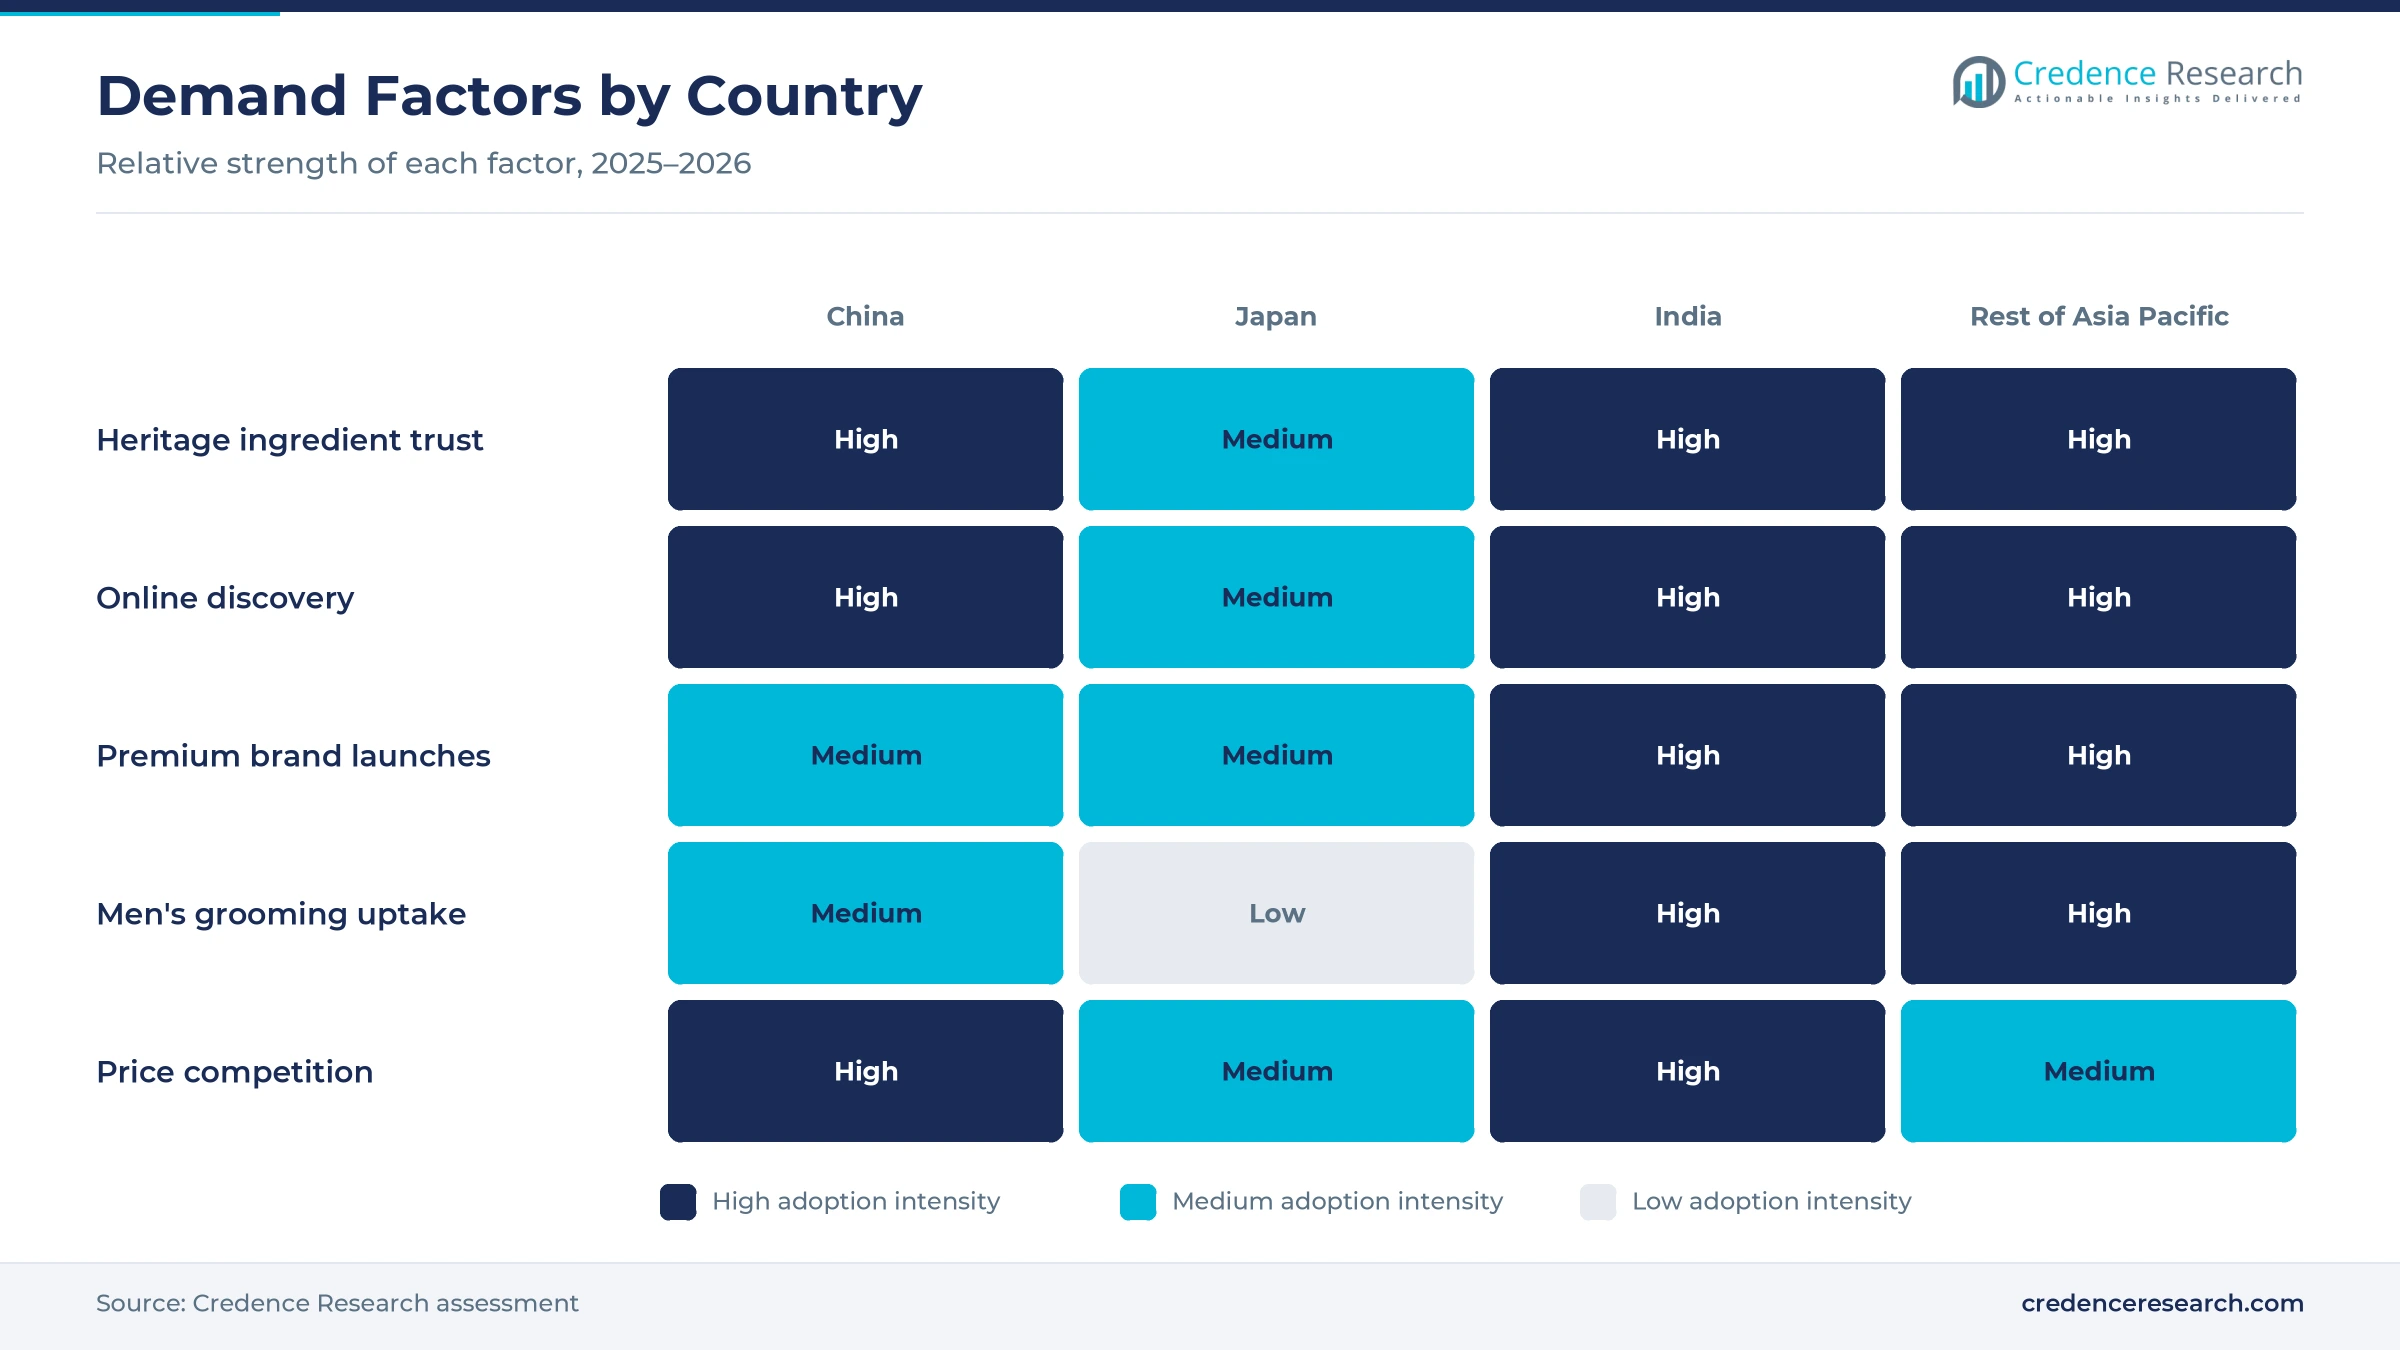
Heritage-led repeat buying anchors demand, because households in China, India, Korea and Indonesia trust plant ingredients used for generations in traditional medicine. The World Health Assembly adopted the Global Traditional Medicine Strategy 2025–2034 in May 2025, and traditional medicine is used by billions worldwide, according to the World Health Organization. Himalaya Wellness has built its face care around neem for over 25 years and relaunched its Neem Face Wash with a five-part neem formula in August 2025. Sulwhasoo also marks 60 years of ginseng research in 2026 with the anniversary of its ABC Ginseng Cream. As a result, skincare led products with 52.0% of 2025 value, because shoppers replenish trusted face washes and creams on a regular cycle.
Why does omnichannel discovery widen trial?
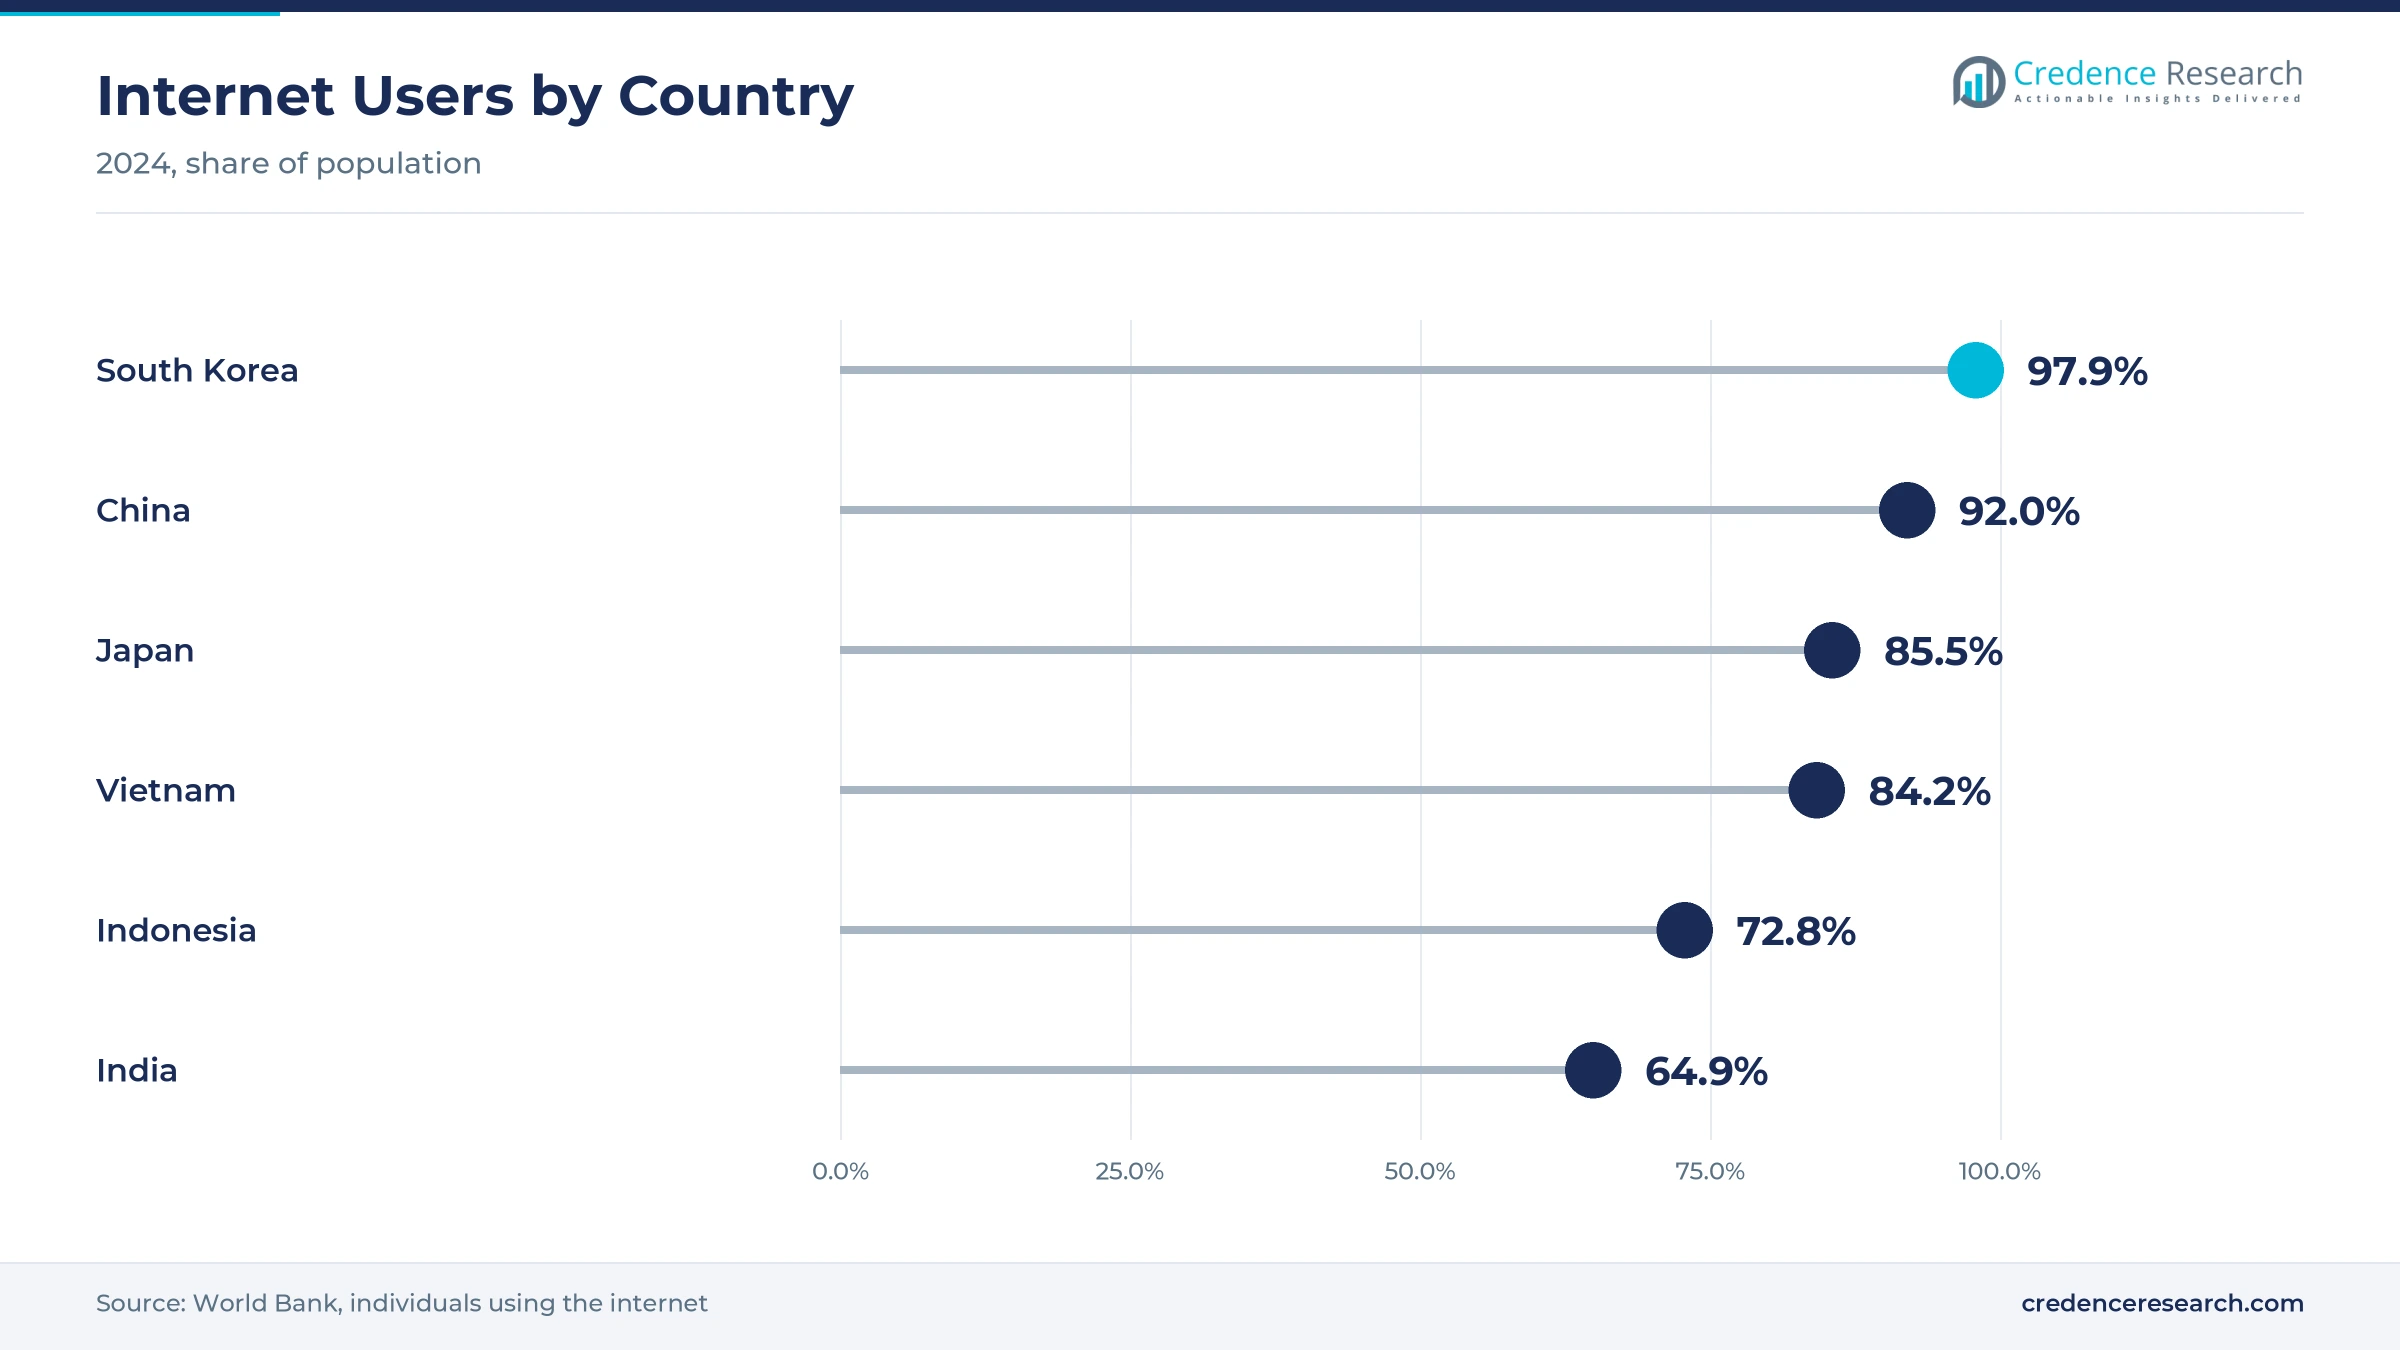
Omnichannel product discovery widens trial, because shoppers now find herbal brands on social video, marketplaces and quick commerce before they visit stores. Internet use reached 92.0% of the population in China and 64.9% in India in 2024, according to World Bank data. Himalaya launched its premium Ayurveda Secrets line in March 2026 through e-commerce and quick commerce platforms across India. Sulwhasoo also widened its reach in Japan through Isetan Beauty Online, Qoo10, Amazon Japan and Cosme Shopping. China's cosmetics retail sales reached 465.3 billion yuan in 2025, up 5.1%, according to National Bureau of Statistics data. In turn, e-commerce led channels with 35.0% of 2025 value.
How does premium botanical brand building raise value?
Premium botanical brand development raises value per unit, because groups are building luxury lines around ginseng, saffron, ghee and royal court formulas. Estée Lauder agreed in March 2026 to acquire the remaining shares of Forest Essentials, the Ayurveda-based luxury brand founded in 2000 that runs about 200 stores across India. Himalaya's Ayurveda Secrets range uses traditional preparation methods and ingredients such as ghee and kesar, according to IMPACT. LG H&H founded The History of Whoo in 2003 around Joseon royal court formulas and launched Cheongidan Pro, the first Cheongidan serum in 13 years, at an event in Shanghai. As a result, the premium tier grows fastest among price tiers at 9.87% a year.
Why do new plant ingredient filings support innovation?
New plant ingredient filings support innovation, because brands in China must file new cosmetic ingredients with regulators before products reach shelves. A total of 102 new cosmetic ingredients had been filed in China in 2025 by late August, including baicalin from Scutellaria baicalensis roots and Paeonia emodi seed oil. Korean cosmetics exports also reached about USD 11.4 billion in 2025, up 11.8%, with about USD 2 billion shipped to China, according to Korea.net. Indonesia holds more than 40,000 species, of which 30,000 plants have medicinal properties, Mustika Ratu's president director said in July 2021. In turn, suppliers of botanical extracts gain steady orders from brands reformulating skincare and hair care.
Men's grooming and wellness stores reshape demand
How is the shift toward men's grooming widening demand?
The shift toward men's grooming is widening the customer base, because younger men in India and Korea now buy sunscreens, serums and face washes. Honasa Consumer agreed on Dec. 11, 2025, to buy 95% of BTM Ventures, the parent of Reginald Men, at an enterprise value of Rs 195 crore, according to an exchange filing. Reginald Men focuses on sunscreen and serums, and most of its sales come from South India. Lotus Herbals has also unveiled Monk&Metal, a new men's grooming brand that reflects changing expectations in male personal care. As a result, adult men grow fastest among customer types at 10.10% a year, as herbal brands add sunscreens and face washes for men.
Why is the rise of wellness stores changing discovery?
The rise of curated wellness stores is changing discovery, because brands want spaces where staff can explain herbal routines and gift sets. Dabur's NewU retail platform began selling the full Ashpveda skincare, hair care and personal care range in 20 stores in October 2025, including a Festive 2025 collection. Forest Essentials runs about 200 stores across India, which gives the brand wide offline reach for gifting. Sulwhasoo operates more than 600 stores across 15 countries and opened its first official department store pop-up in Japan at Isetan Shinjuku from Sept. 5 to Oct. 13, 2026. In turn, brand stores and professional outlets help premium lines justify higher prices and keep natural cosmetics visible offline.
Can Korean ginseng lines open a wider opening in Japan?
Korean ginseng lines can open a wider opening in Japan, because Japanese shoppers already buy Korean skincare through department stores and online platforms. Korean cosmetics shipped to Japan reached USD 1.1 billion in 2025, part of record exports of about USD 11.4 billion. Sulwhasoo prepared its Isetan Shinjuku pop-up with a May 2026 pop-up through beauty platform Cosme and an August event for Japanese beauty media and retailers. Internet use in Japan also reached 85.5% in 2024, which supports online launches. As a result, brands with ginseng and plant formulas can win shoppers of natural and organic cosmetics in Japan, even as Japan grows at 7.92% a year.
Is there room for herbal teen care in India?
Herbal teen care has room to grow in India, because millions of young people look for gentle treatment of pimples and acne. Himalaya says over 20 crore teenagers and young adults in India experience these skin concerns, and nearly 4 in 5 young Indians feel less confident because of them. The company also launched a school program in 2025 that it expects to reach over 5 lakh students. Online platforms also let neem and turmeric brands reach teens directly, without depending on store shelf space. In turn, teenagers gain share as a customer group, as herbal face washes become a first skincare purchase for many young buyers.
Quality, claims scrutiny and fakes test plant-based brands
How does uneven ingredient quality affect trust?
Uneven ingredient quality affects trust, because plant extracts vary with harvest, region and processing method. Brands that buy herbs from many small growers for skincare and hair care oils struggle to keep active content consistent from batch to batch. As a result, products can perform differently, which weakens repeat buying. Larger groups respond with contract farming, standardized extracts and testing for heavy metals and pesticide residues, which reassures retailers and regulators about product safety.
Why does claims scrutiny raise launch costs?
Claims scrutiny raises launch costs, because regulators in China, India and Korea require evidence for efficacy and safety claims. New ingredients in China must be filed before use, and claims such as whitening or anti-acne need supporting tests. In turn, small brands face higher costs and slower launches. Many respond by using ingredients already approved and by funding clinical and dermatology testing, often with contract laboratories that share costs across several launches.
How do counterfeit goods hurt online sales?
Counterfeit goods hurt online sales, because fake versions of popular herbal creams and oils appear on marketplaces and social commerce channels. Shoppers who receive fake products may blame the genuine brand for poor results. As a result, brand owners lose sales and reputation, especially for premium oils and creams sold at higher prices. Many respond with authorized seller programs, tamper-proof packaging and serial codes that buyers can check before use.
Why does crowded competition pressure prices?
Crowded competition pressures prices, because many direct-to-consumer startups launch neem, aloe and turmeric products with similar claims. Heavy online discounting during festival sales also trains shoppers to wait for deals. In turn, mass market brands find it harder to raise prices. Many respond by moving into masstige and premium lines with distinctive ingredients and traditional preparation stories, which gives them more room to hold prices during festival sales.
Chinese scale leads as Indian Ayurveda lifts growth
| Country | Value, 2025 (USD billion) | Share, 2025 | CAGR, 2026–2035 |
|---|---|---|---|
| China | 12.27 | 50.3% | 9.02% |
| Rest of Asia Pacific | 6.76 | 27.7% | 9.62% |
| Japan | 2.90 | 11.9% | 7.92% |
| India | 2.46 | 10.1% | 10.92% |
Why does Chinese cosmetics retail scale keep the top share?
China held a 50.3% share of 2025 value and grows at 9.02% a year, because it has the largest cosmetics retail base in the region. Cosmetics retail sales reached a record 465.3 billion yuan in 2025, up 5.1%, and Korean brands shipped about USD 2 billion of cosmetics to China. Local herbal brands such as Inoherb compete with Korean ginseng lines, while new plant ingredient filings give brands more ways to stand out on shelves and online.
Why do Ayurvedic brands make India the fastest grower?
India held a 10.1% share of 2025 value and grows fastest at 10.92% a year, because Ayurvedic brands are reaching new buyers online and in premium stores. Himalaya launched Ayurveda Secrets in March 2026, Dabur NewU stocks Ashpveda in 20 stores, and Forest Essentials runs about 200 stores. Internet use reached 64.9% in 2024, which still leaves a large group of shoppers to come online over the forecast period.
How does Japan support premium plant-based demand?
Japan held 11.9% of 2025 value and grows at 7.92% a year, because the country has a mature cosmetics market with steady demand for plant-based skincare. Korean cosmetics shipped to Japan reached USD 1.1 billion in 2025, and Sulwhasoo opened a pop-up at Isetan Shinjuku in September 2026. However, an older population and slow price growth keep Japan the slowest of the four areas through 2035.
How do Korean ginseng and Indonesian jamu shape other markets?
The rest of Asia Pacific held a 27.7% share of 2025 value and grows at 9.62% a year, because South Korea, Indonesia, Vietnam and Thailand all have strong herbal traditions. Indonesian jamu makers such as Mustika Ratu draw on more than 30,000 medicinal plants, while Korean ginseng brands lead premium skincare. Internet use reached 84.2% in Vietnam and 72.8% in Indonesia in 2024.
Deals, launches and policy milestones from 2024 to 2026
| Development | Status and market relevance |
|---|---|
| In May 2025, the World Health Assembly adopted the Global Traditional Medicine Strategy 2025–2034. | Supports evidence, safety and regulation for traditional medicine |
| In October 2025, Dabur NewU began selling the full Ashpveda range in 20 stores. | Adds an Ayurvedic brand to a curated wellness format |
| In December 2025, Honasa Consumer agreed to acquire 95% of BTM Ventures, the parent of Reginald Men. | Enterprise value of Rs 195 crore; widens men's grooming |
| In March 2026, Himalaya Wellness launched its premium Ayurveda Secrets line. | Sold through e-commerce, quick commerce and premium outlets |
| In March 2026, Estée Lauder agreed to acquire the remaining shares of Forest Essentials. | Subject to regulatory approvals; about 200 stores in India |
Traditional preparation and new ingredient filings advance
- Traditional preparation methods such as Ayurvedic oil and sun processing are used to build premium hair oils and shampoos with heritage stories.
- Standardized botanical extracts keep active content consistent between batches, which supports repeat buying and claims testing.
- New ingredient filing in China lets brands bring new plant compounds such as baicalin and seed oils into regulated cosmetics.
- Ginseng and fermentation research underpins Korean premium skincare, where decades of ingredient work support anti-aging claims.
Need a Custom Version of This Report?
Tailor the scope, geography, or segments to your exact requirements.
- Custom geography or segment scope
- Direct access to our analyst team
Korean, Indian and Chinese heritage brands compete
Competition is split between Korean groups with premium ginseng and royal court lines, Indian Ayurvedic houses with wide mass market reach, and Chinese herbal brands built on traditional medicine. Amorepacific runs Sulwhasoo through more than 600 stores in 15 countries, while LG H&H sells The History of Whoo. Himalaya Wellness and Dabur hold strong mass and masstige positions in India, and Himalaya entered premium beauty in March 2026. Honasa Consumer is adding brands through acquisitions, and Forest Essentials is moving to full Estée Lauder ownership. Inoherb ended its second listing attempt in November 2024, and Lotus Herbals is adding men's grooming. Rivals compete on ingredient heritage, efficacy testing, pricing, store presence and online marketing. Because shoppers compare brands online, companies that combine trusted ingredients with clear test results win more repeat buyers.
Companies profiled and their roles in this market
| Company | Type | Role in the market |
|---|---|---|
| Amorepacific Group | Korean beauty group | Sulwhasoo ginseng skincare with over 600 stores in 15 countries |
| LG H&H Co., Ltd. | Korean beauty group | The History of Whoo royal court skincare, founded in 2003 |
| Himalaya Wellness Company | Indian Ayurvedic company | Neem face care and premium Ayurveda Secrets line |
| Dabur India Limited | Indian Ayurvedic company | NewU wellness stores carrying Ayurvedic beauty brands |
| Honasa Consumer Limited | Indian beauty group | Agreed to acquire Reginald Men in December 2025 |
| Forest Essentials | Indian luxury Ayurveda brand | About 200 stores; full Estée Lauder ownership agreed |
| Shanghai Inoherb Cosmetics Co., Ltd. | Chinese herbal beauty brand | Ended second listing attempt in November 2024 |
Credence Research view on regional plant-based beauty
Credence Research's view is that Asia Pacific demand for herbal beauty products will grow strongly because trust in traditional ingredients, online discovery and premium launches all lift spending. Skincare remains the core of the market, while premium lines and men's grooming add faster growth. India will add the most new buyers, while China keeps the largest value base. Brands that pair heritage ingredients with standardized extracts, clinical testing and strong online marketing should gain share fastest.
How the regional plant-based beauty estimate was built
The report uses 2025 as the base year on a calendar basis, and herbal beauty market values come from the Credence Research model. That model combines national cosmetics retail statistics, internet use data, cosmetics export data, traditional medicine policy and company announcements on launches, acquisitions and stores. Segment splits and country growth rates are Credence Research estimates, while country shares follow the client-defined split. Sources used are public reports, official statistics, trade press, exchange filings and company releases, and no interviews or surveys were used.
Premium Ayurveda and ginseng lines carry growth to 2035
Herbal beauty value in the region is expected to reach USD 59.32 billion by 2035, a 9.27% CAGR during 2026–2035, as heritage trust, online discovery and premium lines lift spending. Growth should stay strong through 2030 while India and Southeast Asia add online shoppers. After that, premium ginseng and Ayurvedic lines, men's grooming and new plant ingredients will carry more growth. Stable herb supplies would support margins, while counterfeit goods and claims rules would slow smaller brands. Companies with trusted ingredients and tested claims are expected to gain the most.
Frequently Asked Questions
How big is the Asia Pacific herbal beauty products market?
Which product type leads plant-based beauty demand in Asia Pacific?
Which country leads the regional market?
Which price tier is growing fastest?
How large were China's cosmetics retail sales in 2025?
Which customer group is growing fastest?
Who are the leading companies in this regional market?
What are the main challenges for brands?
Table of Content
Chapter 1 Market Segmentation
- 1.1 Segmentation Framework
- 1.1.1 Product and Service Classification
- 1.1.2 Application and End-Use Classification
- 1.1.3 Technology and Solution Classification
- 1.1.4 Customer and Distribution Channel Classification
- 1.1.5 Geographic Segmentation
- 1.1.6 Market Segment Definitions and Boundaries
- 1.2 By Product Type
- 1.2.1 Skincare
- 1.2.2 Hair Care
- 1.2.3 Body Care
- 1.2.4 Color Cosmetics and Fragrance
- 1.3 By Price Tier
- 1.3.1 Mass Market
- 1.3.2 Masstige
- 1.3.3 Premium
- 1.3.4 Luxury
- 1.4 By Customer Type
- 1.4.1 Adult Women
- 1.4.2 Adult Men
- 1.4.3 Teenagers
- 1.4.4 Children and Babies
- 1.5 By Country
- 1.5.1 China
- 1.5.2 Japan
- 1.5.3 India
- 1.5.4 Rest of Asia Pacific
Chapter 2 Introduction
- 2.1 Report Objectives and Scope
- 2.2 Product Definition and Industry Terminology
- 2.3 Market Inclusions and Exclusions
- 2.4 Research Process
- 2.4.1 Primary Research and Expert Interviews
- 2.4.2 Secondary Research and Source Review
- 2.4.3 Top-Down and Bottom-Up Estimation
- 2.4.4 Data Triangulation and Verification
- 2.5 Market Size Measurement Basis
- 2.5.1 2025: USD 24.39 billion → 2035: USD 59.32 billion
- 2.6 Historical and Forecast Reference Periods
- 2.6.1 Historical Period: 2018-2025
- 2.6.2 Base Year: 2025
- 2.6.3 Forecast Period: 2025-2035
- 2.7 Research Assumptions and Limitations
Chapter 3 Executive Summary
- 3.1 Market Snapshot and Key Findings
- 3.2 Base-Year Market Size, 2025
- 3.3 Forecast Market Size, 2035
- 3.4 Revenue and Volume Growth Outlook
- 3.5 Key Demand and Supply Indicators
- 3.6 Leading Market Segments
- 3.7 Fastest-Growing Market Opportunities
- 3.8 Regional Performance Highlights
- 3.9 Technology and Industry Transformation
- 3.10 Competitive Landscape Summary
- 3.11 Analyst View and Strategic Implications
Chapter 4 Asia Pacific Herbal Beauty Products Market Trends and Developments
- 4.1 Historical Industry Development, 2018-2025
- 4.2 Recent Market Trends and Developments
- 4.3 Demand and Customer Behavior Trends
- 4.4 Technology and Product Innovation
- 4.5 Artificial Intelligence, Automation and Digitalization
- 4.6 Local Manufacturing and Supply Chain Realignment
- 4.7 Industry Partnerships, Mergers and Acquisitions
- 4.8 Sustainability and Circular Economy Developments
- 4.9 Government and Private Sector Investment Trends
- 4.10 Emerging Business Models and Commercialization
- 4.11 Industry Developments and Announcements
Chapter 5 Asia Pacific Herbal Beauty Products Market Production, Supply and Demand Analysis
- 5.1 Demand Trend and Consumption Analysis, 2018-2025
- 5.2 Demand Forecast, 2025-2035
- 5.3 Production and Output Trend, 2018-2025
- 5.4 Production and Output Forecast, 2025-2035
- 5.5 Installed Capacity and Capacity Utilization
- 5.6 Company-Wise Production Plants and Statistics
- 5.6.1 Installed Production Capacity
- 5.6.2 Actual Production
- 5.6.3 Planned Capacity and Expansion Targets
- 5.7 Supply Chain Structure and Procurement Trends
- 5.8 Supply-Demand Gap and Bottlenecks
- 5.9 Import Dependence and Sourcing Structure
- 5.10 Contract Manufacturing and Outsourcing
- 5.11 Regional Supply and Demand Concentration
Chapter 6 Asia Pacific Herbal Beauty Products Market Pricing Analysis
- 6.1 Pricing Structure and Measurement
- 6.2 Historical Pricing Trends, 2018-2025
- 6.3 Pricing Outlook, 2025-2035
- 6.4 Average Selling Price and Unit Economics
- 6.5 Pricing by Product and Market Segment
- 6.6 Geographic Pricing Differences
- 6.7 Key Input, Energy, Labor and Logistics Costs
- 6.8 Contract Pricing and Purchasing Models
- 6.9 Pricing Sensitivity and Competitive Positioning
- 6.10 Price, Margin and Profitability Implications
Chapter 7 Asia Pacific Herbal Beauty Products Market Dynamics
- 7.1 Market Growth Drivers
- 7.1.1 Demand-Side Drivers
- 7.1.2 Technology and Innovation Drivers
- 7.1.3 Infrastructure and Investment Drivers
- 7.1.4 Regulatory and Policy Drivers
- 7.2 Market Restraints
- 7.2.1 Cost and Affordability Constraints
- 7.2.2 Technology and Adoption Barriers
- 7.2.3 Supply Chain and Operational Constraints
- 7.3 Market Challenges
- 7.3.1 Competitive Pressure and Margin Erosion
- 7.3.2 Skills, Infrastructure and Implementation Gaps
- 7.4 Emerging Market Opportunities
- 7.5 Market Dynamics Impact and Time-Horizon Assessment
Chapter 8 Asia Pacific Herbal Beauty Products Value Chain Analysis
- 8.1 Industry Value Chain Overview
- 8.2 Upstream Suppliers and Critical Inputs
- 8.3 Technology and Component Providers
- 8.4 Manufacturing or Service Delivery
- 8.5 Distribution, Channel Partners and Integrators
- 8.6 Downstream Applications and End Users
- 8.7 Value Addition and Profit Pools
- 8.8 Vertical Integration and Outsourcing
- 8.9 Supplier Concentration and Risk
- 8.10 Supply Chain Localization and Resilience
Chapter 9 Asia Pacific Herbal Beauty Products Market Regulations and Policies
- 9.1 Relevant Laws, Standards and Compliance Frameworks
- 9.2 Product, Service, Safety and Quality Requirements
- 9.3 Government Policies, Incentives and Subsidies
- 9.4 Imports, Exports and Trade Barriers
- 9.5 Public Procurement and Local Content Requirements
- 9.6 Environmental and Sustainability Compliance
- 9.7 Upcoming Policy Changes and Market Implications
Chapter 10 Asia Pacific Herbal Beauty Products Market Hotspots and Opportunities
- 10.1 Market Opportunity Mapping and Growth Hotspots
- 10.2 High-Growth Applications and Customer Groups
- 10.3 Underserved Markets and White-Space Opportunities
- 10.4 Emerging Technology and Product Opportunities
- 10.5 New Capacity and Investment Hotspots
- 10.6 Market Entry and Expansion Opportunities
- 10.7 Distribution and Partnership Opportunities
- 10.8 Near-Term and Long-Term Commercial Potential
- 10.9 Opportunity Attractiveness and Execution Risks
Chapter 11 Asia Pacific Herbal Beauty Products Market Outlook, 2025-2035
- 11.1 Market Size and Analysis
- 11.1.1 Revenue (Market Measurement: 2025: USD 24.39 billion → 2035: USD 59.32 billion)
- 11.1.2 Market Volume and Quantity Sold
- 11.1.3 Historical Market Size, 2018-2025
- 11.1.4 Base-Year Market Size, 2025
- 11.2 Market Forecast, 2025-2035
- 11.2.1 Revenue Forecast to 2035
- 11.2.2 Volume Forecast to 2035
- 11.2.3 CAGR and Year-on-Year Growth
- 11.2.4 Incremental Revenue Opportunity
- 11.3 Forecast Assumptions and Scenario Analysis
- 11.3.1 Base-Case Forecast
- 11.3.2 Optimistic and Conservative Scenarios
- 11.3.3 Technology, Pricing and Policy Sensitivities
- 11.4 Market Attractiveness and Growth Outlook
Chapter 12 Asia Pacific Herbal Beauty Products Market Segmentation and Outlook
- 12.1 Segmentation Summary and Market Shares, 2025
- 12.2 Largest and Fastest-Growing Segments
- 12.3 By Product Type - Market Size and Forecast, 2025-2035
- 12.3.1 Segment Definition and Scope
- 12.3.2 Historical Market Size, 2018-2025
- 12.3.3 Revenue Forecast, 2025-2035
- 12.3.4 Volume Forecast, 2025-2035
- 12.3.5 Base-Year Market Share, 2025
- 12.3.6 Segment CAGR and Growth Drivers
- 12.3.7 Subsegment Market Size and Forecast
- 12.3.7.1 Skincare
- 12.3.7.2 Hair Care
- 12.3.7.3 Body Care
- 12.3.7.4 Color Cosmetics and Fragrance
- 12.3.8 Subsegment Pricing and Adoption Trends
- 12.3.9 Leading Suppliers and Competition
- 12.3.10 Regional Demand and Opportunities
- 12.4 By Price Tier - Market Size and Forecast, 2025-2035
- 12.4.1 Segment Definition and Scope
- 12.4.2 Historical Market Size, 2018-2025
- 12.4.3 Revenue Forecast, 2025-2035
- 12.4.4 Volume Forecast, 2025-2035
- 12.4.5 Base-Year Market Share, 2025
- 12.4.6 Segment CAGR and Growth Drivers
- 12.4.7 Subsegment Market Size and Forecast
- 12.4.7.1 Mass Market
- 12.4.7.2 Masstige
- 12.4.7.3 Premium
- 12.4.7.4 Luxury
- 12.4.8 Subsegment Pricing and Adoption Trends
- 12.4.9 Leading Suppliers and Competition
- 12.4.10 Regional Demand and Opportunities
- 12.5 By Customer Type - Market Size and Forecast, 2025-2035
- 12.5.1 Segment Definition and Scope
- 12.5.2 Historical Market Size, 2018-2025
- 12.5.3 Revenue Forecast, 2025-2035
- 12.5.4 Volume Forecast, 2025-2035
- 12.5.5 Base-Year Market Share, 2025
- 12.5.6 Segment CAGR and Growth Drivers
- 12.5.7 Subsegment Market Size and Forecast
- 12.5.7.1 Adult Women
- 12.5.7.2 Adult Men
- 12.5.7.3 Teenagers
- 12.5.7.4 Children and Babies
- 12.5.8 Subsegment Pricing and Adoption Trends
- 12.5.9 Leading Suppliers and Competition
- 12.5.10 Regional Demand and Opportunities
- 12.6 By Country - Market Size and Forecast, 2025-2035
- 12.6.1 Segment Definition and Scope
- 12.6.2 Historical Market Size, 2018-2025
- 12.6.3 Revenue Forecast, 2025-2035
- 12.6.4 Volume Forecast, 2025-2035
- 12.6.5 Base-Year Market Share, 2025
- 12.6.6 Segment CAGR and Growth Drivers
- 12.6.7 Subsegment Market Size and Forecast
- 12.6.7.1 China
- 12.6.7.2 Japan
- 12.6.7.3 India
- 12.6.7.4 Rest of Asia Pacific
- 12.6.8 Subsegment Pricing and Adoption Trends
- 12.6.9 Leading Suppliers and Competition
- 12.6.10 Regional Demand and Opportunities
- 12.7 Segment Growth Comparison
- 12.8 Segment Attractiveness and Priority Matrix
Chapter 13 Asia Pacific Herbal Beauty Products End-Use and Application Market Outlook
- 13.1 End-Use Industry and Customer Demand Structure
- 13.2 Leading Applications and Customer Groups
- 13.3 End-Use Market Size, Share and Forecast
- 13.4 Major End-Use Industry Deep Dives
- 13.4.1 Customer Requirements and Use Cases
- 13.4.2 Demand and Replacement Cycles
- 13.4.3 Technical and Regulatory Considerations
- 13.4.4 Purchasing and Procurement Models
- 13.4.5 Leading Vendors and Distribution Channels
- 13.4.6 Forecast and Commercial Opportunities
- 13.5 Emerging Applications and Cross-Segment Demand
- 13.6 End-Use Industry Investment Priorities
Chapter 14 Asia Pacific Herbal Beauty Products Geographic Market Outlook, 2025-2035
- 14.1 Regional Market Size and Country-Level Shares, 2025
- 14.2 Country Market Size Comparison, 2025
- 14.3 Country Market Forecasts, 2025-2035
- 14.4 Subregional Industrial and Demand Clusters
- 14.5 Intra-Regional Pricing and Cost Differences
- 14.6 Cross-Border Trade and Supply Networks
- 14.7 Regional Supply and Demand Balances
- 14.8 Country Opportunity Comparison and Prioritization
Note: Every listed country is covered on the structure shown under the first country.
Chapter 15 Asia Pacific Herbal Beauty Products Technology, Innovation and Sustainability Outlook
- 15.1 Technology Landscape and Maturity
- 15.2 Product, Process and Service Innovation
- 15.3 AI, Automation and Digital Tools in the Industry
- 15.4 Technology Adoption and Performance Benchmarking
- 15.5 Innovation Pipeline and R&D Investment
- 15.6 Patent and Intellectual Property Trends
- 15.7 Energy Efficiency and Resource Management
- 15.8 Sustainability, Recycling and Circularity
- 15.9 Technology Roadmap, 2025-2035
- 15.10 Risks of Obsolescence and Technology Substitution
Chapter 16 Asia Pacific Herbal Beauty Products Market Key Strategic Imperatives
- 16.1 Growth and Market Entry Priorities
- 16.2 High-Return Products and Segments
- 16.3 Pricing, Profitability and Cost Optimization
- 16.4 Technology Investment and Product Differentiation
- 16.5 Supply Chain Localization and Resilience
- 16.6 Distribution and Customer Acquisition
- 16.7 Partnership, Acquisition and Capacity Strategy
- 16.8 Regional Expansion Priorities
- 16.9 Short-, Medium- and Long-Term Actions
Chapter 17 Competition Outlook
- 17.1 Industry Competition Characteristics
- 17.2 Market Structure and Concentration
- 17.3 Market Share and Competitive Positioning, 2025
- 17.4 Company-Wise Revenue and Product Benchmarking
- 17.5 Production and Service Capacity Benchmarking
- 17.6 Technology, Pricing and Differentiation
- 17.7 Regional Footprint and Distribution Strength
- 17.8 Mergers, Acquisitions and Strategic Alliances
- 17.9 New Entrants and Competitive Threats
- 17.10 Porter's Five Forces and Industry Attractiveness
- 17.11 Competitive Outlook, 2025-2035
Chapter 18 Company Profiles
- 18.1 Company Coverage and Selection Criteria
- 18.2 Amorepacific Group
- 18.2.1 Business Description
- 18.2.2 Company Ownership and Geographic Presence
- 18.2.3 Product and Service Portfolio
- 18.2.4 Manufacturing and Operating Footprint
- 18.2.5 Production Capacity and Expansion Plans
- 18.2.6 Financial Performance and Investment
- 18.2.7 Market Share and Competitive Position
- 18.2.8 Technology and Innovation Capabilities
- 18.2.9 Strategic Alliances or Partnerships
- 18.2.10 Recent Developments
- 18.2.11 Growth Strategy and Outlook
- 18.3 Himalaya Wellness Company
- 18.4 Dabur India Limited
- 18.5 LG H&H Co., Ltd.
- 18.6 Shanghai Inoherb Cosmetics Co., Ltd.
- 18.7 Lotus Herbals Private Limited
- 18.8 Honasa Consumer Limited
- 18.9 Shanghai Jahwa United Co., Ltd.
- 18.10 Forest Essentials
- 18.11 PT Mustika Ratu Tbk
- 18.12 Other Relevant Market Participants
Note: Every listed company is profiled on the structure shown under the first company. The company list is preliminary and may change based on research findings, market developments, data availability and client requirements.
Chapter 19 Disclaimer
- 19.1 Research and Forecast Disclaimer
- 19.2 Data Source and Estimation Limitations
Note: The depth of individual sections depends on data availability for this market. Volume, capacity, trade and other unit-based metrics are included where applicable.

