
Washroom refits and public builds keep dryer demand rising
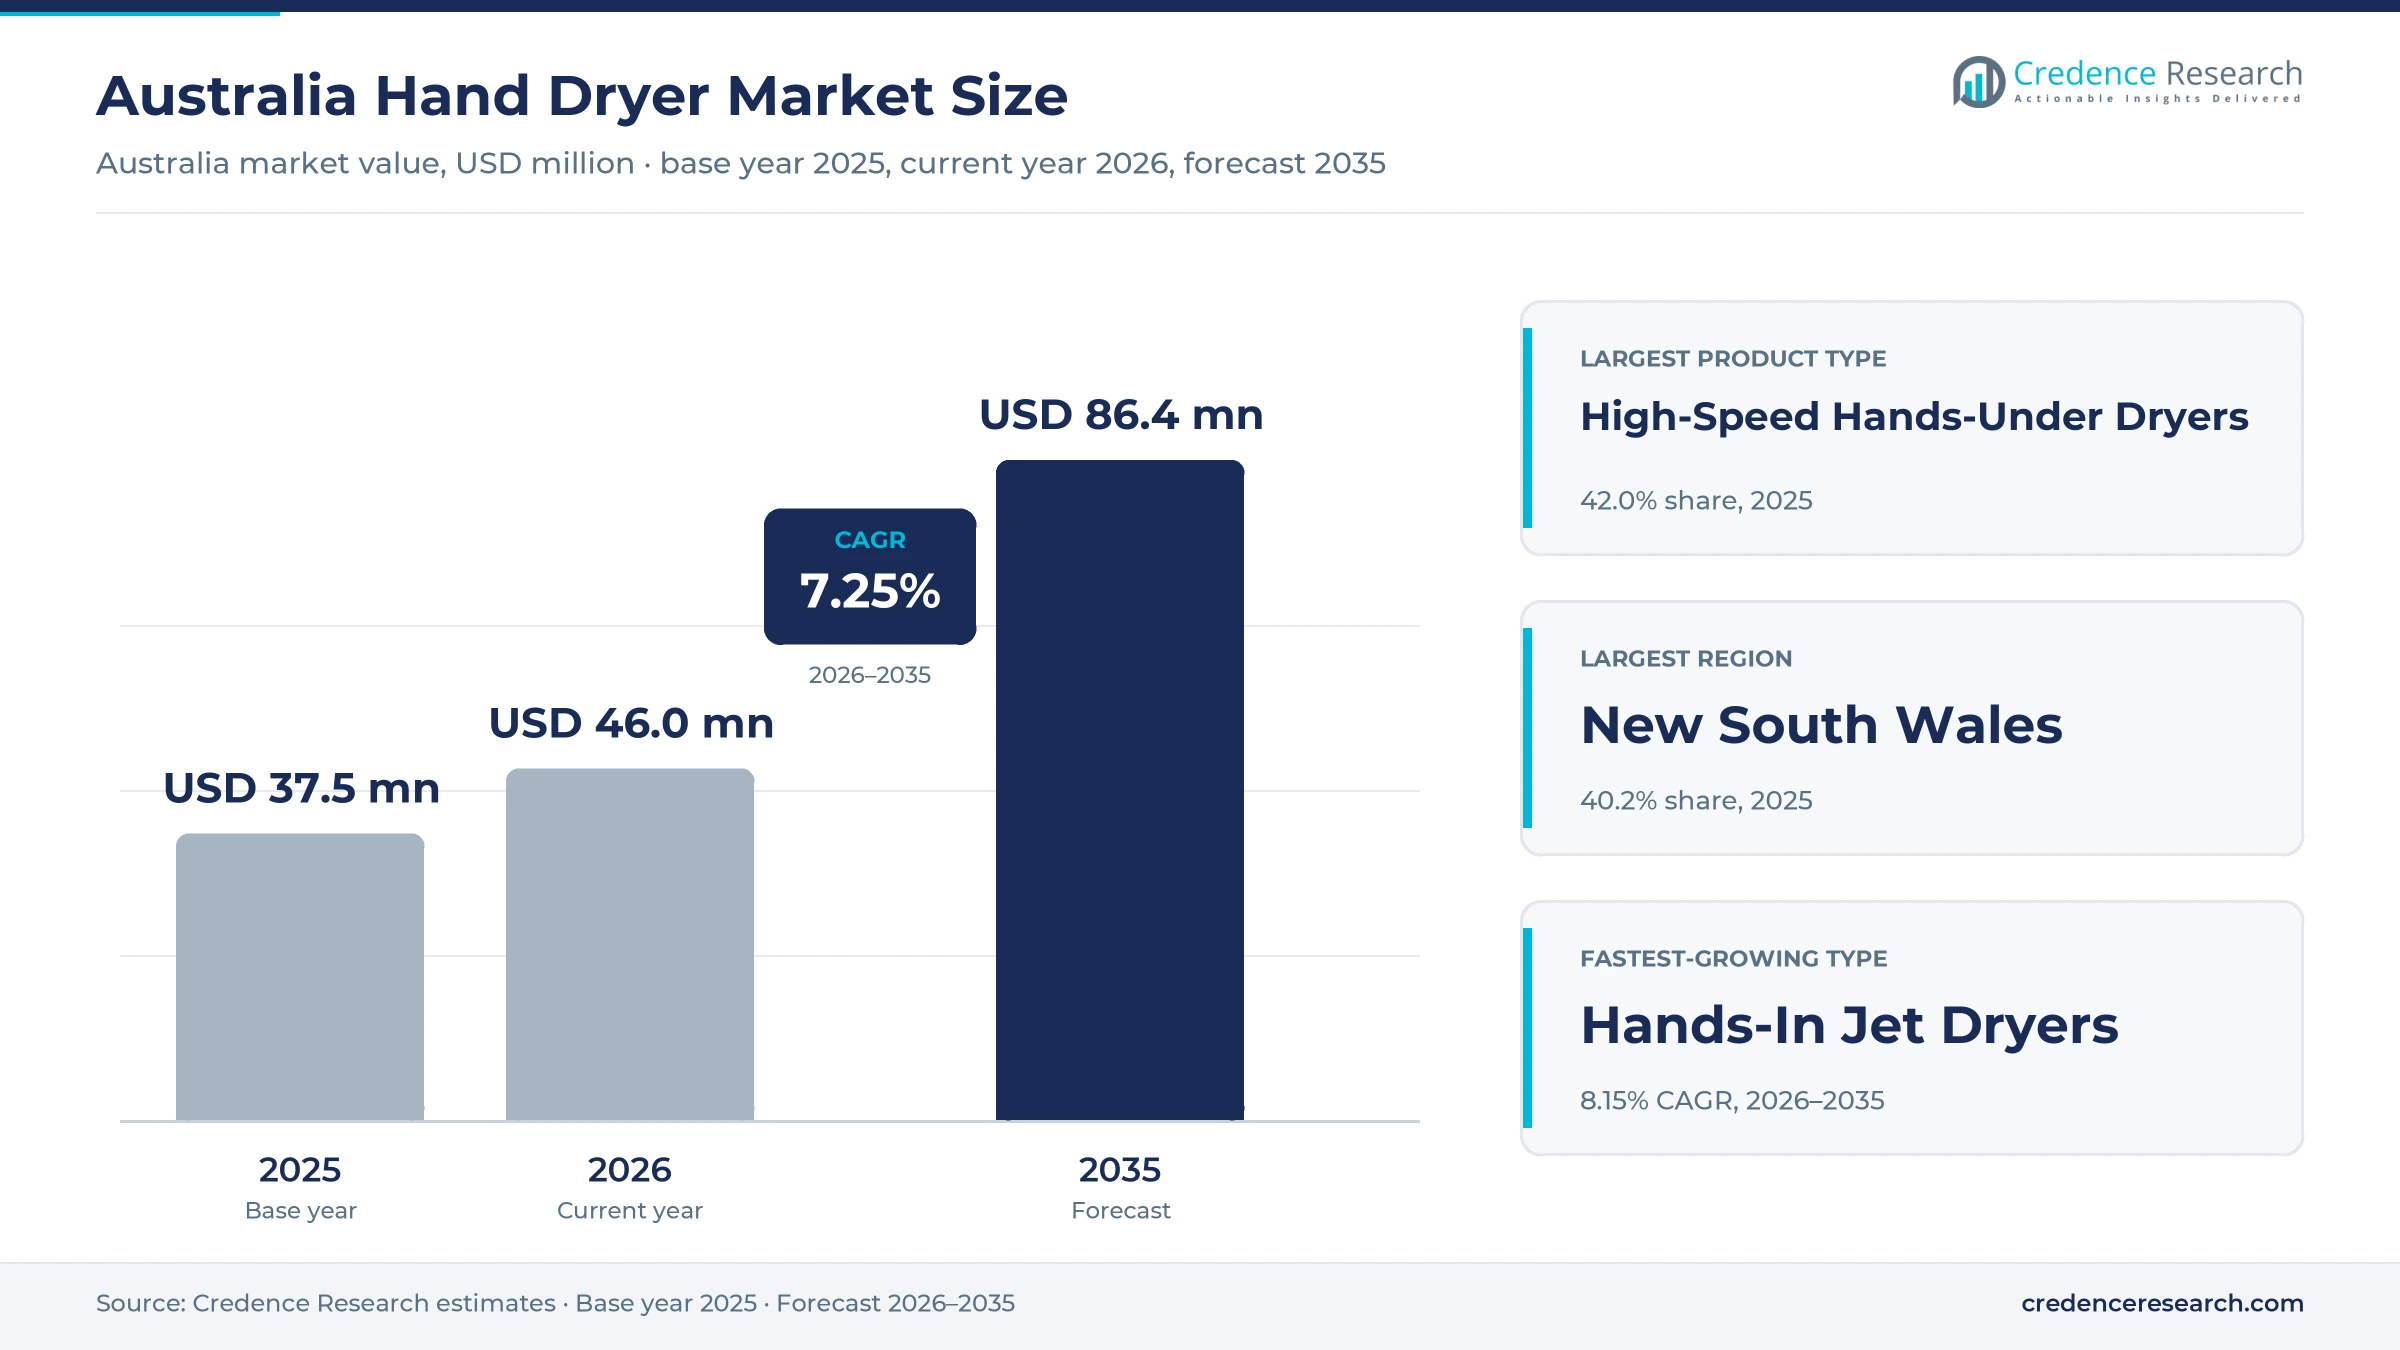
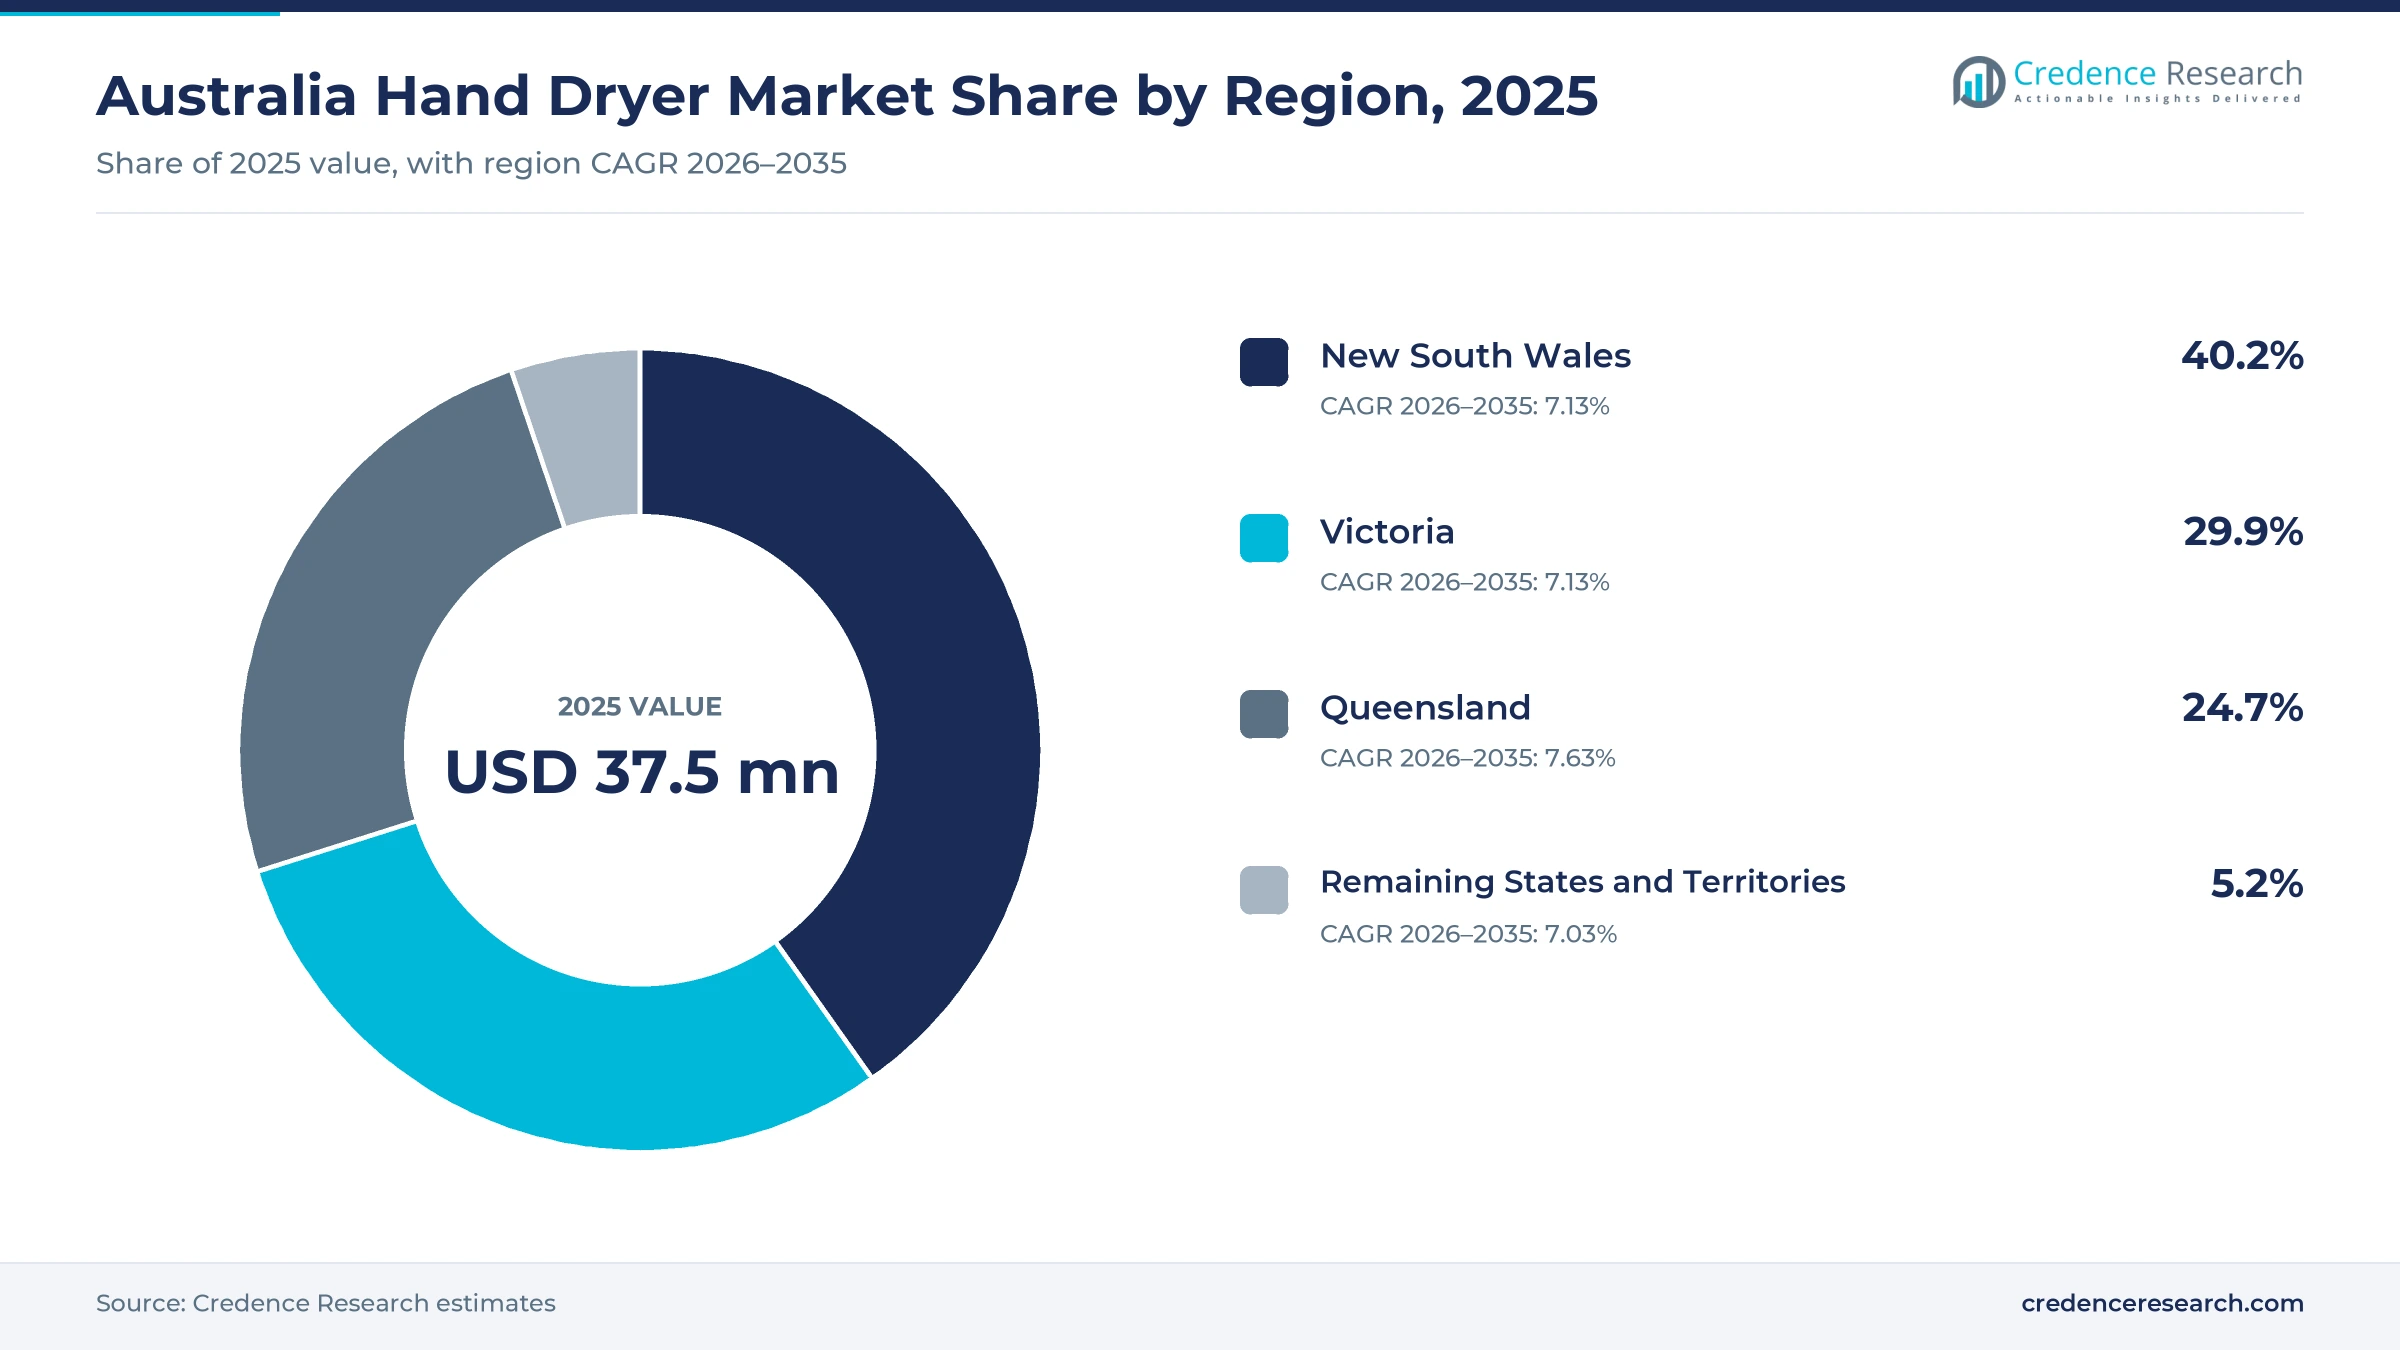
The Australia hand dryer market was valued at USD 37.5 million in 2025 and is projected to increase from USD 46.0 million in 2026 to USD 86.4 million by 2035, registering a CAGR of 7.25% during 2026–2035. Demand comes from office and retail landlords, foodservice operators, schools, hospitals, government buildings, hotels, venues and transport terminals that replace aging units or fit new washrooms. New South Wales held the largest regional share, 40.2% in 2025, because the state has the largest population, at 8.67 million residents in March 2026. Queensland is the fastest-growing region at 7.63% a year, as venue projects for the 2032 Games add new washrooms. In turn, buyers are moving from warm-air units toward high-speed and jet units with filtered air, lower energy use and touch-free sensors.
Which washroom drying units are counted in Australia?
The estimate measures spending in Australia on warm-air dryers, high-speed hands-under dryers and hands-in jet dryers with infrared, other automatic or push-button activation. It covers replacement, new-build and paper-towel conversion installations bought by commercial, education, government, healthcare, hospitality and transport buyers through distributors, direct sales, online stores and tenders. Values are stated in USD million at current prices and exclude goods and services tax.
The estimate excludes paper towel dispensers, soap dispensers, installation labor and service contracts sold separately. The value chain runs from overseas and local brands through importers, plumbing and washroom distributors and online sellers to builders, facility managers, schools, hospitals and venue operators.
Australia Hand Dryer Market Insights
- The Australia hand dryer market was valued at USD 37.5 million in 2025 and is projected to reach USD 86.4 million by 2035, at a 7.25% CAGR during 2026–2035.
- New South Wales held 40.2% of 2025 value, because the state had 8.67 million residents at March 2026, the most of any state.
- Replacement installations led applications with 50.0% of 2025 value, as aging warm-air units reach the end of service life.
- The New South Wales 2025-26 Budget set a record AUD 9 billion for school infrastructure over four years, which adds washroom fit-outs.
- Hands-in jet dryers grow fastest at 8.15% a year during 2026–2035, as busy washrooms favor short drying times and filtered air.
Hands-under units lead while jet dryers grow fastest
Why do high-speed hands-under units lead demand?
Based on product type, the market is categorized into warm-air dryers, high-speed hands-under dryers and hands-in jet dryers. High-Speed Hands-Under Dryers led with 42.0% of 2025 value, because they fit standard washroom walls and dry hands faster than warm-air units. Hands-In Jet Dryers grow fastest at 8.15% a year, as busy venues favor drying times of about 10 seconds.
Which installation types account for most spending?
Based on application, the market is categorized into replacement installations, new-build installations and paper-towel conversion retrofits. Replacement Installations led with 50.0% of 2025 value, because large fleets of older warm-air units are reaching the end of service life. Paper-Towel Conversion Retrofits grow fastest at 8.00% a year, as facility managers cut towel restocking and waste.
Which buyers account for most dryer purchases?
Based on end user, the market is categorized into commercial property and foodservice, education, government and healthcare, hospitality and event venues, and transport facilities. Commercial Property and Foodservice led with 34.0% of 2025 value, because offices, malls and restaurants hold the most washrooms. Transport Facilities grow fastest at 7.92% a year, as new airport and rail terminals open.
How do Australian buyers source dryers?
Based on sales channel, the market is categorized into distributor and trade sales, direct OEM sales, online equipment sales and procurement and tender sales. Distributor and Trade Sales led with 46.0% of 2025 value, because builders and plumbers buy through trade counters. Online Equipment Sales grow fastest at 8.25% a year, as small businesses compare models online.
| Segment Group | Leading Sub-segment | Share, 2025 | Fastest-growing Sub-segment | CAGR, 2026–2035 |
|---|---|---|---|---|
| By Product Type | High-Speed Hands-Under Dryers | 42.0% | Hands-In Jet Dryers | 8.15% |
| By Application | Replacement Installations | 50.0% | Paper-Towel Conversion Retrofits | 8.00% |
| By End User | Commercial Property and Foodservice | 34.0% | Transport Facilities | 7.92% |
| By Sales Channel | Distributor and Trade Sales | 46.0% | Online Equipment Sales | 8.25% |
Request a Free Sample
Fill in your details and we'll send you a free sample report.
- Sample data tables & charts
- Research methodology
Refits, school budgets and efficient units lift demand
How does replacement of aging washroom equipment lift demand?
Replacement of aging washroom equipment lifts demand, because offices, malls and public buildings already hold large fleets of warm-air units that reach the end of service life. Dyson launched its Airblade 9kJ in Australia in October 2019 at AUD 1,590, with a drying time of about 10 seconds, according to an industry news report. Trade retailer Buildmat lists the Metlam Ecoslender automatic unit at AUD 732 with a five-year warranty, which sets a clear renewal cycle. VELO Hand Dryers has also operated in Sydney for about 25 years, which shows how long the installed base has been building. As a result, replacement installations lead applications with 50.0% of 2025 value.
Why do institutional estates sustain procurement?
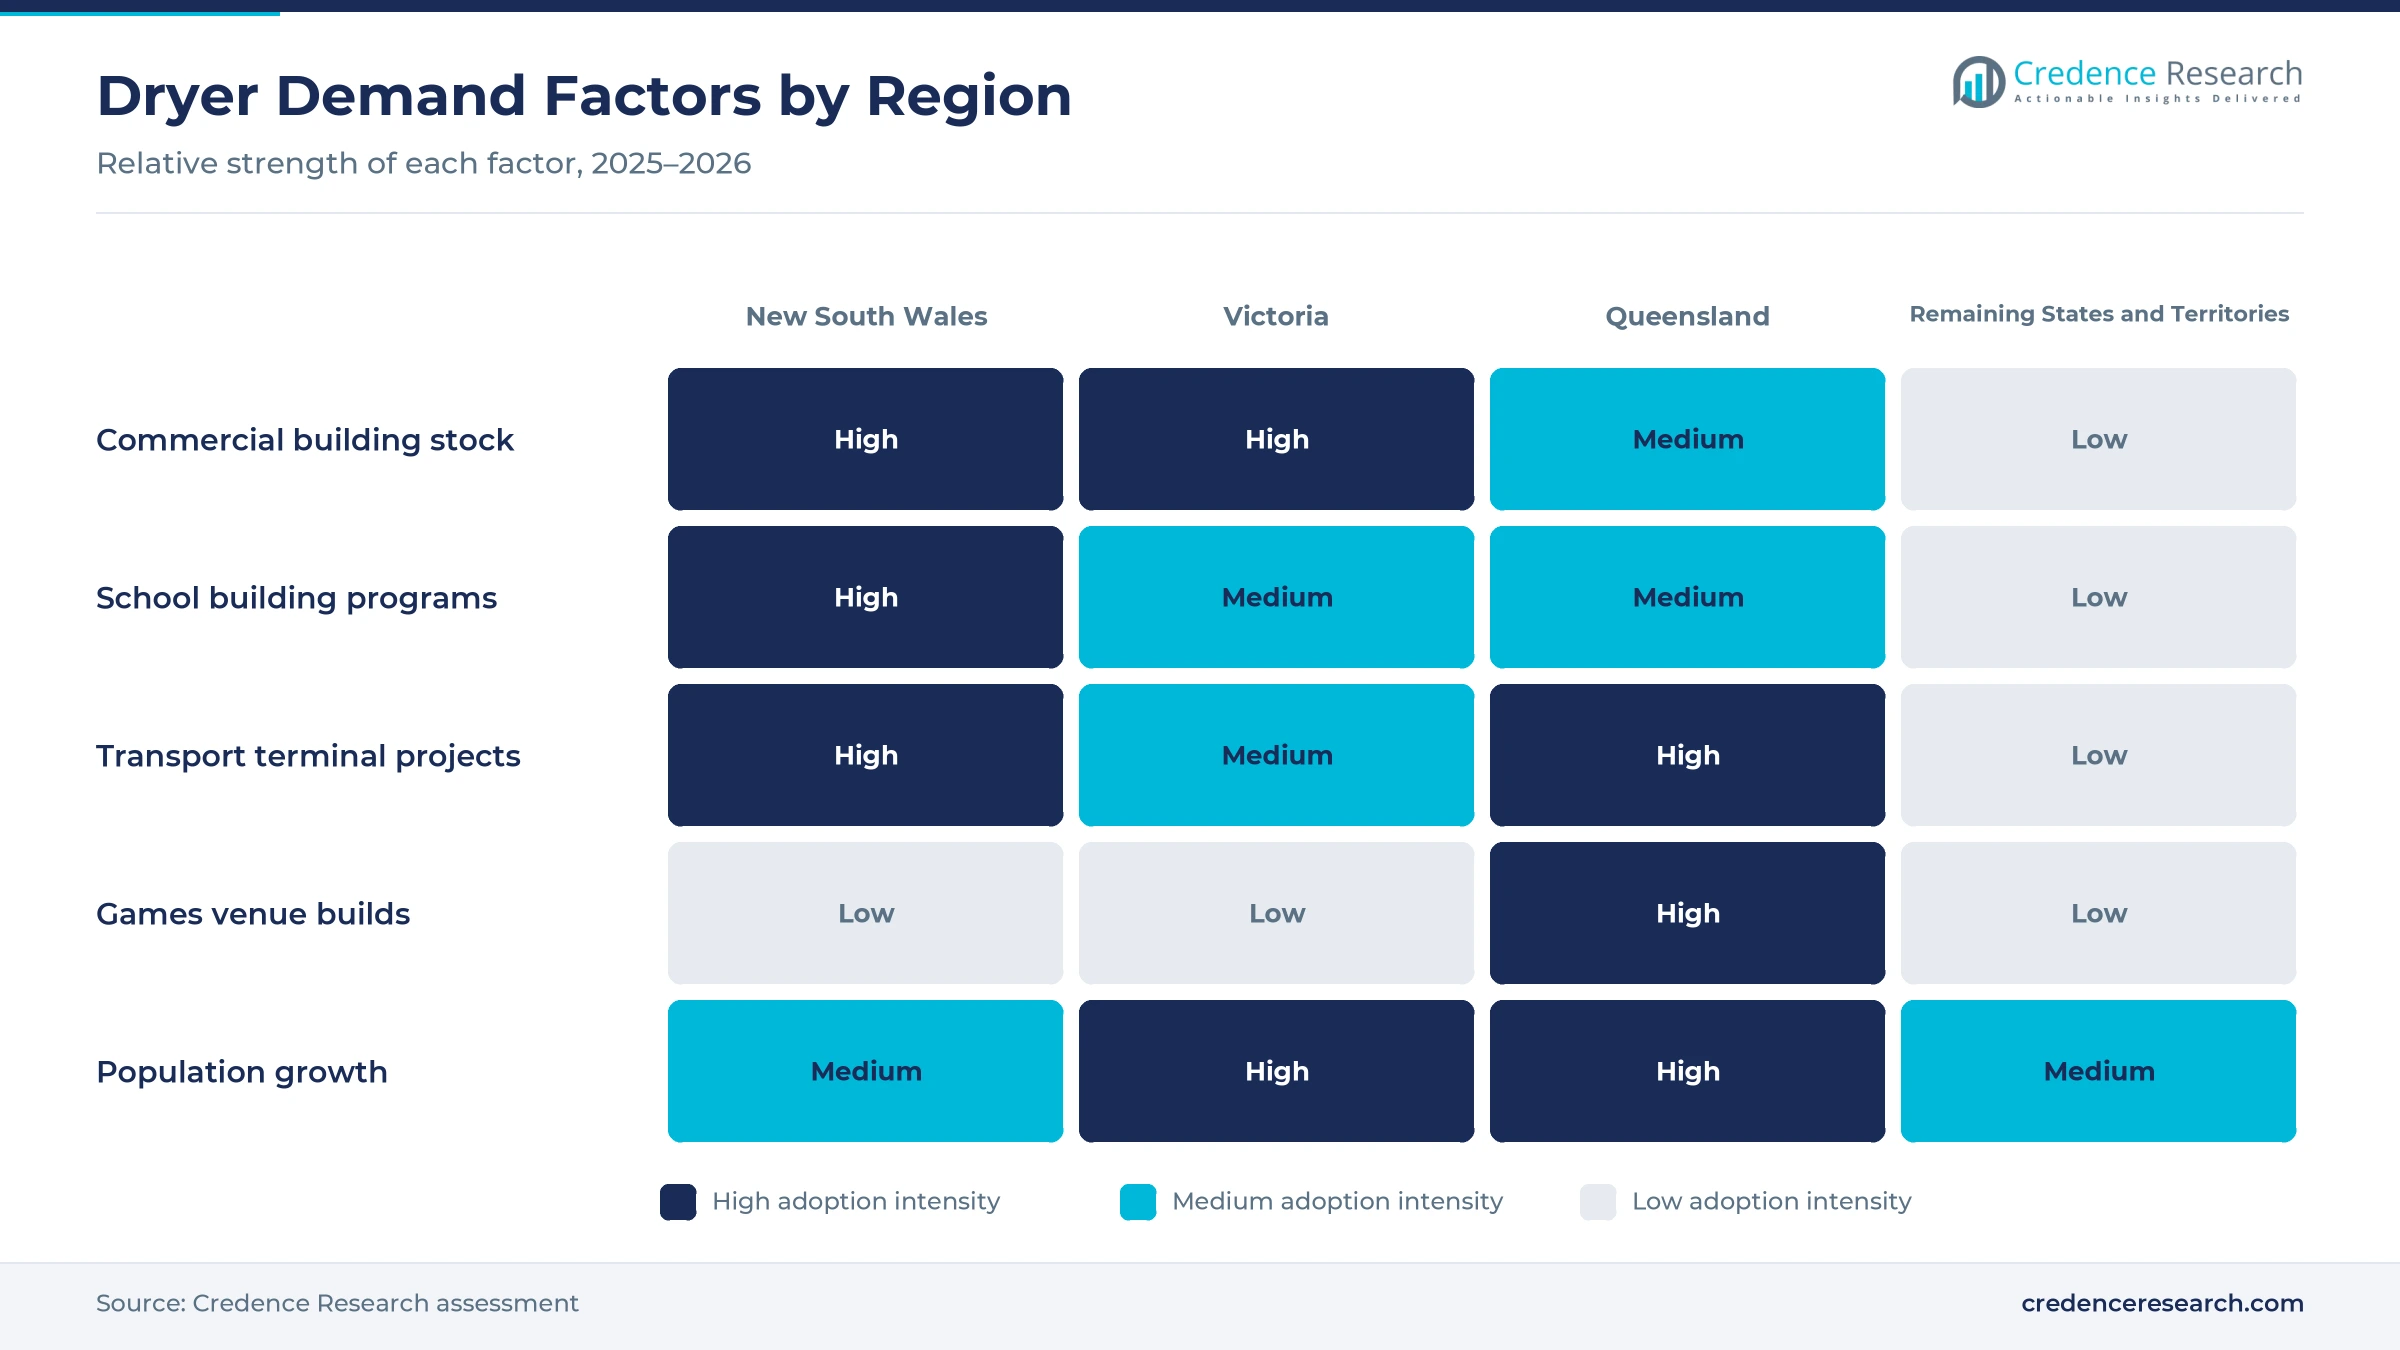
Institutional estates sustain procurement, because schools, hospitals and government buildings refit washrooms through long capital programs. On June 17, 2025, the New South Wales government announced a record AUD 9 billion for school infrastructure over four years, according to the state government. The program includes AUD 2.6 billion for the coming financial year and new schools at Emerald Hills, Grantham Farm, West Dapto and Wilton. Education buyers also use facility management and building automation contracts to plan upgrades across large estates. Consequently, school and hospital washroom upgrades flow through procurement and tender sales, which give suppliers long and predictable order pipelines across the state.
How do performance and resource efficiency support upgrades?
Performance and resource efficiency support upgrades, because facility managers compare energy use, drying speed and noise before they replace old units. Dyson states that the Airblade 9kJ uses 9.1 kilojoules per dry and up to 87% less energy than warm-air dryers in Eco mode, at about AUD 19 a year. Mitsubishi Electric Australia rates its Jet Towel Slim at 9 to 11 seconds on high, with standard mode using 550 kilowatt-hours a year without the heater. The same unit runs at 56 decibels in standard mode, which suits offices and clinics. In turn, hands-in jet dryers grow fastest at 8.15% a year in the Australia hand dryer market.
Why do transport terminals and Games venues add orders?
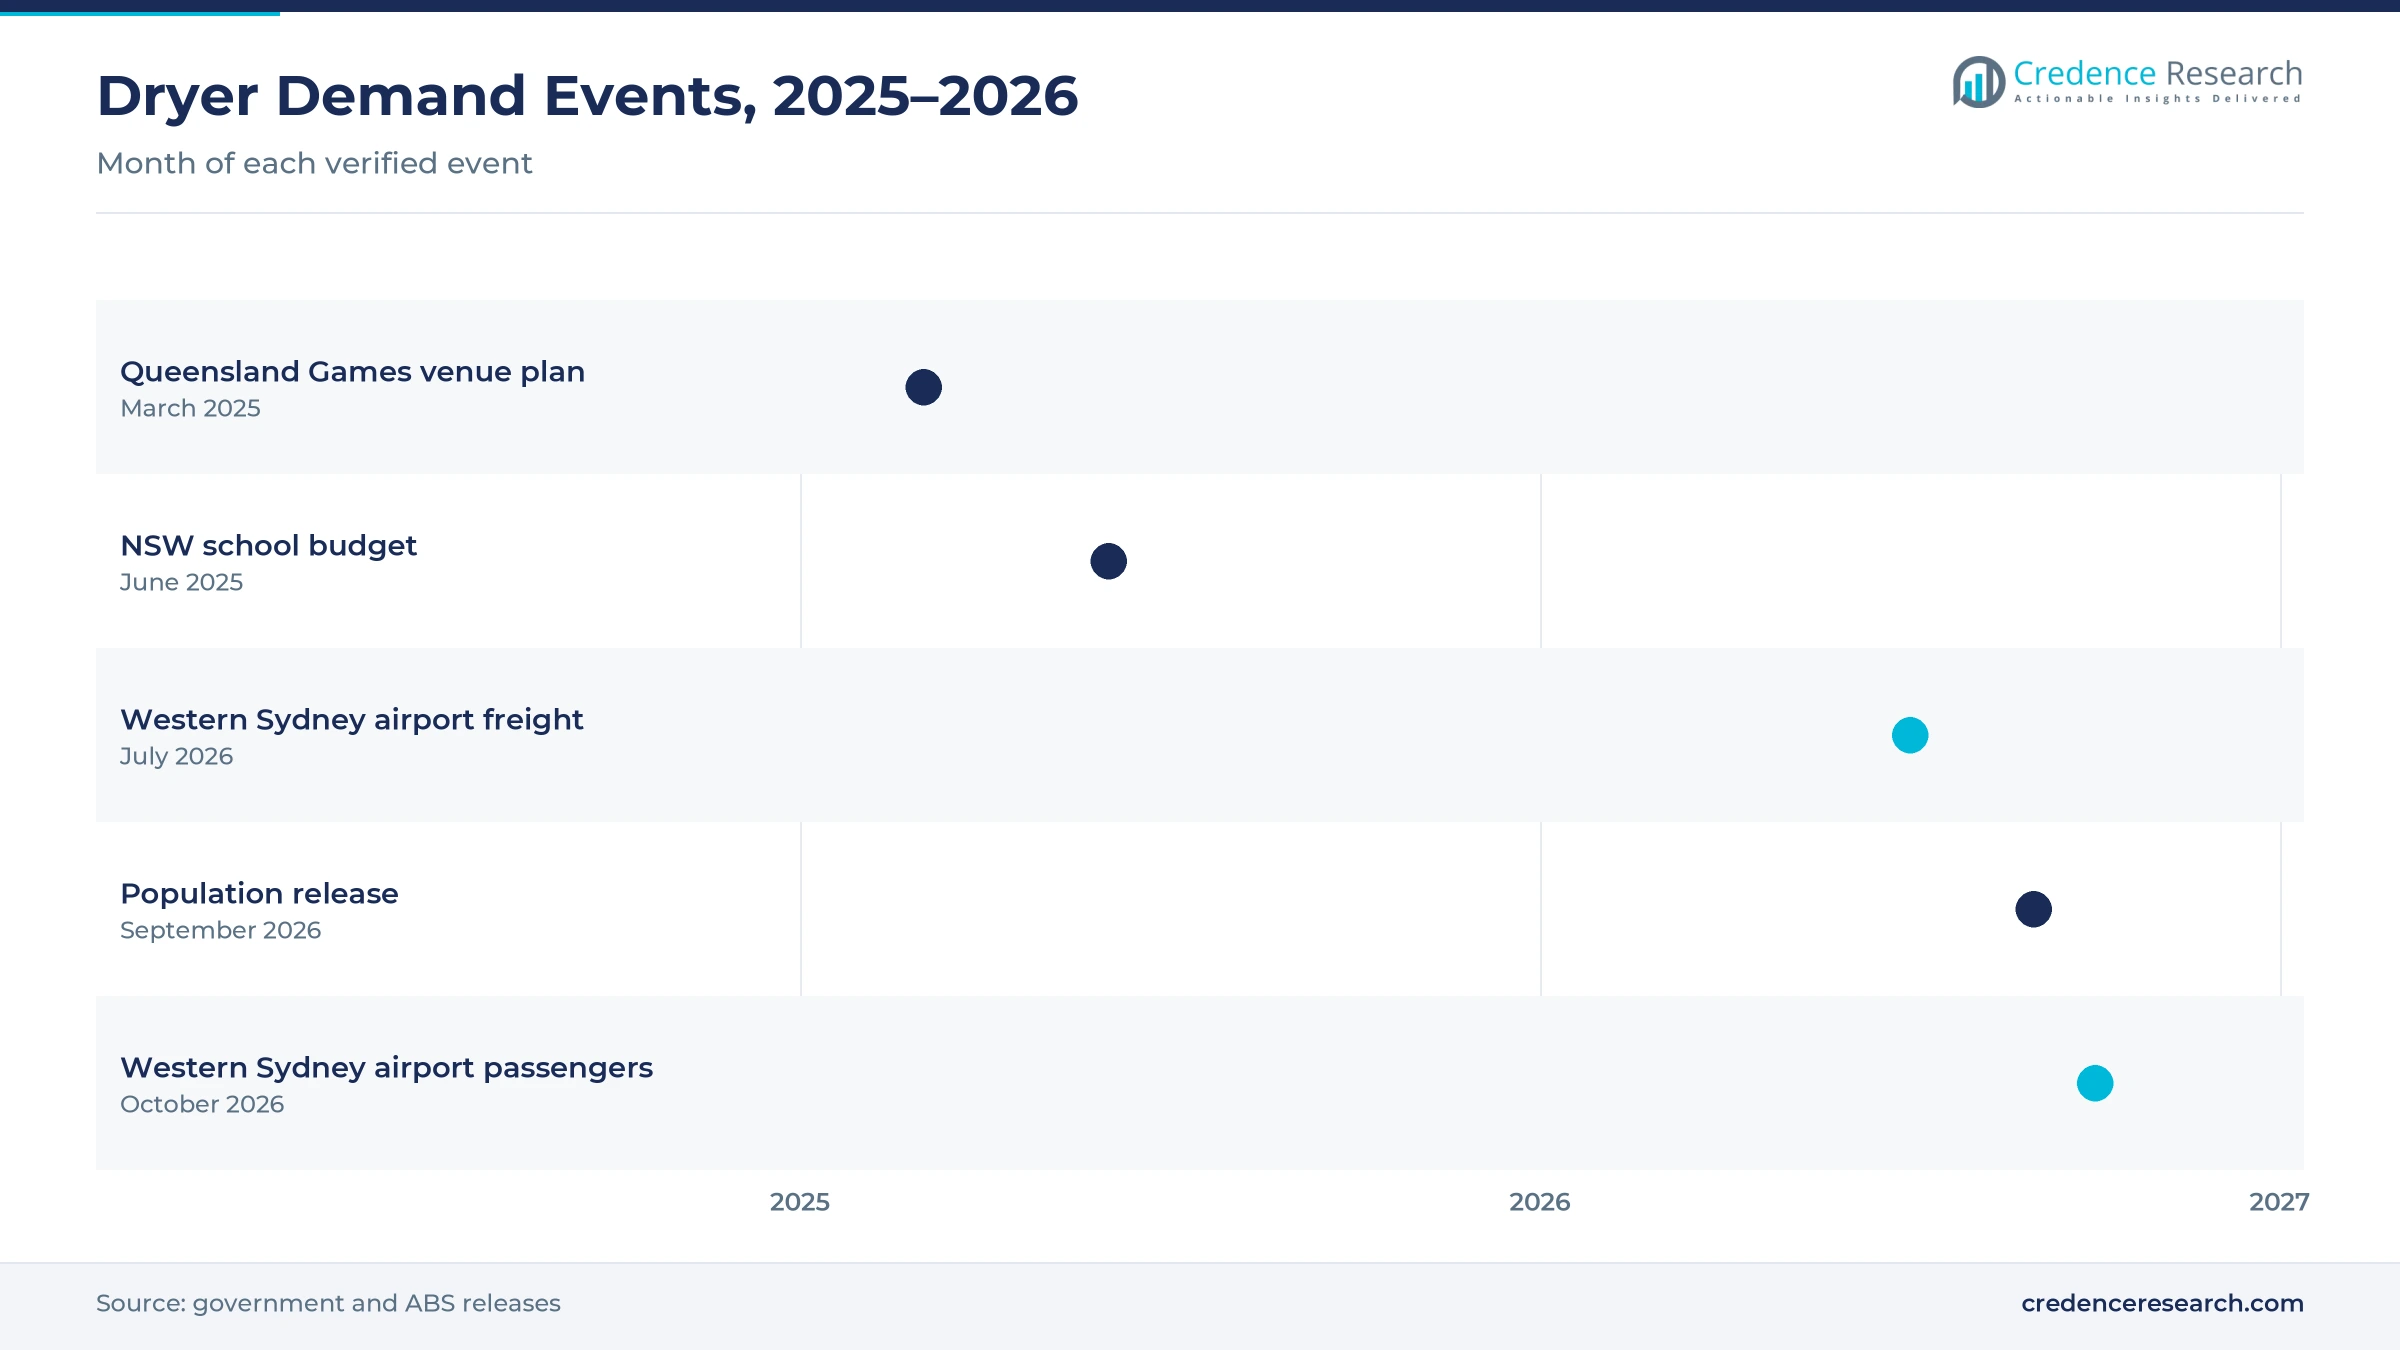
Transport terminals and Games venues add orders, because new public buildings fit hundreds of washrooms in one procurement round. Western Sydney International Airport welcomes its first passengers on Oct. 25, 2026, and will serve up to 10 million passengers a year, according to the Prime Minister. More than AUD 500 million also flowed to more than 360 local businesses during construction. In Queensland, the government unveiled a AUD 7.1 billion venue and infrastructure program in March 2025, including a new Victoria Park stadium for up to 63,000 people. As a result, transport facilities grow fastest among end users at 7.92% a year, as each new terminal fits many washrooms at once.
Filtered air, slim units and towel swaps shape demand
How is the rise of filtered air reshaping ranges?
The rise of filtered air is reshaping product ranges, because buyers want proof that dryers do not spread particles in shared washrooms. Dyson states that the Airblade 9kJ uses a HEPA filter that captures 99.95% of particles, including bacteria and viruses, from washroom air. Mitsubishi Electric Australia lists antibacterial surfaces, NSF certification and a washable air filter on its Jet Towel range. Its plastics contain metal ions that inhibit bacterial growth on the surface, according to its 2024 brochure. As a result, hospitals and food outlets that use healthcare facility management providers increasingly specify filtered units, which lifts premium jet dryer sales.
Why is the shift toward slim, accessible units rising?
The shift toward slim, accessible units is rising, because compact designs fit narrow walls and meet access rules in public washrooms. ASI JD MacDonald describes its whole dryer range as Accessible Compliant and supplies it from a head office in Keysborough, Victoria. Metlam's Ecoslender is sold as a slimline automatic unit for AUD 732, while Mitsubishi Electric Australia states that an improved nozzle cut Jet Towel Slim noise by two decibels. The same Slim model is offered in dark grey, silver and white finishes. Consequently, high-speed hands-under dryers lead product types with 42.0% of 2025 value, as they suit standard wall layouts.
Can paper-towel conversion open new retrofit demand?
Paper-towel conversion opens a clear retrofit opportunity, because each dryer removes the need to restock and dispose of towels. Dyson claims that the Airblade 9kJ produces up to 85% lower carbon dioxide emissions per dry than paper towels. Mitsubishi Electric Australia states that its dryers create no paper waste, while its Slim model uses 550 to 1,240 kilowatt-hours a year depending on mode. Facility managers that buy tissue paper in bulk can compare these running costs with towel supply contracts over several years. As a result, paper-towel conversion retrofits grow fastest among applications at 8.00% a year, as landlords and councils look for lower waste and simpler washroom servicing.
Is there room to grow with rising urban populations?
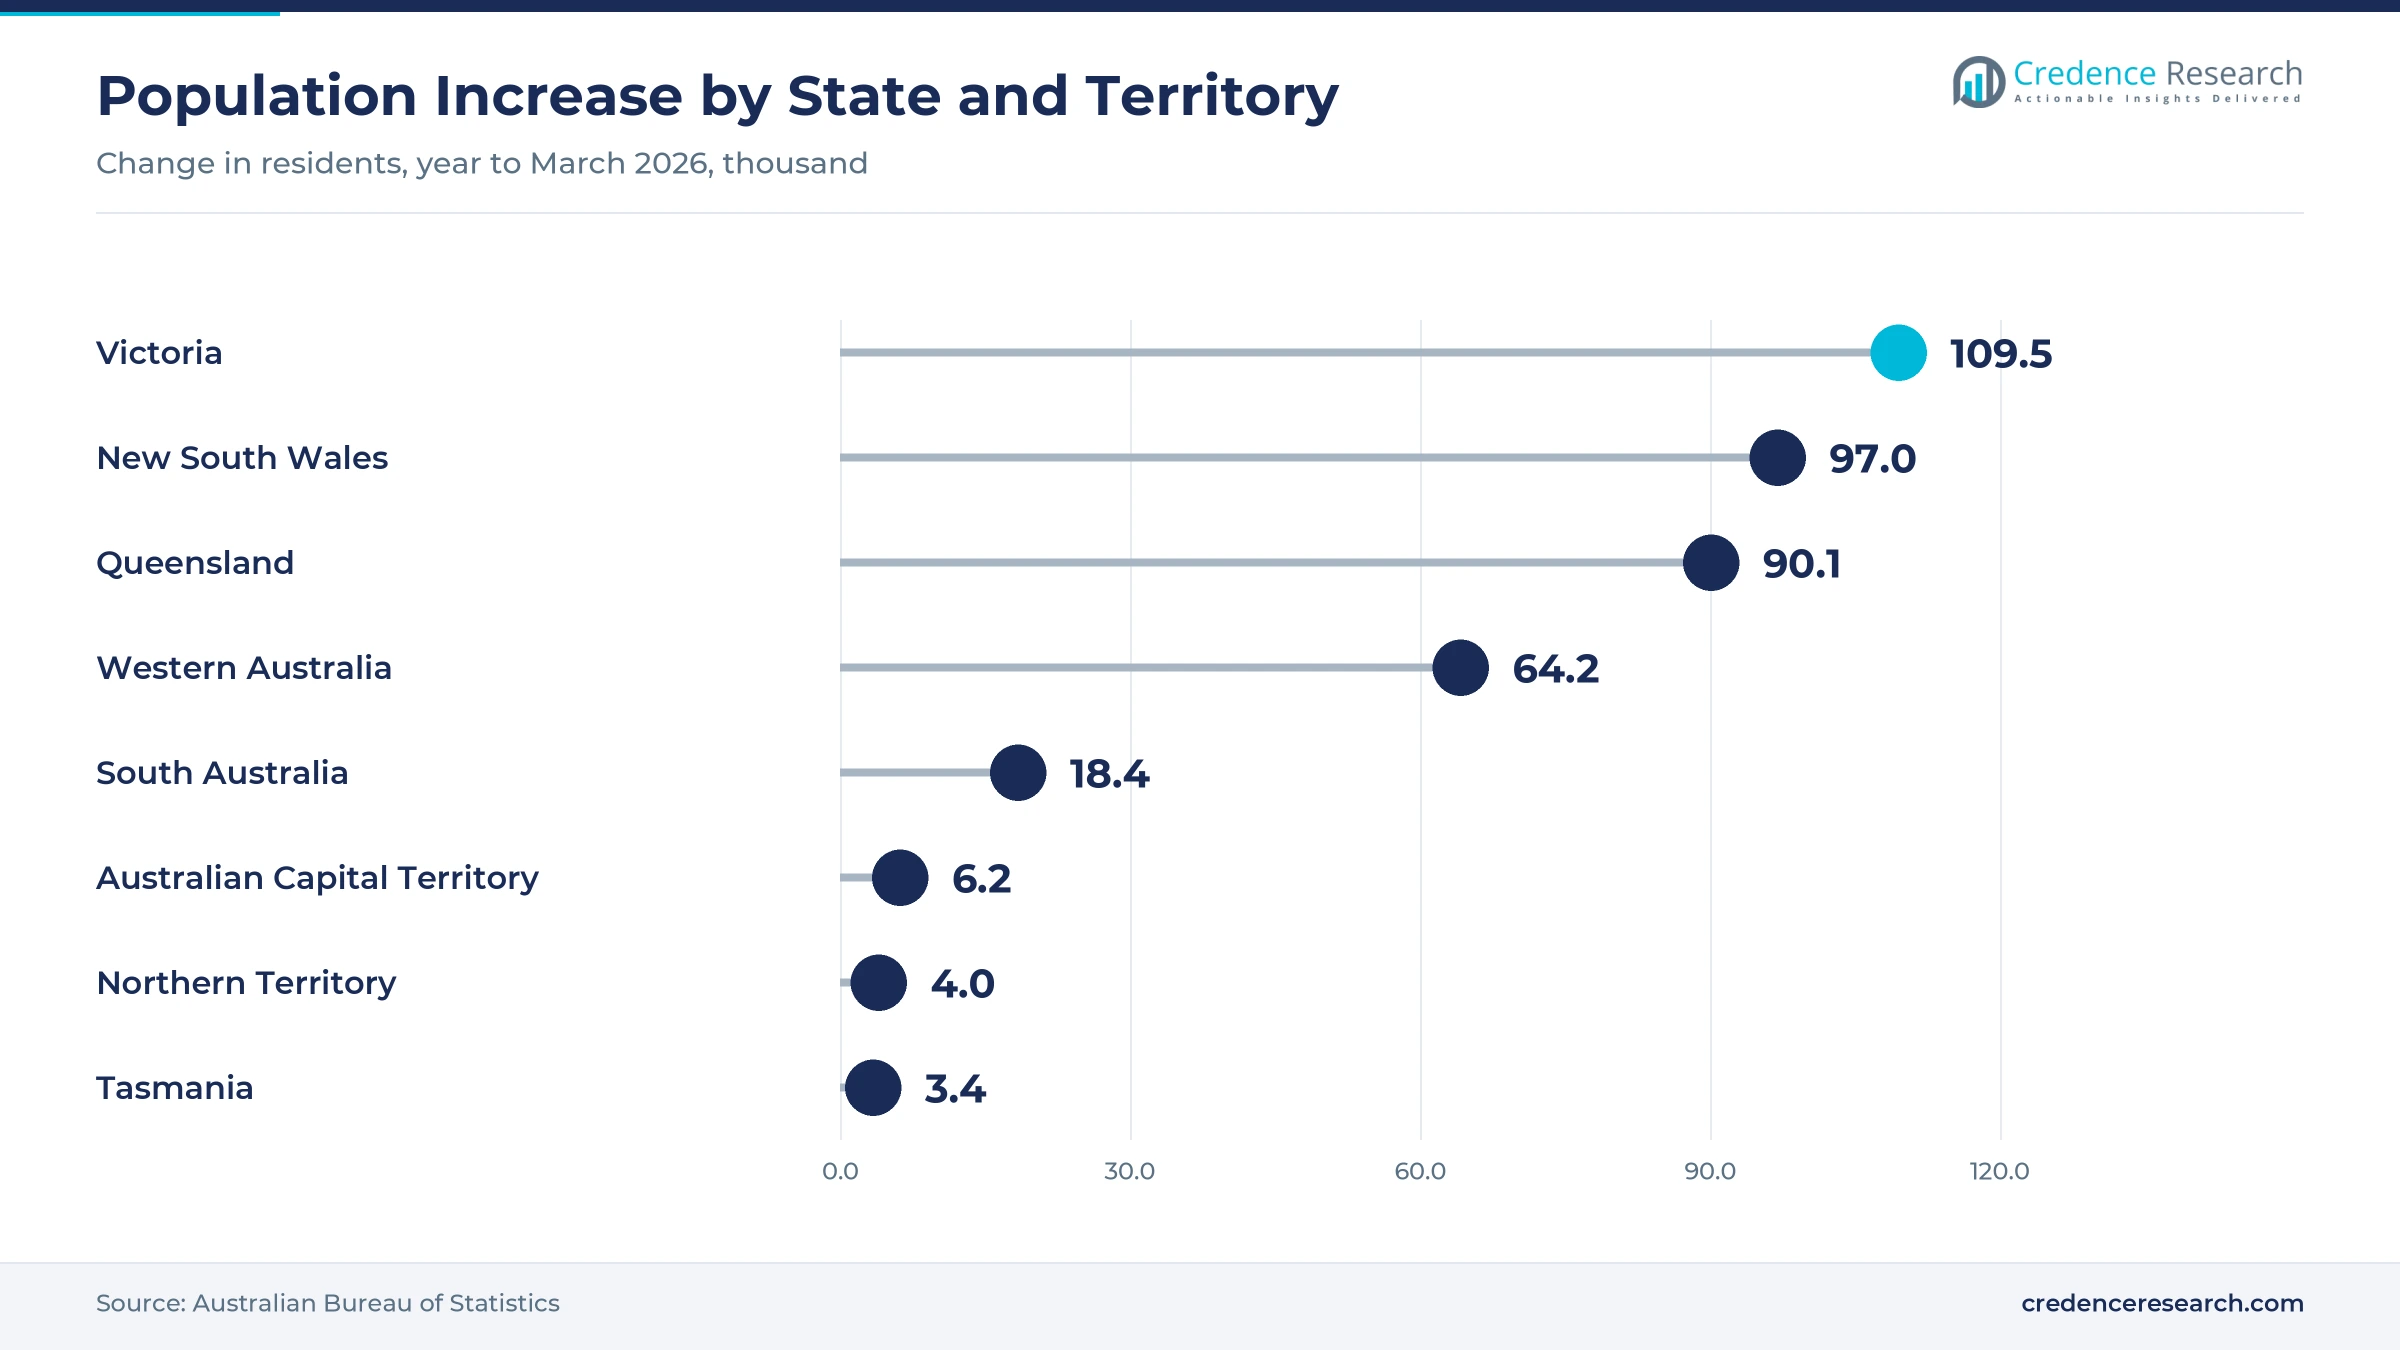
Rising urban populations offer a growth opening, because more residents mean more use of offices, malls, schools and transport washrooms. Australia had 27.9 million residents at March 2026, up 392,700 or 1.4% in a year, according to the Australian Bureau of Statistics. About 87.7% of residents lived in urban areas in 2025, according to the World Bank. Victoria and Queensland each grew 1.6%, while Western Australia grew fastest at 2.1%. Consequently, growing states keep adding offices, schools, shopping centers and sanitary ware fit-outs, while fast-growing Queensland suburbs create a steady pipeline of new public washrooms through 2035.
Upfront cost, noise and install work slow upgrades
How does upfront cost slow premium upgrades?
Upfront cost slows premium upgrades, because high-speed and jet units cost far more than basic warm-air models. Dyson launched the Airblade 9kJ at AUD 1,590, about twice the listed price of a slimline automatic unit. As a result, small businesses and schools with tight budgets often delay replacement. Suppliers answer with payback calculations, leasing options and mid-range models that keep fast drying while lowering the purchase price.
Why does noise limit use in sensitive spaces?
Noise limits use in sensitive spaces, because powerful motors can disturb patients, children and office workers near washrooms. Mitsubishi Electric's Jet Towel Slim runs at 56 to 59 decibels at two meters in standard and high modes. Consequently, clinics, libraries and early learning centers may choose towels or quieter modes instead. Brands respond with redesigned nozzles, lower-speed settings and sound insulation that cut noise without slowing drying too much.
How do installation and power needs add cost?
Installation and power needs add cost, because many dryers need a dedicated circuit and qualified electricians to fit them. Older buildings may also need wall reinforcement or new power points near basins. In turn, retrofit projects cost more than the dryer price alone suggests. Distributors reduce this barrier with installation partners, plug-in models and bundled quotes that make the full project cost clear to facility managers before they commit.
Will hygiene preferences keep towels in some sites?
Hygiene preferences can keep towels in some sites, because infection control policies in clinical areas may favor single-use towels at clinical hand basins. Food outlets and aged care sites may follow similar internal policies. As a result, dryer suppliers lose some volume in healthcare and food preparation areas. Brands respond with filtered air, antibacterial surfaces and independent test data that help them win public washrooms in the same buildings.
New South Wales leads as Queensland grows fastest
| Region | Value, 2025 (USD million) | Share, 2025 | CAGR, 2026–2035 |
|---|---|---|---|
| New South Wales | 15.1 | 40.2% | 7.13% |
| Victoria | 11.2 | 29.9% | 7.13% |
| Queensland | 9.3 | 24.7% | 7.63% |
| Remaining States and Territories | 1.9 | 5.2% | 7.03% |
Why does New South Wales lead dryer demand?
New South Wales held a 40.2% share of 2025 value and grows at 7.13% a year. The state had 8.67 million residents at March 2026, the largest population of any state. Its record AUD 9 billion school building program and the new Western Sydney airport add washroom fit-outs from 2025 to 2027. As a result, the state keeps the largest share of dryer purchases through 2035.
How does Victoria add replacement demand?
Victoria held a 29.9% share of 2025 value and grows at 7.13% a year, because the state added 109,500 residents in the year to March 2026, the largest increase of any state. Its population reached 7.15 million, which supports dense office, retail and education estates in Melbourne and regional cities. ASI JD MacDonald also supplies its Accessible Compliant dryer range from Keysborough. Consequently, Victorian demand comes mainly from replacement and new-build projects in offices, schools and shopping centers.
Why is Queensland the fastest-growing zone?
Queensland held a 24.7% share of 2025 value and grows fastest at 7.63% a year, because venue and facility projects for the 2032 Games add new washrooms. The state population grew 1.6% to 5.74 million in the year to March 2026. In turn, the AUD 7.1 billion venue program, including an estimated AUD 3.785 billion stadium at Victoria Park, adds tender demand for durable, high-speed units in public venues.
What role do the remaining states and territories play?
The remaining states and territories held 5.2% of 2025 value and grow at 7.03% a year. Western Australia grew fastest in population, at 2.1% in the year to March 2026, while South Australia reached 1.92 million residents. As a result, demand here comes from city offices, mines, hospitals and regional venues.
School budgets, Games venues and an airport, 2025–2026
| Development | Status and market relevance |
|---|---|
| In March 2025, the Queensland government unveiled a AUD 7.1 billion venue and infrastructure program for the 2032 Games, including a new stadium at Victoria Park. | Adds tender demand for venue washrooms |
| In June 2025, the New South Wales government announced a record AUD 9 billion for school infrastructure over four years. | Supports education washroom fit-outs |
| In September 2026, the Australian Bureau of Statistics reported a population of 27.9 million at March 2026, up 1.4%. | Sets the base for washroom use |
| In October 2026, Western Sydney International Airport opened to passengers, with capacity for up to 10 million passengers a year. | Adds transport terminal demand |
Sensors, filters and motors reshape washroom drying
- Infrared and time-of-flight sensors start drying without contact, which cuts touch points and stops units running when no hands are present.
- HEPA filtration cleans washroom air before it reaches the hands, which supports use in hospitals, schools and food outlets.
- Brushless motors raise air speed while cutting energy use, which shortens drying times to about 10 seconds.
- Heater-off modes let facility managers trade a little drying speed for much lower annual energy use in mild climates.
Need a Custom Version of This Report?
Tailor the scope, geography, or segments to your exact requirements.
- Custom geography or segment scope
- Direct access to our analyst team
Brands compete on speed, hygiene and service reach
Competition combines global brands, Australian importers and washroom accessory makers. Dyson sells the Airblade 9kJ with HEPA filtration, while Mitsubishi Electric Australia offers Jet Towel Slim and Smart models with antibacterial surfaces and NSF certification. VELO Hand Dryers, a division of the family-owned HPA Group, imports European dryers and serves Sydney, Melbourne, Brisbane, Perth and Adelaide. ASI JD MacDonald supplies an Accessible Compliant range from Victoria, and Metlam sells slimline automatic units through trade suppliers. The wider supplier field covered in this report also includes Excel Dryer, Semak Australia, Mediclinics, Bobrick and STIEBEL ELTRON. Companies compete on drying speed, hygiene features, noise, warranty length, local stock and service reach across states.
Companies profiled and their roles in this market
| Company | Type | Role in the market |
|---|---|---|
| Dyson | Global brand | Airblade 9kJ with HEPA filter, launched in Australia in October 2019 |
| Mitsubishi Electric Australia Pty Ltd | Global brand | Jet Towel Slim and Smart with antibacterial surfaces |
| VELO Hand Dryers | Importer | European dryers; division of HPA Group, Sydney based |
| ASI JD MacDonald | Washroom accessory supplier | Accessible Compliant range; head office in Keysborough |
| Metlam Australia | Washroom accessory supplier | Ecoslender slimline automatic unit with five-year warranty |
Credence Research sees refit cycles setting the pace
Credence Research's view is that Australian demand for washroom drying units will grow steadily through 2035, as aging fleets are replaced and new schools, terminals and venues open. High-speed hands-under units should keep the largest product share, while hands-in jet units gain most from short drying times and filtered air. New South Wales will remain the largest region, although Queensland adds demand fastest. However, upfront cost and noise concerns will reward suppliers that offer mid-range models and clear payback data.
Washroom counts and refit cycles anchor the dryer model
The report uses 2025 as the base year, with values in USD million at current prices. Market values come from the Credence Research model, which combines building stock, washroom counts, replacement cycles and price tiers. Regional shares follow the client data set, while regional growth and segment splits by product type, application, end user and sales channel are Credence Research estimates. Sources used are official statistics, government releases, company product pages and news reports, and no interviews or surveys were used.
Refits and transport builds shape dryer demand to 2035
The market is expected to reach USD 86.4 million by 2035, a 7.25% CAGR during 2026–2035, as replacement cycles and public building programs keep demand rising. Growth should be strongest in hands-in jet units, paper-towel conversion retrofits and Queensland, while New South Wales keeps the largest share. New airports, schools and Games venues will widen tender demand after 2026. In contrast, tight facility budgets or towel preferences in clinical areas could slow upgrades in some buildings.
Frequently Asked Questions
How big is the Australia hand dryer market?
Which region leads dryer demand?
Which region grows fastest?
Which product type holds the largest share?
Why are buyers replacing older units?
Which product type grows fastest?
Who are the leading companies in this market?
What are the main risks to growth?
Table of Content
Chapter 1 Market Segmentation
- 1.1 Segmentation Framework
- 1.1.1 Product and Service Classification
- 1.1.2 Application and End-Use Classification
- 1.1.3 Technology and Solution Classification
- 1.1.4 Customer and Distribution Channel Classification
- 1.1.5 Geographic Segmentation
- 1.1.6 Market Segment Definitions and Boundaries
- 1.2 By Product Type
- 1.2.1 Warm-Air Dryers
- 1.2.2 High-Speed Hands-Under Dryers
- 1.2.3 Hands-In Jet Dryers
- 1.3 By Application
- 1.3.1 Replacement Installations
- 1.3.2 New-Build Installations
- 1.3.3 Paper-Towel Conversion Retrofits
- 1.4 By End User
- 1.4.1 Commercial Property and Foodservice
- 1.4.2 Education
- 1.4.3 Government and Healthcare
- 1.4.4 Hospitality and Event Venues
- 1.4.5 Transport Facilities
- 1.5 By Sales Channel
- 1.5.1 Distributor and Trade Sales
- 1.5.2 Direct OEM Sales
- 1.5.3 Online Equipment Sales
- 1.5.4 Procurement and Tender Sales
Chapter 2 Introduction
- 2.1 Report Objectives and Scope
- 2.2 Product Definition and Industry Terminology
- 2.3 Market Inclusions and Exclusions
- 2.4 Research Process
- 2.4.1 Primary Research and Expert Interviews
- 2.4.2 Secondary Research and Source Review
- 2.4.3 Top-Down and Bottom-Up Estimation
- 2.4.4 Data Triangulation and Verification
- 2.5 Market Size Measurement Basis
- 2.5.1 2025: USD 37.5 million → 2035: USD 86.4 million
- 2.6 Historical and Forecast Reference Periods
- 2.6.1 Historical Period: 2018-2025
- 2.6.2 Base Year: 2025
- 2.6.3 Forecast Period: 2025-2035
- 2.7 Research Assumptions and Limitations
Chapter 3 Executive Summary
- 3.1 Market Snapshot and Key Findings
- 3.2 Base-Year Market Size, 2025
- 3.3 Forecast Market Size, 2035
- 3.4 Revenue and Volume Growth Outlook
- 3.5 Key Demand and Supply Indicators
- 3.6 Leading Market Segments
- 3.7 Fastest-Growing Market Opportunities
- 3.8 Regional Performance Highlights
- 3.9 Technology and Industry Transformation
- 3.10 Competitive Landscape Summary
- 3.11 Analyst View and Strategic Implications
Chapter 4 Australia Hand Dryer Market Trends and Developments
- 4.1 Historical Industry Development, 2018-2025
- 4.2 Recent Market Trends and Developments
- 4.3 Demand and Customer Behavior Trends
- 4.4 Technology and Product Innovation
- 4.5 Artificial Intelligence, Automation and Digitalization
- 4.6 Local Manufacturing and Supply Chain Realignment
- 4.7 Industry Partnerships, Mergers and Acquisitions
- 4.8 Sustainability and Circular Economy Developments
- 4.9 Government and Private Sector Investment Trends
- 4.10 Emerging Business Models and Commercialization
- 4.11 Industry Developments and Announcements
Chapter 5 Australia Hand Dryer Market Production, Supply and Demand Analysis
- 5.1 Demand Trend and Consumption Analysis, 2018-2025
- 5.2 Demand Forecast, 2025-2035
- 5.3 Production and Output Trend, 2018-2025
- 5.4 Production and Output Forecast, 2025-2035
- 5.5 Installed Capacity and Capacity Utilization
- 5.6 Company-Wise Production Plants and Statistics
- 5.6.1 Installed Production Capacity
- 5.6.2 Actual Production
- 5.6.3 Planned Capacity and Expansion Targets
- 5.7 Supply Chain Structure and Procurement Trends
- 5.8 Supply-Demand Gap and Bottlenecks
- 5.9 Import Dependence and Sourcing Structure
- 5.10 Contract Manufacturing and Outsourcing
- 5.11 Regional Supply and Demand Concentration
Chapter 6 Australia Hand Dryer Market Pricing Analysis
- 6.1 Pricing Structure and Measurement
- 6.2 Historical Pricing Trends, 2018-2025
- 6.3 Pricing Outlook, 2025-2035
- 6.4 Average Selling Price and Unit Economics
- 6.5 Pricing by Product and Market Segment
- 6.6 Geographic Pricing Differences
- 6.7 Key Input, Energy, Labor and Logistics Costs
- 6.8 Contract Pricing and Purchasing Models
- 6.9 Pricing Sensitivity and Competitive Positioning
- 6.10 Price, Margin and Profitability Implications
Chapter 7 Australia Hand Dryer Market Dynamics
- 7.1 Market Growth Drivers
- 7.1.1 Demand-Side Drivers
- 7.1.2 Technology and Innovation Drivers
- 7.1.3 Infrastructure and Investment Drivers
- 7.1.4 Regulatory and Policy Drivers
- 7.2 Market Restraints
- 7.2.1 Cost and Affordability Constraints
- 7.2.2 Technology and Adoption Barriers
- 7.2.3 Supply Chain and Operational Constraints
- 7.3 Market Challenges
- 7.3.1 Competitive Pressure and Margin Erosion
- 7.3.2 Skills, Infrastructure and Implementation Gaps
- 7.4 Emerging Market Opportunities
- 7.5 Market Dynamics Impact and Time-Horizon Assessment
Chapter 8 Australia Hand Dryer Value Chain Analysis
- 8.1 Industry Value Chain Overview
- 8.2 Upstream Suppliers and Critical Inputs
- 8.3 Technology and Component Providers
- 8.4 Manufacturing or Service Delivery
- 8.5 Distribution, Channel Partners and Integrators
- 8.6 Downstream Applications and End Users
- 8.7 Value Addition and Profit Pools
- 8.8 Vertical Integration and Outsourcing
- 8.9 Supplier Concentration and Risk
- 8.10 Supply Chain Localization and Resilience
Chapter 9 Australia Hand Dryer Market Regulations and Policies
- 9.1 Relevant Laws, Standards and Compliance Frameworks
- 9.2 Product, Service, Safety and Quality Requirements
- 9.3 Government Policies, Incentives and Subsidies
- 9.4 Imports, Exports and Trade Barriers
- 9.5 Public Procurement and Local Content Requirements
- 9.6 Environmental and Sustainability Compliance
- 9.7 Upcoming Policy Changes and Market Implications
Chapter 10 Australia Hand Dryer Market Hotspots and Opportunities
- 10.1 Market Opportunity Mapping and Growth Hotspots
- 10.2 High-Growth Applications and Customer Groups
- 10.3 Underserved Markets and White-Space Opportunities
- 10.4 Emerging Technology and Product Opportunities
- 10.5 New Capacity and Investment Hotspots
- 10.6 Market Entry and Expansion Opportunities
- 10.7 Distribution and Partnership Opportunities
- 10.8 Near-Term and Long-Term Commercial Potential
- 10.9 Opportunity Attractiveness and Execution Risks
Chapter 11 Australia Hand Dryer Market Outlook, 2025-2035
- 11.1 Market Size and Analysis
- 11.1.1 Revenue (Market Measurement: 2025: USD 37.5 million → 2035: USD 86.4 million)
- 11.1.2 Market Volume and Quantity Sold
- 11.1.3 Historical Market Size, 2018-2025
- 11.1.4 Base-Year Market Size, 2025
- 11.2 Market Forecast, 2025-2035
- 11.2.1 Revenue Forecast to 2035
- 11.2.2 Volume Forecast to 2035
- 11.2.3 CAGR and Year-on-Year Growth
- 11.2.4 Incremental Revenue Opportunity
- 11.3 Forecast Assumptions and Scenario Analysis
- 11.3.1 Base-Case Forecast
- 11.3.2 Optimistic and Conservative Scenarios
- 11.3.3 Technology, Pricing and Policy Sensitivities
- 11.4 Market Attractiveness and Growth Outlook
Chapter 12 Australia Hand Dryer Market Segmentation and Outlook
- 12.1 Segmentation Summary and Market Shares, 2025
- 12.2 Largest and Fastest-Growing Segments
- 12.3 By Product Type - Market Size and Forecast, 2025-2035
- 12.3.1 Segment Definition and Scope
- 12.3.2 Historical Market Size, 2018-2025
- 12.3.3 Revenue Forecast, 2025-2035
- 12.3.4 Volume Forecast, 2025-2035
- 12.3.5 Base-Year Market Share, 2025
- 12.3.6 Segment CAGR and Growth Drivers
- 12.3.7 Subsegment Market Size and Forecast
- 12.3.7.1 Warm-Air Dryers
- 12.3.7.2 High-Speed Hands-Under Dryers
- 12.3.7.3 Hands-In Jet Dryers
- 12.3.8 Subsegment Pricing and Adoption Trends
- 12.3.9 Leading Suppliers and Competition
- 12.3.10 Regional Demand and Opportunities
- 12.4 By Application - Market Size and Forecast, 2025-2035
- 12.4.1 Segment Definition and Scope
- 12.4.2 Historical Market Size, 2018-2025
- 12.4.3 Revenue Forecast, 2025-2035
- 12.4.4 Volume Forecast, 2025-2035
- 12.4.5 Base-Year Market Share, 2025
- 12.4.6 Segment CAGR and Growth Drivers
- 12.4.7 Subsegment Market Size and Forecast
- 12.4.7.1 Replacement Installations
- 12.4.7.2 New-Build Installations
- 12.4.7.3 Paper-Towel Conversion Retrofits
- 12.4.8 Subsegment Pricing and Adoption Trends
- 12.4.9 Leading Suppliers and Competition
- 12.4.10 Regional Demand and Opportunities
- 12.5 By End User - Market Size and Forecast, 2025-2035
- 12.5.1 Segment Definition and Scope
- 12.5.2 Historical Market Size, 2018-2025
- 12.5.3 Revenue Forecast, 2025-2035
- 12.5.4 Volume Forecast, 2025-2035
- 12.5.5 Base-Year Market Share, 2025
- 12.5.6 Segment CAGR and Growth Drivers
- 12.5.7 Subsegment Market Size and Forecast
- 12.5.7.1 Commercial Property and Foodservice
- 12.5.7.2 Education
- 12.5.7.3 Government and Healthcare
- 12.5.7.4 Hospitality and Event Venues
- 12.5.7.5 Transport Facilities
- 12.5.8 Subsegment Pricing and Adoption Trends
- 12.5.9 Leading Suppliers and Competition
- 12.5.10 Regional Demand and Opportunities
- 12.6 By Sales Channel - Market Size and Forecast, 2025-2035
- 12.6.1 Segment Definition and Scope
- 12.6.2 Historical Market Size, 2018-2025
- 12.6.3 Revenue Forecast, 2025-2035
- 12.6.4 Volume Forecast, 2025-2035
- 12.6.5 Base-Year Market Share, 2025
- 12.6.6 Segment CAGR and Growth Drivers
- 12.6.7 Subsegment Market Size and Forecast
- 12.6.7.1 Distributor and Trade Sales
- 12.6.7.2 Direct OEM Sales
- 12.6.7.3 Online Equipment Sales
- 12.6.7.4 Procurement and Tender Sales
- 12.6.8 Subsegment Pricing and Adoption Trends
- 12.6.9 Leading Suppliers and Competition
- 12.6.10 Regional Demand and Opportunities
- 12.7 Segment Growth Comparison
- 12.8 Segment Attractiveness and Priority Matrix
Chapter 13 Australia Hand Dryer End-Use and Application Market Outlook
- 13.1 End-Use Industry and Customer Demand Structure
- 13.2 Leading Applications and Customer Groups
- 13.3 End-Use Market Size, Share and Forecast
- 13.4 Major End-Use Industry Deep Dives
- 13.4.1 Customer Requirements and Use Cases
- 13.4.2 Demand and Replacement Cycles
- 13.4.3 Technical and Regulatory Considerations
- 13.4.4 Purchasing and Procurement Models
- 13.4.5 Leading Vendors and Distribution Channels
- 13.4.6 Forecast and Commercial Opportunities
- 13.5 Emerging Applications and Cross-Segment Demand
- 13.6 End-Use Industry Investment Priorities
Chapter 14 Australia Hand Dryer Geographic Market Outlook, 2025-2035
- 14.1 Domestic Market Distribution and Demand Clusters
- 14.2 State- or Province-Wise Market Size and Forecast, 2025-2035
- 14.3 City and Metropolitan Market Outlook
- 14.4 Industrial, Manufacturing and Commercial Clusters
- 14.5 Geographic Concentration of Key End Users
- 14.6 Local Pricing and Purchasing Differences
- 14.7 Domestic Production Facilities and Capacity Map
- 14.8 Local Infrastructure and Project Pipeline
- 14.9 State-Level Policy and Incentive Differences
- 14.10 Subnational Investment Hotspots and Opportunities
- 14.11 Distribution and Logistics Networks
- 14.12 Domestic Competitive Footprint
Chapter 15 Australia Hand Dryer Technology, Innovation and Sustainability Outlook
- 15.1 Technology Landscape and Maturity
- 15.2 Product, Process and Service Innovation
- 15.3 AI, Automation and Digital Tools in the Industry
- 15.4 Technology Adoption and Performance Benchmarking
- 15.5 Innovation Pipeline and R&D Investment
- 15.6 Patent and Intellectual Property Trends
- 15.7 Energy Efficiency and Resource Management
- 15.8 Sustainability, Recycling and Circularity
- 15.9 Technology Roadmap, 2025-2035
- 15.10 Risks of Obsolescence and Technology Substitution
Chapter 16 Australia Hand Dryer Market Key Strategic Imperatives
- 16.1 Growth and Market Entry Priorities
- 16.2 High-Return Products and Segments
- 16.3 Pricing, Profitability and Cost Optimization
- 16.4 Technology Investment and Product Differentiation
- 16.5 Supply Chain Localization and Resilience
- 16.6 Distribution and Customer Acquisition
- 16.7 Partnership, Acquisition and Capacity Strategy
- 16.8 Regional Expansion Priorities
- 16.9 Short-, Medium- and Long-Term Actions
Chapter 17 Competition Outlook
- 17.1 Industry Competition Characteristics
- 17.2 Market Structure and Concentration
- 17.3 Market Share and Competitive Positioning, 2025
- 17.4 Company-Wise Revenue and Product Benchmarking
- 17.5 Production and Service Capacity Benchmarking
- 17.6 Technology, Pricing and Differentiation
- 17.7 Regional Footprint and Distribution Strength
- 17.8 Mergers, Acquisitions and Strategic Alliances
- 17.9 New Entrants and Competitive Threats
- 17.10 Porter's Five Forces and Industry Attractiveness
- 17.11 Competitive Outlook, 2025-2035
Chapter 18 Company Profiles
- 18.1 Company Coverage and Selection Criteria
- 18.2 Dyson
- 18.2.1 Business Description
- 18.2.2 Company Ownership and Geographic Presence
- 18.2.3 Product and Service Portfolio
- 18.2.4 Manufacturing and Operating Footprint
- 18.2.5 Production Capacity and Expansion Plans
- 18.2.6 Financial Performance and Investment
- 18.2.7 Market Share and Competitive Position
- 18.2.8 Technology and Innovation Capabilities
- 18.2.9 Strategic Alliances or Partnerships
- 18.2.10 Recent Developments
- 18.2.11 Growth Strategy and Outlook
- 18.3 Mitsubishi Electric Australia Pty Ltd
- 18.4 Excel Dryer
- 18.5 VELO Hand Dryers
- 18.6 Semak Australia
- 18.7 Mediclinics
- 18.8 Bobrick
- 18.9 ASI JD MacDonald
- 18.10 STIEBEL ELTRON
- 18.11 Metlam Australia
- 18.12 Other Relevant Market Participants
Note: Every listed company is profiled on the structure shown under the first company. The company list is preliminary and may change based on research findings, market developments, data availability and client requirements.
Chapter 19 Disclaimer
- 19.1 Research and Forecast Disclaimer
- 19.2 Data Source and Estimation Limitations
Note: The depth of individual sections depends on data availability for this market. Volume, capacity, trade and other unit-based metrics are included where applicable.

