
New homes and hybrid work reshape furnishing demand
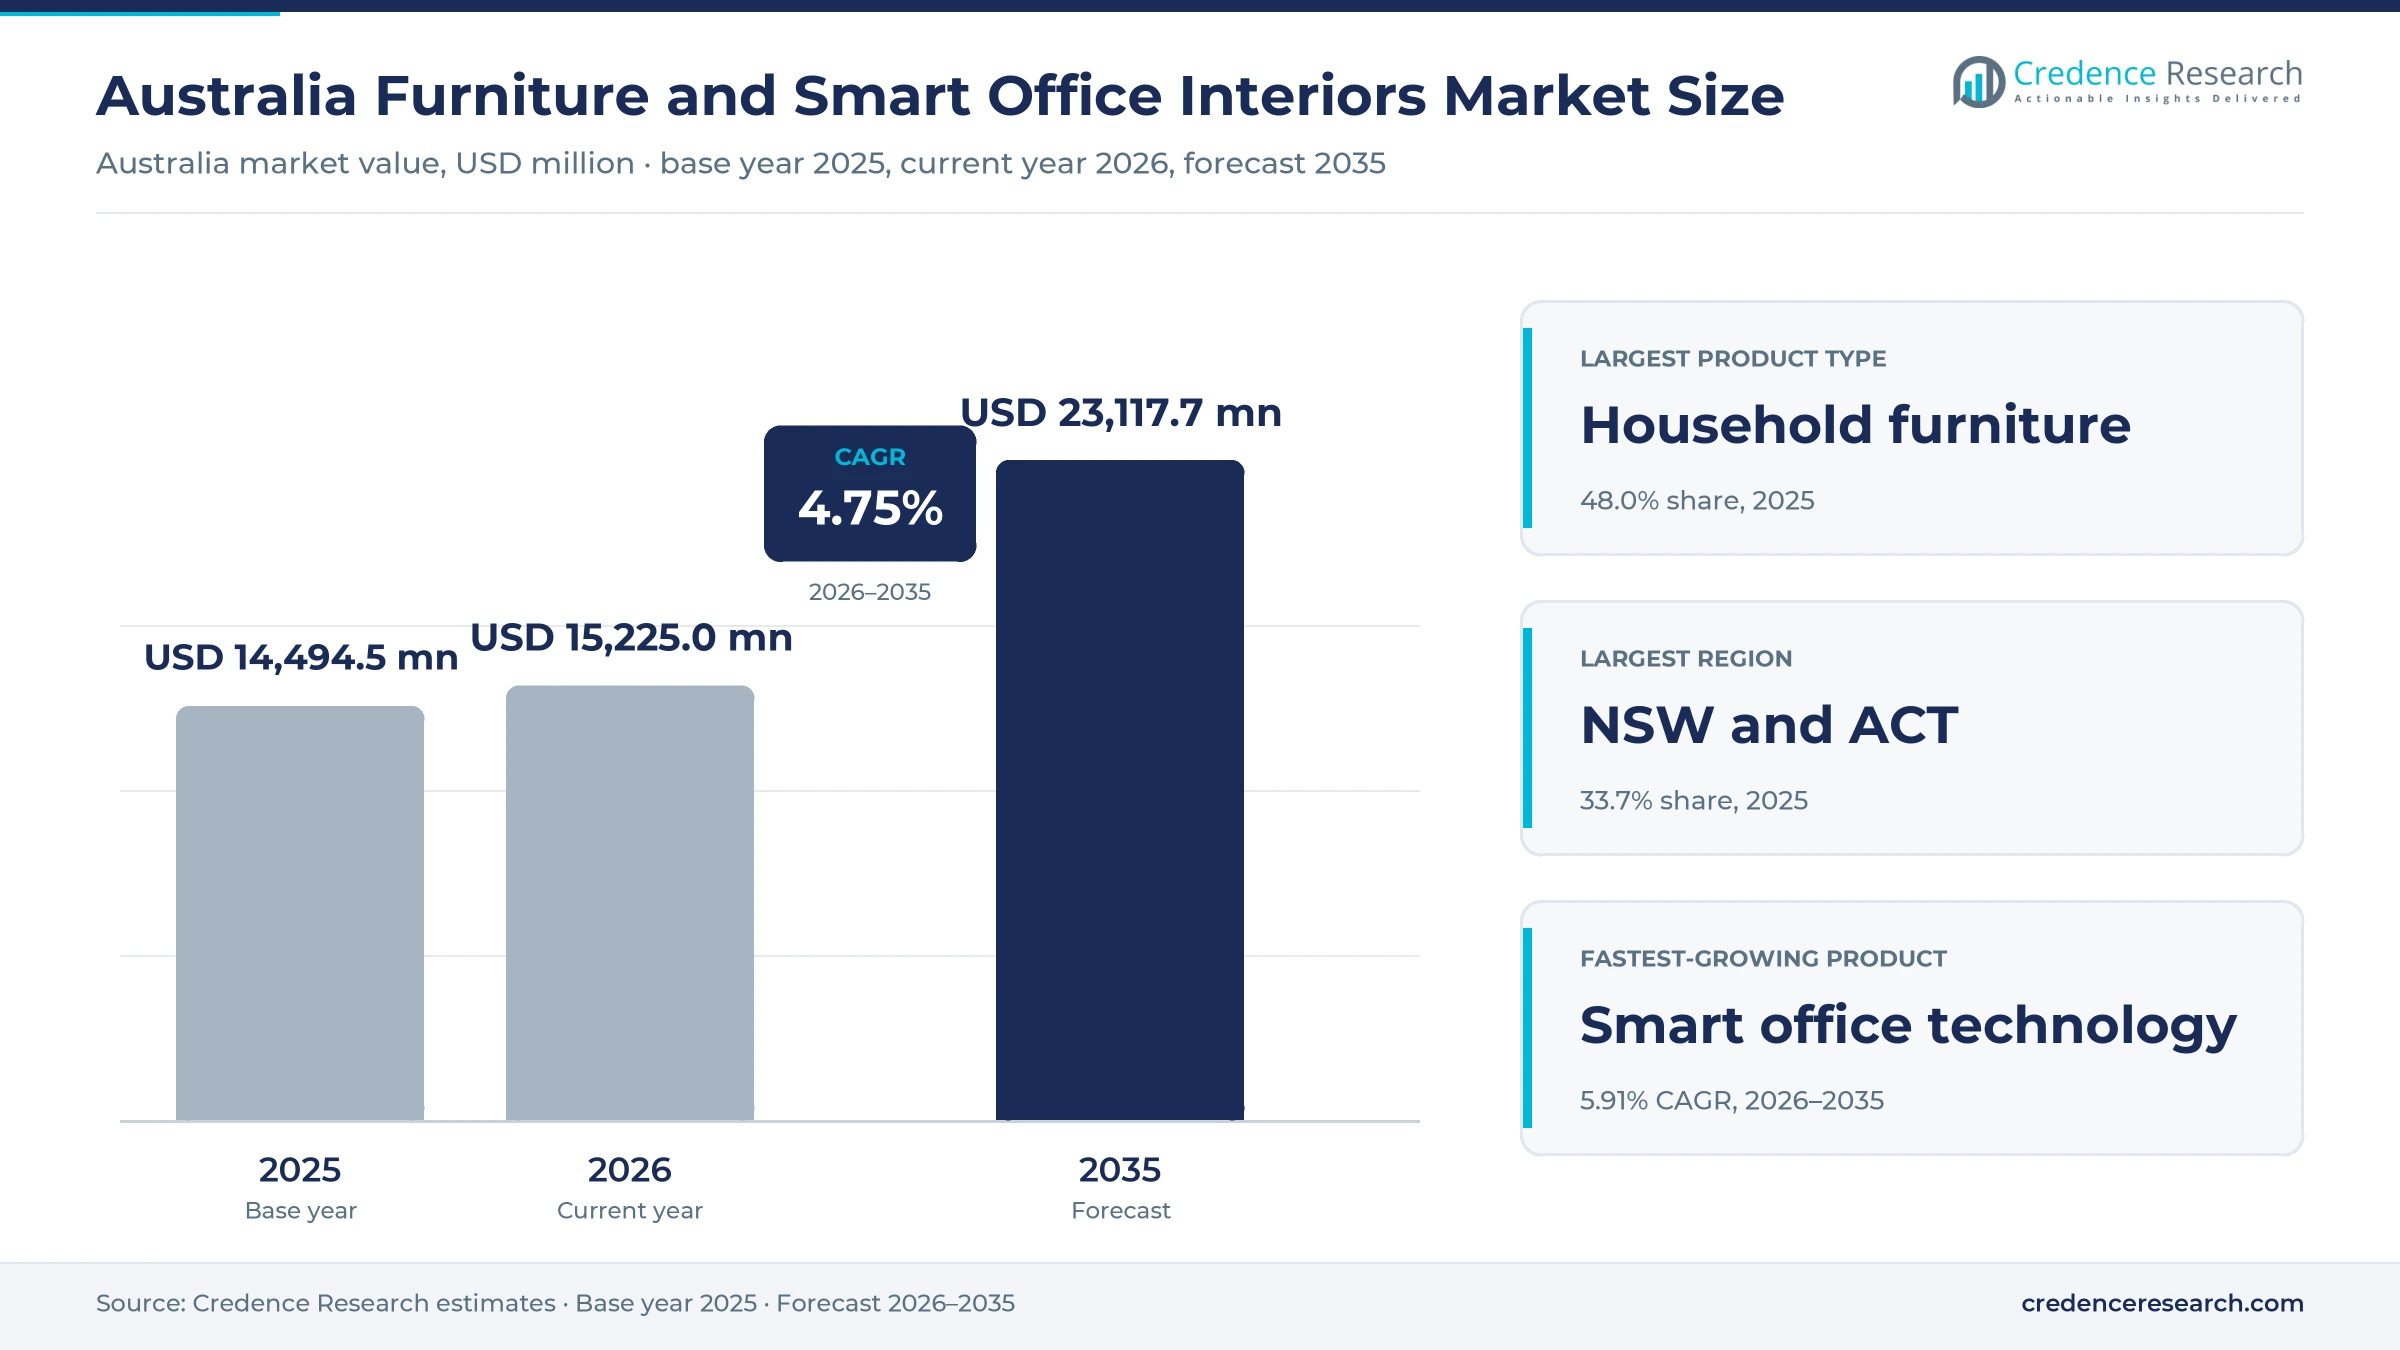
The Australia furniture and smart office interiors market was valued at USD 14.49 billion in 2025 and is projected to increase from USD 15.22 billion in 2026 to USD 23.12 billion by 2035, registering a CAGR of 4.75% during 2026–2035. Demand comes from households furnishing new and existing homes, and from employers that refit offices for hybrid work with flexible desks, meeting booths and connected hardware. New South Wales and the Australian Capital Territory held the largest regional share, 33.7% in 2025, because the zone has the largest population and the biggest office market. Queensland is the fastest-growing zone at 4.98% a year, as population growth and strong office demand in Brisbane lift purchases. Work rules also changed in 2026, when Victoria introduced a bill that gives eligible employees the right to work from home two days a week.
Do sofas, sit-stand desks and booking software all count here?
The estimate measures the value of household furniture, commercial furniture, smart office technology and interior products, and homewares and soft furnishings sold in Australia. Values are stated at the retail and project prices that households, companies, public institutions, hotels and flexible workspace operators pay.
The estimate excludes building construction, fixed joinery installed by builders, and consumer electronics such as televisions and phones. The value chain runs from local and overseas makers through importers, showrooms, general retailers, online stores and project contractors to homes, offices and hospitality venues.
Australia Furniture and Smart Office Interiors Market Insights
- The Australia furniture and smart office interiors market was valued at USD 14.49 billion in 2025 and is projected to reach USD 23.12 billion by 2035, registering a CAGR of 4.75% during 2026–2035.
- New South Wales and the Australian Capital Territory held a 33.7% share of 2025 value, because the zone has the largest population and office stock.
- Household furniture led with a 48.0% share of 2025 value, because sofas, beds, dining sets and storage make up most home purchases.
- About 219,000 new homes were completed from June 2024 to September 2025, which equals 18% of the national 1.2 million home target.
- Amart Furniture acquired Freedom Furniture in June 2025, which created a group with 126 stores across Australia and New Zealand.
Household pieces lead as connected workspaces grow fastest
Why does household furniture lead product demand?
Based on product type, the market is categorized into household furniture, commercial furniture, smart office technology and interiors, and homewares and soft furnishings. Household Furniture led with a 48.0% share of 2025 value, because sofas, beds and dining sets make up most home spending. Smart Office Technology and Interiors grows fastest at 5.91% a year, as employers add connected desks and meeting rooms.
How does replacement purchasing dominate use?
Based on application, the market is categorized into new-space furnishing, replacement purchasing, space reconfiguration and technology retrofitting. Replacement Purchasing led with 45.0% of 2025 value, because most households replace worn pieces rather than furnish new homes. Technology Retrofitting grows fastest at 5.66% a year, as offices add sensors, screens and booking systems to existing floors.
Why do households account for most spending?
Based on end user, the market is categorized into households, corporate offices, public-service institutions and hospitality and flexible workspaces. Households led with 66.0% of 2025 value, because home furniture and homewares reach nearly every dwelling. Hospitality and Flexible Workspaces grow fastest at 5.34% a year, as coworking and hotel operators refit spaces more often. Corporate offices remain the second-largest buyer group, because large employers refit floors when leases end.
How do specialty showrooms reach buyers?
Based on distribution channel, the market is categorized into specialty showroom retail, general merchandise retail, e-commerce and direct project sales. Specialty Showroom Retail led with 40.0% of 2025 value, because shoppers still want to test sofas and beds in person. E-Commerce grows fastest at 5.89% a year, as online stores widen ranges and delivery options.
| Segment Group | Leading Sub-segment | Share, 2025 | Fastest-growing Sub-segment | CAGR, 2026–2035 |
|---|---|---|---|---|
| By Product Type | Household Furniture | 48.0% | Smart Office Technology and Interiors | 5.91% |
| By Application | Replacement Purchasing | 45.0% | Technology Retrofitting | 5.66% |
| By End User | Households | 66.0% | Hospitality and Flexible Workspaces | 5.34% |
| By Distribution Channel | Specialty Showroom Retail | 40.0% | E-Commerce | 5.89% |
Request a Free Sample
Fill in your details and we'll send you a free sample report.
- Sample data tables & charts
- Research methodology
Housing, workspace change and online buying lift demand
How does housing formation lift furnishing demand?
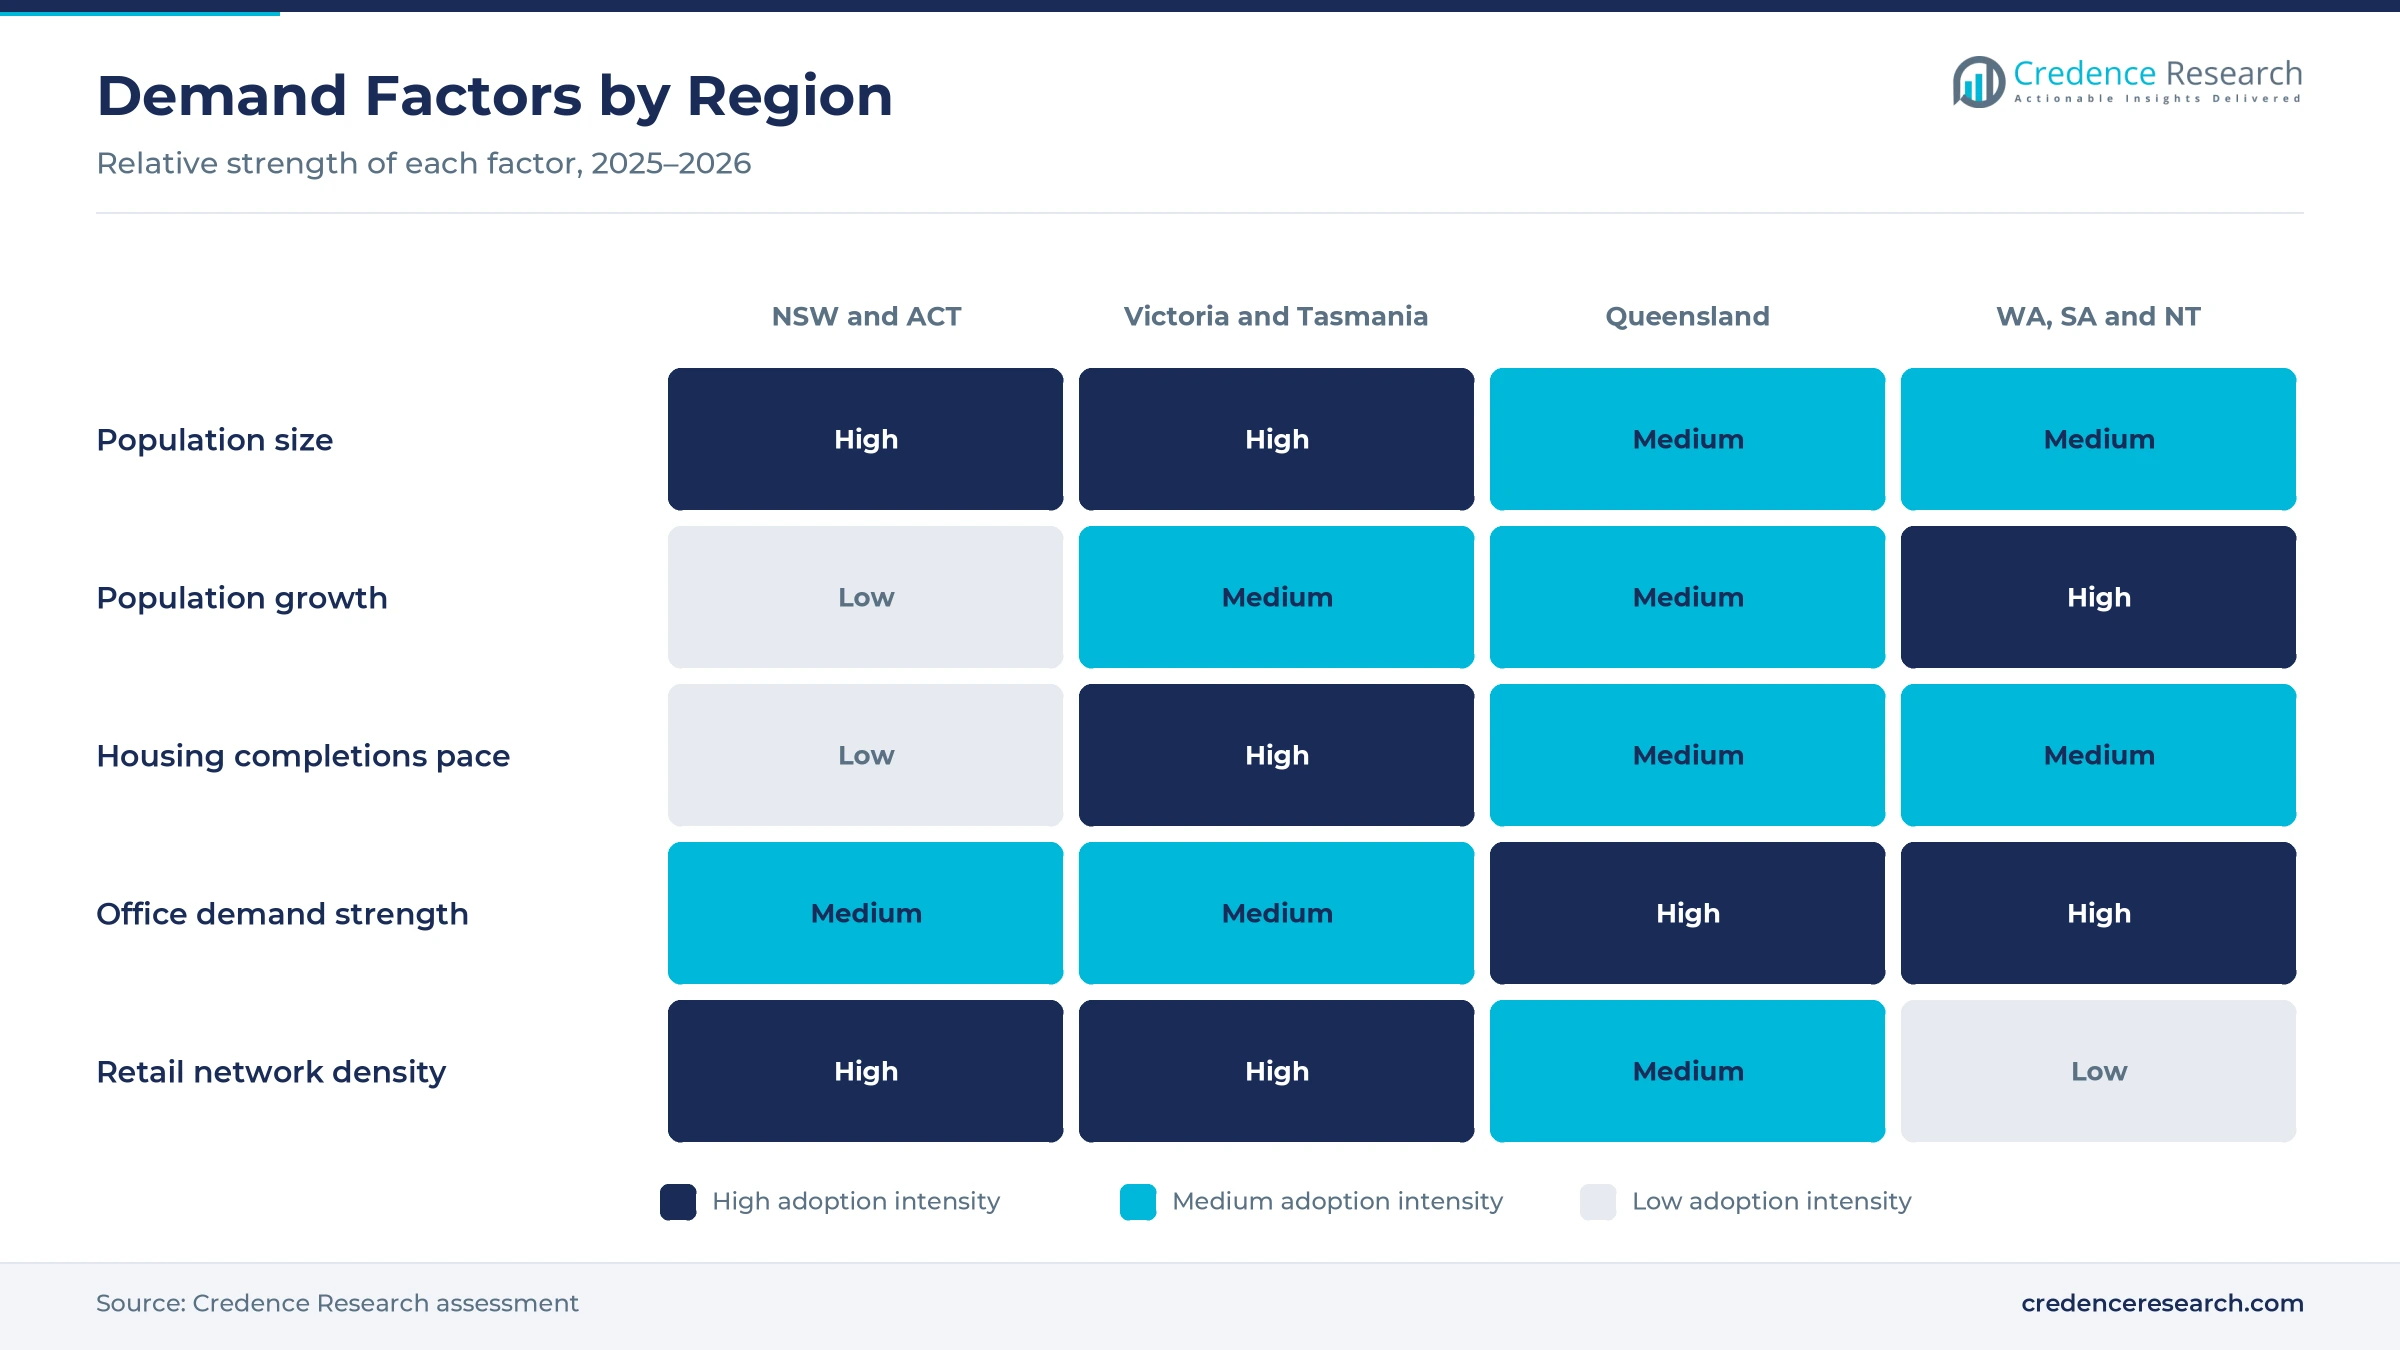
Housing formation lifts furnishing demand, because every new dwelling needs beds, sofas, dining sets and storage. About 219,000 new homes were completed over the five quarters from June 2024 to September 2025, according to the National Housing Supply and Affordability Council. That total equals 18% of the national target of 1.2 million homes by June 2029, while quarterly approvals are up 17% since the Accord began. Australia's population also rose 1.4% to about 27.9 million in the year to March 2026, according to the Australian Bureau of Statistics. As a result, households hold 66.0% of 2025 value, and new-space furnishing grows faster than replacement purchasing.
Why does workspace reconfiguration lift commercial spending?
Workspace reconfiguration lifts commercial spending, because employers redesign floors for hybrid work with fewer fixed desks and more meeting space. National office vacancy rose from 15.2% to 15.9% over the six months to January 2026, according to the Property Council of Australia, as new high-quality buildings reached completion. Sydney CBD vacancy held at 13.8% over the same period, while Brisbane recorded the strongest CBD performance. About 37% of Australians regularly worked from home in August 2023, which keeps hybrid layouts in demand. In turn, space reconfiguration grows faster than replacement purchasing, as tenants moving to new buildings order workplace fit-out packages.
How does digital purchasing widen access to furniture?
Digital purchasing widens access, because online stores show large ranges and deliver bulky items to homes across the country. Temple & Webster reached about 1.3 million active customers in fiscal 2026, up 5%, and repeat customers made up 62% of its orders, according to Rask Media. The retailer's share of the furniture and homewares market rose from 2.7% to 2.9% over the year. About 9.8 million households shopped online in 2025, and home and garden purchases reached A$11.4 billion. As a result, e-commerce grows at 5.89% a year, the fastest channel rate, as social commerce adds new ways to discover products.
Why does urban density favor compact and smart products?
Urban density favors compact and smart products, because apartment buyers need storage, modular pieces and powered furniture that fit small rooms. Urban residents made up about 87.7% of the population in 2025, according to World Bank data, which concentrates demand in large cities. Harvey Norman runs 195 franchised complexes across Australia through 549 independent franchisees, which places furniture next to technology in most regions. Amart Furniture operated 66 large-format stores in June 2025, with plans to expand toward 100 stores. In turn, smart office technology and interiors grow at 5.91% a year, as buyers add powered desks and devices linked to connected homes.
Store growth, mergers and home work rules reshape sales
How is the rise of regional showrooms changing store networks?
The rise of regional showrooms is changing store networks, because retailers follow population growth outside the state capitals. Nick Scali opened four stores in fiscal 2026, a Nick Scali store in Ballarat and three Plush stores in Bendigo, Tuggerah and Cannington. It then opened two more Nick Scali stores in Bendigo and Bunbury in July 2026 and plans four more openings in Australia and New Zealand. Harvey Norman plans to open one new franchised complex and relocate four others in fiscal 2027, with three moving to newly built freehold sites. Western Australia also grew 2.1% in the year to March 2026, which draws chains toward Perth and regional centers in the west. As a result, specialty showroom retail keeps the largest channel share of 2025 value, at 40.0%, as shoppers still test sofas in person.
Why is the shift toward consolidation reshaping competition?
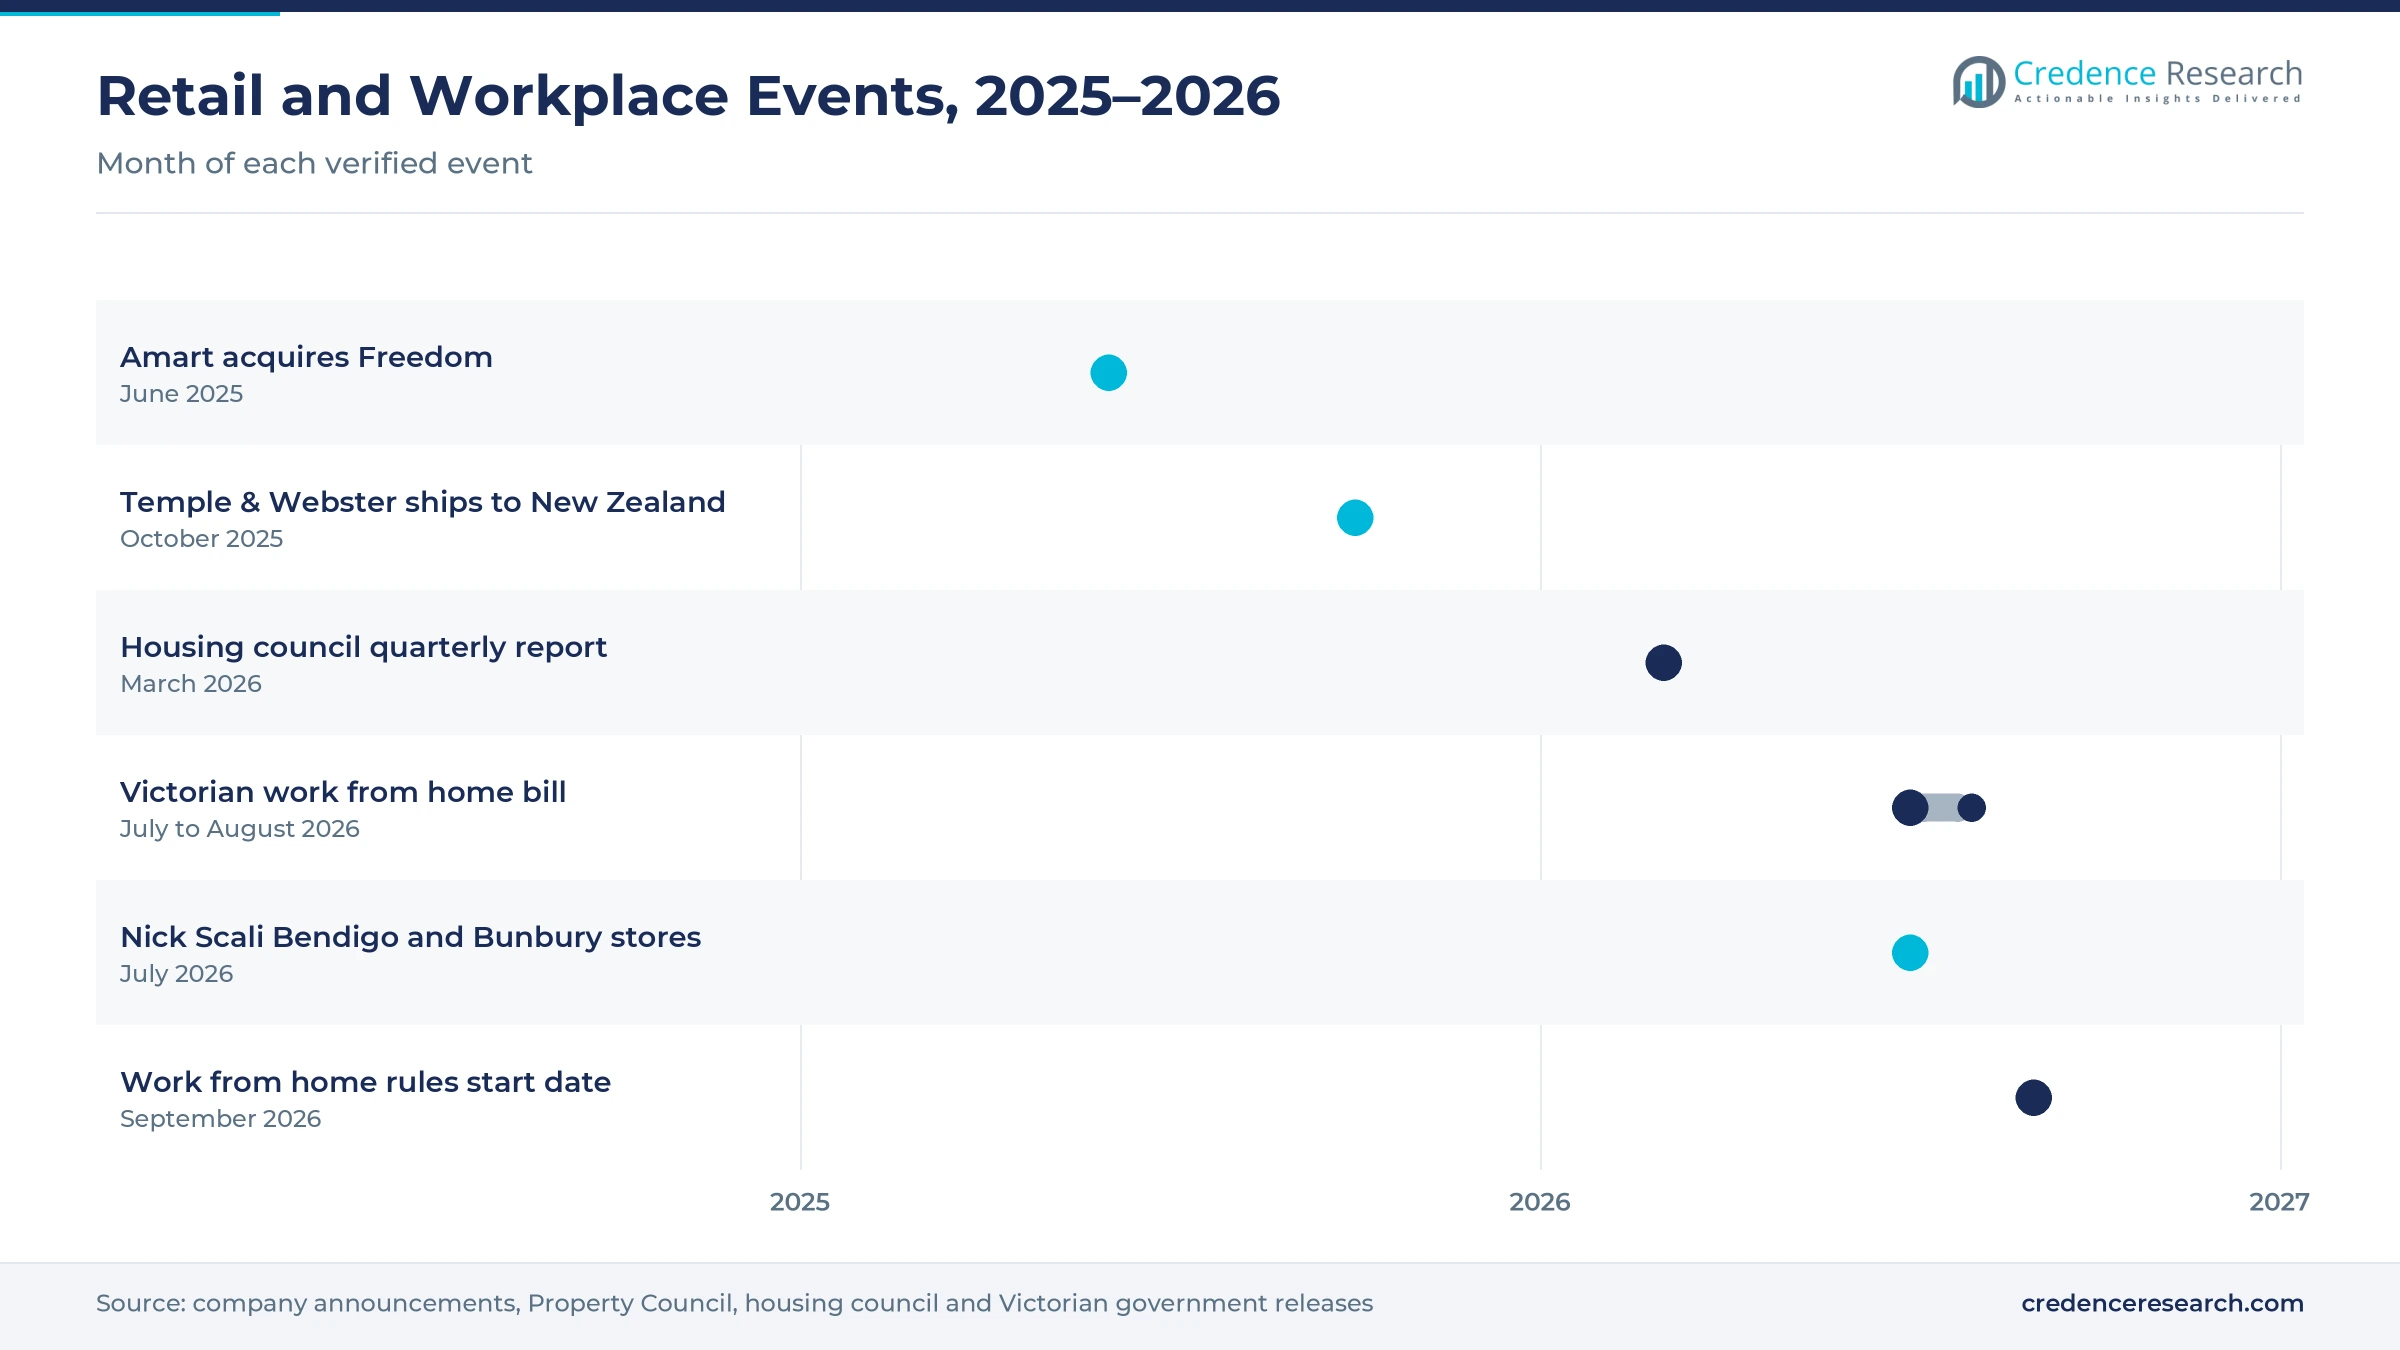
The shift toward consolidation is reshaping competition, because larger groups can buy, store and deliver bulky goods at lower cost. Amart Furniture acquired Freedom Furniture in June 2025, creating a group with 126 stores across Australia and New Zealand. Freedom brought 60 stores and six distribution centers, while the combined group employs more than 2,200 staff. Both brands plan to expand toward 100 stores each, and a listing on the ASX was discussed for the following year. In turn, household furniture keeps a 48.0% share of 2025 value, as the largest chains widen ranges for sofas, beds and dining sets.
Can home work rules open demand for home office equipment?
Home work rules open demand for home office equipment, because employers may need to pay for essential equipment used at home. Victoria introduced a bill on July 16, 2026, that gives eligible full-time employees the right to work from home two days a week. The bill passed the lower house by August 2026, and its rules would apply from Sept. 1, 2026, with small employers following on July 1, 2027. About 37% of Australians already worked from home regularly in August 2023. As a result, Victoria and Tasmania hold 24.6% of 2025 value, and desks and chairs gain demand there.
Is there room to grow through connected workspace retrofits?
Connected workspace retrofits leave room to grow, because tenants in older buildings add sensors, screens and booking systems instead of moving. National office vacancy rose 0.7 percentage points over the six months to January 2026, which pushes landlords to upgrade floors to keep tenants. Brisbane and Perth showed the strongest office demand in the country, according to the same report. Harvey Norman also noted growing adoption of AI-enabled devices in fiscal 2026, and it had 2 store refits in progress with 4 more planned over the following 12 months. In turn, technology retrofitting grows at 5.66% a year, the fastest application rate, as employers link furniture, lighting and meeting rooms to workspace software.
Weak building output and office vacancy slow purchasing
How does slow home building limit new furnishing demand?
Slow home building limits new furnishing demand, because completions trail the national target. The housing council expects the 1.2 million home target to be reached only in June 2030, a year late. New South Wales has built only 15% of its share so far. As a result, fewer new homes need complete furniture packages each year. Retailers respond by targeting replacement buyers, renters and home improvement shoppers with flexible ranges.
Why does office vacancy delay commercial fit-outs?
Office vacancy delays commercial fit-outs, because companies with spare floor space have less reason to buy new furniture. National vacancy rose to 15.9% in January 2026, which leaves many tenants with unused desks. In turn, corporate buyers often reuse existing furniture when they reconfigure floors. Suppliers respond with rental, refurbishment and modular systems that cost less than full replacement. Landlords also fund some upgrades to attract and keep tenants in older buildings.
How do delivery costs squeeze online margins?
Delivery costs squeeze online margins, because bulky furniture needs two-person delivery, storage space and careful handling. Remote and regional orders cost more to deliver, especially in Western Australia and the Northern Territory. As a result, online retailers raise prices or set delivery fees that deter some buyers. Retailers respond with click and collect, shared warehouses and flat-packed ranges. Larger groups spread these costs across more stores and orders.
Why do import dependence and currency swings raise prices?
Import dependence and currency swings raise prices, because many sofas, chairs and smart devices are made overseas. A weaker Australian dollar lifts landed costs for retailers that buy in U.S. dollars. In turn, retailers must raise prices or accept thinner margins during weak spending periods. Suppliers respond by hedging currency exposure and sourcing from several countries. Local makers of bespoke and commercial furniture gain some orders as a result.
Sydney and canberra lead as Queensland grows fastest
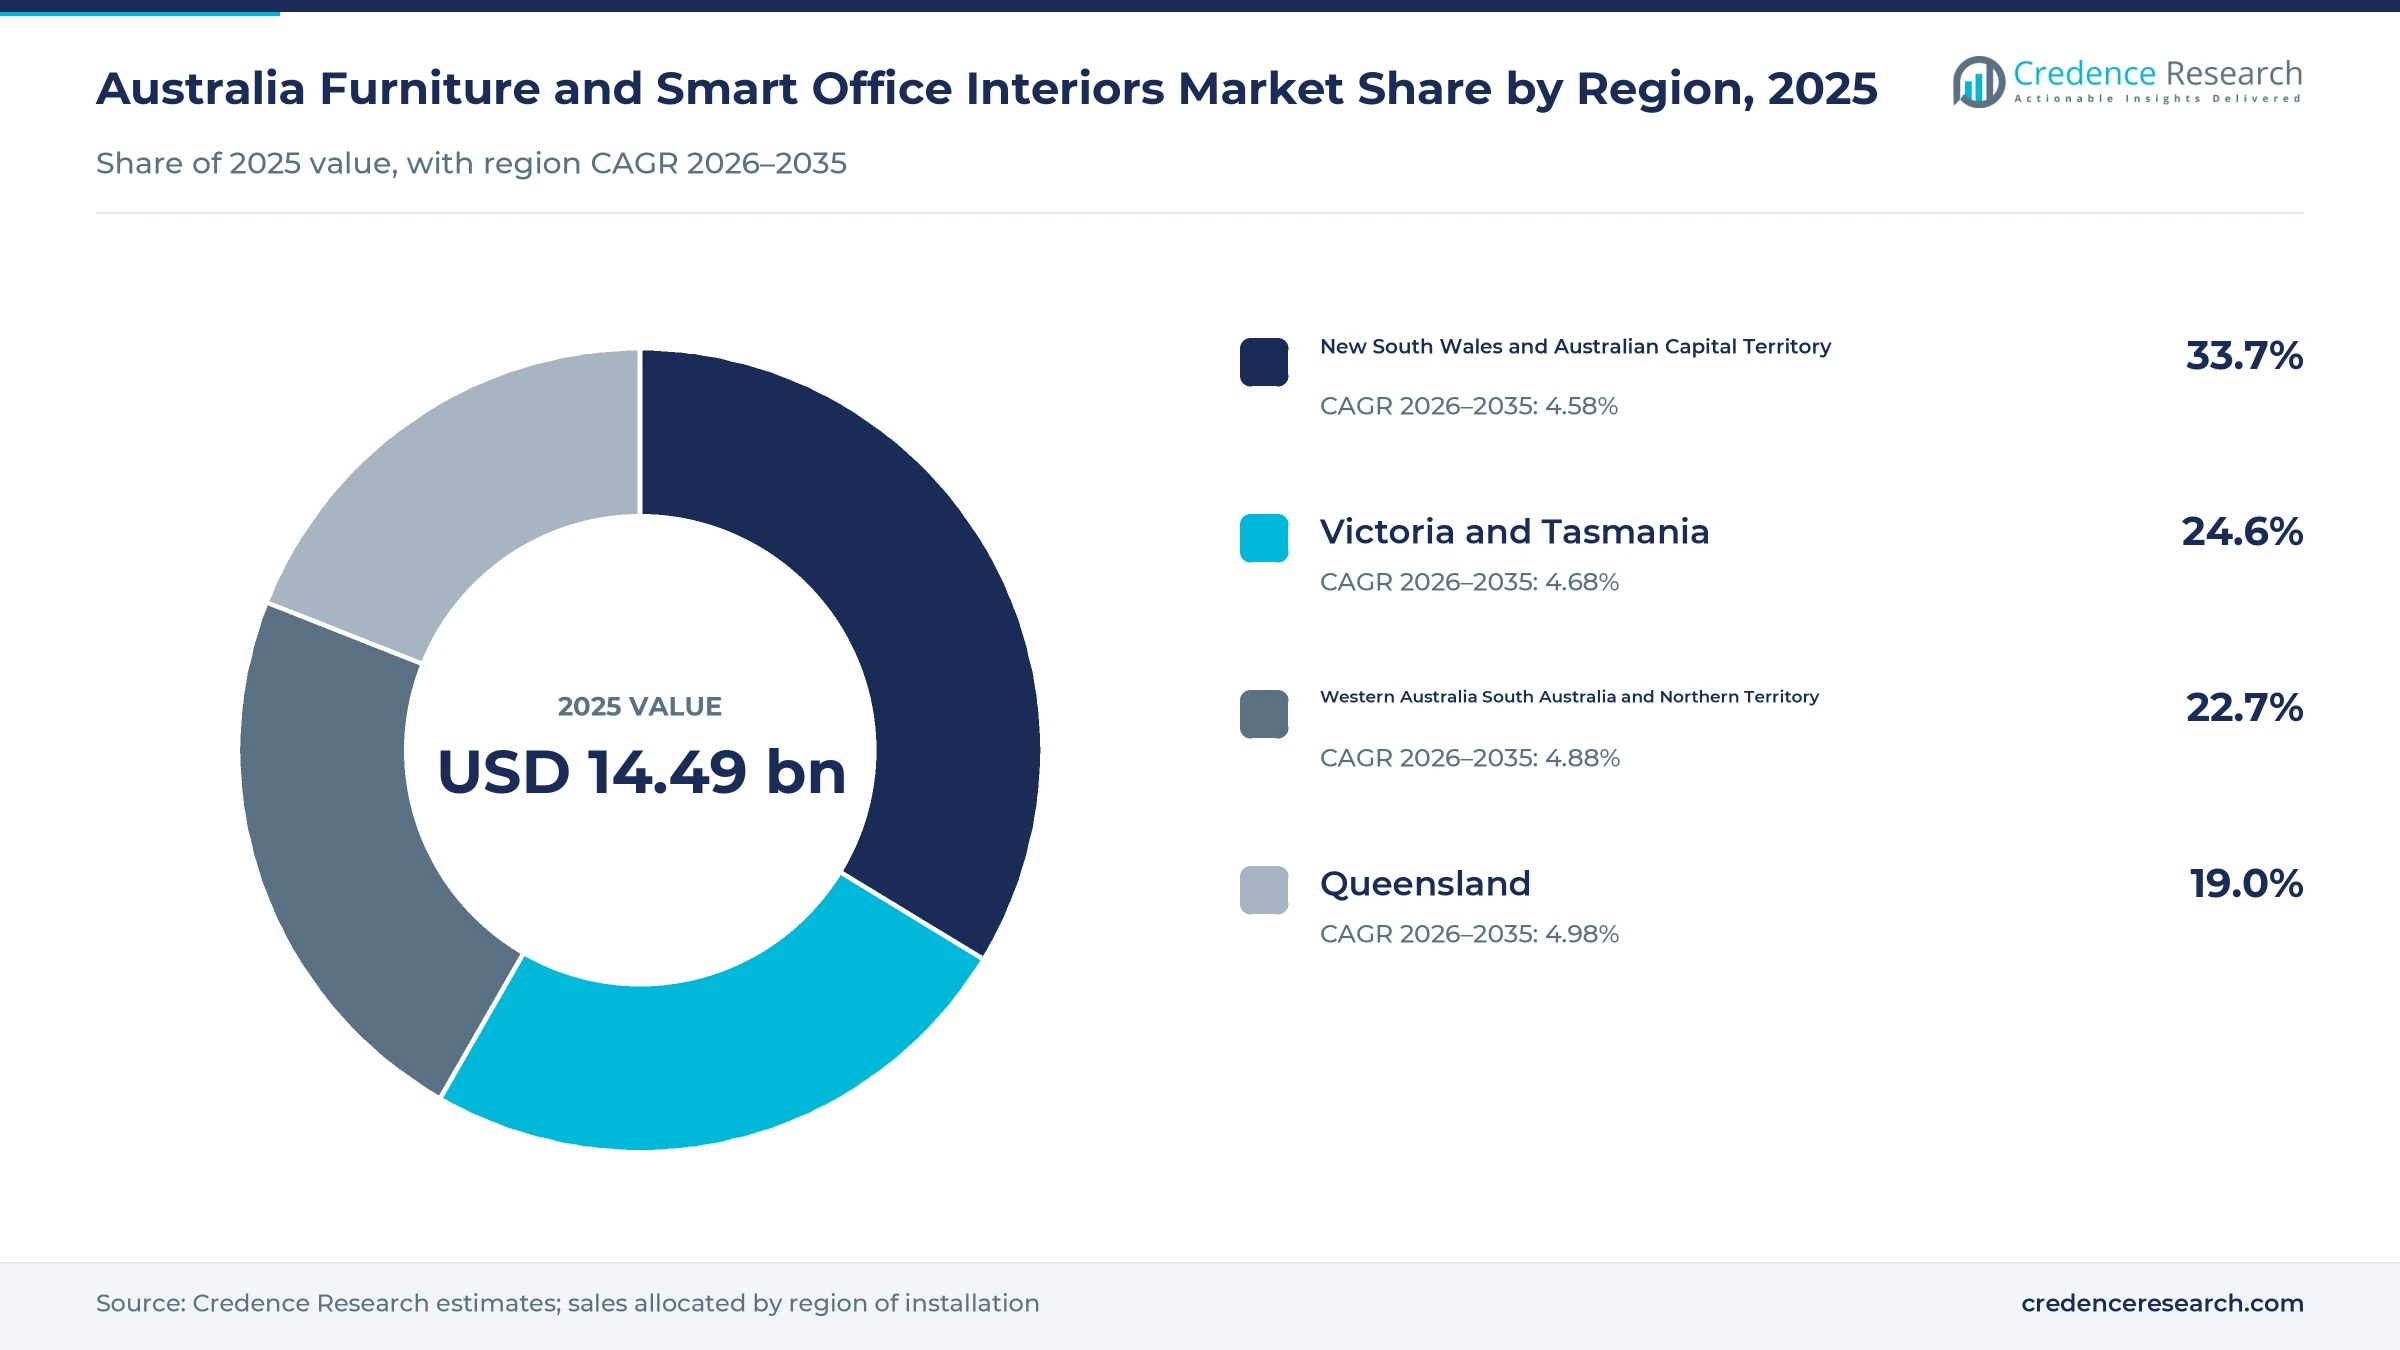
| Region | Value, 2025 (USD billion) | Share, 2025 | CAGR, 2026–2035 |
|---|---|---|---|
| New South Wales and Australian Capital Territory | 4.88 | 33.7% | 4.58% |
| Victoria and Tasmania | 3.57 | 24.6% | 4.68% |
| Western Australia South Australia and Northern Territory | 3.29 | 22.7% | 4.88% |
| Queensland | 2.75 | 19.0% | 4.98% |
Why does the NSW and ACT zone buy the most furniture?
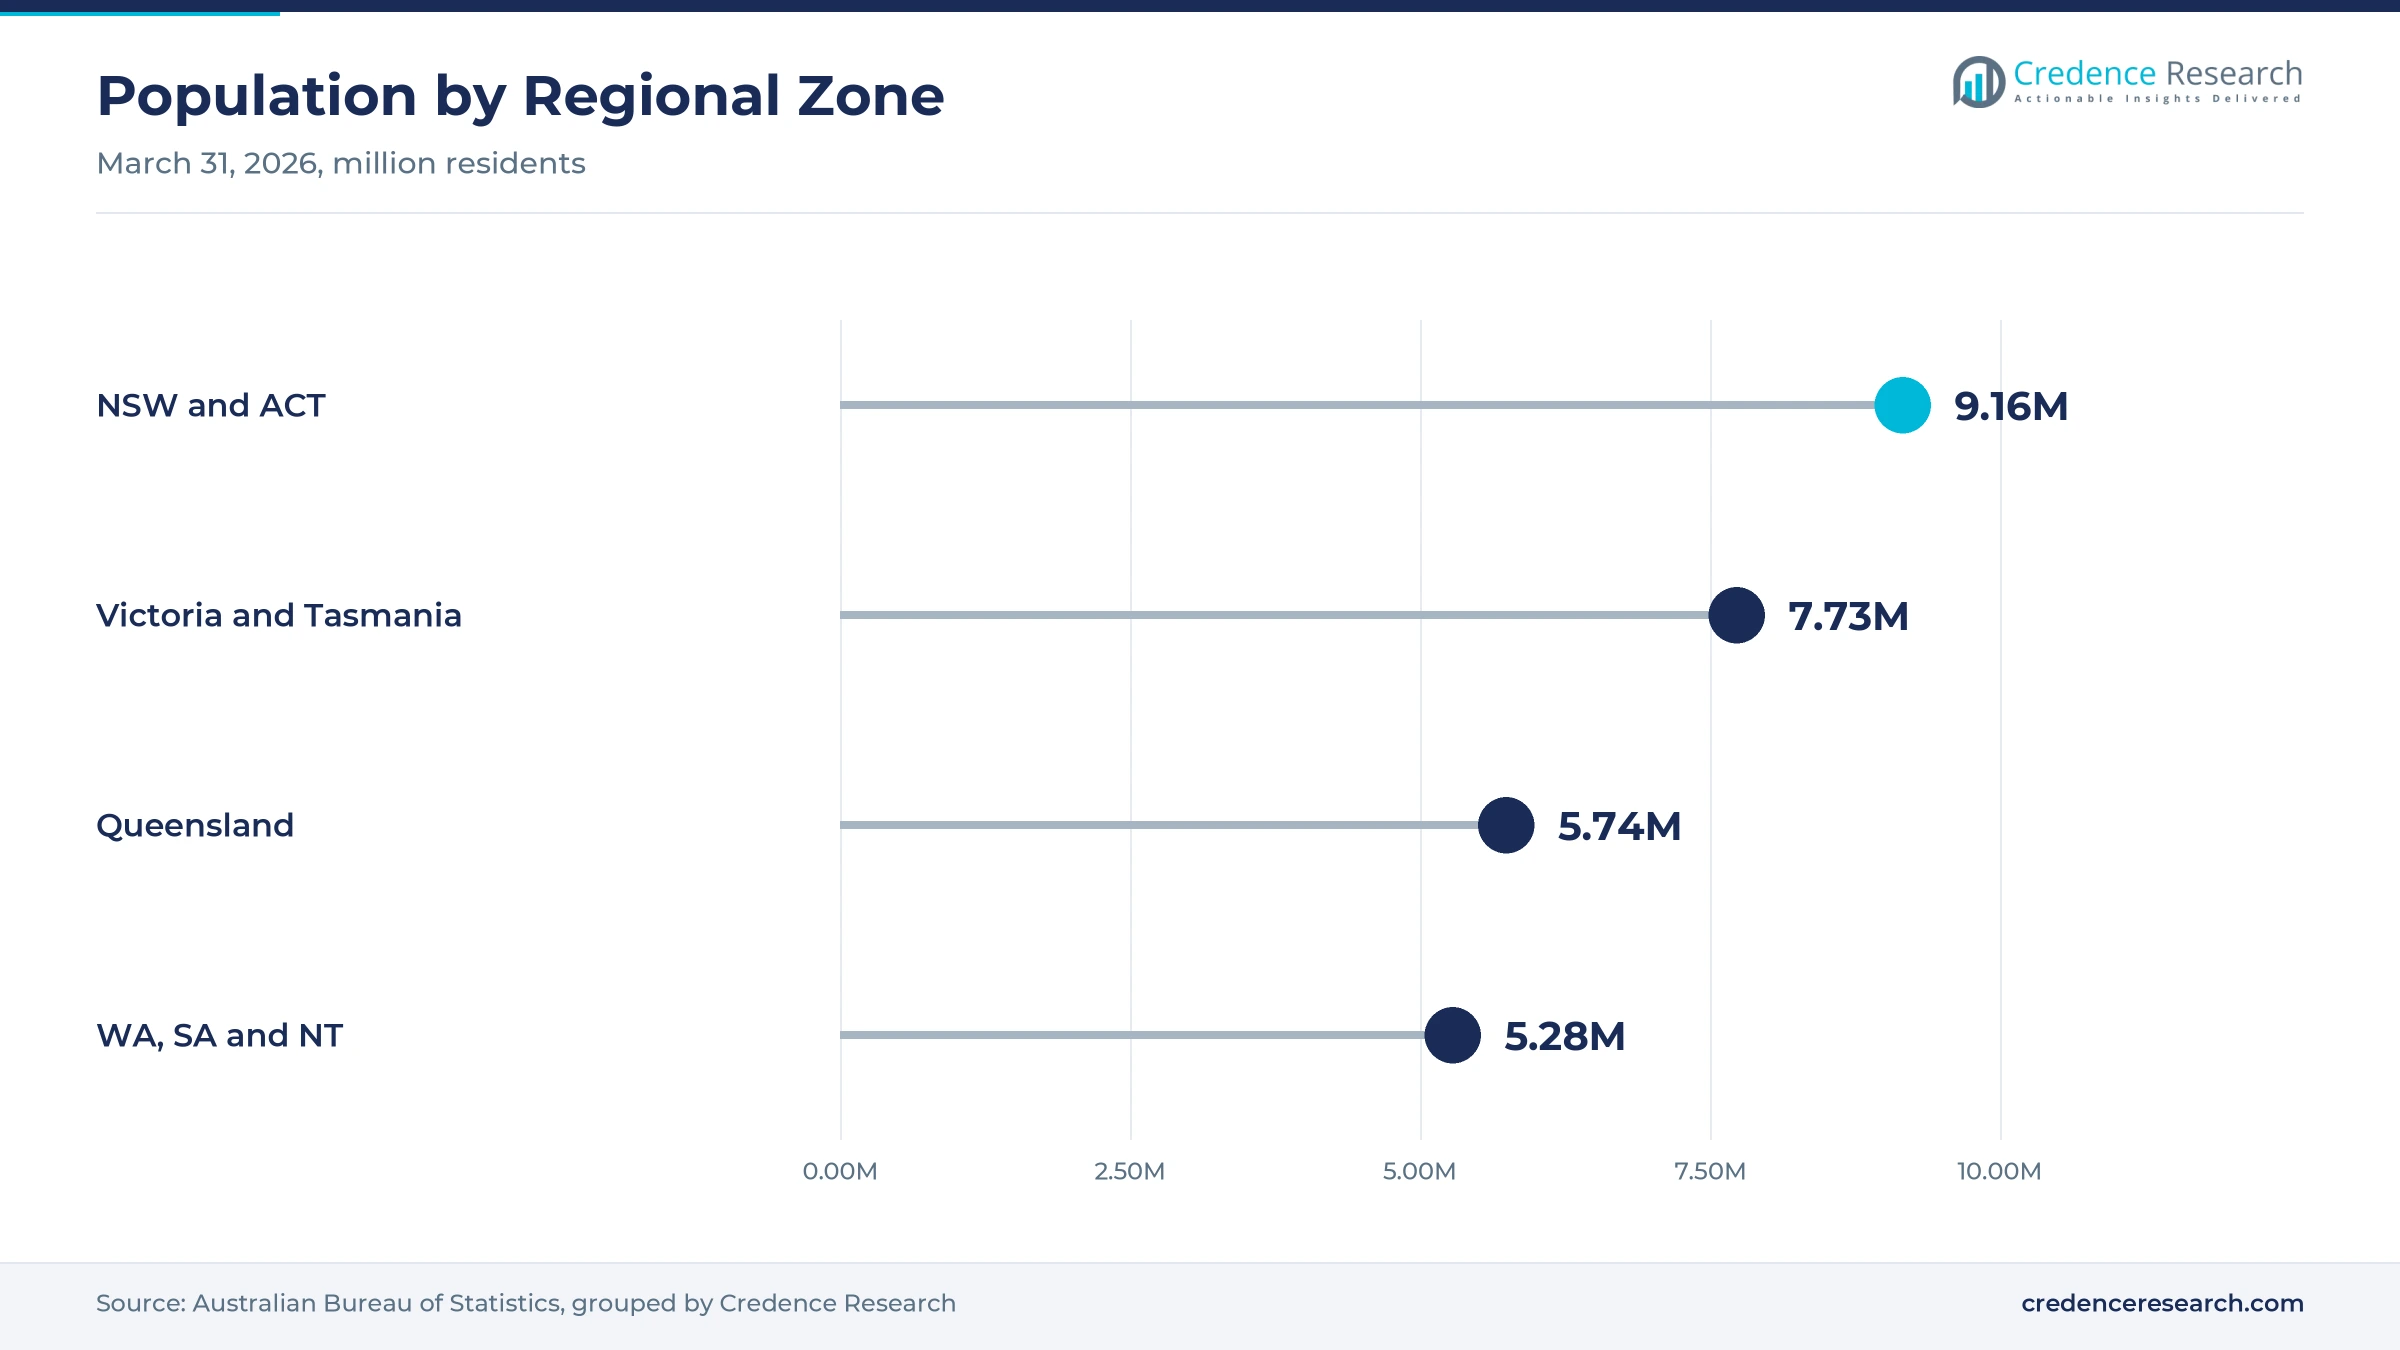
New South Wales and the Australian Capital Territory held 33.7% of 2025 value and grow at 4.58% a year, because the zone has the largest population and office market. New South Wales had about 8.67 million residents at March 31, 2026. Sydney CBD office vacancy held at 13.8% in January 2026, which supports steady fit-out demand. However, the state had built only 15% of its housing target share.
How do Melbourne and hobart sustain home and office demand?
Victoria and Tasmania held 24.6% of 2025 value and grow at 4.68% a year, because Melbourne has a large housing pipeline and many office tenants. Victoria added about 109,500 residents in the year to March 2026, the largest increase of any state. The state had also built 23% of its housing target share, ahead of the national pace. As a result, home office demand may rise as the work from home bill advances.
Why is Queensland the fastest-growing furnishing zone?
Queensland held 19.0% of 2025 value and grows fastest at 4.98% a year, because population growth and office demand in Brisbane lift purchases. The state had about 5.74 million residents at March 31, 2026, after adding about 90,100 people over the year. Brisbane recorded the strongest CBD office performance in the country, which supports new fit-outs and furniture orders across the city.
How do Perth, adelaide and darwin add furniture demand?
Western Australia, South Australia and the Northern Territory held 22.7% of 2025 value and grow at 4.88% a year, because Perth combines fast population growth with strong office demand. Western Australia grew 2.1% in the year to March 2026, the fastest state rate. Nick Scali opened stores in Cannington and Bunbury, which widens showroom access in the west.
Retail deals and work rules marked 2025 and 2026
| Development | Status and market relevance |
|---|---|
| In June 2025, Amart Furniture acquired Freedom Furniture, creating a group with 126 stores in Australia and New Zealand. | Consolidated large-format furniture retail |
| In October 2025, Temple & Webster began shipping orders to New Zealand. | Extended the online retailer beyond Australia |
| In July 2026, Nick Scali opened new stores in Bendigo and Bunbury. | Widened regional showroom coverage |
| In July 2026, Victoria introduced a bill giving eligible employees the right to work from home two days a week. | Could lift home office equipment demand |
| In August 2026, the Property Council reported national office vacancy of 15.9% for January 2026. | Signals continued office reconfiguration |
Powered desks, sensors and booking software shape interiors
- Non-powered products include most sofas, beds, tables and storage, which remain the largest part of household spending in every region.
- Powered standalone products include sit-stand desks, recliners and adjustable beds, which add motors and controls without network links.
- Connected workspace hardware adds occupancy sensors, room screens and smart lockers, which help employers measure how floors are used.
- Workspace software and services run desk booking, room scheduling and space analytics, which guide reconfiguration decisions in large offices and flexible workspaces.
Need a Custom Version of This Report?
Tailor the scope, geography, or segments to your exact requirements.
- Custom geography or segment scope
- Direct access to our analyst team
Large retail networks and online specialists compete
Competition centers on large retail networks and online specialists that reach households across the country. Harvey Norman runs 195 franchised complexes through 549 independent franchisees and sells furniture alongside technology. IKEA has a presence in every state except Tasmania and opened a small plan and order point at Highpoint in Melbourne in 2022. Amart Furniture acquired Freedom Furniture in June 2025, creating a group with 126 stores. Temple & Webster reached about 1.3 million active customers in fiscal 2026 and began shipping to New Zealand in October 2025. Nick Scali opened new regional stores under its own and Plush brands in 2026. Rivals compete on range, price, delivery speed, showroom access and finance offers. Commercial suppliers also compete on project management and connected workspace systems for corporate tenants.
Companies profiled and their roles in this market
| Company | Type | Role in the market |
|---|---|---|
| Harvey Norman | Franchised retail network | Runs 195 franchised complexes across Australia |
| IKEA Australia | Global home furnishing retailer | Operates large stores and a plan and order point in Melbourne |
| Amart Furniture | Large-format furniture retailer | Acquired Freedom Furniture in June 2025 |
| Temple & Webster | Online furniture retailer | Reached about 1.3 million active customers in fiscal 2026 |
| Nick Scali | Specialty furniture retailer | Opened regional Nick Scali and Plush stores in 2026 |
Credence Research view on Australian furnishing demand
Credence Research's view is that Australian furniture and interior demand will grow steadily because new homes, hybrid work and online buying keep households and employers spending. Household furniture keeps the largest share, while connected workspace products gain ground fastest. Slow home building and high office vacancy will hold back some spending in the near term. However, work from home rules and building upgrades should lift demand for home office equipment and retrofits. Retailers with national store networks, strong online ranges and reliable delivery should gain share fastest through 2035.
Housing, office and retail data anchor the model
The report uses 2025 as the base year on a calendar basis, and market values come from the Credence Research model. That model combines housing completion and approval data, office vacancy reports, population statistics, World Bank urbanization data, online shopping statistics and retailer announcements. Segment splits and regional growth rates are Credence Research estimates, while regional shares follow the client-defined split. Sources used are public reports, official statistics, government releases, trade press and company announcements, and no interviews or surveys were used.
Housing supply and hybrid work carry demand to 2035
Furniture and interior sales are expected to reach USD 23.12 billion by 2035, a 4.75% CAGR during 2026–2035, as housing supply, hybrid work and online buying keep demand rising. Growth should firm through 2027 as more homes are completed and employers settle their office layouts. After that, connected workspace systems and online ranges will set the pace of change. A sharp fall in home building would lower this outlook, while faster housing delivery would raise it. Smart office products and e-commerce are expected to gain the most share over the period.
Frequently Asked Questions
How big is the Australia furniture and smart office interiors market?
Which product type leads furniture demand in Australia?
Which region leads the Australia furniture and smart office interiors market?
Why do households account for most spending?
How is housing supply affecting furniture demand?
Which distribution channel grows fastest?
Who are the leading furniture retailers in Australia?
What are the main challenges for furniture suppliers?
Table of Content
Chapter 1 Market Segmentation
- 1.1 Segmentation Framework
- 1.1.1 Product and Service Classification
- 1.1.2 Application and End-Use Classification
- 1.1.3 Technology and Solution Classification
- 1.1.4 Customer and Distribution Channel Classification
- 1.1.5 Geographic Segmentation
- 1.1.6 Market Segment Definitions and Boundaries
- 1.2 By Product Type
- 1.2.1 Household Furniture
- 1.2.2 Commercial Furniture
- 1.2.3 Smart Office Technology and Interiors
- 1.2.4 Homewares and Soft Furnishings
- 1.3 By Application
- 1.3.1 New-Space Furnishing
- 1.3.2 Replacement Purchasing
- 1.3.3 Space Reconfiguration
- 1.3.4 Technology Retrofitting
- 1.4 By End User
- 1.4.1 Households
- 1.4.2 Corporate Offices
- 1.4.3 Public-Service Institutions
- 1.4.4 Hospitality and Flexible Workspaces
Chapter 2 Introduction
- 2.1 Report Objectives and Scope
- 2.2 Product Definition and Industry Terminology
- 2.3 Market Inclusions and Exclusions
- 2.4 Research Process
- 2.4.1 Primary Research and Expert Interviews
- 2.4.2 Secondary Research and Source Review
- 2.4.3 Top-Down and Bottom-Up Estimation
- 2.4.4 Data Triangulation and Verification
- 2.5 Market Size Measurement Basis
- 2.5.1 2025: USD 14.49 billion → 2035: USD 23.12 billion
- 2.6 Historical and Forecast Reference Periods
- 2.6.1 Historical Period: 2018-2025
- 2.6.2 Base Year: 2025
- 2.6.3 Forecast Period: 2025-2035
- 2.7 Research Assumptions and Limitations
Chapter 3 Executive Summary
- 3.1 Market Snapshot and Key Findings
- 3.2 Base-Year Market Size, 2025
- 3.3 Forecast Market Size, 2035
- 3.4 Revenue and Volume Growth Outlook
- 3.5 Key Demand and Supply Indicators
- 3.6 Leading Market Segments
- 3.7 Fastest-Growing Market Opportunities
- 3.8 Regional Performance Highlights
- 3.9 Technology and Industry Transformation
- 3.10 Competitive Landscape Summary
- 3.11 Analyst View and Strategic Implications
Chapter 4 Australia Furniture and Smart Office Interiors Market Trends and Developments
- 4.1 Historical Industry Development, 2018-2025
- 4.2 Recent Market Trends and Developments
- 4.3 Demand and Customer Behavior Trends
- 4.4 Technology and Product Innovation
- 4.5 Artificial Intelligence, Automation and Digitalization
- 4.6 Local Manufacturing and Supply Chain Realignment
- 4.7 Industry Partnerships, Mergers and Acquisitions
- 4.8 Sustainability and Circular Economy Developments
- 4.9 Government and Private Sector Investment Trends
- 4.10 Emerging Business Models and Commercialization
- 4.11 Industry Developments and Announcements
Chapter 5 Australia Furniture and Smart Office Interiors Market Production, Supply and Demand Analysis
- 5.1 Demand Trend and Consumption Analysis, 2018-2025
- 5.2 Demand Forecast, 2025-2035
- 5.3 Production and Output Trend, 2018-2025
- 5.4 Production and Output Forecast, 2025-2035
- 5.5 Installed Capacity and Capacity Utilization
- 5.6 Company-Wise Production Plants and Statistics
- 5.6.1 Installed Production Capacity
- 5.6.2 Actual Production
- 5.6.3 Planned Capacity and Expansion Targets
- 5.7 Supply Chain Structure and Procurement Trends
- 5.8 Supply-Demand Gap and Bottlenecks
- 5.9 Import Dependence and Sourcing Structure
- 5.10 Contract Manufacturing and Outsourcing
- 5.11 Regional Supply and Demand Concentration
Chapter 6 Australia Furniture and Smart Office Interiors Market Pricing Analysis
- 6.1 Pricing Structure and Measurement
- 6.2 Historical Pricing Trends, 2018-2025
- 6.3 Pricing Outlook, 2025-2035
- 6.4 Average Selling Price and Unit Economics
- 6.5 Pricing by Product and Market Segment
- 6.6 Geographic Pricing Differences
- 6.7 Key Input, Energy, Labor and Logistics Costs
- 6.8 Contract Pricing and Purchasing Models
- 6.9 Pricing Sensitivity and Competitive Positioning
- 6.10 Price, Margin and Profitability Implications
Chapter 7 Australia Furniture and Smart Office Interiors Market Dynamics
- 7.1 Market Growth Drivers
- 7.1.1 Demand-Side Drivers
- 7.1.2 Technology and Innovation Drivers
- 7.1.3 Infrastructure and Investment Drivers
- 7.1.4 Regulatory and Policy Drivers
- 7.2 Market Restraints
- 7.2.1 Cost and Affordability Constraints
- 7.2.2 Technology and Adoption Barriers
- 7.2.3 Supply Chain and Operational Constraints
- 7.3 Market Challenges
- 7.3.1 Competitive Pressure and Margin Erosion
- 7.3.2 Skills, Infrastructure and Implementation Gaps
- 7.4 Emerging Market Opportunities
- 7.5 Market Dynamics Impact and Time-Horizon Assessment
Chapter 8 Australia Furniture and Smart Office Interiors Value Chain Analysis
- 8.1 Industry Value Chain Overview
- 8.2 Upstream Suppliers and Critical Inputs
- 8.3 Technology and Component Providers
- 8.4 Manufacturing or Service Delivery
- 8.5 Distribution, Channel Partners and Integrators
- 8.6 Downstream Applications and End Users
- 8.7 Value Addition and Profit Pools
- 8.8 Vertical Integration and Outsourcing
- 8.9 Supplier Concentration and Risk
- 8.10 Supply Chain Localization and Resilience
Chapter 9 Australia Furniture and Smart Office Interiors Market Regulations and Policies
- 9.1 Relevant Laws, Standards and Compliance Frameworks
- 9.2 Product, Service, Safety and Quality Requirements
- 9.3 Government Policies, Incentives and Subsidies
- 9.4 Imports, Exports and Trade Barriers
- 9.5 Public Procurement and Local Content Requirements
- 9.6 Environmental and Sustainability Compliance
- 9.7 Upcoming Policy Changes and Market Implications
Chapter 10 Australia Furniture and Smart Office Interiors Market Hotspots and Opportunities
- 10.1 Market Opportunity Mapping and Growth Hotspots
- 10.2 High-Growth Applications and Customer Groups
- 10.3 Underserved Markets and White-Space Opportunities
- 10.4 Emerging Technology and Product Opportunities
- 10.5 New Capacity and Investment Hotspots
- 10.6 Market Entry and Expansion Opportunities
- 10.7 Distribution and Partnership Opportunities
- 10.8 Near-Term and Long-Term Commercial Potential
- 10.9 Opportunity Attractiveness and Execution Risks
Chapter 11 Australia Furniture and Smart Office Interiors Market Outlook, 2025-2035
- 11.1 Market Size and Analysis
- 11.1.1 Revenue (Market Measurement: 2025: USD 14.49 billion → 2035: USD 23.12 billion)
- 11.1.2 Market Volume and Quantity Sold
- 11.1.3 Historical Market Size, 2018-2025
- 11.1.4 Base-Year Market Size, 2025
- 11.2 Market Forecast, 2025-2035
- 11.2.1 Revenue Forecast to 2035
- 11.2.2 Volume Forecast to 2035
- 11.2.3 CAGR and Year-on-Year Growth
- 11.2.4 Incremental Revenue Opportunity
- 11.3 Forecast Assumptions and Scenario Analysis
- 11.3.1 Base-Case Forecast
- 11.3.2 Optimistic and Conservative Scenarios
- 11.3.3 Technology, Pricing and Policy Sensitivities
- 11.4 Market Attractiveness and Growth Outlook
Chapter 12 Australia Furniture and Smart Office Interiors Market Segmentation and Outlook
- 12.1 Segmentation Summary and Market Shares, 2025
- 12.2 Largest and Fastest-Growing Segments
- 12.3 By Product Type - Market Size and Forecast, 2025-2035
- 12.3.1 Segment Definition and Scope
- 12.3.2 Historical Market Size, 2018-2025
- 12.3.3 Revenue Forecast, 2025-2035
- 12.3.4 Volume Forecast, 2025-2035
- 12.3.5 Base-Year Market Share, 2025
- 12.3.6 Segment CAGR and Growth Drivers
- 12.3.7 Subsegment Market Size and Forecast
- 12.3.7.1 Household Furniture
- 12.3.7.2 Commercial Furniture
- 12.3.7.3 Smart Office Technology and Interiors
- 12.3.7.4 Homewares and Soft Furnishings
- 12.3.8 Subsegment Pricing and Adoption Trends
- 12.3.9 Leading Suppliers and Competition
- 12.3.10 Regional Demand and Opportunities
- 12.4 By Application - Market Size and Forecast, 2025-2035
- 12.4.1 Segment Definition and Scope
- 12.4.2 Historical Market Size, 2018-2025
- 12.4.3 Revenue Forecast, 2025-2035
- 12.4.4 Volume Forecast, 2025-2035
- 12.4.5 Base-Year Market Share, 2025
- 12.4.6 Segment CAGR and Growth Drivers
- 12.4.7 Subsegment Market Size and Forecast
- 12.4.7.1 New-Space Furnishing
- 12.4.7.2 Replacement Purchasing
- 12.4.7.3 Space Reconfiguration
- 12.4.7.4 Technology Retrofitting
- 12.4.8 Subsegment Pricing and Adoption Trends
- 12.4.9 Leading Suppliers and Competition
- 12.4.10 Regional Demand and Opportunities
- 12.5 By End User - Market Size and Forecast, 2025-2035
- 12.5.1 Segment Definition and Scope
- 12.5.2 Historical Market Size, 2018-2025
- 12.5.3 Revenue Forecast, 2025-2035
- 12.5.4 Volume Forecast, 2025-2035
- 12.5.5 Base-Year Market Share, 2025
- 12.5.6 Segment CAGR and Growth Drivers
- 12.5.7 Subsegment Market Size and Forecast
- 12.5.7.1 Households
- 12.5.7.2 Corporate Offices
- 12.5.7.3 Public-Service Institutions
- 12.5.7.4 Hospitality and Flexible Workspaces
- 12.5.8 Subsegment Pricing and Adoption Trends
- 12.5.9 Leading Suppliers and Competition
- 12.5.10 Regional Demand and Opportunities
- 12.6 Segment Growth Comparison
- 12.7 Segment Attractiveness and Priority Matrix
Chapter 13 Australia Furniture and Smart Office Interiors End-Use and Application Market Outlook
- 13.1 End-Use Industry and Customer Demand Structure
- 13.2 Leading Applications and Customer Groups
- 13.3 End-Use Market Size, Share and Forecast
- 13.4 Major End-Use Industry Deep Dives
- 13.4.1 Customer Requirements and Use Cases
- 13.4.2 Demand and Replacement Cycles
- 13.4.3 Technical and Regulatory Considerations
- 13.4.4 Purchasing and Procurement Models
- 13.4.5 Leading Vendors and Distribution Channels
- 13.4.6 Forecast and Commercial Opportunities
- 13.5 Emerging Applications and Cross-Segment Demand
- 13.6 End-Use Industry Investment Priorities
Chapter 14 Australia Furniture and Smart Office Interiors Geographic Market Outlook, 2025-2035
- 14.1 Domestic Market Distribution and Demand Clusters
- 14.2 State- or Province-Wise Market Size and Forecast, 2025-2035
- 14.3 City and Metropolitan Market Outlook
- 14.4 Industrial, Manufacturing and Commercial Clusters
- 14.5 Geographic Concentration of Key End Users
- 14.6 Local Pricing and Purchasing Differences
- 14.7 Domestic Production Facilities and Capacity Map
- 14.8 Local Infrastructure and Project Pipeline
- 14.9 State-Level Policy and Incentive Differences
- 14.10 Subnational Investment Hotspots and Opportunities
- 14.11 Distribution and Logistics Networks
- 14.12 Domestic Competitive Footprint
Chapter 15 Australia Furniture and Smart Office Interiors Technology, Innovation and Sustainability Outlook
- 15.1 Technology Landscape and Maturity
- 15.2 Product, Process and Service Innovation
- 15.3 AI, Automation and Digital Tools in the Industry
- 15.4 Technology Adoption and Performance Benchmarking
- 15.5 Innovation Pipeline and R&D Investment
- 15.6 Patent and Intellectual Property Trends
- 15.7 Energy Efficiency and Resource Management
- 15.8 Sustainability, Recycling and Circularity
- 15.9 Technology Roadmap, 2025-2035
- 15.10 Risks of Obsolescence and Technology Substitution
Chapter 16 Australia Furniture and Smart Office Interiors Market Key Strategic Imperatives
- 16.1 Growth and Market Entry Priorities
- 16.2 High-Return Products and Segments
- 16.3 Pricing, Profitability and Cost Optimization
- 16.4 Technology Investment and Product Differentiation
- 16.5 Supply Chain Localization and Resilience
- 16.6 Distribution and Customer Acquisition
- 16.7 Partnership, Acquisition and Capacity Strategy
- 16.8 Regional Expansion Priorities
- 16.9 Short-, Medium- and Long-Term Actions
Chapter 17 Competition Outlook
- 17.1 Industry Competition Characteristics
- 17.2 Market Structure and Concentration
- 17.3 Market Share and Competitive Positioning, 2025
- 17.4 Company-Wise Revenue and Product Benchmarking
- 17.5 Production and Service Capacity Benchmarking
- 17.6 Technology, Pricing and Differentiation
- 17.7 Regional Footprint and Distribution Strength
- 17.8 Mergers, Acquisitions and Strategic Alliances
- 17.9 New Entrants and Competitive Threats
- 17.10 Porter's Five Forces and Industry Attractiveness
- 17.11 Competitive Outlook, 2025-2035
Chapter 18 Company Profiles
- 18.1 Company Coverage and Selection Criteria
- 18.2 Harvey Norman
- 18.2.1 Business Description
- 18.2.2 Company Ownership and Geographic Presence
- 18.2.3 Product and Service Portfolio
- 18.2.4 Manufacturing and Operating Footprint
- 18.2.5 Production Capacity and Expansion Plans
- 18.2.6 Financial Performance and Investment
- 18.2.7 Market Share and Competitive Position
- 18.2.8 Technology and Innovation Capabilities
- 18.2.9 Strategic Alliances or Partnerships
- 18.2.10 Recent Developments
- 18.2.11 Growth Strategy and Outlook
- 18.3 IKEA Australia
- 18.4 Amart Furniture
- 18.5 Temple & Webster
- 18.6 Nick Scali
- 18.7 Other Relevant Market Participants
Note: Every listed company is profiled on the structure shown under the first company. The company list is preliminary and may change based on research findings, market developments, data availability and client requirements.
Chapter 19 Disclaimer
- 19.1 Research and Forecast Disclaimer
- 19.2 Data Source and Estimation Limitations
Note: The depth of individual sections depends on data availability for this market. Volume, capacity, trade and other unit-based metrics are included where applicable.

