
Routine vitamin use and pharmacy reach shape demand
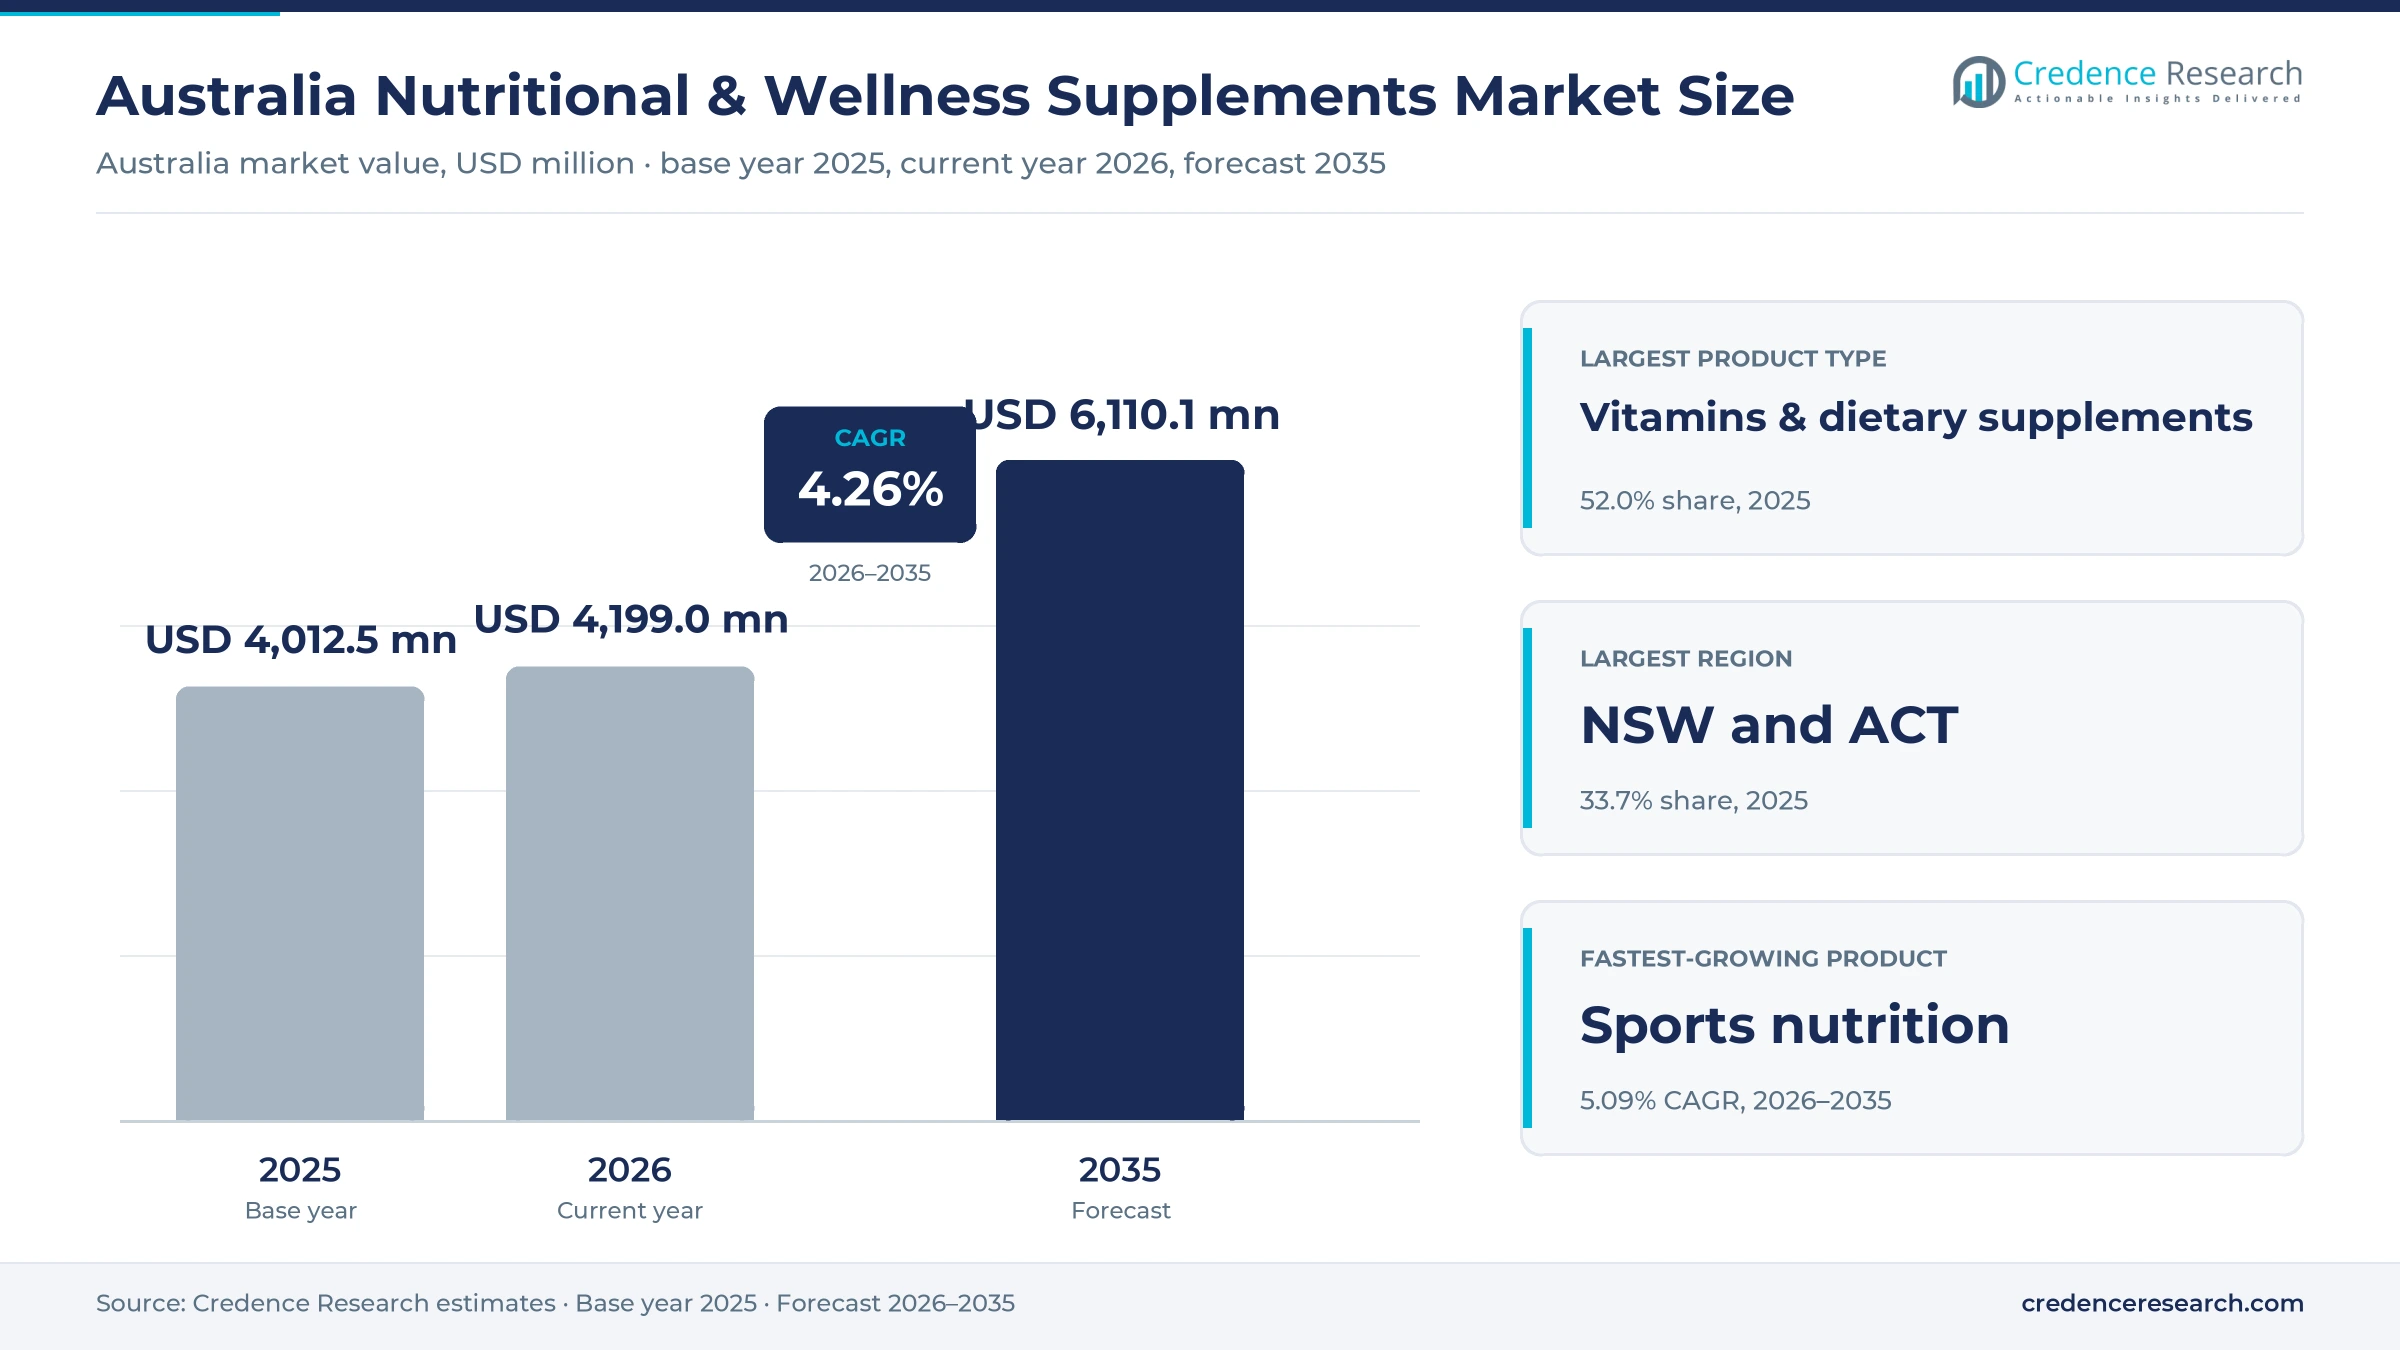
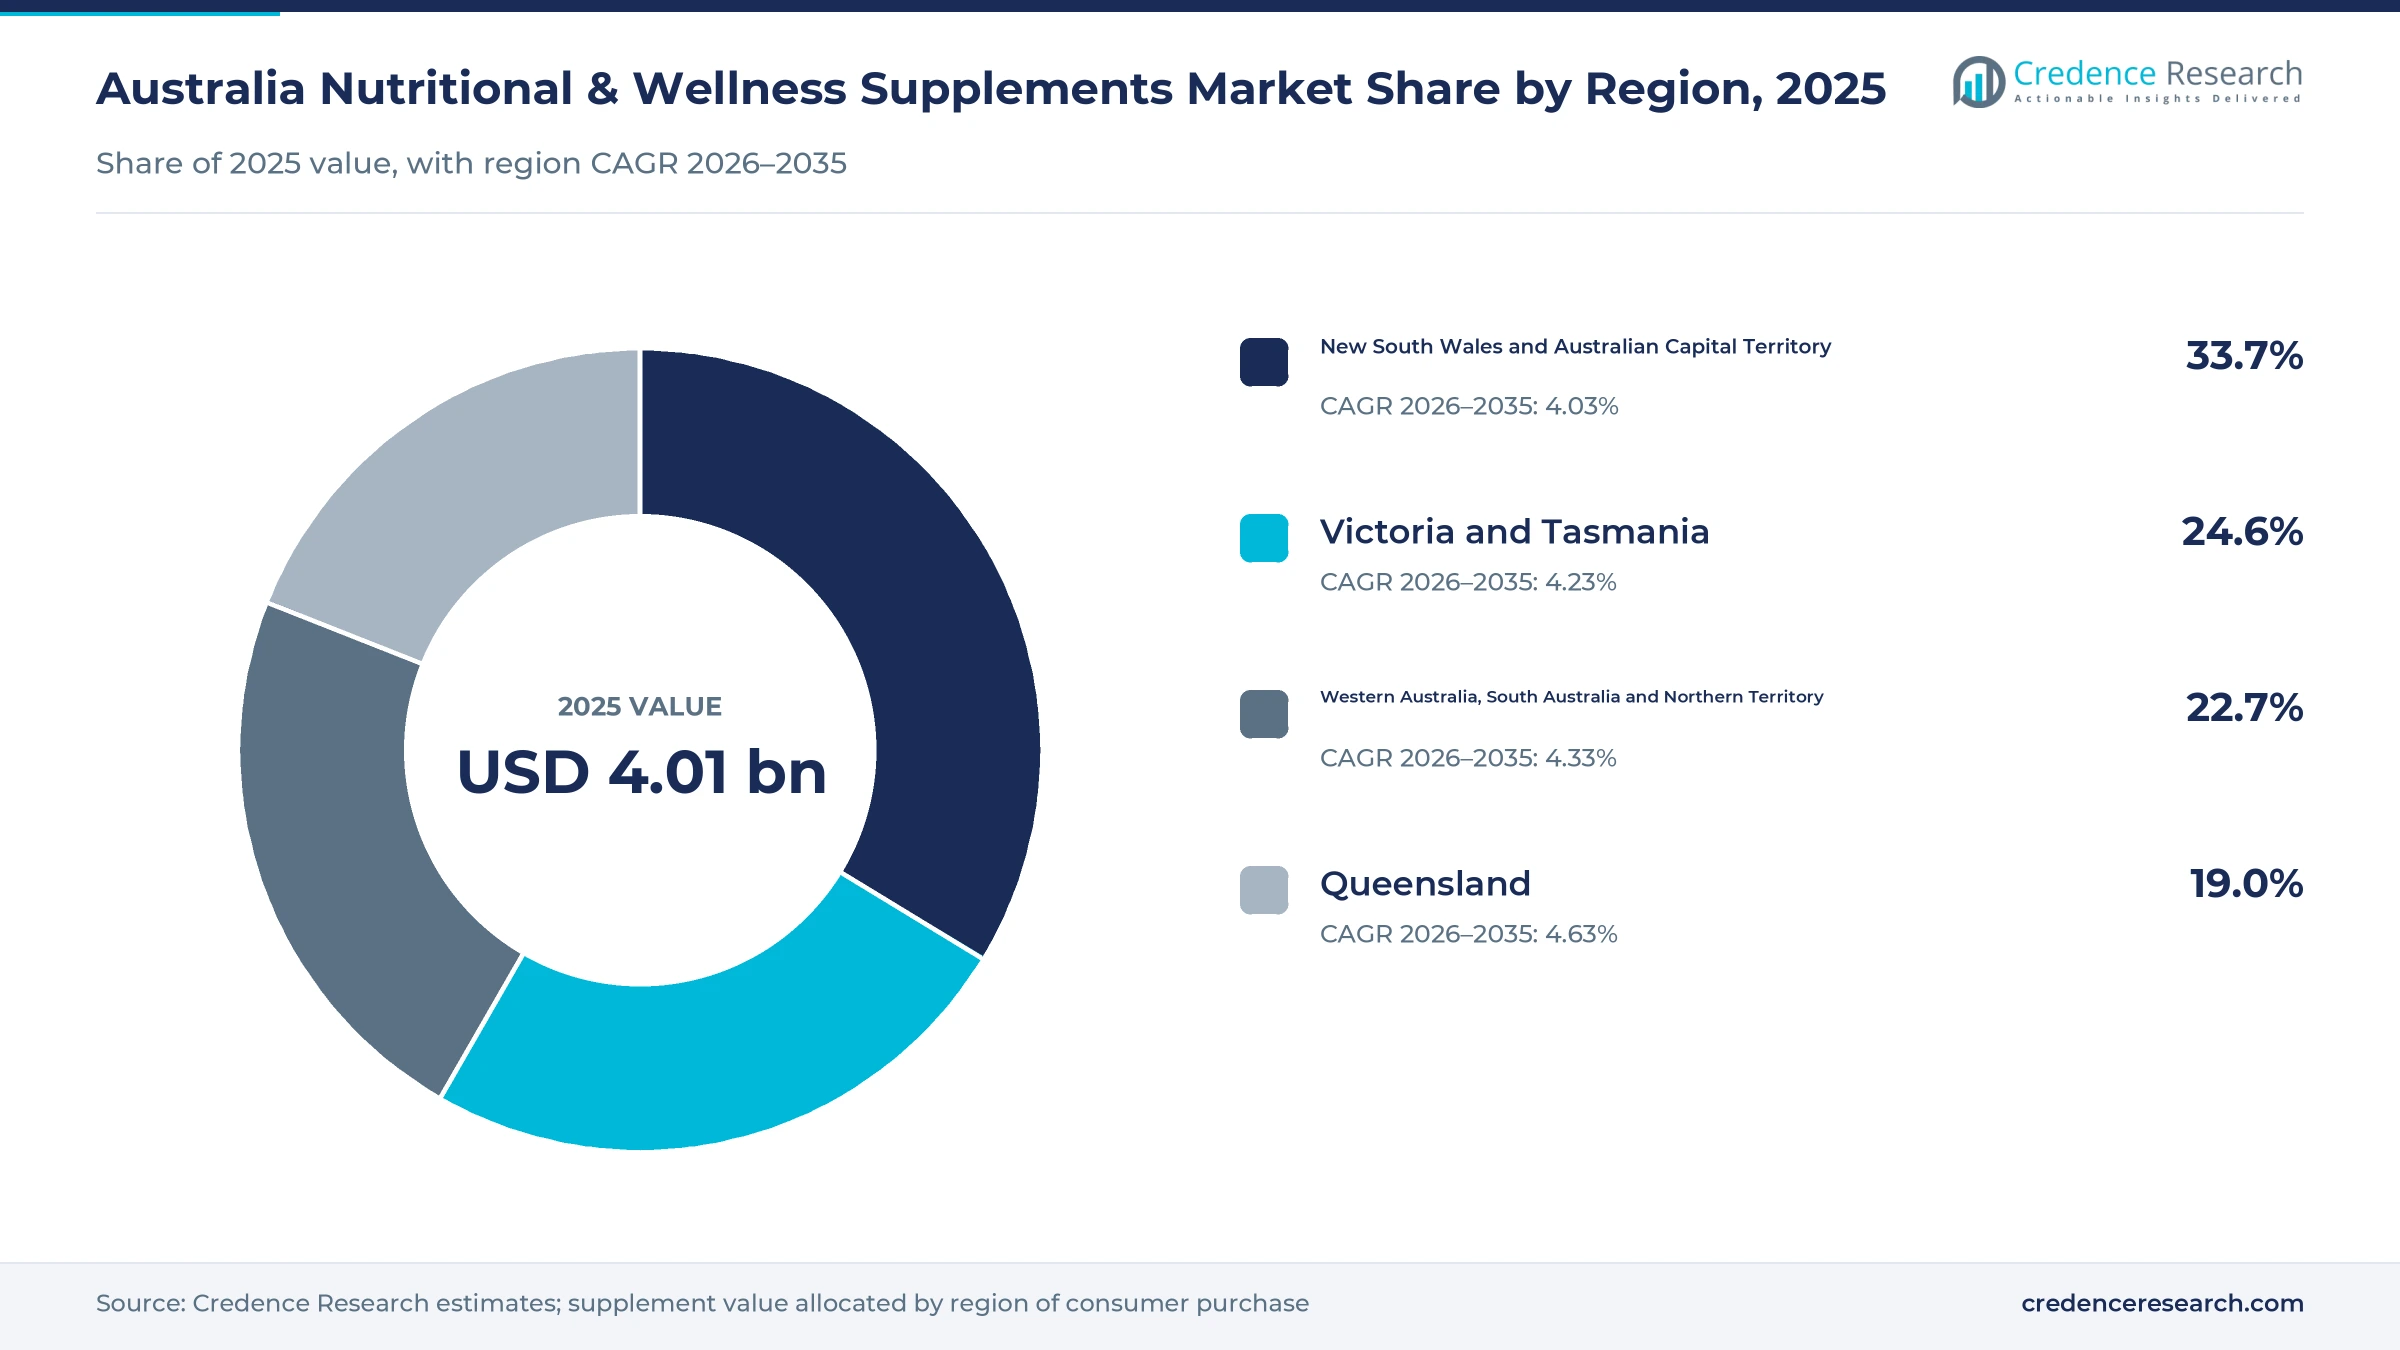
The Australia nutritional and wellness supplements market was valued at USD 4.01 billion in 2025 and is projected to increase from USD 4.20 billion in 2026 to USD 6.11 billion by 2035, registering a CAGR of 4.26% during 2026–2035. Demand comes from adults who restock multivitamins, fish oil and minerals, from active consumers who buy sports nutrition and from families who buy for children and older relatives. New South Wales and the Australian Capital Territory held the largest regional share, 33.7% in 2025, because the zone has the largest population and dense pharmacy coverage. Queensland is the fastest-growing zone at 4.63% a year, as population growth adds new buyers across the state. The channel structure also changed in February 2025, when Sigma Healthcare completed its merger with Chemist Warehouse and joined a national wholesaler with a large discount pharmacy chain.
Do vitamins, protein powders and herbal remedies all count here?
The estimate measures retail value of vitamins and dietary supplements, sports nutrition, herbal and traditional products, and weight management and wellness products bought by consumers in Australia. Values are stated at the prices that shoppers pay in pharmacies, supermarkets, online stores and specialty or practitioner outlets.
The estimate excludes prescription medicines, infant formula, medical foods given in hospitals and ordinary packaged foods without a supplement purpose. The value chain runs from ingredient suppliers and contract manufacturers through brand owners and wholesalers to retailers, practitioners and online sellers that reach the final buyer.
Australia Nutritional & Wellness Supplements Market Insights
- The Australia nutritional and wellness supplements market was valued at USD 4.01 billion in 2025 and is projected to reach USD 6.11 billion by 2035, registering a CAGR of 4.26% during 2026–2035.
- New South Wales and the Australian Capital Territory held a 33.7% share of 2025 value, because the zone has the largest population and pharmacy network.
- Vitamins and dietary supplements led with a 52.0% share of 2025 value, because multivitamins and fish oil are the most commonly used supplement types.
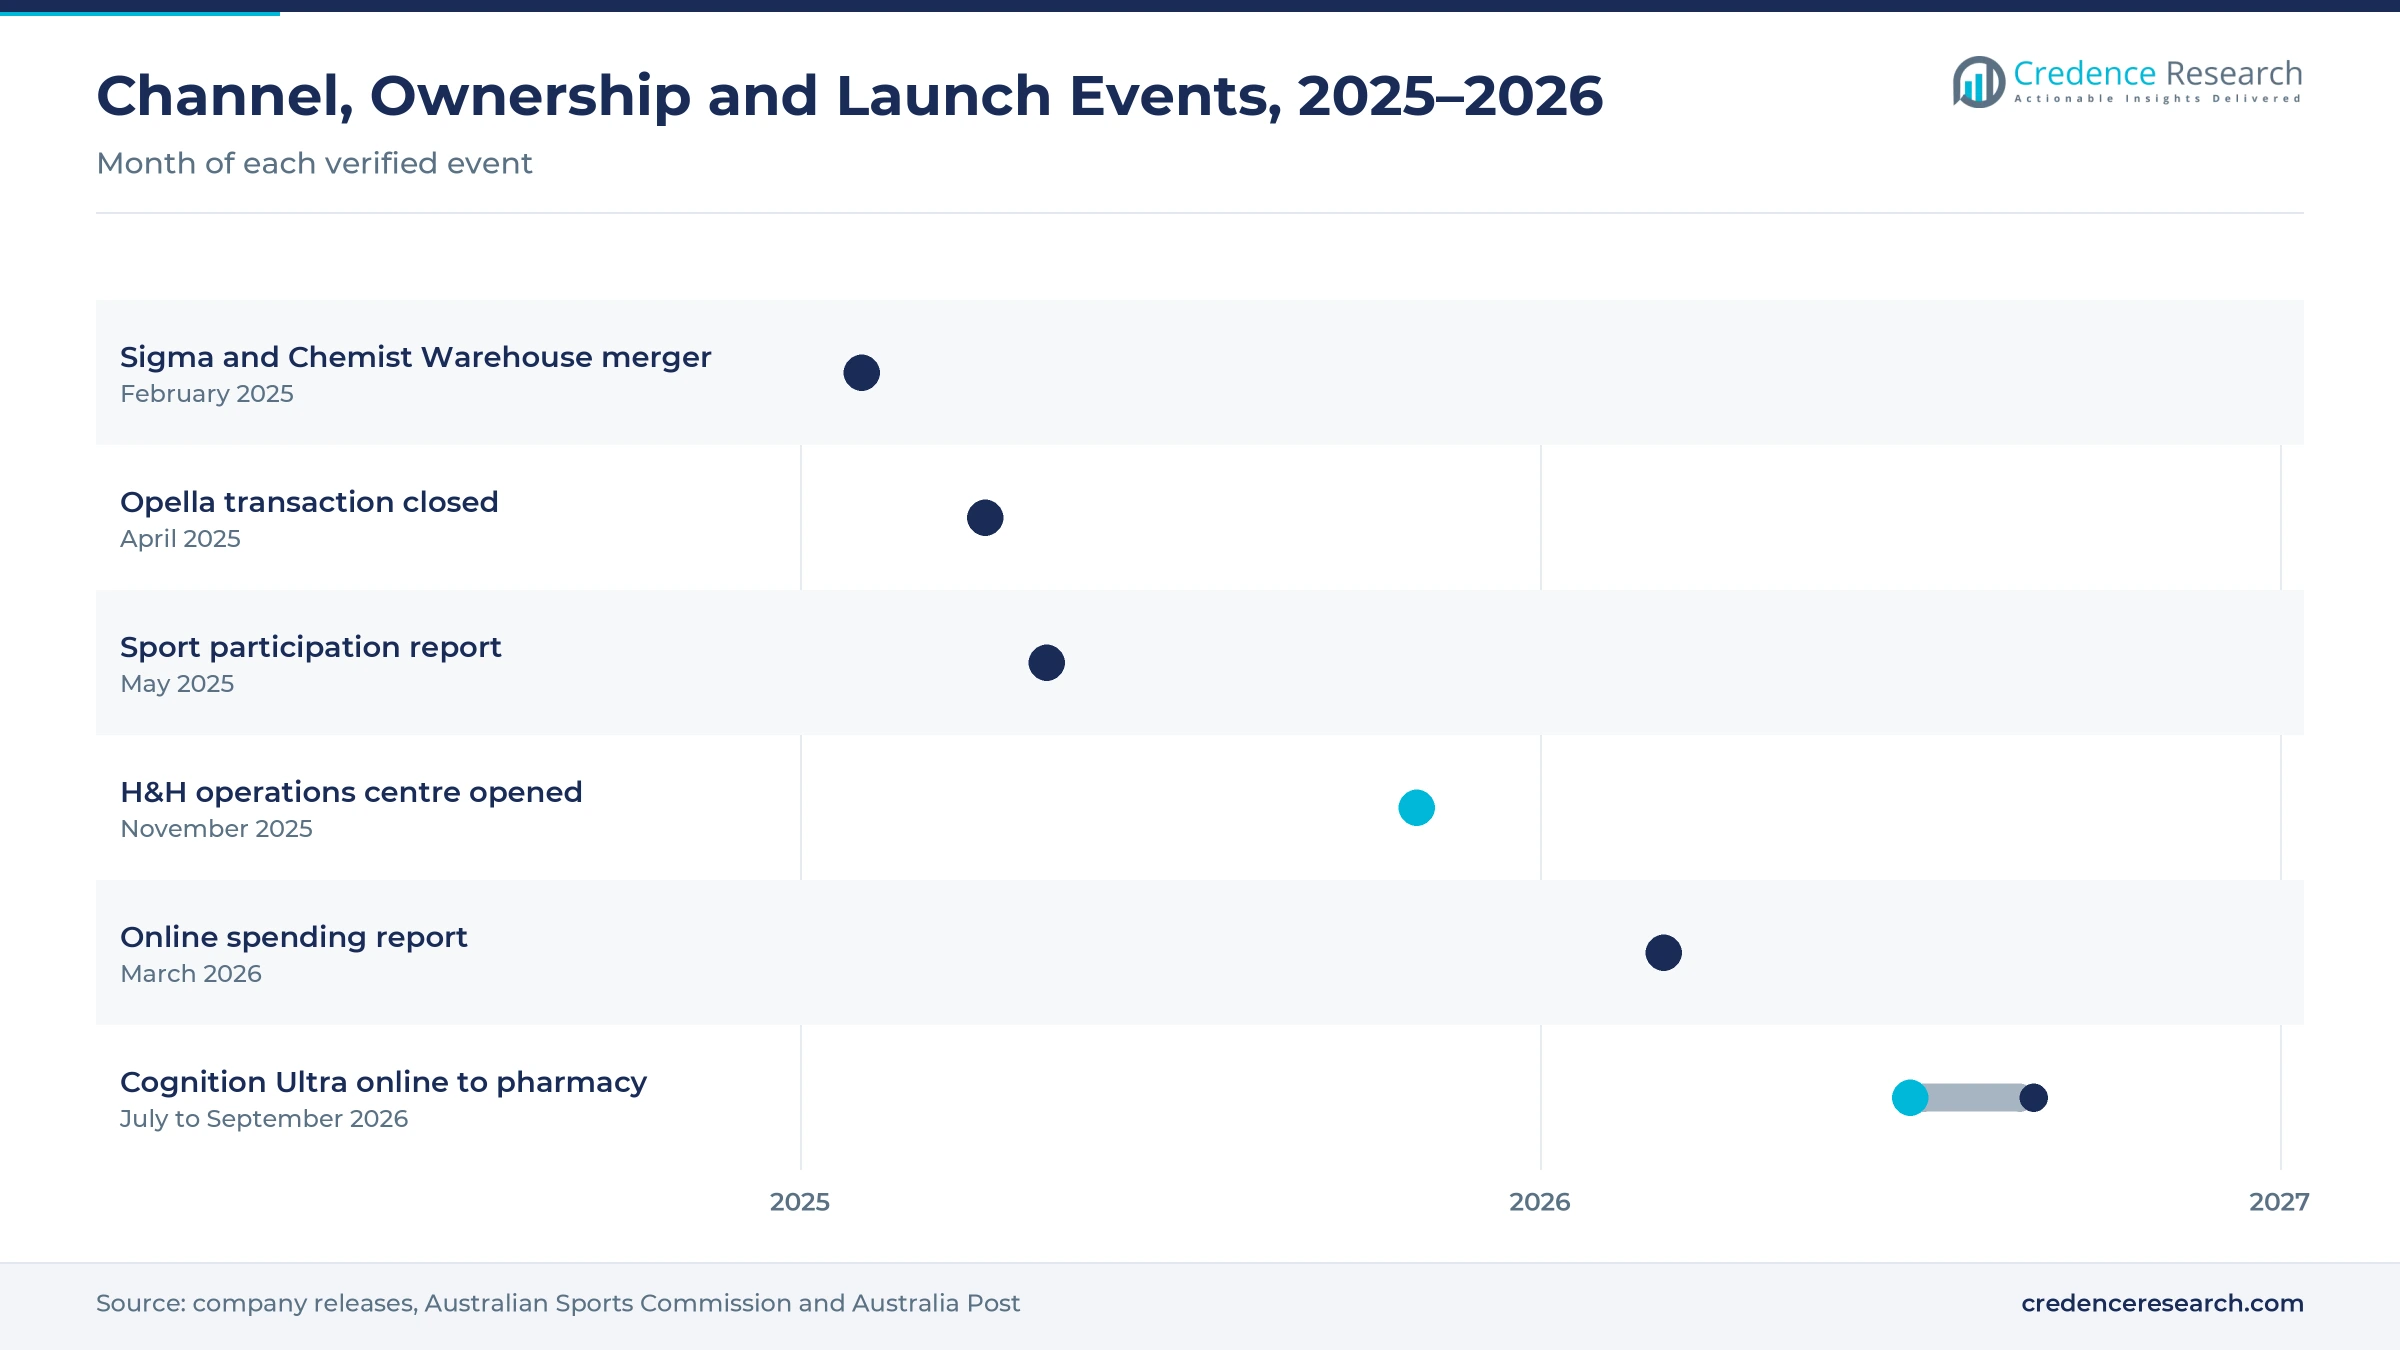
- H&H Group opened a 17,000-square-meter National Operations Centre in Victoria in November 2025, which packs more than 7 million Swisse bottles a year.
- Blackmores announced Cognition Ultra on July 22, 2026, its first product designed to support cognitive performance, with pharmacy supply from September 2026.
Vitamins lead while sports nutrition grows fastest
Why do vitamins and dietary supplements lead demand?
Based on product type, the market is categorized into vitamins and dietary supplements, sports nutrition, herbal and traditional products, and weight management and wellness products. Vitamins & Dietary Supplements led with a 52.0% share of 2025 value, because multivitamins and fish oil sit in many household routines. Sports Nutrition grows fastest at 5.09% a year, as active adults buy protein and recovery products.
How does pharmacy keep the largest channel share?
Based on distribution channel, the market is categorized into pharmacy, supermarkets and grocery, online commerce and specialty and practitioner outlets. Pharmacy led with 48.0% of 2025 value, because pharmacists advise shoppers and discount chains carry wide ranges. Online Commerce grows fastest at 5.61% a year, as brands sell direct and launch products online first. Supermarkets keep a steady role for value multivitamins bought during weekly grocery trips.
Why do self-purchasing adults buy the most?
Based on customer type, the market is categorized into self-purchasing adults, parents and guardians, and adult caregivers. Self-Purchasing Adults led with 68.0% of 2025 value, because most adults choose and pay for their own vitamins and sports products. Adult Caregivers grow fastest at 4.72% a year, as an older population leads families to buy products for aging relatives.
How does the mid-market tier hold the center?
Based on price tier, the market is categorized into value, mid-market and premium products. Mid-Market led with 45.0% of 2025 value, because established pharmacy brands price most core vitamins in this band. Premium grows fastest at 4.94% a year, as targeted formulas with new ingredients such as citicoline command higher prices per pack. Value products keep a loyal base among households that buy own-label vitamins during promotions.
| Segment Group | Leading Sub-segment | Share, 2025 | Fastest-growing Sub-segment | CAGR, 2026–2035 |
|---|---|---|---|---|
| By Product Type | Vitamins & Dietary Supplements | 52.0% | Sports Nutrition | 5.09% |
| By Distribution Channel | Pharmacy | 48.0% | Online Commerce | 5.61% |
| By Customer Type | Self-Purchasing Adults | 68.0% | Adult Caregivers | 4.72% |
| By Price Tier | Mid-Market | 45.0% | Premium | 4.94% |
Request a Free Sample
Fill in your details and we'll send you a free sample report.
- Sample data tables & charts
- Research methodology
Habitual use, active lifestyles and local plants lift sales
How does established supplement use anchor steady demand?
Established supplement use anchors steady demand, because a large share of adults already buy vitamins and minerals as part of daily routines. A total of 43.2% of adults used at least one dietary supplement in the two weeks before the 2011-12 national nutrition survey, according to a peer-reviewed analysis of the survey. Multivitamins and fish oil were the most common products, which explains why routine replenishment drives repeat purchases. The complementary medicines sector was worth more than A$6.2 billion and employed nearly 16,000 people in early 2025, according to industry body figures. As a result, vitamins and dietary supplements hold 52.0% of 2025 value, as households restock core vitamins each month.
Why do sports nutrition and new formulas widen the buyer base?
Sports nutrition and product innovation widen the buyer base, because active adults look for protein, recovery and performance products that fit their training goals. Some 85% of Australian adults are active and 48% exercise at least three times a week, according to Australian Sports Commission data released on May 30, 2025. About 28% of adults also exercise at a gym, fitness club or leisure center, which places sports products in front of regular buyers. New formulas widen the range as well, since Blackmores announced Cognition Ultra on July 22, 2026, as its first product designed to support cognitive performance, according to Kirin Holdings. In turn, sports nutrition grows at 5.09% a year, the fastest product rate.
How do local plants and pharmacy networks extend reach?
Manufacturing capability and channel reach support growth, because local plants and national retail networks keep products available in every state. H&H Group opened a 17,000-square-meter National Operations Centre in Victoria in November 2025, according to Australian Manufacturing. The site packs more than 7 million Swisse bottles a year on three automated lines and ships to more than 15 countries. Blackmores also makes its new Cognition Ultra tablets at its Braeside plant in Victoria, which shows how local capacity supports launches. Sigma Healthcare completed its merger with Chemist Warehouse in February 2025, when the chain had 658 outlets. As a result, pharmacy holds 48.0% of 2025 value, as discount chains reach shoppers nationwide.
Why do aging and weight concerns lift wellness spending?
Aging and weight concerns lift wellness spending, because older adults and people managing body weight often add supplements to daily routines. People aged 65 and over made up 18.1% of the population in 2025, up from 17.1% in 2022, according to World Bank data. Some 65.8% of adults were overweight or obese in 2022, according to the Australian Bureau of Statistics. One in two Australians also had at least one chronic health condition in 2022, which keeps preventive products in demand. In turn, demand for weight control products rises, while adult caregivers grow at 4.72% a year as families buy for older relatives.
Online buying and targeted formulas reshape the shelf
How is the rise of online buying changing the channel mix?
The rise of online buying is changing the channel mix, because shoppers now compare prices and reorder vitamins from home. Australians spent A$82.6 billion online in 2025, up 14% from the previous year, according to the Australia Post report released in March 2026. Shoppers also made four more online purchases per year than in 2024, which favors repeat items such as multivitamins and fish oil. Blackmores put Cognition Ultra on its own e-commerce platform in late July 2026, about a month before pharmacy supply began. As a result, online commerce grows at 5.61% a year, the fastest channel rate, alongside online pharmacy sales.
Why is the shift toward targeted formulas gaining pace?
The shift toward targeted formulas is gaining pace, because shoppers want products for specific needs such as memory, bone health and energy. Cognizin citicoline was listed as a new ingredient by the Therapeutic Goods Administration, and Blackmores now sells it at 250 mg per tablet in a 30-tablet pack priced at A$45. Opella entered products such as Ostelin Vitamin D3 and K2 and reformulated Cenovis multivitamins on the medicines register. Opella itself became a standalone company in April 2025, when a private equity buyer took a 50% controlling stake. In turn, premium products grow at 4.94% a year, the fastest price tier rate.
Can export-linked brands open growth beyond the home market?
Export-linked brands can open growth beyond the home market, because Australian-made labels carry strong trust in Asian markets. Complementary medicine exports reached A$1.2 billion in 2023, and China and Hong Kong took 75% of that total. Vietnam and Thailand each took about 3% of exports, which shows that buyers outside China are growing in importance. H&H Group now ships Swisse products from Victoria to more than 15 countries, including Singapore, India, the United Arab Emirates and the United States. In turn, Victoria and Tasmania hold 24.6% of 2025 value, as the zone hosts packing and production sites that serve both local and export buyers.
Is there room to grow through herbal and practitioner ranges?
Herbal and practitioner ranges leave room to grow, because shoppers seek traditional ingredients and personal advice for specific health goals. PharmaCare owns Nature's Way and Bioglan among 27 brands, operates in more than 40 countries and runs a manufacturing facility in Sydney. Its range includes herbal products such as Sambucol and Promensil, which sell through pharmacies and grocery stores. Since Nov. 30, 2020, sports supplements with higher-risk ingredients and performance claims must be on the medicines register before sale. As a result, specialty and practitioner outlets gain buyers who want advice, while brands source herbal extract ingredients for new traditional blends.
Medicine rules, price pressure and export risk slow growth
How do medicine rules raise compliance costs?
Medicine rules raise compliance costs, because many supplements must be entered on the medicines register before sale. Tablet, capsule and pill sports supplements without higher-risk ingredients had until Nov. 30, 2023, to comply or reformulate as foods. As a result, small brands spend more on dossiers, testing and label reviews. Larger brand owners absorb these costs more easily across wide ranges. Smaller firms respond by using contract manufacturers that already hold the required licenses.
Why does price pressure push shoppers to value tiers?
Price pressure pushes shoppers toward value tiers, because cost-of-living strain makes households cut back on discretionary health spending. Discount pharmacy chains also run frequent half-price promotions on major brands, which trains buyers to wait for deals. In turn, brand owners face lower average selling prices and thinner margins. They respond with larger packs, loyalty programs and online subscriptions that reward repeat buyers. Premium launches must therefore show a clear benefit to justify higher prices.
How does retail concentration shift bargaining power?
Retail concentration shifts bargaining power toward large pharmacy groups, because a few chains control much of the shelf space. The merger of Sigma Healthcare and Chemist Warehouse in February 2025 created a combined wholesaler and retailer with 658 outlets. As a result, brands without strong consumer pull struggle to win listings and promotion slots. Suppliers respond by building direct online sales and practitioner channels. Strong brand investment also helps them keep their place on pharmacy shelves.
Why does export dependence add demand risk?
Export dependence adds demand risk, because China and Hong Kong took 75% of complementary medicine exports in 2023. Changes in Chinese cross-border trade rules or consumer sentiment can therefore cut orders quickly. Australian plants that run lines for export buyers then face lower use of their capacity. Brand owners respond by entering Southeast Asia, India and the Middle East. Wider market spread should reduce reliance on a single buyer region over time.
Sydney and canberra lead as Queensland grows fastest
| Region | Value, 2025 (USD billion) | Share, 2025 | CAGR, 2026–2035 |
|---|---|---|---|
| New South Wales and Australian Capital Territory | 1.35 | 33.7% | 4.03% |
| Victoria and Tasmania | 0.99 | 24.6% | 4.23% |
| Western Australia, South Australia and Northern Territory | 0.91 | 22.7% | 4.33% |
| Queensland | 0.76 | 19.0% | 4.63% |
Why do Sydney and canberra shoppers lead supplement spending?
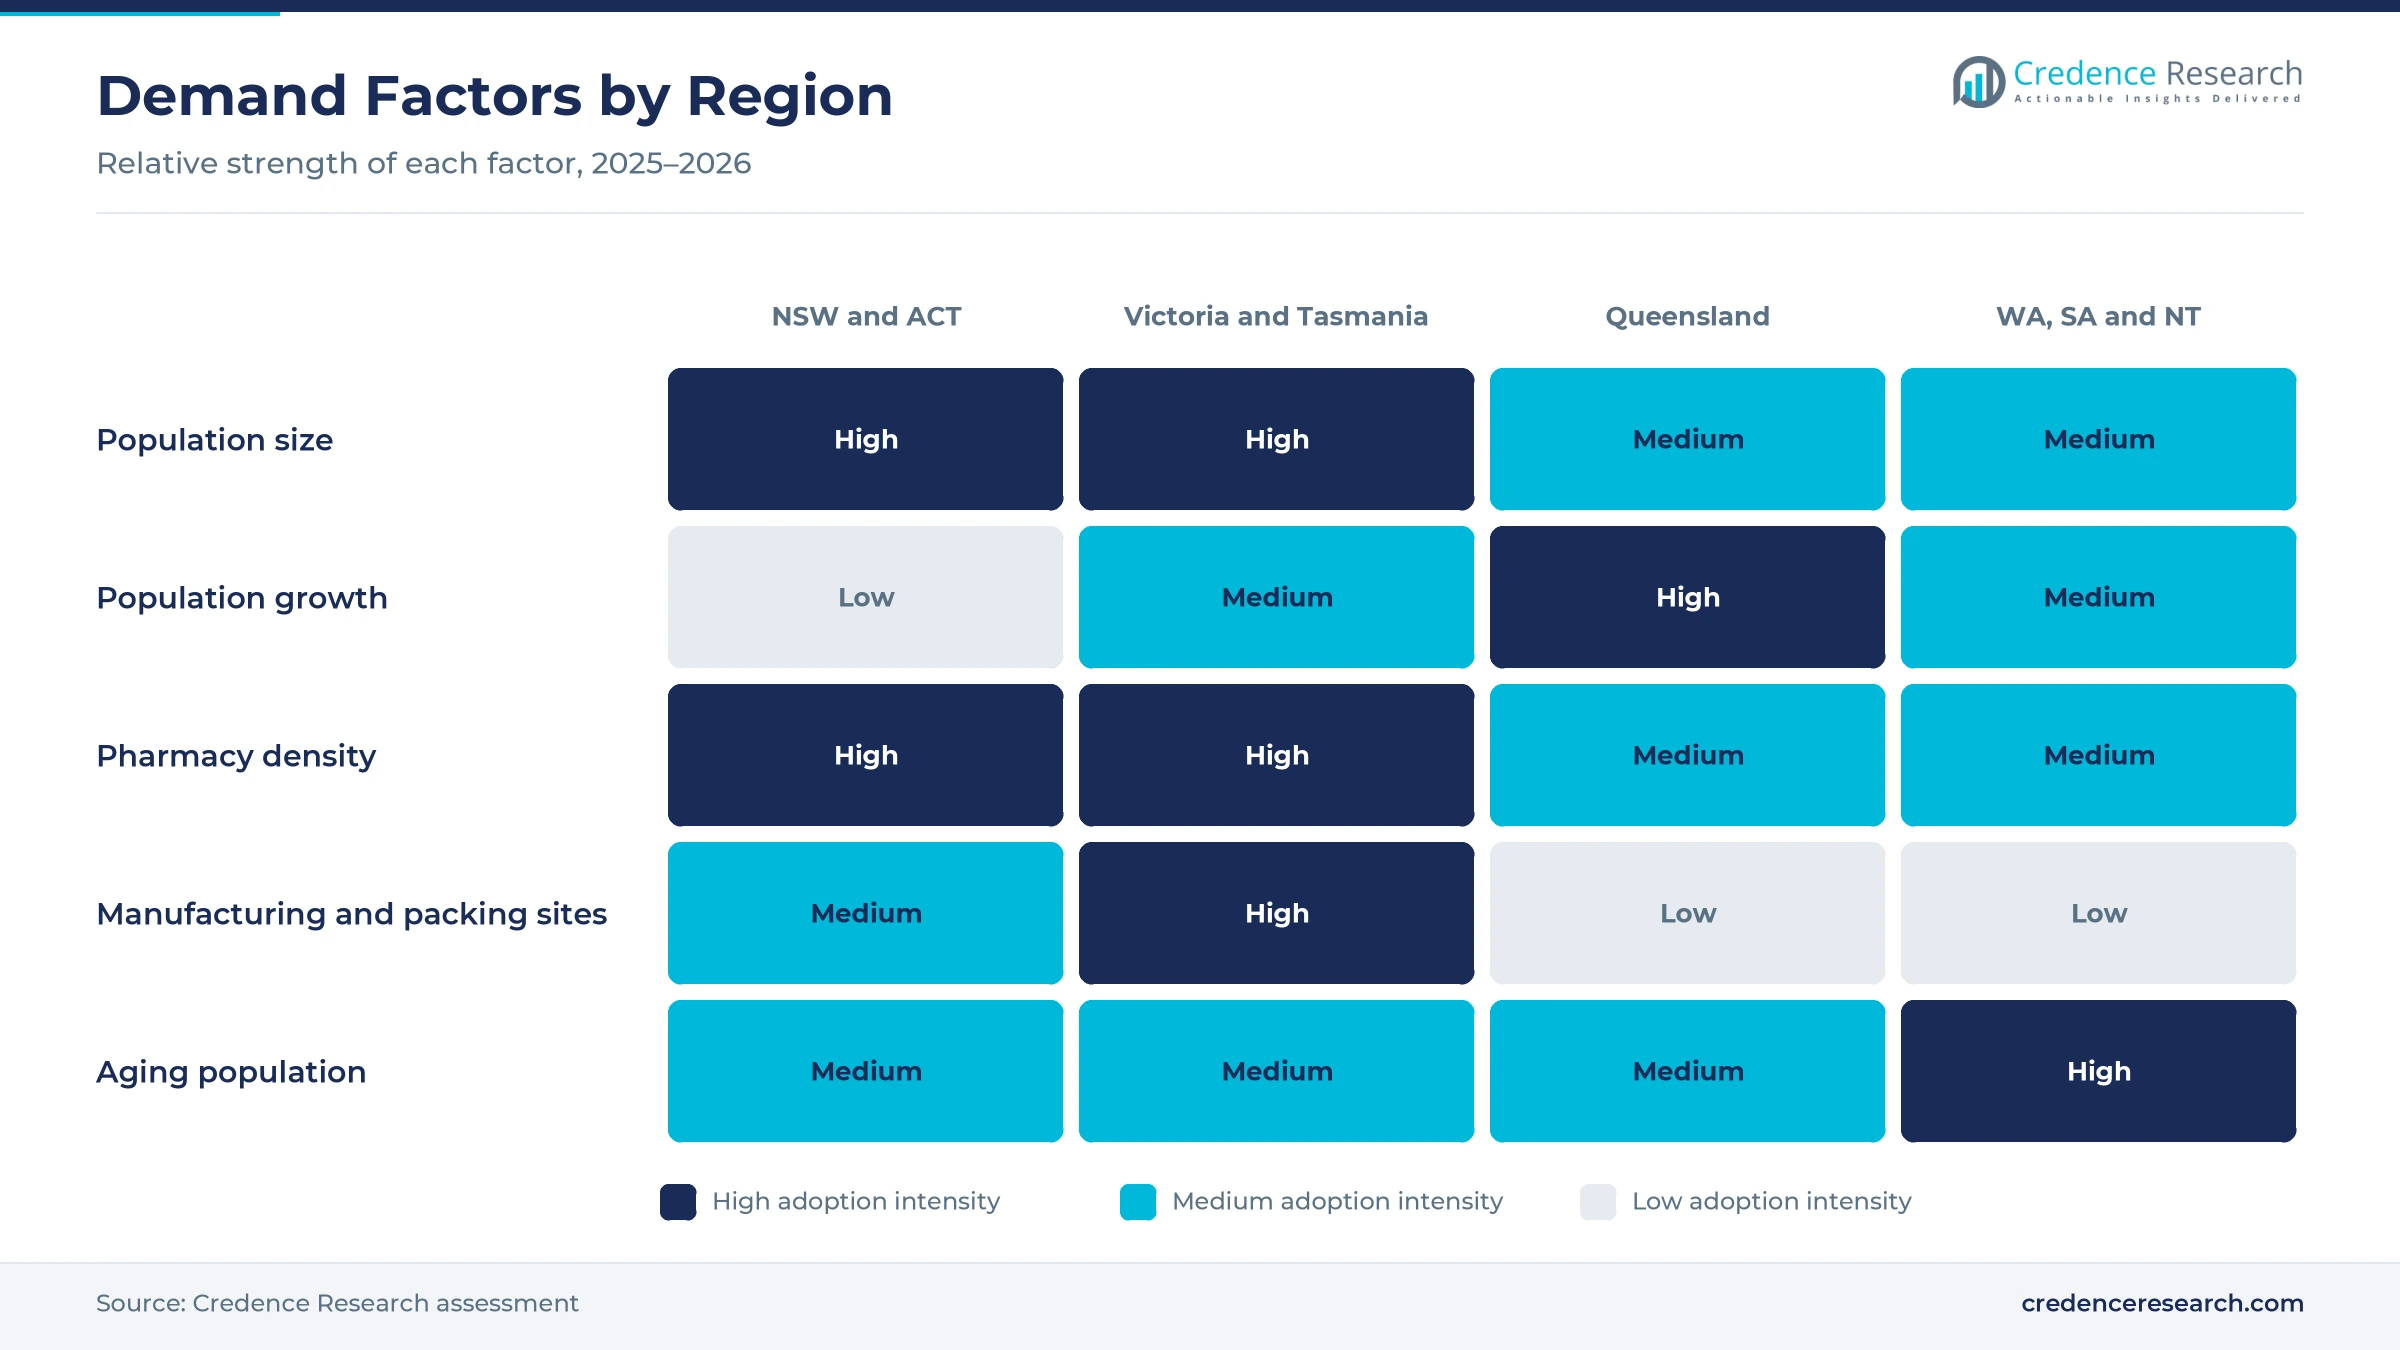
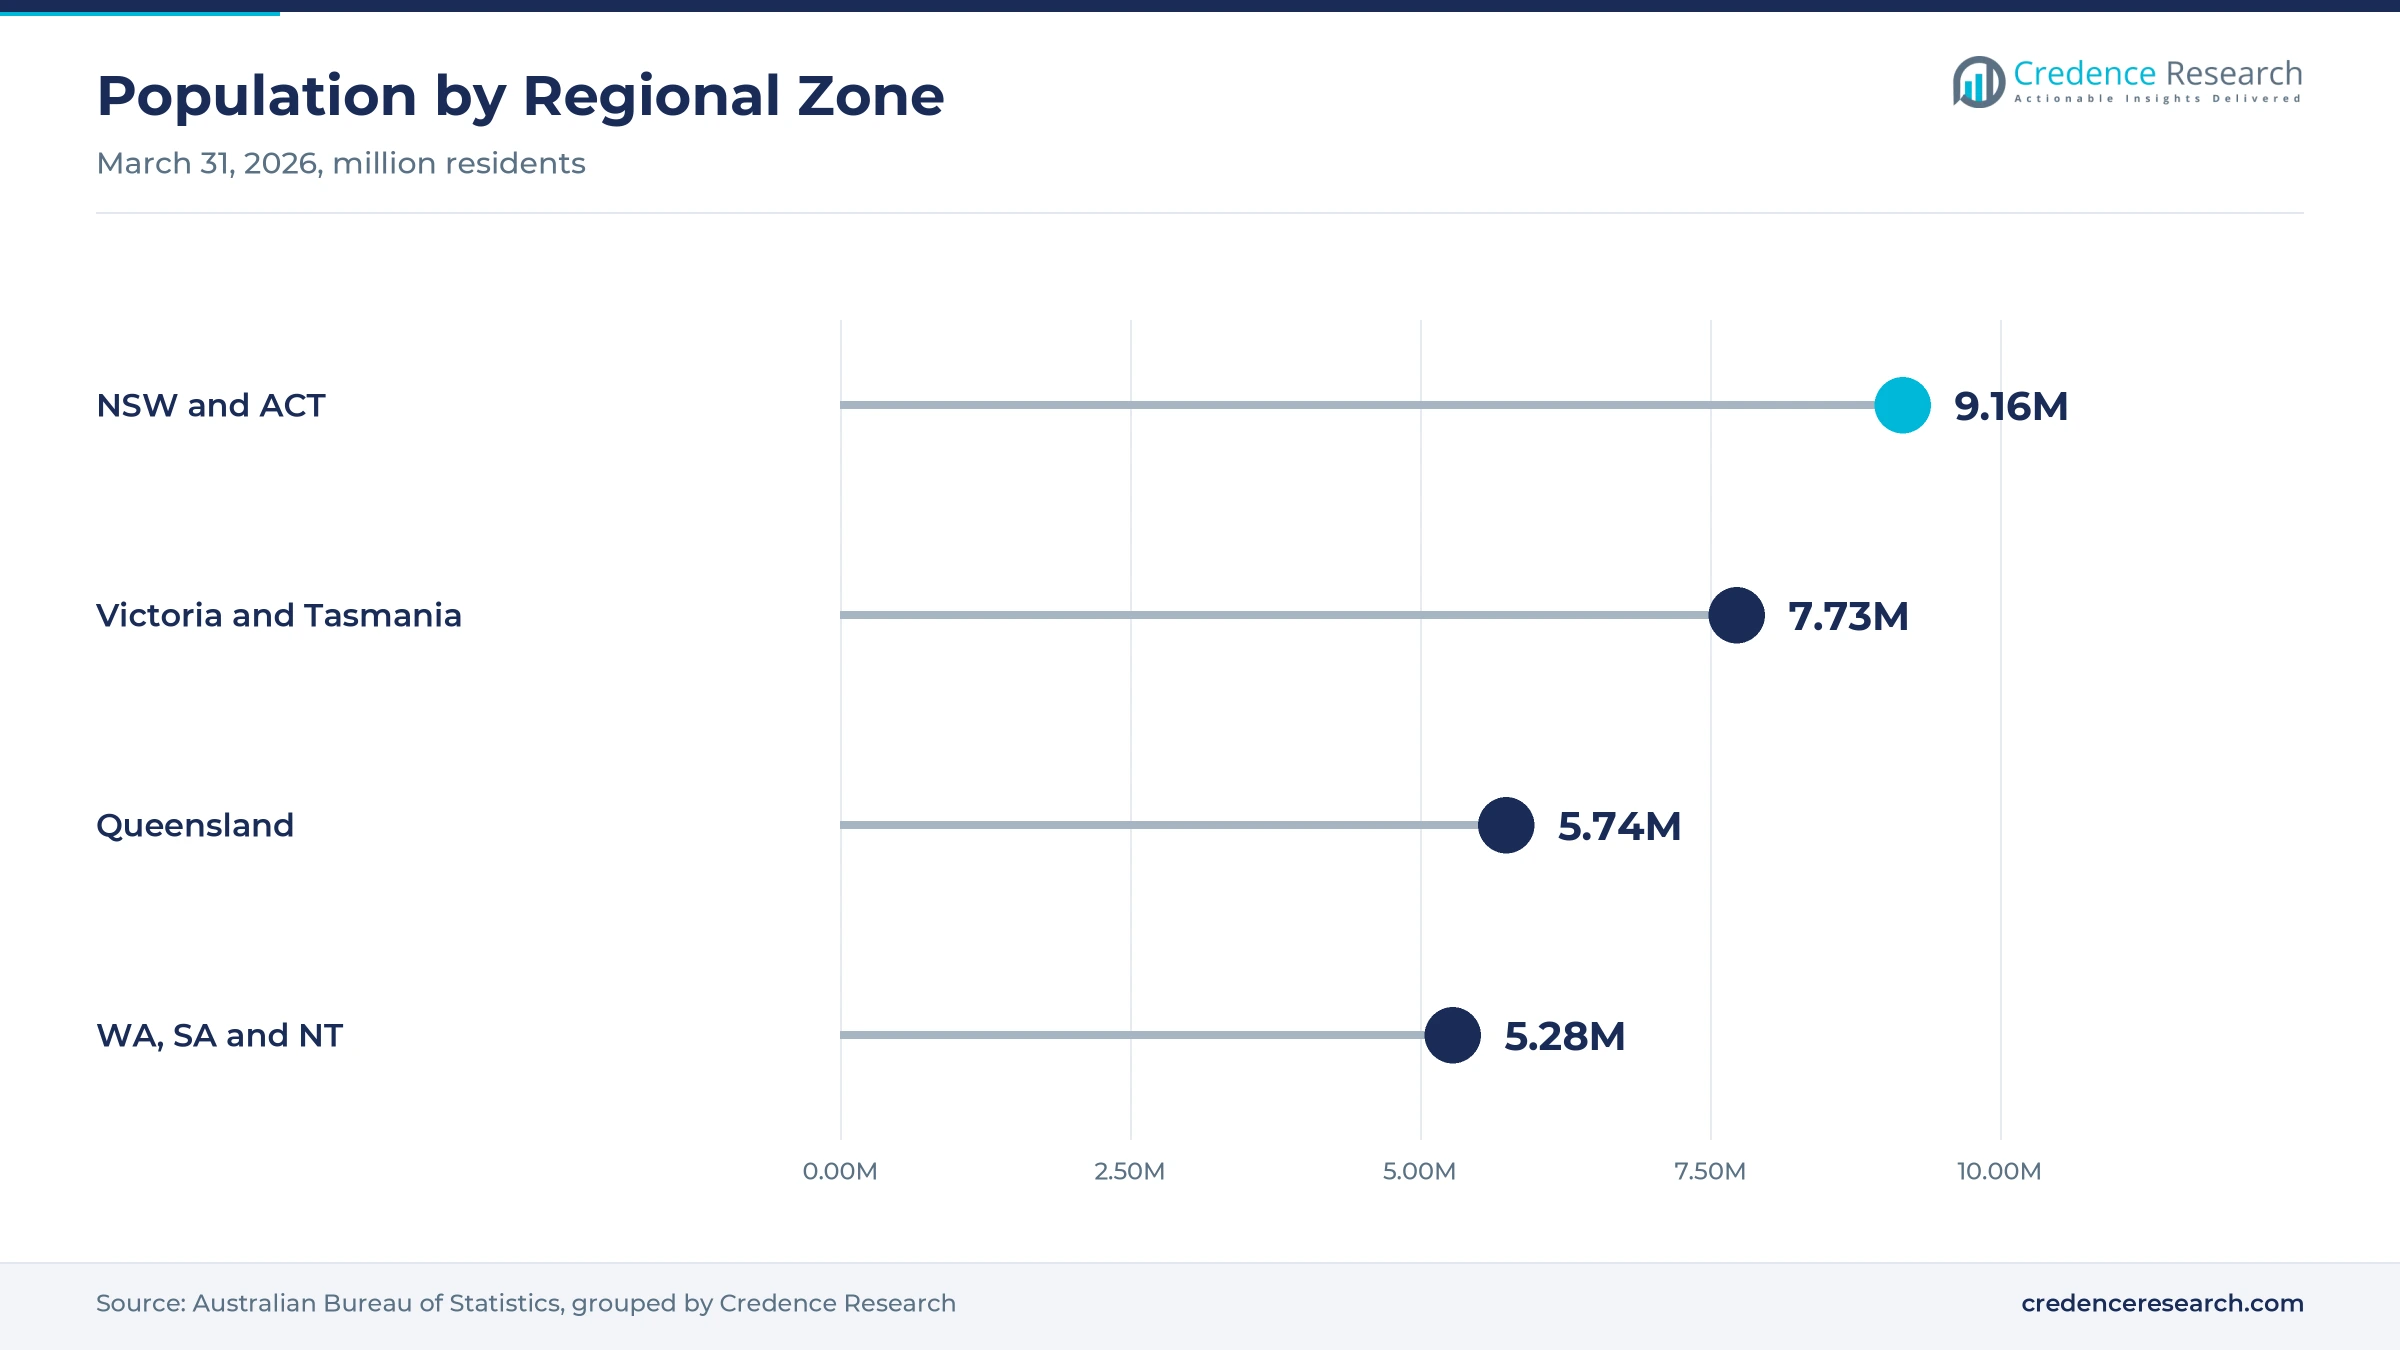
New South Wales and the Australian Capital Territory held 33.7% of 2025 value and grow at 4.03% a year, because the zone has the largest population and dense pharmacy coverage. New South Wales had 8,670,100 residents and the ACT had 489,700 at March 31, 2026. PharmaCare runs its head office at Warriewood and a manufacturing facility in Sydney. However, New South Wales grew only 1.1% over the year, which limits volume gains in the zone.
How do Victoria and Tasmania anchor production and demand?
Victoria and Tasmania held 24.6% of 2025 value and grow at 4.23% a year, because Melbourne hosts major packing and production sites alongside a large consumer base. Victoria added 109,500 residents in the year to March 2026, the largest increase of any state. H&H Group packs Swisse products in the west of Melbourne, while Blackmores makes tablets at Braeside. However, Tasmania grew only 0.6%, which slows demand growth in the southern part of the zone.
Why is Queensland the fastest-growing supplement zone?
Queensland held 19.0% of 2025 value and grows fastest at 4.63% a year, because population growth and an active outdoor lifestyle lift purchases of vitamins and sports products. The state had 5,739,500 residents at March 31, 2026, after adding 90,100 people over the year. As a result, new pharmacies and supermarket ranges open in growth corridors around Brisbane and the Gold Coast, which widens access for new buyers.
How do the western, southern and northern states add demand?
Western Australia, South Australia and the Northern Territory held 22.7% of 2025 value and grow at 4.33% a year, because Perth and Adelaide add steady demand. Western Australia grew 2.1% in the year to March 2026, the fastest rate of any state. However, South Australia grew 1.0%, which keeps the combined zone close to the national pace.
Mergers, plant openings and launches marked 2025 and 2026
| Development | Status and market relevance |
|---|---|
| In February 2025, Sigma Healthcare completed its merger with Chemist Warehouse after court approval. | Joined a national wholesaler with a chain of 658 outlets |
| In April 2025, Sanofi and a private equity buyer closed the Opella transaction, creating a standalone consumer health company. | Gives Ostelin, Cenovis and Nature's Own a dedicated owner |
| In November 2025, H&H Group opened a 17,000-square-meter National Operations Centre in Victoria. | Packs more than 7 million Swisse bottles a year for local and export buyers |
| In July 2026, Blackmores and Kirin announced Cognition Ultra, made with Cognizin citicoline at Braeside. | Online sale from late July 2026 and pharmacy supply from September 2026 |
Encapsulation, tableting and automated packing shape supply
- Softgel encapsulation seals fish oil and fat-soluble vitamins in gelatin shells, which protects them from oxidation and supports long shelf life.
- Tablet compression and coating forms multivitamins and targeted formulas into stable tablets, which lets brands combine several actives in one dose.
- Powder blending mixes protein, creatine and greens for sports and wellness products, which suits flexible serving sizes and flavor changes.
- Automated bottle packing fills, caps and labels bottles at high speed, which lets operators such as H&H Group pack millions of units a year.
Need a Custom Version of This Report?
Tailor the scope, geography, or segments to your exact requirements.
- Custom geography or segment scope
- Direct access to our analyst team
Local brands and global owners compete through pharmacy
Competition centers on a few large brand owners that sell through pharmacy, supermarkets and online stores, alongside practitioner and natural brands. Swisse, owned by a Chinese group since 2015, operates a 17,000-square-meter packing and operations site in Victoria that serves local and export buyers. Blackmores, part of Kirin, makes tablets and capsules at Braeside and launched Cognition Ultra in 2026. PharmaCare, an Australian-owned company with 27 brands including Nature's Way and Bioglan, runs manufacturing in Sydney. Opella sells Ostelin, Cenovis and Nature's Own products entered on the medicines register. Rivals compete on brand trust, pharmacy promotion, new ingredients, local manufacturing and export reach. Larger owners also use scale in advertising and retail negotiations, while smaller firms compete through practitioner advice, organic ranges and direct online sales.
Companies profiled and their roles in this market
| Company | Type | Role in the market |
|---|---|---|
| Swisse Wellness | Brand owner (H&H Group) | Packs more than 7 million bottles a year at a Victorian operations site |
| Blackmores Limited | Brand owner (Kirin Group) | Makes tablets and capsules at Braeside and launched Cognition Ultra |
| PharmaCare Laboratories | Australian-owned brand owner | Owns Nature's Way and Bioglan and manufactures in Sydney |
| Opella | Consumer health company | Markets Ostelin, Cenovis and Nature's Own products on the medicines register |
Credence Research view on Australian supplement demand
Credence Research's view is that Australian supplement demand will grow steadily because routine vitamin use, an aging population and active lifestyles keep households buying. Vitamins and dietary supplements keep the largest share, while sports nutrition and online commerce gain ground fastest. Local manufacturing and packing sites give leading brands reliable supply and export reach. However, medicine rules, price promotions and retail concentration limit margins for smaller firms. Brand owners with strong pharmacy ties, new ingredients and direct online sales should gain share through 2035.
Health surveys, statistics and company data anchor the model
The report uses 2025 as the base year on a calendar basis, and market values come from the Credence Research model. That model combines national nutrition survey findings, sport participation data, population and health statistics, World Bank demographic data, regulator records, online retail data and company announcements. Segment splits and regional growth rates are Credence Research estimates, while regional shares follow the client-defined split. Sources used are public reports, official statistics, regulator records, trade press and company information, and no interviews or surveys were used.
Aging, activity and online buying carry demand to 2035
Supplement sales are expected to reach USD 6.11 billion by 2035, a 4.26% CAGR during 2026–2035, as routine use, aging and active lifestyles keep demand rising. Growth should hold firm through 2027 as online buying expands and new targeted formulas reach pharmacy shelves. After that, export recovery and premium products will set the pace of change. A sharp fall in consumer spending would lower this outlook, while faster growth in exports would raise it. Sports nutrition and online commerce are expected to gain the most share over the period.
Frequently Asked Questions
How big is the Australia nutritional and wellness supplements market?
Which product type leads supplement demand in Australia?
Which region leads the Australia supplements market?
Why does pharmacy lead supplement sales?
How many Australian adults use dietary supplements?
Which sales channel grows fastest?
Who are the leading supplement companies in Australia?
What are the main challenges for supplement brands?
Table of Content
Chapter 1 Market Segmentation
- 1.1 Segmentation Framework
- 1.1.1 Product and Service Classification
- 1.1.2 Application and End-Use Classification
- 1.1.3 Technology and Solution Classification
- 1.1.4 Customer and Distribution Channel Classification
- 1.1.5 Geographic Segmentation
- 1.1.6 Market Segment Definitions and Boundaries
- 1.2 By Product Type
- 1.2.1 Vitamins & Dietary Supplements
- 1.2.2 Sports Nutrition
- 1.2.3 Herbal & Traditional Products
- 1.2.4 Weight Management & Wellness
- 1.3 By Customer Type
- 1.3.1 Self-Purchasing Adults
- 1.3.2 Parents and Guardians
- 1.3.3 Adult Caregivers
- 1.4 By Price Tier
- 1.4.1 Value
- 1.4.2 Mid-Market
- 1.4.3 Premium
Chapter 2 Introduction
- 2.1 Report Objectives and Scope
- 2.2 Product Definition and Industry Terminology
- 2.3 Market Inclusions and Exclusions
- 2.4 Research Process
- 2.4.1 Primary Research and Expert Interviews
- 2.4.2 Secondary Research and Source Review
- 2.4.3 Top-Down and Bottom-Up Estimation
- 2.4.4 Data Triangulation and Verification
- 2.5 Market Size Measurement Basis
- 2.5.1 2025: USD 4.01 billion → 2035: USD 6.11 billion
- 2.6 Historical and Forecast Reference Periods
- 2.6.1 Historical Period: 2018-2025
- 2.6.2 Base Year: 2025
- 2.6.3 Forecast Period: 2025-2035
- 2.7 Research Assumptions and Limitations
Chapter 3 Executive Summary
- 3.1 Market Snapshot and Key Findings
- 3.2 Base-Year Market Size, 2025
- 3.3 Forecast Market Size, 2035
- 3.4 Revenue and Volume Growth Outlook
- 3.5 Key Demand and Supply Indicators
- 3.6 Leading Market Segments
- 3.7 Fastest-Growing Market Opportunities
- 3.8 Regional Performance Highlights
- 3.9 Technology and Industry Transformation
- 3.10 Competitive Landscape Summary
- 3.11 Analyst View and Strategic Implications
Chapter 4 Australia Nutritional & Wellness Supplements Market Trends and Developments
- 4.1 Historical Industry Development, 2018-2025
- 4.2 Recent Market Trends and Developments
- 4.3 Demand and Customer Behavior Trends
- 4.4 Technology and Product Innovation
- 4.5 Artificial Intelligence, Automation and Digitalization
- 4.6 Local Manufacturing and Supply Chain Realignment
- 4.7 Industry Partnerships, Mergers and Acquisitions
- 4.8 Sustainability and Circular Economy Developments
- 4.9 Government and Private Sector Investment Trends
- 4.10 Emerging Business Models and Commercialization
- 4.11 Industry Developments and Announcements
Chapter 5 Australia Nutritional & Wellness Supplements Market Production, Supply and Demand Analysis
- 5.1 Demand Trend and Consumption Analysis, 2018-2025
- 5.2 Demand Forecast, 2025-2035
- 5.3 Production and Output Trend, 2018-2025
- 5.4 Production and Output Forecast, 2025-2035
- 5.5 Installed Capacity and Capacity Utilization
- 5.6 Company-Wise Production Plants and Statistics
- 5.6.1 Installed Production Capacity
- 5.6.2 Actual Production
- 5.6.3 Planned Capacity and Expansion Targets
- 5.7 Supply Chain Structure and Procurement Trends
- 5.8 Supply-Demand Gap and Bottlenecks
- 5.9 Import Dependence and Sourcing Structure
- 5.10 Contract Manufacturing and Outsourcing
- 5.11 Regional Supply and Demand Concentration
Chapter 6 Australia Nutritional & Wellness Supplements Market Pricing Analysis
- 6.1 Pricing Structure and Measurement
- 6.2 Historical Pricing Trends, 2018-2025
- 6.3 Pricing Outlook, 2025-2035
- 6.4 Average Selling Price and Unit Economics
- 6.5 Pricing by Product and Market Segment
- 6.6 Geographic Pricing Differences
- 6.7 Key Input, Energy, Labor and Logistics Costs
- 6.8 Contract Pricing and Purchasing Models
- 6.9 Pricing Sensitivity and Competitive Positioning
- 6.10 Price, Margin and Profitability Implications
Chapter 7 Australia Nutritional & Wellness Supplements Market Dynamics
- 7.1 Market Growth Drivers
- 7.1.1 Demand-Side Drivers
- 7.1.2 Technology and Innovation Drivers
- 7.1.3 Infrastructure and Investment Drivers
- 7.1.4 Regulatory and Policy Drivers
- 7.2 Market Restraints
- 7.2.1 Cost and Affordability Constraints
- 7.2.2 Technology and Adoption Barriers
- 7.2.3 Supply Chain and Operational Constraints
- 7.3 Market Challenges
- 7.3.1 Competitive Pressure and Margin Erosion
- 7.3.2 Skills, Infrastructure and Implementation Gaps
- 7.4 Emerging Market Opportunities
- 7.5 Market Dynamics Impact and Time-Horizon Assessment
Chapter 8 Australia Nutritional & Wellness Supplements Value Chain Analysis
- 8.1 Industry Value Chain Overview
- 8.2 Upstream Suppliers and Critical Inputs
- 8.3 Technology and Component Providers
- 8.4 Manufacturing or Service Delivery
- 8.5 Distribution, Channel Partners and Integrators
- 8.6 Downstream Applications and End Users
- 8.7 Value Addition and Profit Pools
- 8.8 Vertical Integration and Outsourcing
- 8.9 Supplier Concentration and Risk
- 8.10 Supply Chain Localization and Resilience
Chapter 9 Australia Nutritional & Wellness Supplements Market Regulations and Policies
- 9.1 Relevant Laws, Standards and Compliance Frameworks
- 9.2 Product, Service, Safety and Quality Requirements
- 9.3 Government Policies, Incentives and Subsidies
- 9.4 Imports, Exports and Trade Barriers
- 9.5 Public Procurement and Local Content Requirements
- 9.6 Environmental and Sustainability Compliance
- 9.7 Upcoming Policy Changes and Market Implications
Chapter 10 Australia Nutritional & Wellness Supplements Market Hotspots and Opportunities
- 10.1 Market Opportunity Mapping and Growth Hotspots
- 10.2 High-Growth Applications and Customer Groups
- 10.3 Underserved Markets and White-Space Opportunities
- 10.4 Emerging Technology and Product Opportunities
- 10.5 New Capacity and Investment Hotspots
- 10.6 Market Entry and Expansion Opportunities
- 10.7 Distribution and Partnership Opportunities
- 10.8 Near-Term and Long-Term Commercial Potential
- 10.9 Opportunity Attractiveness and Execution Risks
Chapter 11 Australia Nutritional & Wellness Supplements Market Outlook, 2025-2035
- 11.1 Market Size and Analysis
- 11.1.1 Revenue (Market Measurement: 2025: USD 4.01 billion → 2035: USD 6.11 billion)
- 11.1.2 Market Volume and Quantity Sold
- 11.1.3 Historical Market Size, 2018-2025
- 11.1.4 Base-Year Market Size, 2025
- 11.2 Market Forecast, 2025-2035
- 11.2.1 Revenue Forecast to 2035
- 11.2.2 Volume Forecast to 2035
- 11.2.3 CAGR and Year-on-Year Growth
- 11.2.4 Incremental Revenue Opportunity
- 11.3 Forecast Assumptions and Scenario Analysis
- 11.3.1 Base-Case Forecast
- 11.3.2 Optimistic and Conservative Scenarios
- 11.3.3 Technology, Pricing and Policy Sensitivities
- 11.4 Market Attractiveness and Growth Outlook
Chapter 12 Australia Nutritional & Wellness Supplements Market Segmentation and Outlook
- 12.1 Segmentation Summary and Market Shares, 2025
- 12.2 Largest and Fastest-Growing Segments
- 12.3 By Product Type - Market Size and Forecast, 2025-2035
- 12.3.1 Segment Definition and Scope
- 12.3.2 Historical Market Size, 2018-2025
- 12.3.3 Revenue Forecast, 2025-2035
- 12.3.4 Volume Forecast, 2025-2035
- 12.3.5 Base-Year Market Share, 2025
- 12.3.6 Segment CAGR and Growth Drivers
- 12.3.7 Subsegment Market Size and Forecast
- 12.3.7.1 Vitamins & Dietary Supplements
- 12.3.7.2 Sports Nutrition
- 12.3.7.3 Herbal & Traditional Products
- 12.3.7.4 Weight Management & Wellness
- 12.3.8 Subsegment Pricing and Adoption Trends
- 12.3.9 Leading Suppliers and Competition
- 12.3.10 Regional Demand and Opportunities
- 12.4 By Customer Type - Market Size and Forecast, 2025-2035
- 12.4.1 Segment Definition and Scope
- 12.4.2 Historical Market Size, 2018-2025
- 12.4.3 Revenue Forecast, 2025-2035
- 12.4.4 Volume Forecast, 2025-2035
- 12.4.5 Base-Year Market Share, 2025
- 12.4.6 Segment CAGR and Growth Drivers
- 12.4.7 Subsegment Market Size and Forecast
- 12.4.7.1 Self-Purchasing Adults
- 12.4.7.2 Parents and Guardians
- 12.4.7.3 Adult Caregivers
- 12.4.8 Subsegment Pricing and Adoption Trends
- 12.4.9 Leading Suppliers and Competition
- 12.4.10 Regional Demand and Opportunities
- 12.5 By Price Tier - Market Size and Forecast, 2025-2035
- 12.5.1 Segment Definition and Scope
- 12.5.2 Historical Market Size, 2018-2025
- 12.5.3 Revenue Forecast, 2025-2035
- 12.5.4 Volume Forecast, 2025-2035
- 12.5.5 Base-Year Market Share, 2025
- 12.5.6 Segment CAGR and Growth Drivers
- 12.5.7 Subsegment Market Size and Forecast
- 12.5.7.1 Value
- 12.5.7.2 Mid-Market
- 12.5.7.3 Premium
- 12.5.8 Subsegment Pricing and Adoption Trends
- 12.5.9 Leading Suppliers and Competition
- 12.5.10 Regional Demand and Opportunities
- 12.6 Segment Growth Comparison
- 12.7 Segment Attractiveness and Priority Matrix
Chapter 13 Australia Nutritional & Wellness Supplements End-Use and Application Market Outlook
- 13.1 End-Use Industry and Customer Demand Structure
- 13.2 Leading Applications and Customer Groups
- 13.3 End-Use Market Size, Share and Forecast
- 13.4 Major End-Use Industry Deep Dives
- 13.4.1 Customer Requirements and Use Cases
- 13.4.2 Demand and Replacement Cycles
- 13.4.3 Technical and Regulatory Considerations
- 13.4.4 Purchasing and Procurement Models
- 13.4.5 Leading Vendors and Distribution Channels
- 13.4.6 Forecast and Commercial Opportunities
- 13.5 Emerging Applications and Cross-Segment Demand
- 13.6 End-Use Industry Investment Priorities
Chapter 14 Australia Nutritional & Wellness Supplements Geographic Market Outlook, 2025-2035
- 14.1 Domestic Market Distribution and Demand Clusters
- 14.2 State- or Province-Wise Market Size and Forecast, 2025-2035
- 14.3 City and Metropolitan Market Outlook
- 14.4 Industrial, Manufacturing and Commercial Clusters
- 14.5 Geographic Concentration of Key End Users
- 14.6 Local Pricing and Purchasing Differences
- 14.7 Domestic Production Facilities and Capacity Map
- 14.8 Local Infrastructure and Project Pipeline
- 14.9 State-Level Policy and Incentive Differences
- 14.10 Subnational Investment Hotspots and Opportunities
- 14.11 Distribution and Logistics Networks
- 14.12 Domestic Competitive Footprint
Chapter 15 Australia Nutritional & Wellness Supplements Technology, Innovation and Sustainability Outlook
- 15.1 Technology Landscape and Maturity
- 15.2 Product, Process and Service Innovation
- 15.3 AI, Automation and Digital Tools in the Industry
- 15.4 Technology Adoption and Performance Benchmarking
- 15.5 Innovation Pipeline and R&D Investment
- 15.6 Patent and Intellectual Property Trends
- 15.7 Energy Efficiency and Resource Management
- 15.8 Sustainability, Recycling and Circularity
- 15.9 Technology Roadmap, 2025-2035
- 15.10 Risks of Obsolescence and Technology Substitution
Chapter 16 Australia Nutritional & Wellness Supplements Market Key Strategic Imperatives
- 16.1 Growth and Market Entry Priorities
- 16.2 High-Return Products and Segments
- 16.3 Pricing, Profitability and Cost Optimization
- 16.4 Technology Investment and Product Differentiation
- 16.5 Supply Chain Localization and Resilience
- 16.6 Distribution and Customer Acquisition
- 16.7 Partnership, Acquisition and Capacity Strategy
- 16.8 Regional Expansion Priorities
- 16.9 Short-, Medium- and Long-Term Actions
Chapter 17 Competition Outlook
- 17.1 Industry Competition Characteristics
- 17.2 Market Structure and Concentration
- 17.3 Market Share and Competitive Positioning, 2025
- 17.4 Company-Wise Revenue and Product Benchmarking
- 17.5 Production and Service Capacity Benchmarking
- 17.6 Technology, Pricing and Differentiation
- 17.7 Regional Footprint and Distribution Strength
- 17.8 Mergers, Acquisitions and Strategic Alliances
- 17.9 New Entrants and Competitive Threats
- 17.10 Porter's Five Forces and Industry Attractiveness
- 17.11 Competitive Outlook, 2025-2035
Chapter 18 Company Profiles
- 18.1 Company Coverage and Selection Criteria
- 18.2 Swisse Wellness
- 18.2.1 Business Description
- 18.2.2 Company Ownership and Geographic Presence
- 18.2.3 Product and Service Portfolio
- 18.2.4 Manufacturing and Operating Footprint
- 18.2.5 Production Capacity and Expansion Plans
- 18.2.6 Financial Performance and Investment
- 18.2.7 Market Share and Competitive Position
- 18.2.8 Technology and Innovation Capabilities
- 18.2.9 Strategic Alliances or Partnerships
- 18.2.10 Recent Developments
- 18.2.11 Growth Strategy and Outlook
- 18.3 Blackmores Limited
- 18.4 PharmaCare Laboratories
- 18.5 Opella
- 18.6 Vitaco Health
- 18.7 Metagenics
- 18.8 Vita Life Sciences
- 18.9 Caruso’s Natural Health
- 18.10 Melrose Health
- 18.11 Nutra Organics
- 18.12 Other Relevant Market Participants
Note: Every listed company is profiled on the structure shown under the first company. The company list is preliminary and may change based on research findings, market developments, data availability and client requirements.
Chapter 19 Disclaimer
- 19.1 Research and Forecast Disclaimer
- 19.2 Data Source and Estimation Limitations
Note: The depth of individual sections depends on data availability for this market. Volume, capacity, trade and other unit-based metrics are included where applicable.

