Market Overview
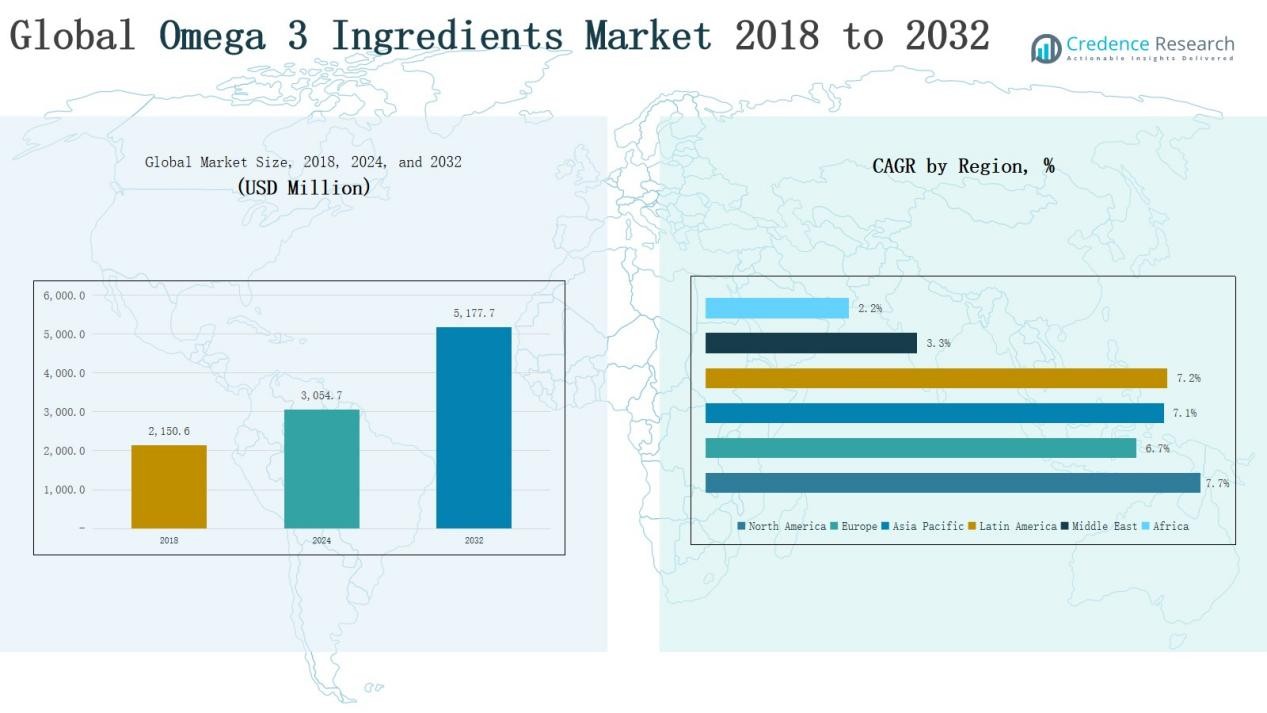
The Global Omega 3 Ingredients Market was valued at USD 2,150.6 million in 2018, increased to USD 3,054.7 million in 2024, and is anticipated to reach USD 5,177.7 million by 2032, expanding at a CAGR of 6.89% during the forecast period.
| REPORT ATTRIBUTE |
DETAILS |
| Historical Period |
2020-2023 |
| Base Year |
2024 |
| Forecast Period |
2025-2032 |
| Omega 3 Ingredients Market Size 2024 |
USD 3,054.7 Million |
| Omega 3 Ingredients Market, CAGR |
6.89% |
| Omega 3 Ingredients Market Size 2032 |
USD 5,177.7 Million |
The Global Omega 3 Ingredients Market is led by major companies such as Koninklijke DSM N.V., BASF SE, Croda International Plc, Cargill Inc., Archer Daniels Midland Company (ADM), Corbion N.V., Pelagia AS, Omega Protein Corporation, Aker BioMarine, and Polaris SA. These players dominate through advanced purification technologies, strong global distribution networks, and diversified product portfolios across DHA, EPA, and ALA segments. Their focus on sustainable sourcing, algae-based innovations, and functional food integration strengthens market competitiveness. Asia Pacific emerged as the leading region in 2024, capturing a 33% market share, driven by rising supplement demand, expanding infant nutrition applications, and increased awareness of preventive healthcare.
Access crucial information at unmatched prices!
Request your sample report today & start making informed decisions powered by Credence Research Inc.!
Download Sample
Market Insights
- The Global Omega 3 Ingredients Market grew from USD 2,150.6 million in 2018 to USD 3,054.7 million in 2024 and is expected to reach USD 5,177.7 million by 2032, expanding at a CAGR of 6.89%.
- Asia Pacific led the market with a 33% share in 2024, driven by rising supplement demand, infant nutrition expansion, and growing awareness of preventive healthcare.
- Docosahexaenoic Acid (DHA) dominated by type with a 41% share, owing to strong demand in infant formula, cognitive supplements, and functional foods.
- Dietary Supplements held the largest application share at 46%, supported by increasing health consciousness and the popularity of clean-label formulations.
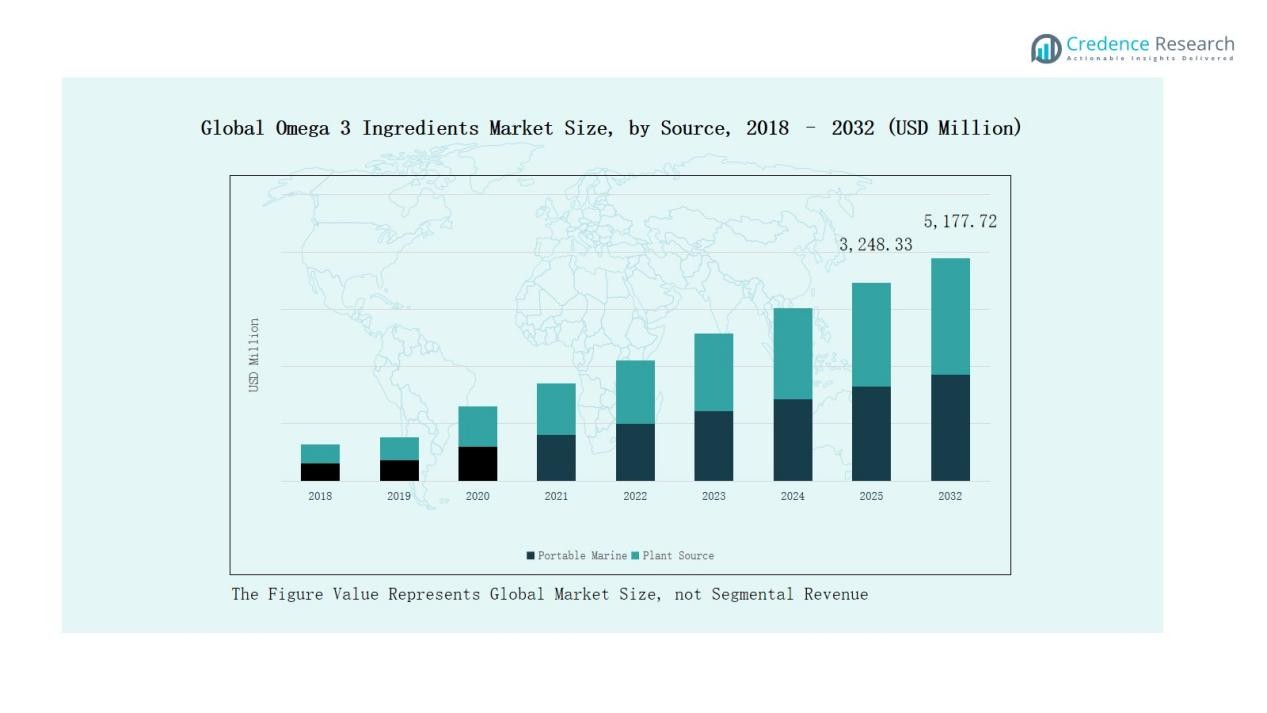
- Marine Source accounted for a 68% share, fueled by high EPA and DHA content, sustainability efforts, and growing use of algae-based omega-3 alternatives.
Market Segment Insights
By Type:
Docosahexaenoic Acid (DHA) dominated the Global Omega 3 Ingredients Market in 2024 with a 41% share. Its strong demand stems from widespread use in infant nutrition, cognitive health supplements, and functional foods. DHA’s proven benefits for brain, eye, and heart health drive its preference over other omega-3 forms. Continuous innovation in microalgae-based DHA production and pharmaceutical-grade formulations further strengthens its adoption across dietary and medical applications worldwide.
- For instance, Novozymes (now part of Novonesis) expanded its Omega DHA Active range, engineered through precision fermentation to increase sustainability and yield.
By Application:
The Dietary Supplements segment held the largest share of 46% in 2024, driven by rising health awareness and preventive healthcare trends. Consumers increasingly seek omega-3 supplements to support cardiovascular, cognitive, and joint health. Expanding e-commerce distribution and clean-label formulations boost accessibility and trust. Product diversification, including gummies and soft gels, enhances user convenience, while aging populations and higher disposable incomes sustain strong global demand across developed and emerging markets.
- For instance, Ritual launched an Omega-3 DHA + EPA supplement sourced sustainably from microalgae in France, featuring 500 mg of omega-3 fatty acids in a 2:1 ratio and patented oxidation-reducing technology for better efficacy and taste.
By Source:
The Marine Source segment led the market with a 68% share in 2024, attributed to its high concentration of EPA and DHA. Fish oil, krill oil, and algae oil dominate production due to their superior purity and bioavailability. Growing sustainability initiatives and certified fishing practices enhance credibility among manufacturers. Meanwhile, algae-based marine sources gain traction for vegetarian consumers, ensuring broader adoption across pharmaceutical, nutraceutical, and food industries worldwide.
Key Growth Driver
Rising Awareness of Health Benefits
Growing consumer awareness about omega-3’s role in heart, brain, and eye health drives market expansion. Increasing lifestyle-related diseases such as cardiovascular disorders and obesity have shifted focus toward preventive nutrition. Governments and healthcare organizations promote omega-3 consumption through dietary guidelines and awareness programs. This shift, combined with the growing preference for functional and fortified foods, continues to boost global demand for omega-3 ingredients across supplements, pharmaceuticals, and food applications.
- For instance, REDUCE-IT, a landmark trial, found that Vascepa, a high-dose prescription omega-3 product containing icosapent ethyl (IPE), significantly reduced cardiovascular events and mortality, contributing to increased awareness and adoption of omega-3s for heart health betterment.
Expanding Use in Functional Foods and Beverages
The integration of omega-3 ingredients into functional foods and beverages has gained significant momentum. Manufacturers are enriching dairy products, bakery goods, and beverages with omega-3 to attract health-conscious consumers. This approach enables regular intake without the need for supplements. Innovations in microencapsulation improve omega-3 stability and taste, expanding its application in mainstream food products. This trend aligns with the growing global demand for convenient nutrition and supports sustained market growth.
- For instance, Coca-Cola has introduced omega-3 fortified flavored waters using emulsified oils to maintain taste and shelf life while delivering cognitive wellness benefits.
Technological Advancements in Extraction and Processing
Advancements in extraction and purification technologies enhance the quality, yield, and bioavailability of omega-3 ingredients. Supercritical CO₂ extraction and molecular distillation techniques enable higher purity with minimal environmental impact. These innovations also support sustainable sourcing from fish, krill, and algae. Improved odor control and oxidation prevention technologies increase product acceptance in food and supplement formulations, ensuring long-term market growth through quality consistency and cleaner production processes.
Key Trend & Opportunity
Rising Demand for Plant-Based Omega-3 Sources
The growing vegan and vegetarian population is driving interest in plant-based omega-3 ingredients such as flaxseed, chia, and algae oil. These sources provide sustainable and ethical alternatives to marine-based oils. Algae-derived DHA and EPA are gaining prominence due to comparable efficacy and reduced ecological impact. Manufacturers are expanding production capacity and investing in bio-fermentation technologies, creating opportunities for diversification and tapping into the rapidly expanding plant-based nutrition market.
- For instance, flaxseed oil contains about 7.3 grams of alpha-linolenic acid (ALA) per tablespoon, offering a potent plant-based omega-3 source widely used in food products.
Growth of Personalized Nutrition
The increasing adoption of personalized nutrition presents new opportunities for omega-3 manufacturers. Consumers seek tailored supplements based on genetic, lifestyle, and health data. This trend is supported by digital health platforms offering customized recommendations for omega-3 intake. Companies are introducing targeted formulations addressing heart health, mental performance, and immunity. The integration of AI-driven nutritional insights and personalized delivery formats is expected to expand the product landscape and consumer reach.
- For instance, Together Health markets an Algae Vegan Source Omega-3 product that delivers targeted formulations free from artificial additives, appealing to vegan consumers with a focus on sustainability.
Key Challenge
Fluctuating Raw Material Supply
Dependence on marine sources makes the market vulnerable to supply fluctuations caused by overfishing, climate change, and regulatory restrictions. Seasonal variations and limited fish oil availability affect pricing and production stability. This challenge pressures manufacturers to diversify sourcing and invest in sustainable aquaculture or algae-based alternatives. Ensuring raw material traceability and certification compliance remains critical to maintaining market reliability and consumer trust.
High Production and Processing Costs
Advanced extraction, purification, and stabilization techniques significantly increase production costs for omega-3 ingredients. Maintaining product quality and oxidation stability requires specialized equipment and processing conditions. These factors elevate final product prices, limiting penetration in price-sensitive regions. Small and medium manufacturers face barriers to entry due to high capital investment. Industry players are focusing on scaling technology and improving process efficiency to reduce costs while maintaining nutritional value.
Taste, Odor, and Stability Issues
Omega-3 oils often present strong odors and poor stability, posing formulation challenges in food and beverages. Oxidation leads to unpleasant flavors, reducing consumer acceptance and product shelf life. Manufacturers employ encapsulation and antioxidant stabilization technologies to minimize these drawbacks. However, these solutions add to costs and complexity. Continuous R&D efforts focus on improving sensory properties without compromising bioavailability, ensuring better integration into various food, supplement, and pharmaceutical products.
Regional Analysis
North America:
North America dominated the Global Omega 3 Ingredients Market in 2024 with a 25% share, valued at USD 758.01 million, up from USD 509.04 million in 2018, and is projected to reach USD 1,363.81 million by 2032, expanding at a CAGR of 7.7%. The region’s growth is driven by strong consumer awareness of nutritional supplements, advanced food fortification practices, and a robust pharmaceutical sector. The U.S. leads with high supplement consumption, strong R&D investments, and widespread use of omega-3 in functional foods and clinical nutrition products.
Europe:
Europe accounted for a 26% market share in 2024, with a market value rising from USD 568.83 million in 2018 to USD 799.21 million in 2024, and projected to reach USD 1,334.82 million by 2032, growing at a CAGR of 6.7%. The region benefits from supportive regulatory frameworks promoting health claims on omega-3 products. Countries such as Germany, France, and the UK drive demand through fortified dairy and bakery goods. Increasing vegan adoption and growing interest in algae-based omega-3 further strengthen Europe’s position.
Asia Pacific:
Asia Pacific held the 33% largest market share in 2024, valued at USD 993.88 million, up from USD 690.76 million in 2018, and is expected to reach USD 1,713.31 million by 2032, growing at a CAGR of 7.1%. Rapid urbanization, growing disposable incomes, and rising awareness of nutritional benefits drive demand across China, Japan, and India. Expanding infant formula production and functional food consumption further enhance growth prospects. The region’s focus on plant-based and algae-derived omega-3 products also supports sustainable market expansion.
Latin America:
Latin America represented an 8% share of the global market in 2024, with revenues increasing from USD 195.70 million in 2018 to USD 282.56 million in 2024, and expected to reach USD 489.29 million by 2032, at a CAGR of 7.2%. Growth is driven by expanding dietary supplement use and increasing health-conscious populations in Brazil and Mexico. Government-led nutrition initiatives and the availability of affordable omega-3-enriched products support regional demand. The presence of local food manufacturers incorporating omega-3 in dairy and functional beverages contributes to steady market development.
Middle East:
The Middle East accounted for a 4% market share in 2024, valued at USD 124.02 million, up from USD 102.80 million in 2018, and is anticipated to reach USD 160.51 million by 2032, expanding at a CAGR of 3.3%. The region’s growth is supported by increasing awareness of preventive healthcare and nutritional supplementation in GCC countries. Rising investments in health food retail and product diversification are enhancing consumer access. However, limited manufacturing capacity and dependence on imports constrain faster market penetration across several countries.
Africa:
Africa captured a 4% market share in 2024, with revenues growing from USD 83.44 million in 2018 to USD 97.05 million in 2024, and projected to reach USD 115.98 million by 2032, expanding at a modest CAGR of 2.2%. The region’s growth is gradual, driven by improving healthcare awareness and nutritional education. South Africa remains the leading contributor, supported by growing urban populations and rising supplement adoption. However, low purchasing power, limited product availability, and high import dependence continue to restrain large-scale market expansion.
Market Segmentations:
By Type:
- Docosahexaenoic Acid (DHA)
- Eicosapentaenoic Acid (EPA)
- Alpha-linolenic Acid (ALA)
- Others
By Application:
- Dietary Supplements
- Functional Foods & Beverages
- Pharmaceuticals
- Animal Feed
- Other Applications
By Source
- Marine Source
- Plant Source
By Form:
By Distribution Channel
By Region:
- North America
- Europe
- Germany
- France
- U.K.
- Italy
- Spain
- Rest of Europe
- Asia Pacific
- China
- Japan
- India
- South Korea
- South-east Asia
- Rest of Asia Pacific
- Latin America
- Brazil
- Argentina
- Rest of Latin America
- Middle East & Africa
- GCC Countries
- South Africa
- Rest of the Middle East and Africa
Competitive Landscape
The Global Omega 3 Ingredients Market is moderately consolidated, with key players such as Koninklijke DSM N.V., BASF SE, Croda International Plc, Cargill Inc., Archer Daniels Midland Company (ADM), Corbion N.V., Pelagia AS, Omega Protein Corporation, Aker BioMarine, and Polaris SA dominating global operations. These companies maintain strong market positions through advanced extraction technologies, sustainable sourcing, and extensive product portfolios across DHA, EPA, and ALA segments. Strategic partnerships, acquisitions, and capacity expansions support global reach and innovation in functional food and pharmaceutical formulations. Industry leaders increasingly invest in algae-based production to meet rising plant-based demand and environmental compliance. Continuous R&D efforts focus on improving bioavailability, taste, and stability, enhancing application diversity in dietary supplements and food fortification. Emerging regional manufacturers and startups emphasize sustainable, vegan-friendly omega-3 alternatives, intensifying competition and encouraging product differentiation across global markets.
Shape Your Report to Specific Countries or Regions & Enjoy 30% Off!
Key Players
- Koninklijke DSM N.V.
- BASF SE
- Croda International Plc
- Cargill Inc.
- Archer Daniels Midland Company (ADM)
- Corbion N.V.
- Pelagia AS
- Omega Protein Corporation
- Aker BioMarine
- Polaris SA
Recent Developments
- In July 2024, KD Pharma Group announced the acquisition of dsm-firmenich’s Marine Lipids (MEG-3) omega-3 business, strengthening its position in high-purity fish oil production.
- In February 2025, GC Rieber VivoMega launched two new omega-3 production technologies, VivoTech and VivoSure, enhancing efficiency and purity in concentrate manufacturing.
- In March 2025, Innovaoleo, the omega-3 division of Natac Group, introduced Omega 3 Star, a premium fish oil designed for human and pet nutrition markets.
- In August 2025, DSM-Firmenich unveiled a new algae-derived omega-3 ingredient offering 20% higher DHA content through advanced fermentation technology.
Report Coverage
The research report offers an in-depth analysis based on Type, Application, Source, Form, Distribution Channel and Region. It details leading market players, providing an overview of their business, product offerings, investments, revenue streams, and key applications. Additionally, the report includes insights into the competitive environment, SWOT analysis, current market trends, as well as the primary drivers and constraints. Furthermore, it discusses various factors that have driven market expansion in recent years. The report also explores market dynamics, regulatory scenarios, and technological advancements that are shaping the industry. It assesses the impact of external factors and global economic changes on market growth. Lastly, it provides strategic recommendations for new entrants and established companies to navigate the complexities of the market.
Future Outlook
- Demand for omega-3 ingredients will continue rising due to growing health awareness.
- Algae-based omega-3 production will gain momentum as a sustainable alternative to fish oil
- Functional foods and beverages will emerge as a major application area for omega-3 fortification.
- Technological advances in encapsulation will improve stability and taste in food formulations.
- Personalized nutrition trends will drive tailored omega-3 supplement offerings.
- Expanding e-commerce channels will boost product accessibility and global market reach.
- Pharmaceutical-grade omega-3 formulations will see higher adoption in chronic disease management.
- Strategic collaborations between biotech and food companies will accelerate innovation.
- Asia Pacific will remain a key growth hub due to rising dietary supplement consumption.
- Sustainability certifications and eco-friendly sourcing will shape long-term competitive strategies.


