
Steel workloads push shops toward automated cutting
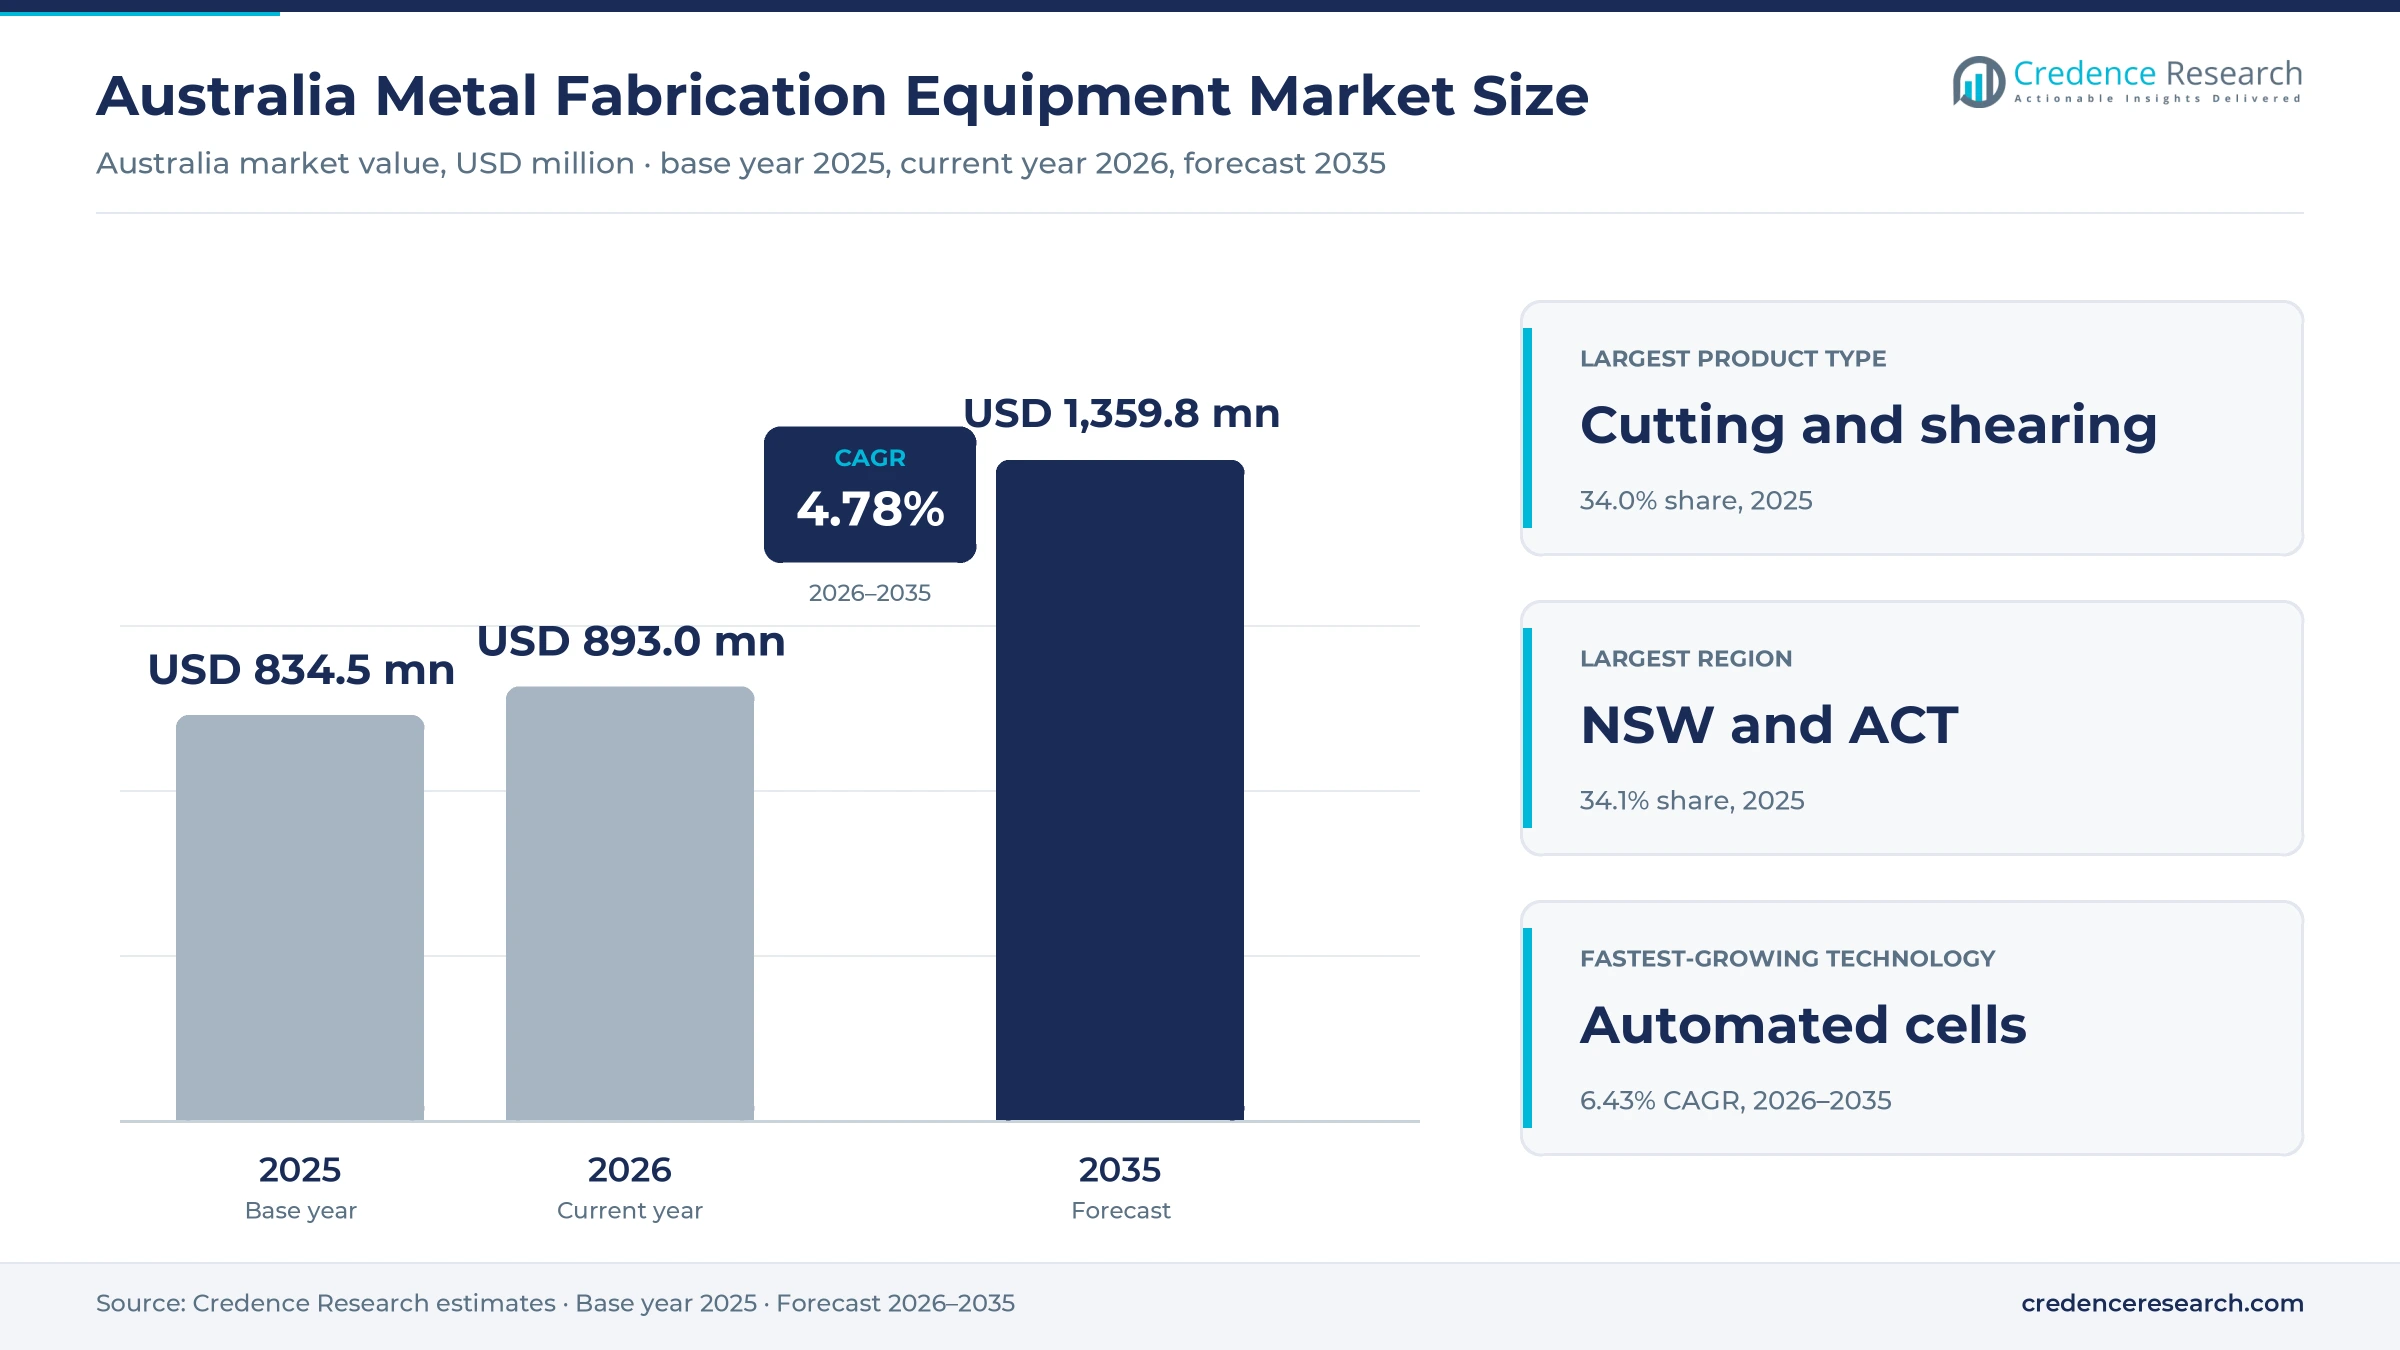
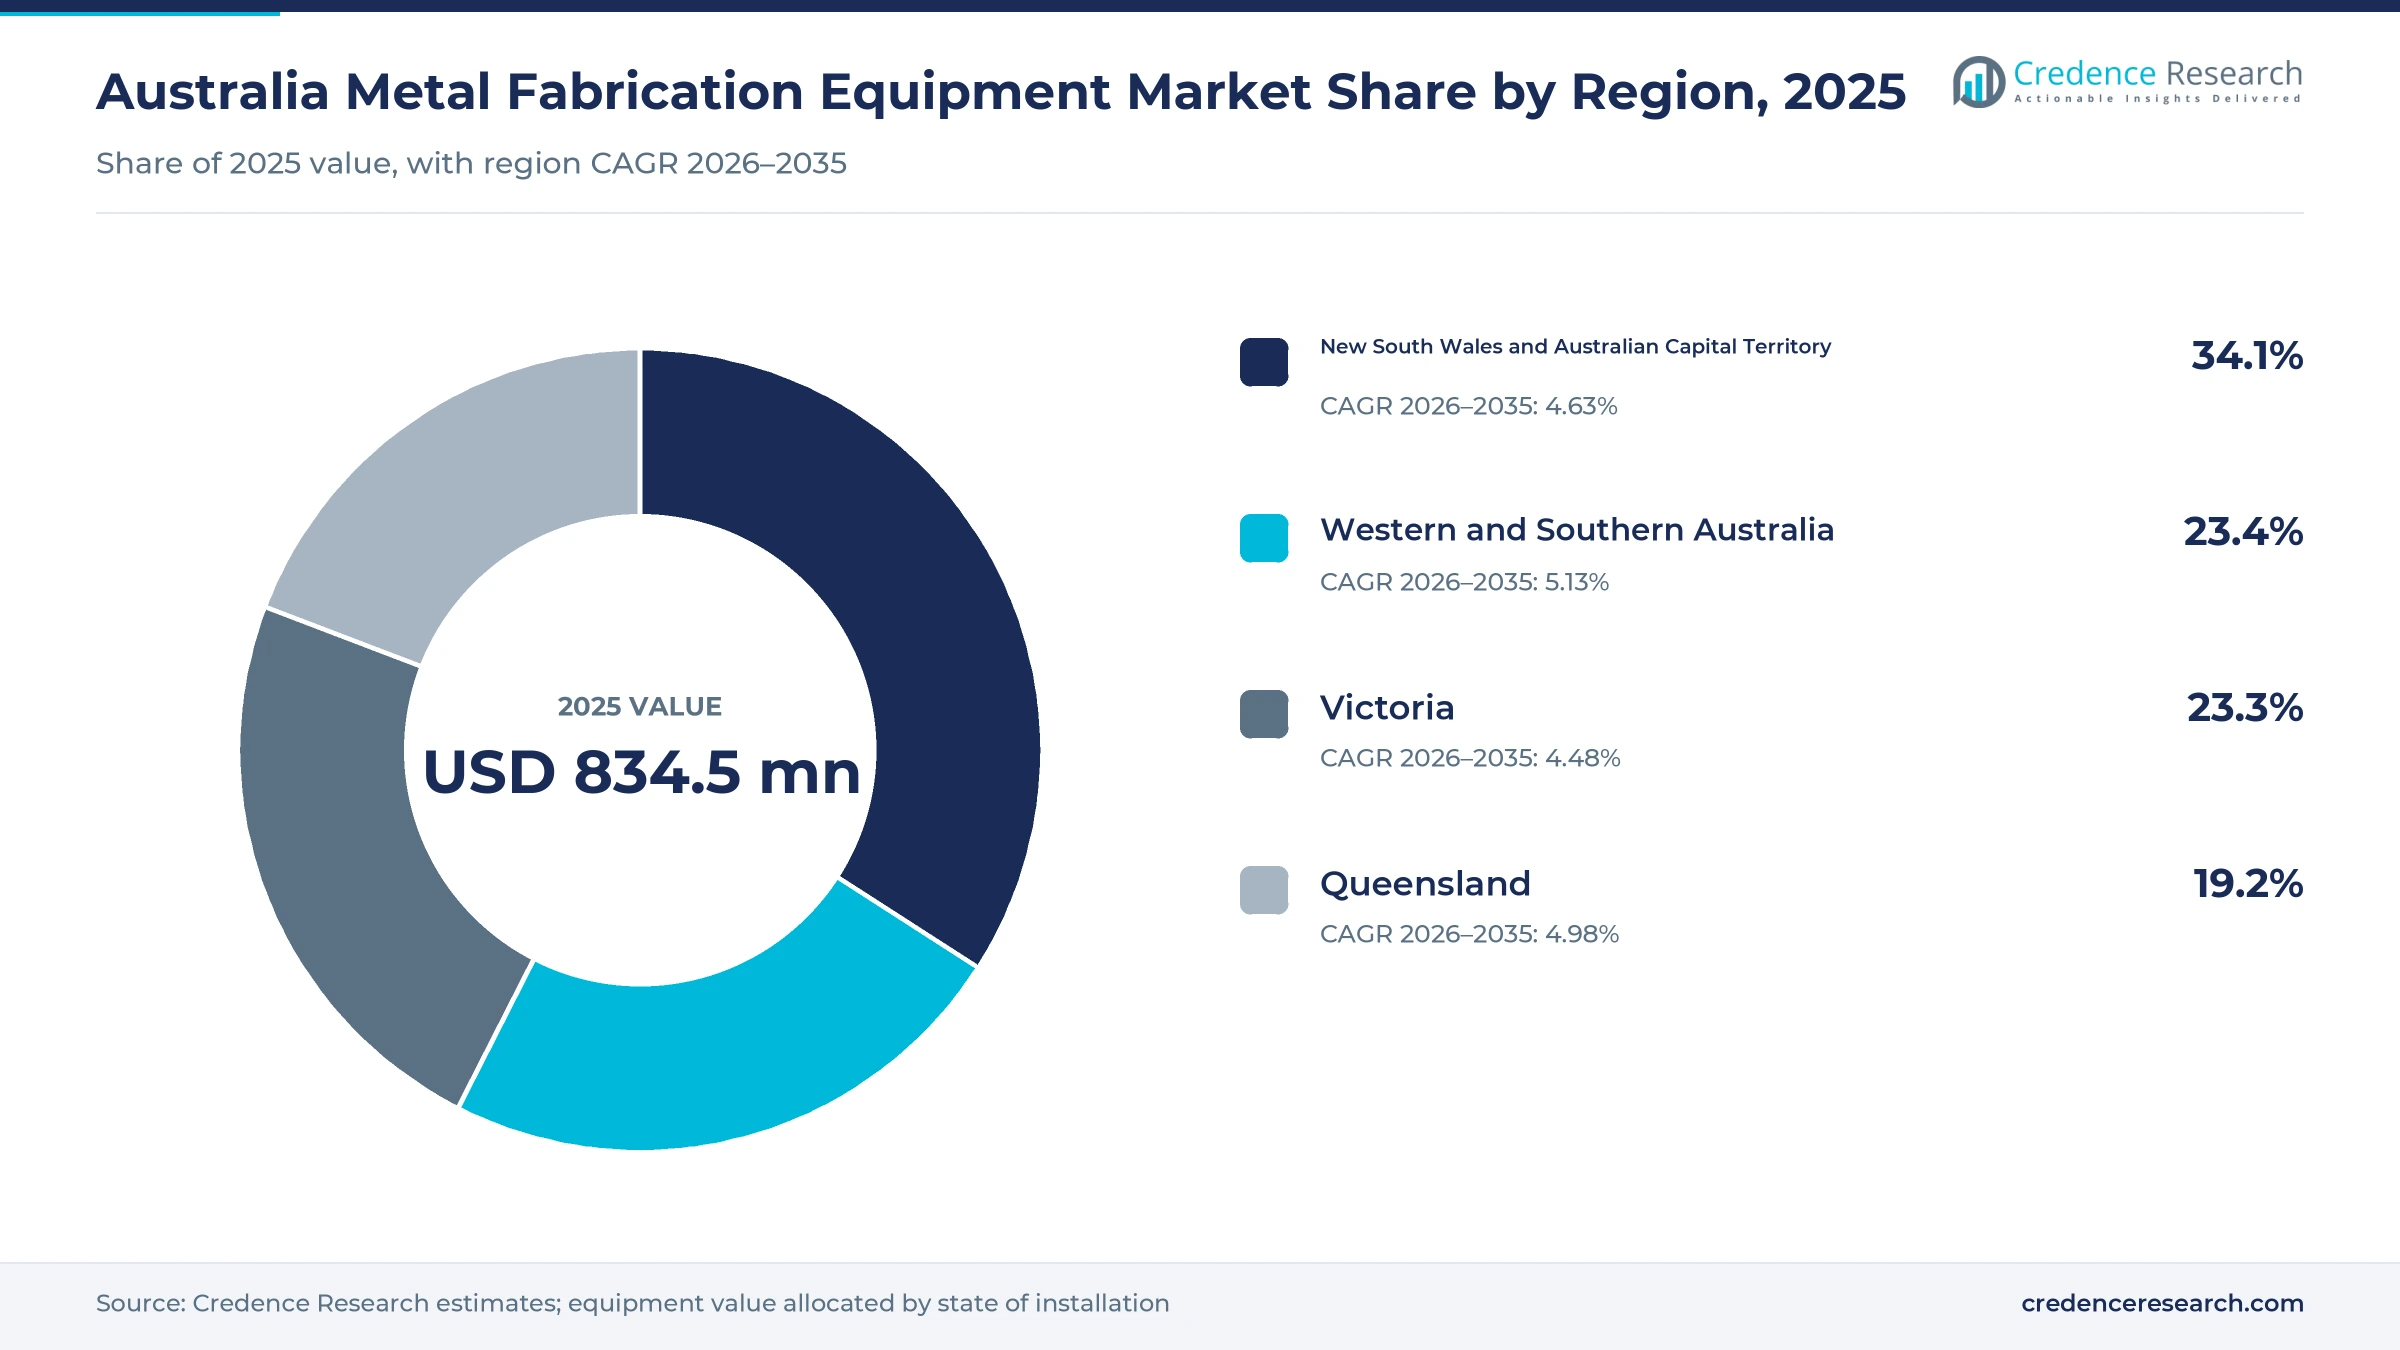
The Australia metal fabrication equipment market was valued at USD 834.5 million in 2025 and is projected to increase from USD 893.0 million in 2026 to USD 1.36 billion by 2035, registering a CAGR of 4.78% during 2026–2035. Demand comes from structural steel fabricators, mining service workshops, shipbuilders, transport body builders and machinery makers that cut, machine, weld and form steel and aluminum. New South Wales and the Australian Capital Territory held the largest regional share, 34.1% in 2025, because Sydney carries the largest infrastructure pipeline and the densest base of job shops. Western and Southern Australia is the fastest-growing region at 5.13% a year, as naval shipyards at Henderson and Osborne add steel work. In turn, the $20,000 instant asset write-off became permanent from July 1, 2026, for small businesses, which supports purchases of smaller welders, saws and bending tools.
Which cutting, machining, welding and forming machines are counted?
The estimate measures the value of new machines sold to and installed by fabrication workshops in Australia. It covers laser, plasma, waterjet and shearing machines, CNC lathes and machining centers, welding power sources and robotic welding cells, and press brakes, rolls, punches and auxiliary handling systems sold with them.
The estimate excludes used machines, consumables such as wire, gas and abrasives, hand tools and fabrication services bought from contractors. The value chain runs from global machine builders and local makers through importers, distributors and system integrators to independent job shops, captive workshops inside mining, defense and machinery companies, and the universities and training colleges that buy equipment for teaching.
Australia Metal Fabrication Equipment Market Insights
- The Australia metal fabrication equipment market was valued at USD 834.5 million in 2025 and is projected to reach USD 1.36 billion by 2035, registering a CAGR of 4.78% during 2026–2035.
- New South Wales and the Australian Capital Territory held a 34.1% share of 2025 value, because Sydney carries the largest infrastructure workload.
- Cutting and shearing equipment led with a 34.0% share of 2025 value, because every fabricated part starts with a cut plate, sheet or section.
- The five-year public infrastructure pipeline reached $242 billion in the November 2025 capacity report, which keeps structural steel shops busy across the decade.
- The government committed $12 billion to the Henderson Defence Precinct in September 2025, which lifts demand for heavy cutting and welding systems in Western Australia.
Cutting systems lead while automated cells grow fastest
Why do cutting and shearing machines lead product demand?
Based on product type, the market is categorized into cutting and shearing equipment, machining equipment, welding and joining equipment, and forming and auxiliary systems. Cutting and Shearing Equipment led with a 34.0% share of 2025 value, because every fabricated part starts with a cut plate, sheet or section. Cutting and Shearing Equipment also grows fastest at 5.21% a year, as shops replace plasma tables with higher-power fiber lasers.
How do construction and defense work split end-use demand?
Based on end-use industry, the market is categorized into construction and infrastructure, mining and resources, defense and transport manufacturing, and machinery and process manufacturing. Construction and Infrastructure led with a 33.0% share of 2025 value, because public transport, energy and building projects need large volumes of structural steel. Defence and Transport Manufacturing grows fastest at 5.66% a year, as naval shipbuilding programs expand at Osborne and Henderson.
Why are integrated automated cells the fastest technology?
Based on technology, the market is categorized into conventional standalone equipment, CNC standalone equipment and integrated automated cells. CNC Standalone Equipment led with a 49.0% share of 2025 value, because most job shops buy single CNC machines that one operator can program and run. Integrated Automated Cells grow fastest at 6.43% a year, as labor shortages push fabricators toward automatic loading and robotic welding.
How do distributors and integrators reach fabrication shops?
Based on sales channel, the market is categorized into OEM direct sales, service-capable distributors and system integrator contracts. Service-Capable Distributors led with 44.0% of 2025 value, because most global machine builders sell through local partners that install, train and repair. System Integrator Contracts grow fastest at 5.58% a year, as buyers order complete cells with loading, software and safety guarding.
| Segment Group | Leading Sub-segment | Share, 2025 | Fastest-growing Sub-segment | CAGR, 2026–2035 |
|---|---|---|---|---|
| By Product Type | Cutting and Shearing Equipment | 34.0% | Cutting and Shearing Equipment | 5.21% |
| By End-Use Industry | Construction and Infrastructure | 33.0% | Defence and Transport Manufacturing | 5.66% |
| By Technology | CNC Standalone Equipment | 49.0% | Integrated Automated Cells | 6.43% |
| By Sales Channel | Service-Capable Distributors | 44.0% | System Integrator Contracts | 5.58% |
Request a Free Sample
Fill in your details and we'll send you a free sample report.
- Sample data tables & charts
- Research methodology
Labor shortages and steel demand lift machine investment
How do labor shortages push automation and line integration?
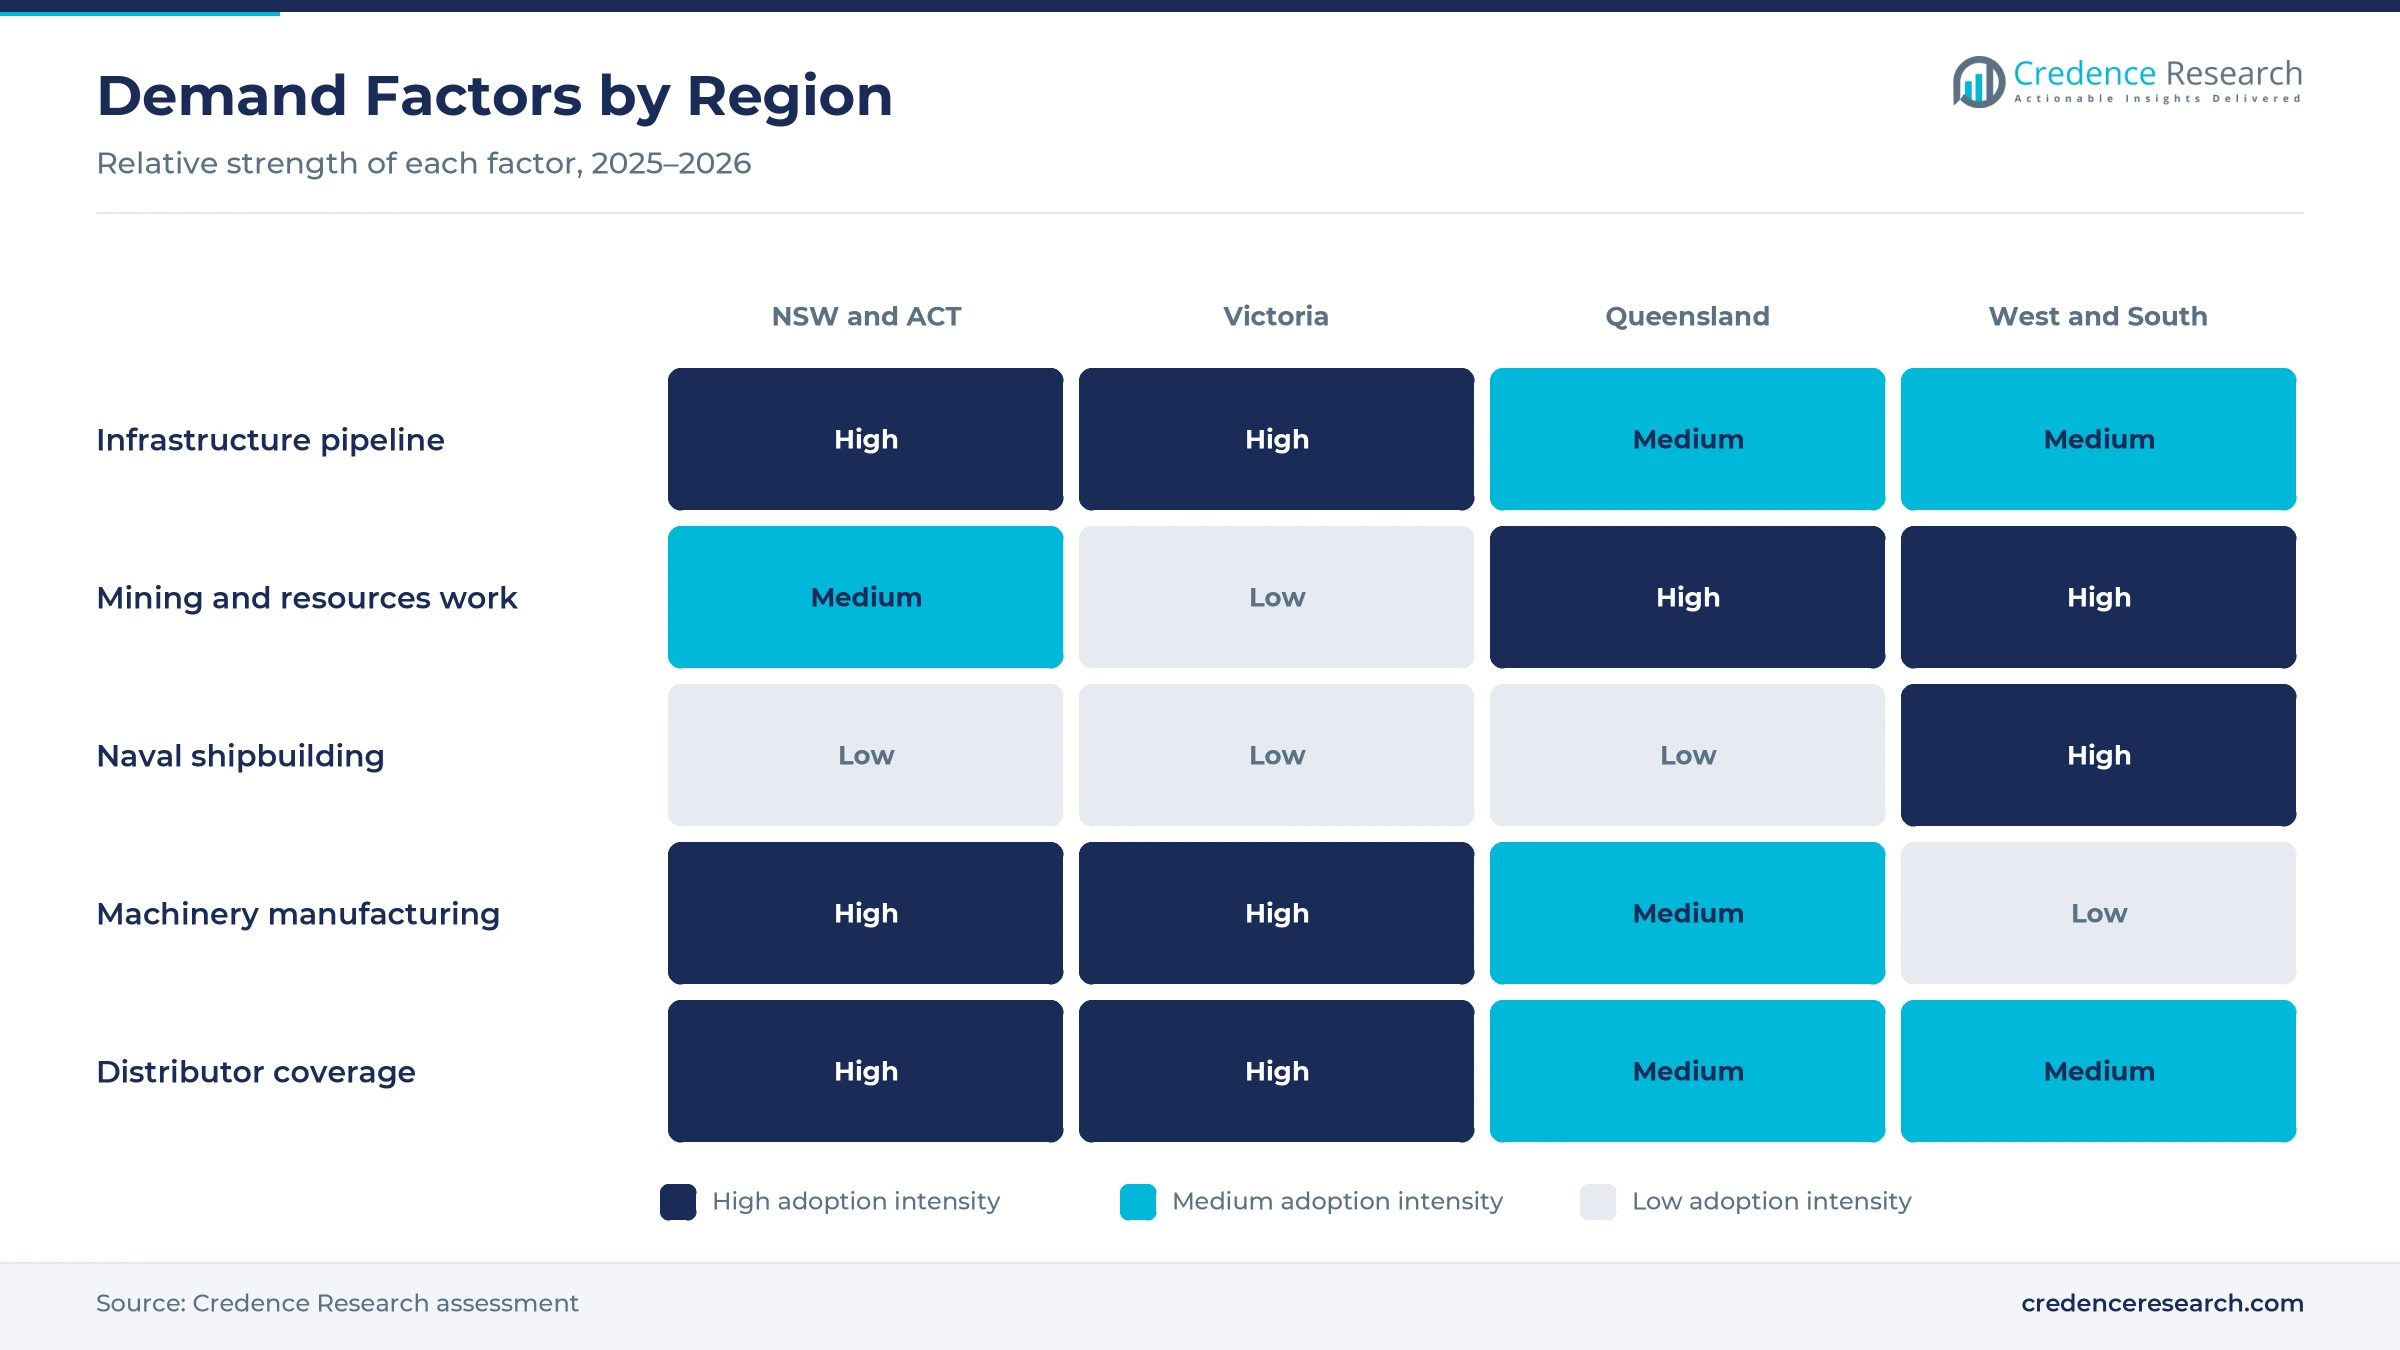
Labor shortages push automation and line integration, because fabricators cannot hire enough welders, fitters and machine operators to meet project demand. The Infrastructure Australia capacity report released on Nov. 13, 2025, estimated a shortage of 141,000 workers on public infrastructure works. It also projected that the gap will peak at more than 300,000 workers in mid-2027. Apollo Engineering in Tamworth reported that a 12-kilowatt fiber laser with automatic sheet loading cut its cutting times by 70%. As a result, integrated automated cells grow at 6.43% a year, the fastest technology rate, as shops add automatic loading, robotic welding and shared production software.
Why do higher-capability cutting systems lift value per machine?
Higher-capability cutting systems lift value per machine, because thicker plate, aluminum and tighter tolerances need more laser power and better motion control. The capacity report estimates that the five-year construction pipeline needs about 26.6 million metric tons of structural steel elements. However, national steel fabrication capacity is only about 1.4 million metric tons a year, which pushes local shops to raise throughput. Sheet Metal Solutions in New South Wales bought a TRUMPF fiber laser to handle thicker aluminum and a rising workload. In turn, cutting and shearing equipment holds a 34.0% share of 2025 value, as buyers move to fiber laser cutting machines.
How do industrial investment and replacement cycles support sales?
Industrial investment and replacement cycles support sales, because companies replace older manual machines when capital budgets rise. Total private new capital expenditure stood 10.7% higher in the June quarter 2026 than a year earlier, according to the Australian Bureau of Statistics. Mining equipment and machinery investment also rose 5.4% in that quarter, while businesses lifted expected capital spending for 2026-27 by 15.5%. The $20,000 instant asset write-off became permanent from July 1, 2026, for businesses with turnover below $10 million. As a result, service-capable distributors keep a 44.0% share of 2025 value, as small job shops buy welders, saws and press brakes.
Why does naval shipbuilding add heavy fabrication demand?
Naval shipbuilding adds heavy fabrication demand, because frigates and landing craft need large volumes of cut, formed and welded steel blocks. BAE Systems cut first steel for the first Hunter class frigate at Osborne on June 21, 2024, and six ships are now planned. By November 2025 the yard employed about 1,800 workers, and work had started on 41 of the 78 units in the first ship. The government also committed $12 billion to the Henderson Defence Precinct in September 2025, with about 10,000 direct jobs expected over two decades. In turn, defense and transport manufacturing grows at 5.66% a year, the fastest end-use rate.
Shipbuilding and lights-out cutting reshape buying
How is the shift to lights-out cutting changing shop layouts?
The shift to lights-out cutting is changing shop layouts, because fabricators link lasers to automatic storage towers and part sorting systems that run between shifts. Headland Technology in Rydalmere supplies TRUMPF laser cutting, punching, bending and laser welding machines, along with automated warehouse storage systems. Laser Machines in Hallam, Victoria and Alpha CNC also sell fiber laser cutters to job shops. Apollo Engineering in Tamworth, a team of 35 staff, runs 4 dual-spindle CNC lathes tended by collaborative robots beside its automated laser, and its machine arrived four weeks after the order. Interest in robotic laser cutting is rising as shops try to keep machines running with few staff. As a result, system integrator contracts grow at 5.58% a year, the fastest channel rate, as buyers order complete cells.
Why is the rise of local steel fabrication notable for buyers?
The rise of local steel fabrication is notable, because governments and builders want shorter lead times and less reliance on imported steel sections. Infrastructure Australia valued the five-year public pipeline at $242 billion in November 2025, up 14% from the prior outlook. Major public projects alone need about 3.6 million metric tons of structural steel elements over that period, which local shops cannot fully supply. Manufacturing value added was 5.3% of GDP in 2025, down from 5.4% in 2024, according to World Bank data, which shows a thin industrial base. In turn, construction and infrastructure keeps a 33.0% share of 2025 value, as contractors fund building construction activity with local steel.
Can training colleges and research buyers open a new path?
Training colleges and research buyers open a growth path, because the worker shortage forces governments to fund more welding and machining courses. Hare & Forbes Machineryhouse lists a dedicated school and TAFE equipment range beside its welding, CNC plasma and sheet metal machines. ANCA, the Melbourne grinding machine maker founded in 1974, announced in 2026 that it employs around 1,000 people and exports 99% of its products, which keeps advanced machine skills inside the country. The public infrastructure shortage of 141,000 workers also means colleges need modern CNC and robotic welding trainers. As a result, distributors that bundle training benches with service contracts can win more public research and training orders.
Is there room to grow in western mining and shipyard hubs?
Western mining and shipyard hubs have room to grow, because mining service shops and naval contractors need heavy cutting, rolling and welding capacity close to sites. Western Australia recorded the fastest population growth in the country at 2.1% in the year to March 2026. Early planning shows the Henderson precinct needs about $25 billion over the decade, which will draw steel work to Perth suppliers. Mining service shops also repair buckets, chutes and underground mining machinery that wear quickly. As a result, Western and Southern Australia already holds a 23.4% share of 2025 value, and local distributors that stock heavy plate machines near Perth and Adelaide can win a larger part of new orders.
Skills gaps, import reliance and cost pressure test buyers
How do skill gaps limit use of advanced machines?
Skill gaps limit use of advanced machines, because CNC lasers, robots and offline programming need trained operators and technicians. Many small shops cannot release staff for training while order books are full. As a result, some buyers delay automation or run new machines below capacity. Suppliers respond with remote support, simple touch-screen controls and training packages bundled into the purchase price. Some also run open days at their showrooms, where operators can try new machines before buying.
Why does reliance on imported machines raise risk?
Reliance on imported machines raises risk, because most lasers, press brakes and welding robots are built overseas and shipped to Australia. Currency swings change landed prices quickly, and freight delays can push back installation dates by months. In turn, buyers face higher costs and longer waits for spare parts. Distributors respond by holding local stock, spare parts and demonstration machines in the main capital cities. Several also keep field technicians in regional mining centers so that breakdowns are fixed quickly.
How do high capital costs slow small job shops?
High capital costs slow small job shops, because a fiber laser cell with automatic loading costs far more than a plasma table or manual guillotine. Many small fabricators carry thin margins and depend on a few construction clients. As a result, owners stretch older machines and buy only when work is secured. Suppliers respond with leasing, rental and staged upgrades that add automation over several years. The permanent instant asset write-off helps with smaller tools, but larger cells still need outside finance.
Why do uneven project pipelines create demand swings?
Uneven project pipelines create demand swings, because large infrastructure, mining and defense contracts start and stop at different times. Business equipment investment can fall sharply in one quarter even when annual spending is rising. In turn, distributors and job shops find it hard to plan staffing and stock. Many respond by spreading work across construction, mining, agriculture and transport clients to reduce exposure to a single sector. Others build order books through multi-year supply contracts with large builders and shipyards.
Sydney leads as western and southern shipyards grow fastest
| Region | Value, 2025 (USD million) | Share, 2025 | CAGR, 2026–2035 |
|---|---|---|---|
| New South Wales and Australian Capital Territory | 284.6 | 34.1% | 4.63% |
| Western and Southern Australia | 195.3 | 23.4% | 5.13% |
| Victoria | 194.4 | 23.3% | 4.48% |
| Queensland | 160.2 | 19.2% | 4.98% |
Why does Sydney and canberra work give the largest share?
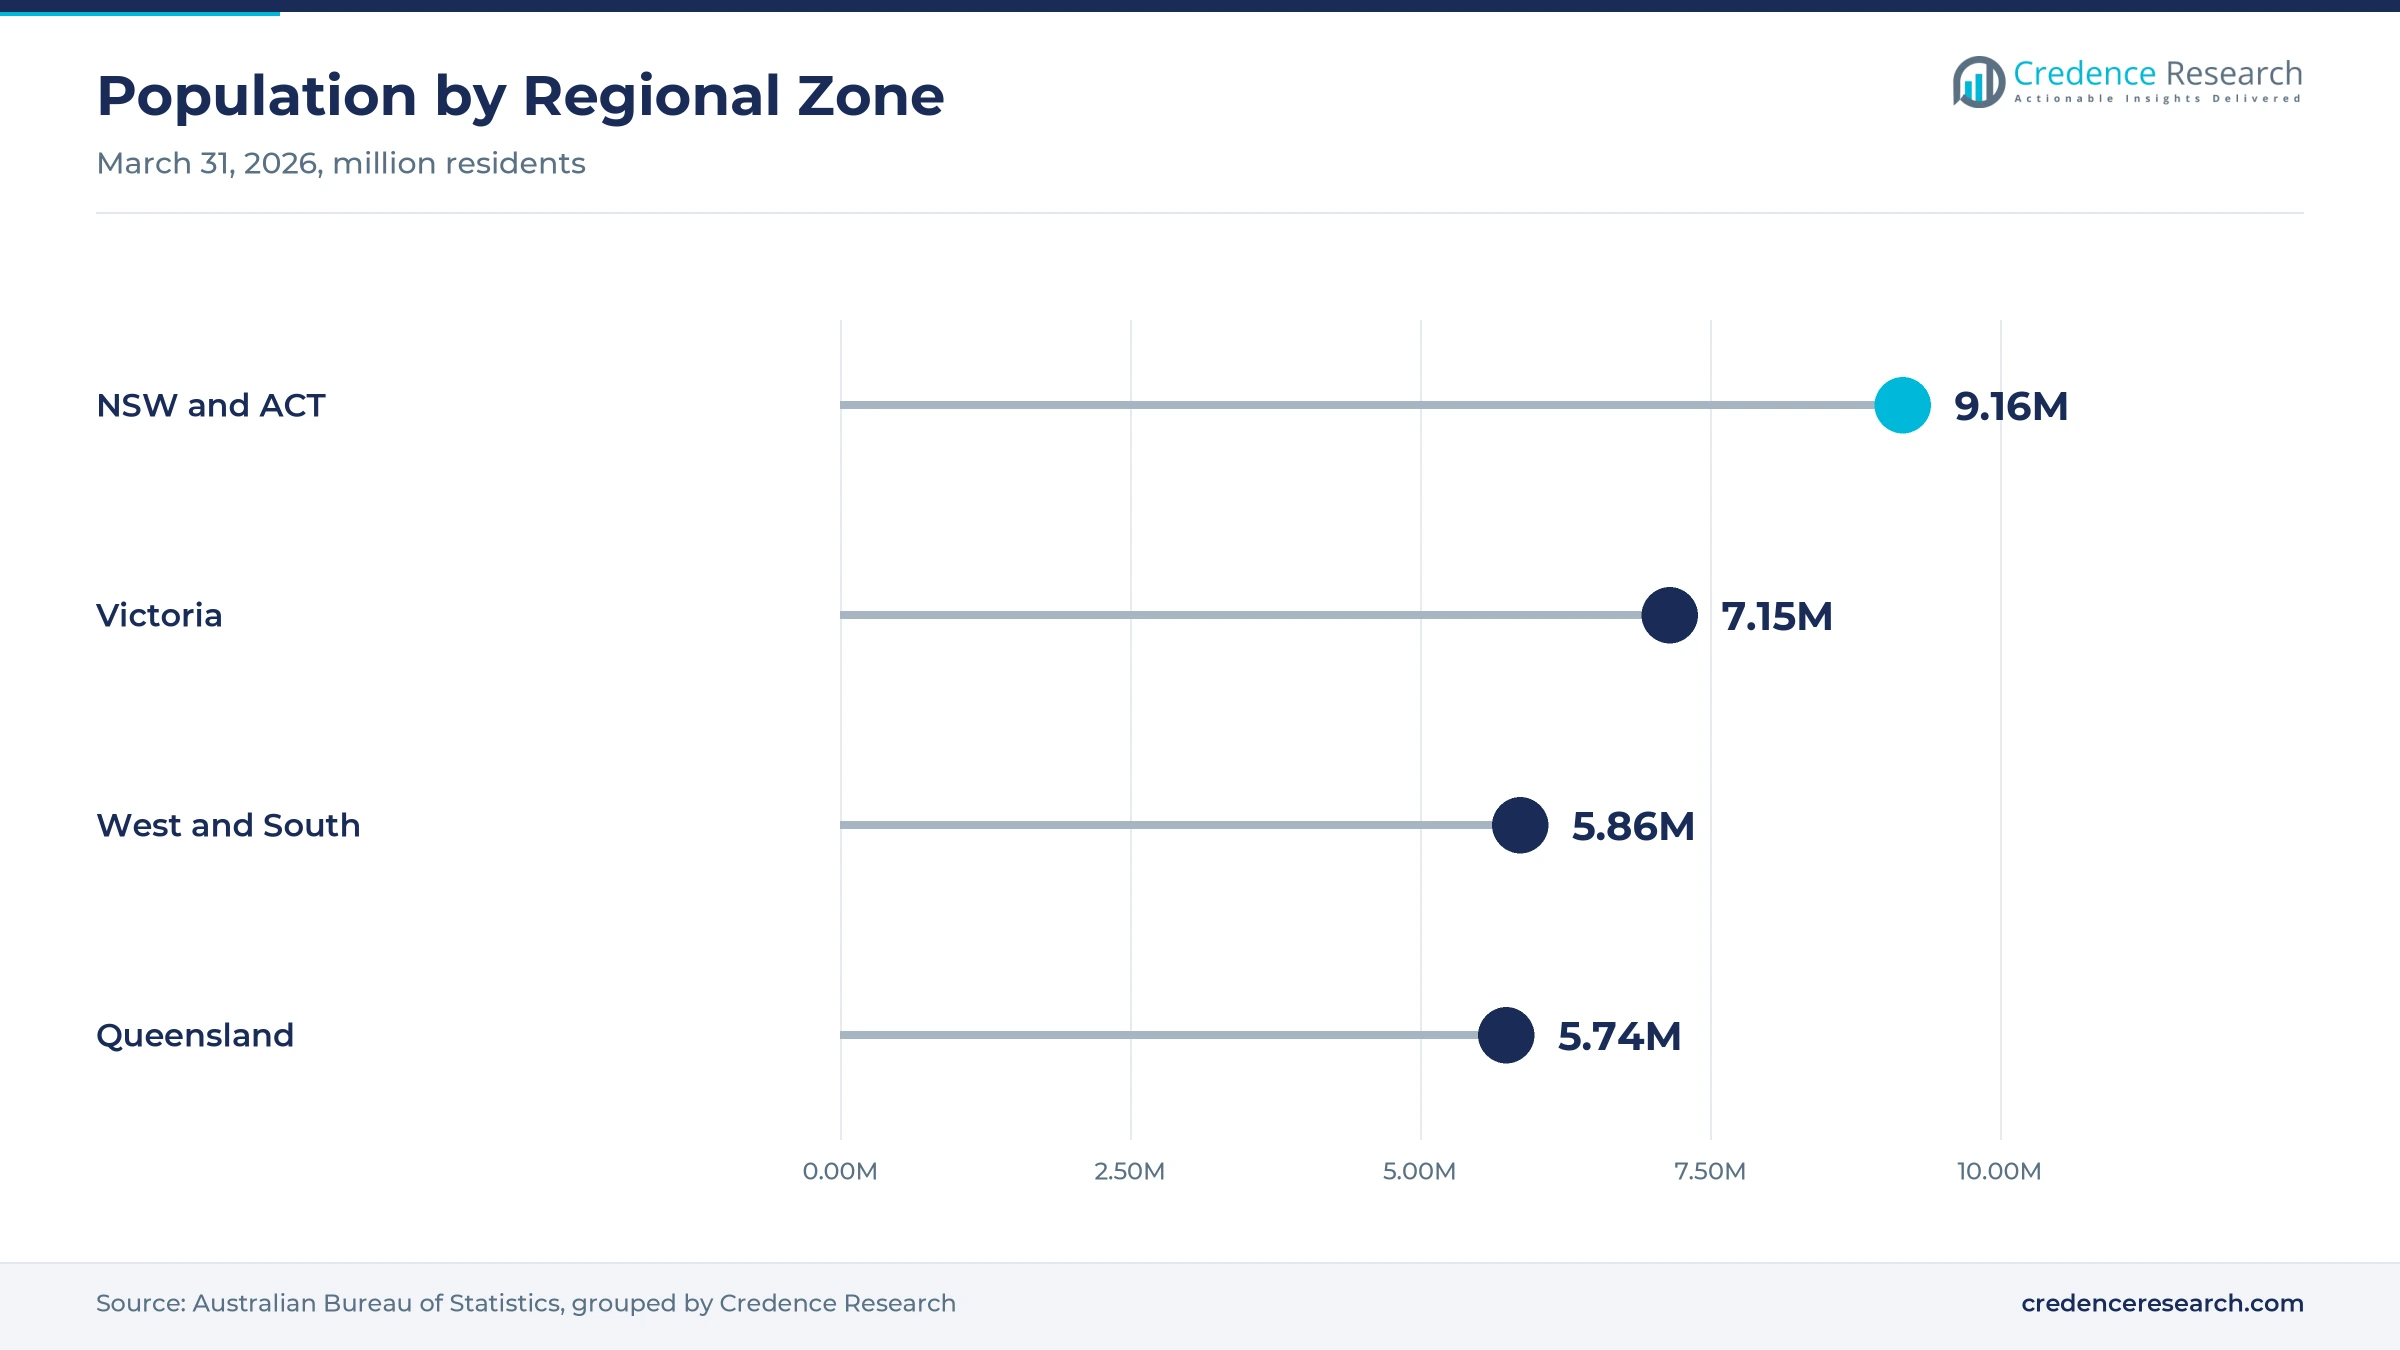
New South Wales and the Australian Capital Territory held a 34.1% share of 2025 value and grow at 4.63% a year, because Sydney carries large transport, energy and building projects. The two jurisdictions had about 9.16 million residents at March 31, 2026. However, growth is slower than in the west, because the New South Wales population rose only 1.1% over the year.
How does Victoria support machining and precision work?
Victoria held a 23.3% share of 2025 value and grows at 4.48% a year, because Melbourne hosts precision machining, transport body builders and machine makers such as ANCA. The state population rose 1.6% in the year to March 2026, reaching about 7.15 million residents. This growth supports building and transport projects that need cut and welded steel, which keeps local job shops investing in CNC equipment.
Why does Queensland add mining and construction demand?
Queensland held a 19.2% share of 2025 value and grows at 4.98% a year, because coal, metals and gas operations rely on local repair and fabrication shops. The state added about 90,100 residents in the year to March 2026, reaching about 5.74 million people. Building work for fast-growing cities also adds structural steel demand around Brisbane, the Gold Coast and regional mining towns.
Why are western and southern shipyards the fastest-growing zone?
Western and Southern Australia held a 23.4% share of 2025 value and grows fastest at 5.13% a year, because frigate and landing craft programs are concentrated at Osborne and Henderson. The zone covers Western Australia, South Australia, Tasmania and the Northern Territory, which together had about 5.86 million residents in March 2026. Mining service work in Perth and regional centers adds steady repair demand.
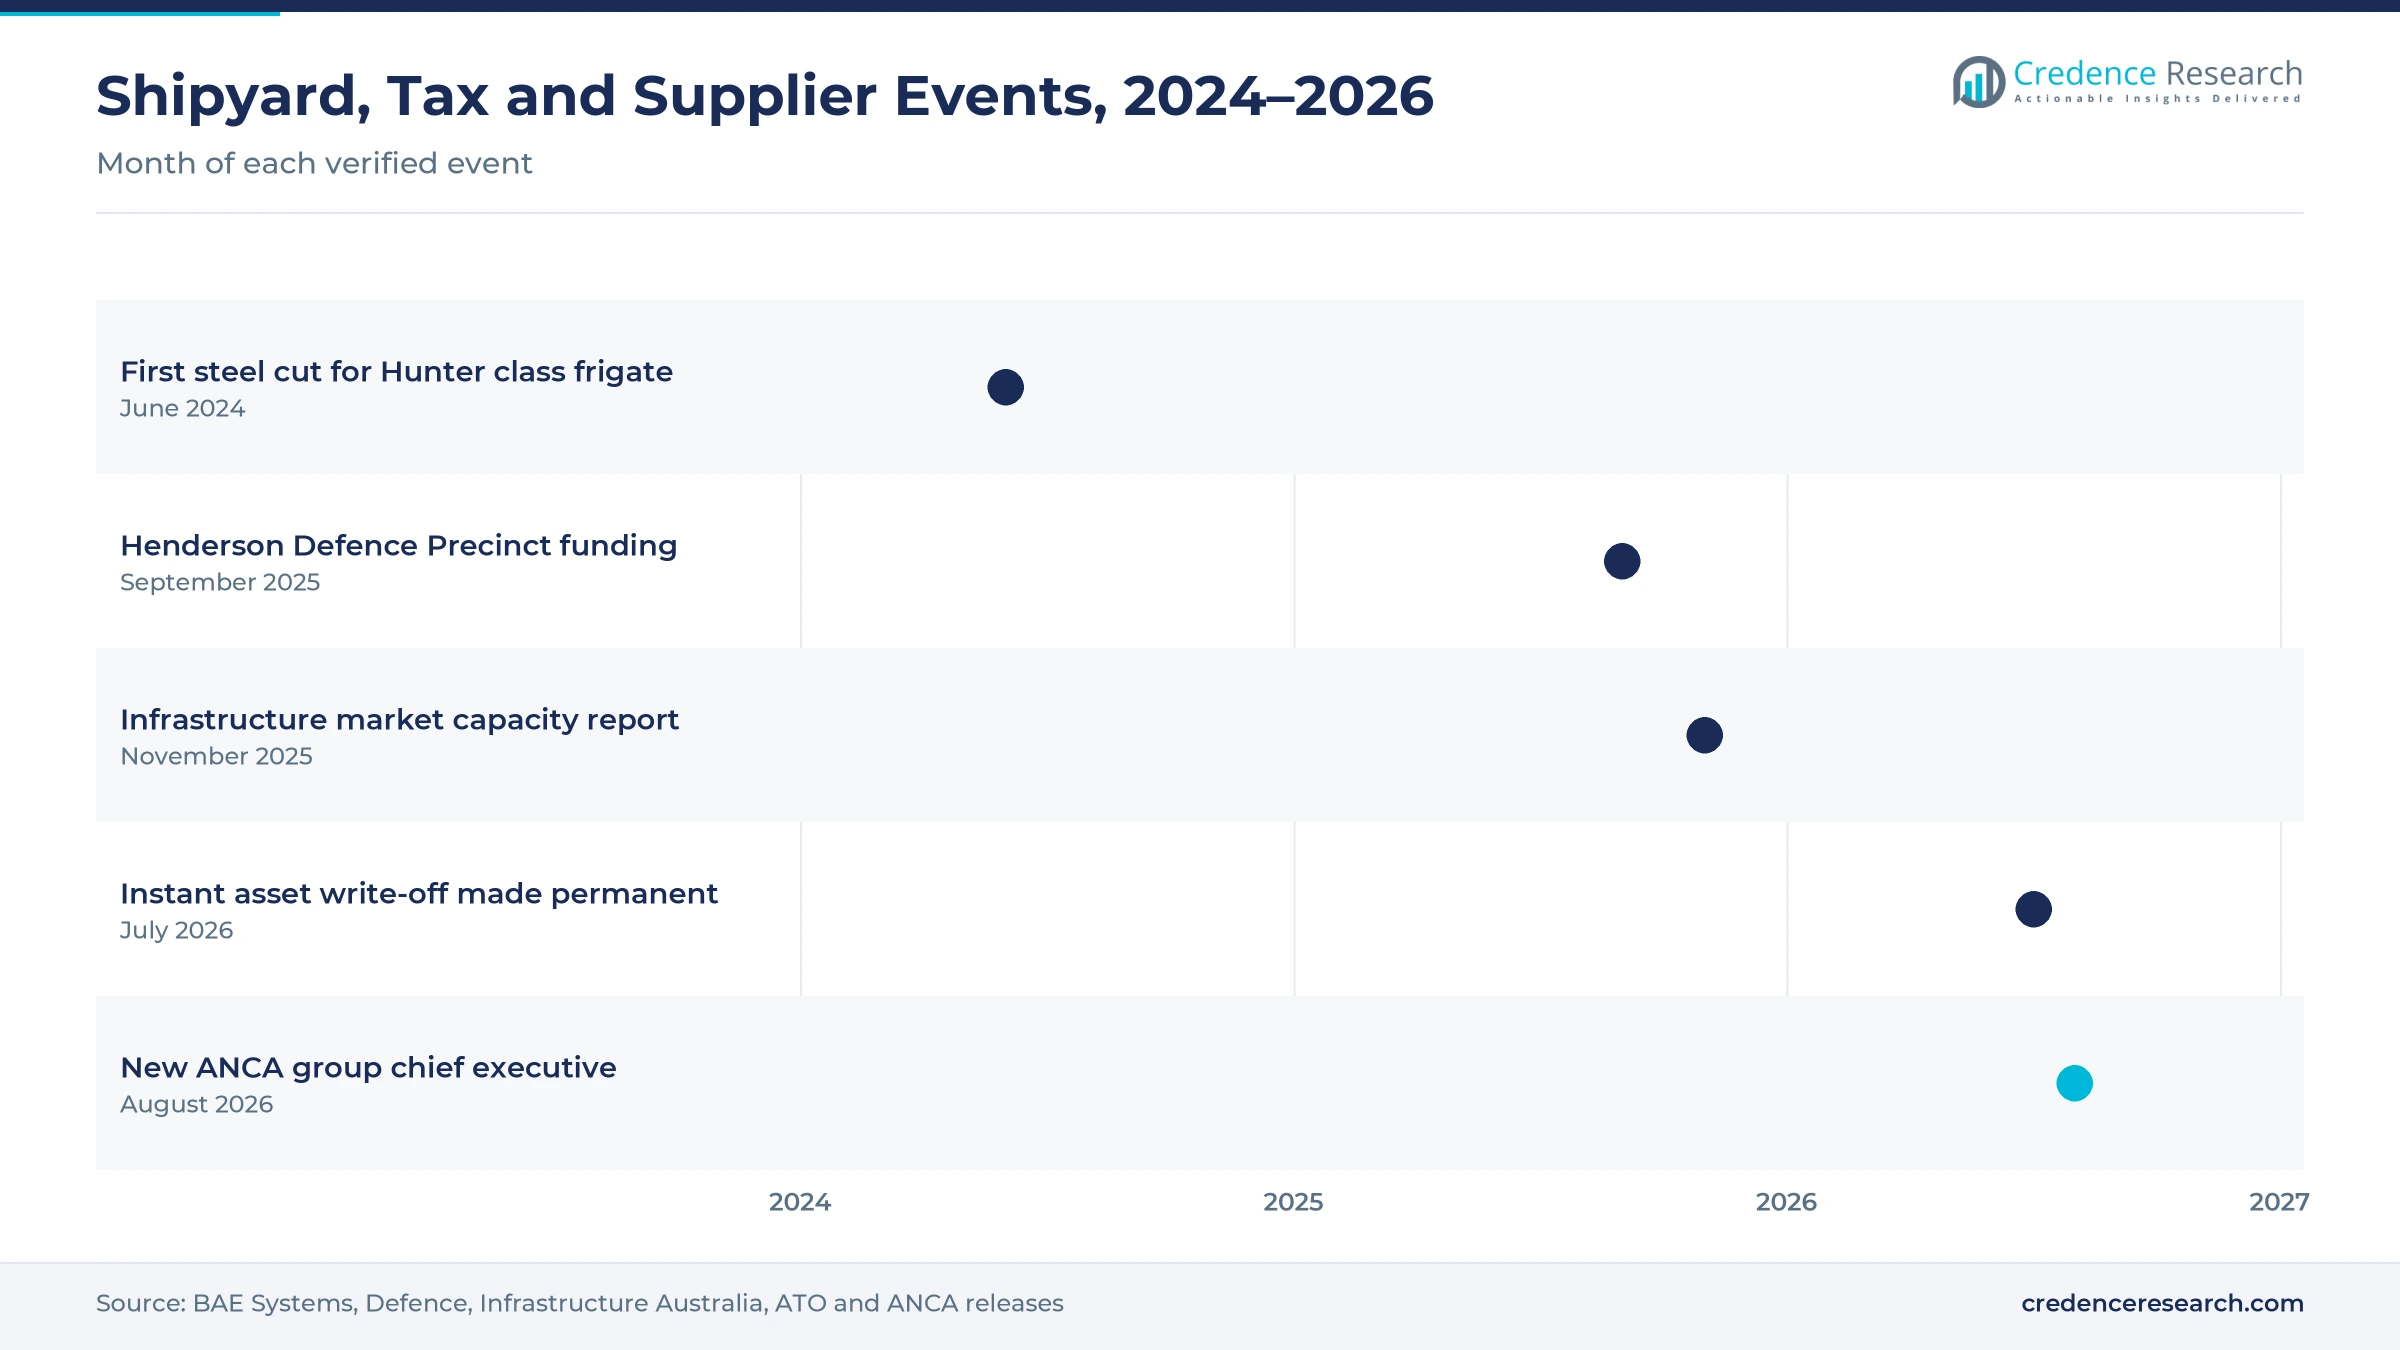
Shipyard, tax and supplier milestones from 2024 to 2026
| Development | Status and market relevance |
|---|---|
| In June 2024, BAE Systems cut first steel for the first Hunter class frigate at Osborne. | Started a six-ship program that needs heavy cutting and welding |
| In September 2025, the government committed $12 billion to the Henderson Defence Precinct. | Supports landing craft and frigate building in Western Australia |
| In November 2025, Infrastructure Australia released its market capacity report. | Showed a $242 billion pipeline and a 141,000 worker shortage |
| In July 2026, the $20,000 instant asset write-off became permanent for small businesses. | Supports purchases of smaller welders, saws and forming tools |
| In August 2026, ANCA announced Edmund Boland as its new group chief executive. | Leadership change at the Melbourne grinding machine maker |
Fiber lasers, robots and CNC controls shape shop floors
- Fiber laser cutting uses high-power solid-state laser sources, which cut thick plate and aluminum faster and cleaner than plasma tables.
- Automatic loading and storage moves raw sheets and finished parts between towers and machines, which lets lasers run between shifts with few staff.
- Robotic and collaborative welding uses programmed arms that repeat weld paths, which lifts output where skilled welders are scarce.
- CNC controls and offline programming let engineers plan cutting, bending and machining on a computer, which cuts setup time on the shop floor.
Need a Custom Version of This Report?
Tailor the scope, geography, or segments to your exact requirements.
- Custom geography or segment scope
- Direct access to our analyst team
Global machine builders compete through local distributors
Competition is led by global machine builders that sell through Australian subsidiaries and distributors, alongside local makers and machinery retailers. TRUMPF reaches buyers through Headland Technology in Rydalmere, which supplies laser, punching, bending and laser welding systems. Amada has supported Australian sheet metal shops since 1998, while Bystronic supplies fiber lasers with automatic loading to regional fabricators. Lincoln Electric runs a welding technology center in Padstow, opened in 2016, with robot cells and plasma tables, and ESAB sells welding wires through the Cigweld range. ANCA builds grinding machines in Melbourne for export and local toolmakers. Hare & Forbes Machineryhouse, Power Machinery, Laser Machines and Alpha CNC compete for job shops on price, stock and service. Rivals compete on laser power, automation, software, training, spare parts and service response times across every state.
Companies profiled and their roles in this market
| Company | Type | Role in the market |
|---|---|---|
| TRUMPF (via Headland Technology) | Machine builder and distributor | Laser cutting, punching, bending and laser welding systems from Rydalmere |
| Amada Oceania | Machine builder | Sheet metal machinery for Australian shops since 1998 |
| Bystronic Australia | Machine builder | Fiber lasers with automatic loading for regional fabricators |
| Lincoln Electric | Welding equipment maker | Padstow technology center with robot cells and plasma tables |
| ANCA | Local machine builder | Melbourne maker of CNC grinding machines, around 1,000 staff |
| Hare & Forbes Machineryhouse | Machinery retailer | Welding, CNC plasma, sheet metal and school and TAFE equipment |
Credence Research view on Australian fabrication machinery
Credence Research's view is that Australian demand for fabrication machinery will grow steadily because infrastructure, mining and naval shipbuilding all need more cut and welded steel than local shops can supply today. Cutting systems remain the core of the market, while automated cells and integrator contracts add faster growth as labor shortages persist. Western and southern shipyard hubs will gain share through the decade. Suppliers that pair high-power lasers and robots with local service, training and finance should win the most orders.
How the Australian fabrication machinery estimate was built
The report uses 2025 as the base year on a calendar basis, and market values come from the Credence Research model. That model combines infrastructure pipeline data, business investment statistics, population data, tax settings, defense program announcements, World Bank manufacturing data and supplier product information. Segment splits and regional growth rates are Credence Research estimates, while regional shares follow the client-defined split. Sources used are public reports, official statistics, trade press and company websites, and no interviews or surveys were used.
Infrastructure and defense work carry growth to 2035
Machine value is expected to reach USD 1.36 billion by 2035, a 4.78% CAGR during 2026–2035, as infrastructure, mining and defense programs keep fabrication shops busy. Growth should be firm through 2030 while the public pipeline and frigate builds peak. After that, replacement of older machines and wider automation will carry more growth. Higher interest rates or project delays would slow orders, while new shipyard contracts would lift them. Suppliers with strong service networks are expected to gain the most.
Frequently Asked Questions
How big is the Australia metal fabrication equipment market?
Which product type leads Australian fabrication machinery demand?
Which region leads the Australia metal fabrication equipment market?
How large is the public infrastructure pipeline?
How does naval shipbuilding affect fabrication machinery demand?
Which technology is growing fastest?
Who are the leading companies in Australian fabrication machinery?
What are the main challenges for buyers?
Table of Content
Chapter 1 Market Segmentation
- 1.1 Segmentation Framework
- 1.1.1 Product and Service Classification
- 1.1.2 Application and End-Use Classification
- 1.1.3 Technology and Solution Classification
- 1.1.4 Customer and Distribution Channel Classification
- 1.1.5 Geographic Segmentation
- 1.1.6 Market Segment Definitions and Boundaries
- 1.2 By Product Type
- 1.2.1 Cutting and Shearing Equipment
- 1.2.2 Machining Equipment
- 1.2.3 Welding and Joining Equipment
- 1.2.4 Forming and Auxiliary Systems
- 1.3 By End-Use Industry
- 1.3.1 Construction and Infrastructure
- 1.3.2 Mining and Resources
- 1.3.3 Defence and Transport Manufacturing
- 1.3.4 Machinery and Process Manufacturing
- 1.4 By Technology
- 1.4.1 Conventional Standalone Equipment
- 1.4.2 CNC Standalone Equipment
- 1.4.3 Integrated Automated Cells
- 1.5 By Sales Channel
- 1.5.1 OEM Direct Sales
- 1.5.2 Service-Capable Distributors
- 1.5.3 System Integrator Contracts
Chapter 2 Introduction
- 2.1 Report Objectives and Scope
- 2.2 Product Definition and Industry Terminology
- 2.3 Market Inclusions and Exclusions
- 2.4 Research Process
- 2.4.1 Primary Research and Expert Interviews
- 2.4.2 Secondary Research and Source Review
- 2.4.3 Top-Down and Bottom-Up Estimation
- 2.4.4 Data Triangulation and Verification
- 2.5 Market Size Measurement Basis
- 2.5.1 2025: USD 834.5 million → 2035: USD 1.36 billion
- 2.6 Historical and Forecast Reference Periods
- 2.6.1 Historical Period: 2018-2025
- 2.6.2 Base Year: 2025
- 2.6.3 Forecast Period: 2025-2035
- 2.7 Research Assumptions and Limitations
Chapter 3 Executive Summary
- 3.1 Market Snapshot and Key Findings
- 3.2 Base-Year Market Size, 2025
- 3.3 Forecast Market Size, 2035
- 3.4 Revenue and Volume Growth Outlook
- 3.5 Key Demand and Supply Indicators
- 3.6 Leading Market Segments
- 3.7 Fastest-Growing Market Opportunities
- 3.8 Regional Performance Highlights
- 3.9 Technology and Industry Transformation
- 3.10 Competitive Landscape Summary
- 3.11 Analyst View and Strategic Implications
Chapter 4 Australia Metal Fabrication Equipment Market Trends and Developments
- 4.1 Historical Industry Development, 2018-2025
- 4.2 Recent Market Trends and Developments
- 4.3 Demand and Customer Behavior Trends
- 4.4 Technology and Product Innovation
- 4.5 Artificial Intelligence, Automation and Digitalization
- 4.6 Local Manufacturing and Supply Chain Realignment
- 4.7 Industry Partnerships, Mergers and Acquisitions
- 4.8 Sustainability and Circular Economy Developments
- 4.9 Government and Private Sector Investment Trends
- 4.10 Emerging Business Models and Commercialization
- 4.11 Industry Developments and Announcements
Chapter 5 Australia Metal Fabrication Equipment Market Production, Supply and Demand Analysis
- 5.1 Demand Trend and Consumption Analysis, 2018-2025
- 5.2 Demand Forecast, 2025-2035
- 5.3 Production and Output Trend, 2018-2025
- 5.4 Production and Output Forecast, 2025-2035
- 5.5 Installed Capacity and Capacity Utilization
- 5.6 Company-Wise Production Plants and Statistics
- 5.6.1 Installed Production Capacity
- 5.6.2 Actual Production
- 5.6.3 Planned Capacity and Expansion Targets
- 5.7 Supply Chain Structure and Procurement Trends
- 5.8 Supply-Demand Gap and Bottlenecks
- 5.9 Import Dependence and Sourcing Structure
- 5.10 Contract Manufacturing and Outsourcing
- 5.11 Regional Supply and Demand Concentration
Chapter 6 Australia Metal Fabrication Equipment Market Pricing Analysis
- 6.1 Pricing Structure and Measurement
- 6.2 Historical Pricing Trends, 2018-2025
- 6.3 Pricing Outlook, 2025-2035
- 6.4 Average Selling Price and Unit Economics
- 6.5 Pricing by Product and Market Segment
- 6.6 Geographic Pricing Differences
- 6.7 Key Input, Energy, Labor and Logistics Costs
- 6.8 Contract Pricing and Purchasing Models
- 6.9 Pricing Sensitivity and Competitive Positioning
- 6.10 Price, Margin and Profitability Implications
Chapter 7 Australia Metal Fabrication Equipment Market Dynamics
- 7.1 Market Growth Drivers
- 7.1.1 Demand-Side Drivers
- 7.1.2 Technology and Innovation Drivers
- 7.1.3 Infrastructure and Investment Drivers
- 7.1.4 Regulatory and Policy Drivers
- 7.2 Market Restraints
- 7.2.1 Cost and Affordability Constraints
- 7.2.2 Technology and Adoption Barriers
- 7.2.3 Supply Chain and Operational Constraints
- 7.3 Market Challenges
- 7.3.1 Competitive Pressure and Margin Erosion
- 7.3.2 Skills, Infrastructure and Implementation Gaps
- 7.4 Emerging Market Opportunities
- 7.5 Market Dynamics Impact and Time-Horizon Assessment
Chapter 8 Australia Metal Fabrication Equipment Value Chain Analysis
- 8.1 Industry Value Chain Overview
- 8.2 Upstream Suppliers and Critical Inputs
- 8.3 Technology and Component Providers
- 8.4 Manufacturing or Service Delivery
- 8.5 Distribution, Channel Partners and Integrators
- 8.6 Downstream Applications and End Users
- 8.7 Value Addition and Profit Pools
- 8.8 Vertical Integration and Outsourcing
- 8.9 Supplier Concentration and Risk
- 8.10 Supply Chain Localization and Resilience
Chapter 9 Australia Metal Fabrication Equipment Market Regulations and Policies
- 9.1 Relevant Laws, Standards and Compliance Frameworks
- 9.2 Product, Service, Safety and Quality Requirements
- 9.3 Government Policies, Incentives and Subsidies
- 9.4 Imports, Exports and Trade Barriers
- 9.5 Public Procurement and Local Content Requirements
- 9.6 Environmental and Sustainability Compliance
- 9.7 Upcoming Policy Changes and Market Implications
Chapter 10 Australia Metal Fabrication Equipment Market Hotspots and Opportunities
- 10.1 Market Opportunity Mapping and Growth Hotspots
- 10.2 High-Growth Applications and Customer Groups
- 10.3 Underserved Markets and White-Space Opportunities
- 10.4 Emerging Technology and Product Opportunities
- 10.5 New Capacity and Investment Hotspots
- 10.6 Market Entry and Expansion Opportunities
- 10.7 Distribution and Partnership Opportunities
- 10.8 Near-Term and Long-Term Commercial Potential
- 10.9 Opportunity Attractiveness and Execution Risks
Chapter 11 Australia Metal Fabrication Equipment Market Outlook, 2025-2035
- 11.1 Market Size and Analysis
- 11.1.1 Revenue (Market Measurement: 2025: USD 834.5 million → 2035: USD 1.36 billion)
- 11.1.2 Market Volume and Quantity Sold
- 11.1.3 Historical Market Size, 2018-2025
- 11.1.4 Base-Year Market Size, 2025
- 11.2 Market Forecast, 2025-2035
- 11.2.1 Revenue Forecast to 2035
- 11.2.2 Volume Forecast to 2035
- 11.2.3 CAGR and Year-on-Year Growth
- 11.2.4 Incremental Revenue Opportunity
- 11.3 Forecast Assumptions and Scenario Analysis
- 11.3.1 Base-Case Forecast
- 11.3.2 Optimistic and Conservative Scenarios
- 11.3.3 Technology, Pricing and Policy Sensitivities
- 11.4 Market Attractiveness and Growth Outlook
Chapter 12 Australia Metal Fabrication Equipment Market Segmentation and Outlook
- 12.1 Segmentation Summary and Market Shares, 2025
- 12.2 Largest and Fastest-Growing Segments
- 12.3 By Product Type - Market Size and Forecast, 2025-2035
- 12.3.1 Segment Definition and Scope
- 12.3.2 Historical Market Size, 2018-2025
- 12.3.3 Revenue Forecast, 2025-2035
- 12.3.4 Volume Forecast, 2025-2035
- 12.3.5 Base-Year Market Share, 2025
- 12.3.6 Segment CAGR and Growth Drivers
- 12.3.7 Subsegment Market Size and Forecast
- 12.3.7.1 Cutting and Shearing Equipment
- 12.3.7.2 Machining Equipment
- 12.3.7.3 Welding and Joining Equipment
- 12.3.7.4 Forming and Auxiliary Systems
- 12.3.8 Subsegment Pricing and Adoption Trends
- 12.3.9 Leading Suppliers and Competition
- 12.3.10 Regional Demand and Opportunities
- 12.4 By End-Use Industry - Market Size and Forecast, 2025-2035
- 12.4.1 Segment Definition and Scope
- 12.4.2 Historical Market Size, 2018-2025
- 12.4.3 Revenue Forecast, 2025-2035
- 12.4.4 Volume Forecast, 2025-2035
- 12.4.5 Base-Year Market Share, 2025
- 12.4.6 Segment CAGR and Growth Drivers
- 12.4.7 Subsegment Market Size and Forecast
- 12.4.7.1 Construction and Infrastructure
- 12.4.7.2 Mining and Resources
- 12.4.7.3 Defence and Transport Manufacturing
- 12.4.7.4 Machinery and Process Manufacturing
- 12.4.8 Subsegment Pricing and Adoption Trends
- 12.4.9 Leading Suppliers and Competition
- 12.4.10 Regional Demand and Opportunities
- 12.5 By Technology - Market Size and Forecast, 2025-2035
- 12.5.1 Segment Definition and Scope
- 12.5.2 Historical Market Size, 2018-2025
- 12.5.3 Revenue Forecast, 2025-2035
- 12.5.4 Volume Forecast, 2025-2035
- 12.5.5 Base-Year Market Share, 2025
- 12.5.6 Segment CAGR and Growth Drivers
- 12.5.7 Subsegment Market Size and Forecast
- 12.5.7.1 Conventional Standalone Equipment
- 12.5.7.2 CNC Standalone Equipment
- 12.5.7.3 Integrated Automated Cells
- 12.5.8 Subsegment Pricing and Adoption Trends
- 12.5.9 Leading Suppliers and Competition
- 12.5.10 Regional Demand and Opportunities
- 12.6 By Sales Channel - Market Size and Forecast, 2025-2035
- 12.6.1 Segment Definition and Scope
- 12.6.2 Historical Market Size, 2018-2025
- 12.6.3 Revenue Forecast, 2025-2035
- 12.6.4 Volume Forecast, 2025-2035
- 12.6.5 Base-Year Market Share, 2025
- 12.6.6 Segment CAGR and Growth Drivers
- 12.6.7 Subsegment Market Size and Forecast
- 12.6.7.1 OEM Direct Sales
- 12.6.7.2 Service-Capable Distributors
- 12.6.7.3 System Integrator Contracts
- 12.6.8 Subsegment Pricing and Adoption Trends
- 12.6.9 Leading Suppliers and Competition
- 12.6.10 Regional Demand and Opportunities
- 12.7 Segment Growth Comparison
- 12.8 Segment Attractiveness and Priority Matrix
Chapter 13 Australia Metal Fabrication Equipment End-Use and Application Market Outlook
- 13.1 End-Use Industry and Customer Demand Structure
- 13.2 Leading Applications and Customer Groups
- 13.3 End-Use Market Size, Share and Forecast
- 13.4 Major End-Use Industry Deep Dives
- 13.4.1 Customer Requirements and Use Cases
- 13.4.2 Demand and Replacement Cycles
- 13.4.3 Technical and Regulatory Considerations
- 13.4.4 Purchasing and Procurement Models
- 13.4.5 Leading Vendors and Distribution Channels
- 13.4.6 Forecast and Commercial Opportunities
- 13.5 Emerging Applications and Cross-Segment Demand
- 13.6 End-Use Industry Investment Priorities
Chapter 14 Australia Metal Fabrication Equipment Geographic Market Outlook, 2025-2035
- 14.1 Domestic Market Distribution and Demand Clusters
- 14.2 State- or Province-Wise Market Size and Forecast, 2025-2035
- 14.3 City and Metropolitan Market Outlook
- 14.4 Industrial, Manufacturing and Commercial Clusters
- 14.5 Geographic Concentration of Key End Users
- 14.6 Local Pricing and Purchasing Differences
- 14.7 Domestic Production Facilities and Capacity Map
- 14.8 Local Infrastructure and Project Pipeline
- 14.9 State-Level Policy and Incentive Differences
- 14.10 Subnational Investment Hotspots and Opportunities
- 14.11 Distribution and Logistics Networks
- 14.12 Domestic Competitive Footprint
Chapter 15 Australia Metal Fabrication Equipment Technology, Innovation and Sustainability Outlook
- 15.1 Technology Landscape and Maturity
- 15.2 Product, Process and Service Innovation
- 15.3 AI, Automation and Digital Tools in the Industry
- 15.4 Technology Adoption and Performance Benchmarking
- 15.5 Innovation Pipeline and R&D Investment
- 15.6 Patent and Intellectual Property Trends
- 15.7 Energy Efficiency and Resource Management
- 15.8 Sustainability, Recycling and Circularity
- 15.9 Technology Roadmap, 2025-2035
- 15.10 Risks of Obsolescence and Technology Substitution
Chapter 16 Australia Metal Fabrication Equipment Market Key Strategic Imperatives
- 16.1 Growth and Market Entry Priorities
- 16.2 High-Return Products and Segments
- 16.3 Pricing, Profitability and Cost Optimization
- 16.4 Technology Investment and Product Differentiation
- 16.5 Supply Chain Localization and Resilience
- 16.6 Distribution and Customer Acquisition
- 16.7 Partnership, Acquisition and Capacity Strategy
- 16.8 Regional Expansion Priorities
- 16.9 Short-, Medium- and Long-Term Actions
Chapter 17 Competition Outlook
- 17.1 Industry Competition Characteristics
- 17.2 Market Structure and Concentration
- 17.3 Market Share and Competitive Positioning, 2025
- 17.4 Company-Wise Revenue and Product Benchmarking
- 17.5 Production and Service Capacity Benchmarking
- 17.6 Technology, Pricing and Differentiation
- 17.7 Regional Footprint and Distribution Strength
- 17.8 Mergers, Acquisitions and Strategic Alliances
- 17.9 New Entrants and Competitive Threats
- 17.10 Porter's Five Forces and Industry Attractiveness
- 17.11 Competitive Outlook, 2025-2035
Chapter 18 Company Profiles
- 18.1 Company Coverage and Selection Criteria
- 18.2 TRUMPF
- 18.2.1 Business Description
- 18.2.2 Company Ownership and Geographic Presence
- 18.2.3 Product and Service Portfolio
- 18.2.4 Manufacturing and Operating Footprint
- 18.2.5 Production Capacity and Expansion Plans
- 18.2.6 Financial Performance and Investment
- 18.2.7 Market Share and Competitive Position
- 18.2.8 Technology and Innovation Capabilities
- 18.2.9 Strategic Alliances or Partnerships
- 18.2.10 Recent Developments
- 18.2.11 Growth Strategy and Outlook
- 18.3 Lincoln Electric
- 18.4 ESAB
- 18.5 Amada Oceania
- 18.6 Bystronic Australia
- 18.7 Hare & Forbes Machineryhouse
- 18.8 ANCA
- 18.9 Power Machinery Australia
- 18.10 Laser Machines Australia
- 18.11 Alpha CNC Australia
- 18.12 Other Relevant Market Participants
Note: Every listed company is profiled on the structure shown under the first company. The company list is preliminary and may change based on research findings, market developments, data availability and client requirements.
Chapter 19 Disclaimer
- 19.1 Research and Forecast Disclaimer
- 19.2 Data Source and Estimation Limitations
Note: The depth of individual sections depends on data availability for this market. Volume, capacity, trade and other unit-based metrics are included where applicable.

